 Han-Cheng Dan
 Chongyu Ling1
- 1School of Civil Engineering, Central South University, Changsha, Hunan, China
- 2Rail Data Research and Application Key Laboratory of Hunan Province, Changsha, Hunan, China
- 3Guangdong Hualu Transportation Technology Co., Ltd., Guangzhou, China
Currently, people pay more and more attention to road maintenance, and the traffic characteristics of vehicles play an important role in road quality evolution and maintenance decision, which commonly depends on the collection and analysis of traffic data. Nevertheless, the rationality of traffic data analysis and the scientificity of maintenance decision are deficient. This study carries out a research on the data fusion of multisource traffic data including toll data and video surveillance data. First, the information of vehicle type and axle load is acquired from the toll data, and the lane, speed and temporal information are obtained from the video surveillance data. A Bayesian method is used to train toll data and video surveillance data to recover missing data. The vehicle type distribution probabilities of traffic volume during different periods and speeds in different lanes are investigated. Next, the number of equivalent standard axle load (ESAL) at different lanes, time periods, and speeds are estimated based on the axle load conversion relationship between different vehicle types. Then the axle load spectrum and distribution characteristics of traffic in different sections, lanes, speeds, and time periods are analyzed. Finally, the comparison of rutting depth from the multisource data fusion and specification is carried out, and it shows an apparent difference (e.g., beyond 20%) when the lateral distribution in lanes is taken into account. Although the difference is less than 10% by considering vehicle speed and time periods, the time to reach the same value of rutting depth maybe more than 1 year. Therefore, it greatly affects accurate determination of preventive maintenance timing. As a whole, this study provides beneficial information for accurately understanding the preventive maintenance opportunities and making reasonable maintenance decisions.
1 Introduction
1.1 Background
At present, the concept of preventive maintenance is gradually recommended by maintenance managers, which means good pavement maintenance can prolong the service life of the pavement and it can reduce the impact of maintenance wastes on the environment (Shi et al., 2019; Dan et al., 2022a; Liu et al., 2022). However, the reasonable decision of preventive maintenance closely depends on the accurate understanding of the traffic volume and the accurate grasp of deterioration law of pavement performance (Tarefder and Rodriguez-Ruiz, 2013; Cirilovic et al., 2015; Dhatrak et al., 2020; Dan et al., 2022b). Traffic volume and axle load data are important basic parameters in pavement maintenance planning and design (Song et al., 2019). Meanwhile, it is well known that traffic loading is an important factor for road performance degradation and pavement damage (Dan et al., 2019; Perez-Acebo et al., 2019). Under the same conditions, the larger the equivalent standard axle load (ESAL) is, the faster the road condition deteriorates. Therefore, the analysis of highway traffic load is one of the most important references for pavement performance prediction and maintenance (Amorim et al., 2015; Dos et al., 2019).
Generally speaking, the traffic designers used the axle load spectrum (i.e., the percentage of different axle loads) to describe traffic loading, which is the main data source of traffic parameters in pavement design methods in developed countries (Ali et al., 2018; Dinegdae and Birgisson, 2018). To analyze the variation in traffic load and traffic volume, both the United States and Germany adopted the method of combining long-term observation with short-term observation to investigate the highway traffic volume and load distribution. It is mainly based on long-term observations and is supplemented by short-term sampling observations (Tang et al., 2019; Wang S. L et al., 2019). As for the influence of traffic loading on the pavement, researchers always attached great importance to the distribution of the actual axle load on the road. The designers often adapted an established wheel load as the standard design load in flexible pavement design methods in various countries (Heymsfield and Tingle, 2019). In the 1950s, the conversion coefficient was obtained for converting the mixed load into a single load by carrying out large full-scale road tests in the United States (Yin, 2015). In 2004, the mechanistic–empirical (M-E) design method was introduced by replacing the equivalent number of axle loading times with the axle load spectrum to characterize traffic loading for the pavement structure design in the United States, and a new road mechanics empirical design method based on the axle load spectrum was developed (AASHTO, 2020). The mixed traffic bearing capacity of the road was converted into the equivalent standard axle loads (ESALs) in current pavement structure design method in China (Wang et al., 2007; Wang and Zhang, 2016; Gao et al., 2019).
For some studies, the axle load spectrum and the traffic flow information were obtained by artificial statistics, which is difficult to calculate and restricted with poor accuracy (Haider et al., 2010; Mai et al., 2014). Certainly, they did not take some factors such as the distribution of traffic flow in different road sections, lanes, time periods (day and nights), and vehicle speed into consideration at the same time. Nevertheless, with the development of radio frequency identification technology, dynamic weighing technology, and high-definition image recognition technology, network tolling systems, weight-calculating charge systems, and high-definition video surveillance systems have been widely used in highway operation management faced with increasing traffic volume (Abbas et al., 2014; Ren et al., 2019; Feng et al., 2020). Massive traffic data are being collected on every expressway every day. The daily raw data generated by expressway tolling systems and video surveillance systems have the features of large quantity, various types, high speed of generation, and strong real-time performance, which are the characteristics of typical big data. If the traffic flow information of different sections, different lanes, different time periods, different speeds, and different vehicle types can be extracted from the massive tolling data and video surveillance data, the problem of difficulty in obtaining and analyzing traffic load information in pavement performance prediction can be effectively solved (Mai et al., 2013; Tarefder and Hasan, 2016). Furthermore, according to the Chinese standard (specification for design of highway asphalt pavement JTG D50-2017), the lane coefficient is determined by counting the number of vehicles including passenger cars and trucks on different lanes in the design direction according to the traffic volume observation data. Similarly, for the American standard (AASHTO 2020), the lane coefficient is the percent of trucks in the design direction that are expected to travel in the design lane. This percentage is used to calculate the total number of trucks in the design lane. It is unfortunate that the lane factor does not truly and completely reflect the traffic flow distribution of different lanes. As a matter of fact, due to the influence of channelized traffic, the distribution of vehicles and the speed on different lanes is extremely varied, which makes the degradation of pavement performance different. Especially, there are many heavy-duty vehicles on the expressway, and the existing axle load spectrum cannot truly reflect the complex traffic axle load characteristics as well.
Therefore, a large number of traffic data through the traffic information acquisition system, the data fusion analysis can be carried out to provide a better way to accurately understand the characteristics of traffic volume and axle load distribution.
1.2 Objective and scope
The main objective of the study is to integrate toll data and video surveillance data to analyze, and the traffic distribution characteristics will be refined and understood through data integration analysis, disassembling, and processing the data in terms of road section, vehicle type, axle type, axle load, lane, speed, and time. Furthermore, the significance of the traffic data fusion analysis will be highlighted through the application of the presented method, and it also provides crucial information and approach for management department of expressway to rationally take use of traffic data.
2 Methodology
2.1 Data source and description
The main data used in this study were derived from toll, video surveillance, maintenance service, and meteorological data from the transportation department of Guangdong province in China. The traffic axle load data were collected from a section of expressway (about 289.7 km) in Guangdong province, which is shown in Figure 1, and the data information are listed in Table 1. It is pointed out that the abbreviations in Figure 1 are the names of toll stations. The distance between toll stations is the expressway section and the full name is listed as follows:
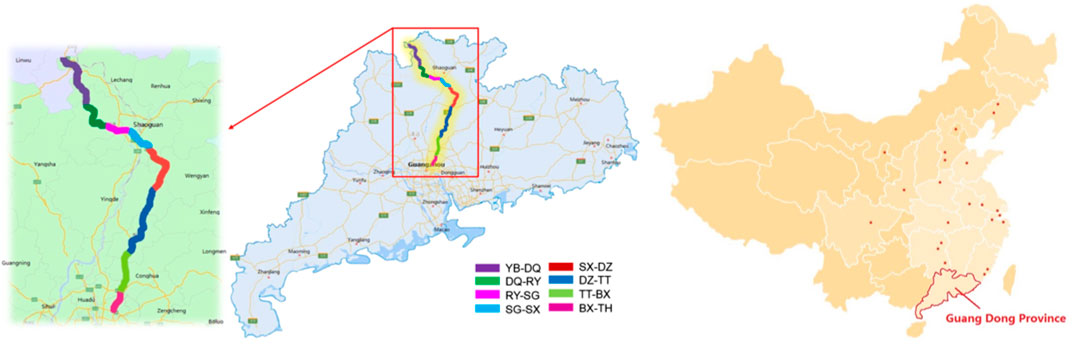
FIGURE 1. Location of expressway sections in Guangdong province, China (the legends represent the section names between toll stations).
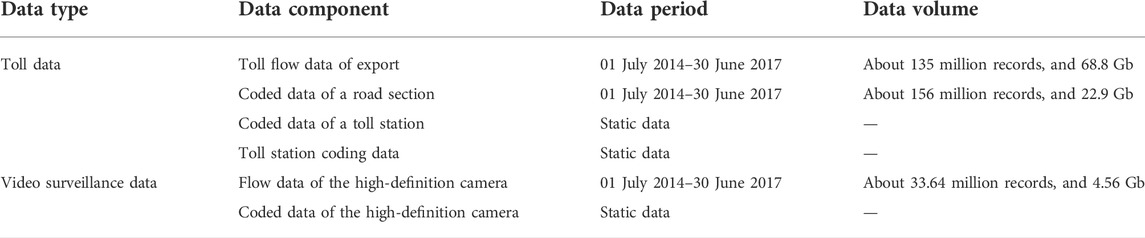
TABLE 1. Data for analysis.
YB-DQ: Yuebei–Daqiao, DQ-RY: Daqiao–Ruyuan, RY-SG: Ruyuan–Shaoguan, SG-SX: Shaoguan–Shaxi, SX-DZ: Shaxi–Dazhen, DZ-TT: Dazhen–Tangtang, TT-BX: Tangtang–Beixing, and BX-TH: Beixing–Taihe.
The traffic data mainly include toll data and video surveillance data.
(1) The toll data include toll flow data of export, coded data of a road section, and the coded data of a toll station. The main axle types and model type of vehicles are shown in Figures 2, 3, respectively.
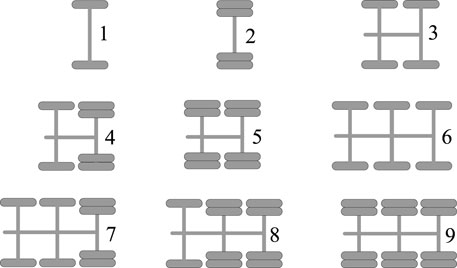
FIGURE 2. Schematic diagram of axle type of vehicles.
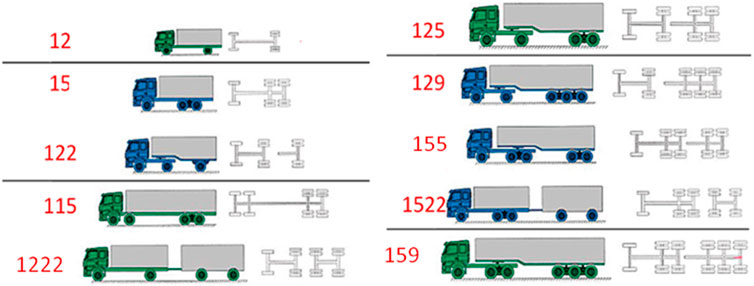
FIGURE 3. Schematic diagram of model type of vehicles.
It should be pointed out that the maintenance and meteorological data are not listed and analyzed in this study because the mechanics and performance analysis of pavement is beyond the scope of this study.
2.2 Data disassembly of data from different sources
As a matter of fact, the video surveillance data, toll data, meteorological data, and maintenance data have different data formats. It is difficult to directly extract the traffic information of a certain road section. To establish the connection between different types of data, the road section code is used to unify different types of data in the road network model (Figure 3), and the specific link information of each type of data is shown in Figure 4. The specific process is as follows.
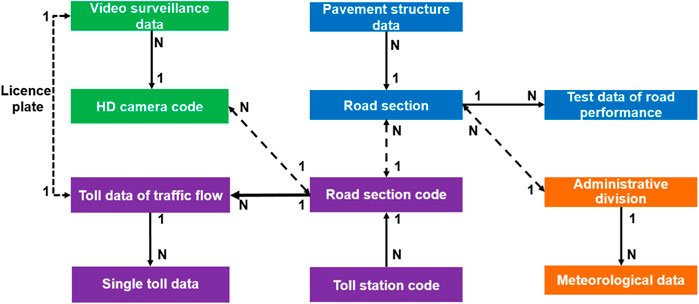
FIGURE 4. Data model of road section coding.
First, the video surveillance data are imported and the high-definition camera code is extracted by programming with MATLAB and R language. Then the HD camera code is converted into the corresponding road section code in the road network. Furthermore, the detailed toll data are imported and disassembled to acquire the corresponding number and name of each toll station through programming. Basically, every single data contain the license plate information of vehicle, and it can be linked to the video surveillance data. That is the vehicle flow in the road section can be clarified. Finally, the toll station code is also linked to the corresponding road section code in the road network. Likewise, the meteorological data collected in the region of administration division, pavement structure data, and the testing data of road performance can be easily referred to the road section and road section code. Therefore, all the provided data can be unified by the road section code and then can be disassembled into the target data, which is shown in Figure 5. The following process can be specified as below.
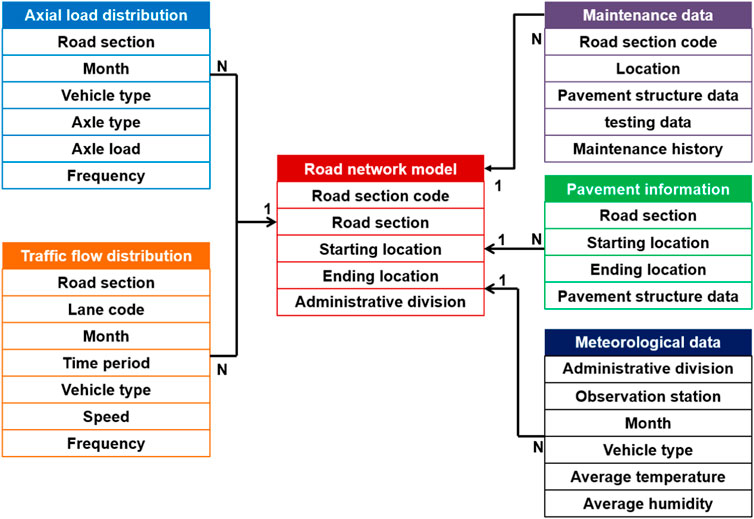
FIGURE 5. Schematic diagram data disassembly model.
First, the toll data is disassembled to acquire the axle type, vehicle type, and the traffic flow distribution. Second, the video surveillance data is similarly disassembled to obtain the vehicle speed, passing time, and lane information of each vehicle. Finally, the traffic flow distribution can be obtained by taking in consideration the vehicle speed, passing time, and lane information of all vehicles.
2.3 Refined computing method of multisource traffic data
In general, the distribution of axle weight and total weight in each road section (between toll stations) can be calculated through toll data, and the vehicle speed, passing time, and traffic flow in different lanes can be calculated using the video surveillance data. However, as a matter of fact, the volume of video surveillance data is smaller than that of toll data to some extent due to the absence of video surveillance data by HD camera. Therefore, accurate traffic information cannot be linked just by using the existing video surveillance data and toll data. To solve this problem, the traffic flow distribution of different vehicle in different lanes are obtained using the Bayesian decision method (Tang and Huang, 2019; Wen et al., 2019; Fleischhacke et al., 2020) by training partial toll and video surveillance data.
Several studies have previously employed the Bayesian method in the analysis of traffic to express certain relationships between the different factors (Chen, et al., 2019; Febres et al., 2019; Wang F. Y et al., 2019). Therefore, the toll and video surveillance data are trained to obtain the posterior probability of the data (i.e., the probability of traffic distribution of different lanes of vehicles in different sections, time periods, and speeds; and the probability of different vehicle types). According to the probability, the vehicle flow distribution and the number of axle load in each road section are restored. Then the vehicle flow distribution characteristics of different road sections, and lanes, vehicle types are obtained at different speeds and in time periods. Specifically, the process is as follows.
Referring to the road network model, the toll data is disassembled to acquire the axle and vehicle type as well as the vehicle flow distribution of different vehicle types (see Figure 6). Then the video surveillance data is disassembled to obtain the vehicle speed, driving time and lane information of each vehicle.
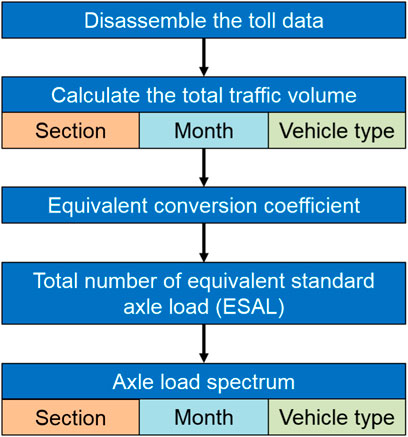
FIGURE 6. Acquisition process of vehicle flow distribution for different vehicle types.
First, a priori distribution probability of the axle load spectrum is defined, and then the likelihood function of the axle load spectrum is determined. Then the toll data and video surveillance data are trained to obtain the posterior probability, including the different vehicles in different sections, time periods, and vehicle speeds. Furthermore, the probability of vehicle flow distribution of lane as well as the vehicle types is obtained to calculate the loss function and prior probability, of which the expected value of the loss function is the largest. Finally, according to the probability, the vehicle flow distribution and the number of axle load of each road section can be restored. Accordingly, the axle load spectrum can be obtained including the statistics on the speed, driving time, and lane information of all vehicles (see Figure 7).
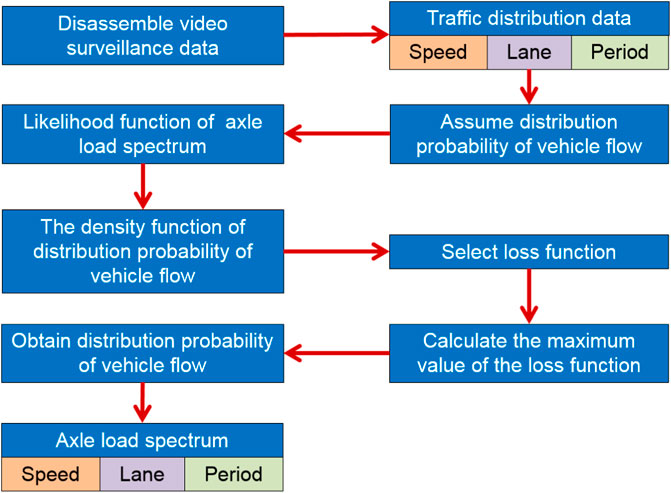
FIGURE 7. Acquisition process of vehicle flow distribution for different lanes.
3 Results and discussion
3.1 Distribution characteristics of traffic in different sections
The traffic data are refined according to the steps in Section 2.3. The ESALs (equivalent standard axle loads) of the eight sections of an expressway in Guangdong province are obtained by converting the obtained data, as shown in Figure 8 and Figure 9 as below.
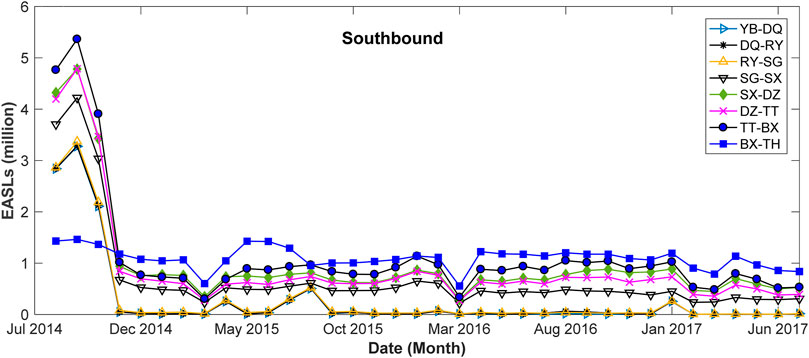
FIGURE 8. Statistics of accumulative ESAL of eight southbound sections of an expressway in Guangdong province from July 2014 to June 2017.

FIGURE 9. Cumulative ESAL of eight southbound sections from July 2014 to June 2017.
It can be seen in Figure 8 that the traffic volume decreases as road sections sorted from top to bottom. In addition, the traffic volume decreases substantially after September 2014 because another double-track expressway was opened to traffic, which causes a very significant diversion to an expressway in Guangdong province at the end of September 2014. The diversion volume is approximately 80%. The only unaffected part is the southbound lane of the BX-TH section, which has a stable traffic flow and little change. The traffic flow of the whole line is basically stable after October 2014. The annual traffic flow has a small trough in the Spring Festival of China, and the traffic flow is basically stable in the rest of the year.
As shown in Figure 9, the cumulative ESAL times of eight sections in 3 years change greatly, and the maximum difference is 4.07 times, indicating that the traffic flow varies greatly between different sections. Due to the different traffic flow of sections, the pavement performance attenuation rate of is not the same, and the timing for preventive maintenance of each section is also out of step (Mohammed et al., 2018). Therefore, it is necessary to refine the traffic flow in different sections, and accurate traffic volume information is obtained as the input of the pavement performance prediction model of each section, which can scientifically guide the maintenance department to carry out preventive maintenance in a timely manner.
3.2 Distribution characteristics of traffic in different lanes
Most sections of expressways in Guangdong province are bidirectional six lanes (e.g., SG-SX, SX-DZ, DE-TT, TT-BX, and BX-TH sections), and a few sections are bidirectional four lanes (e.g., YB-DQ, DQ-RY, and RY-SG sections). Taking bidirectional six lanes as an example, the form of lanes is shown in Figure 10.

FIGURE 10. Schematic diagram of lanes for an expressway in Guangdong province, China.
The axle type and number of vehicles in each lane are obtained by separating the vehicle information data, which are acquired by a high-definition camera and toll stations. Traffic flow information at different lanes in the eight sections of expressway can be obtained through load conversion, and then the monthly average ESAL times of each lane are obtained and shown in Figures 11, 12 for the southbound and northbound lanes in 3 years.
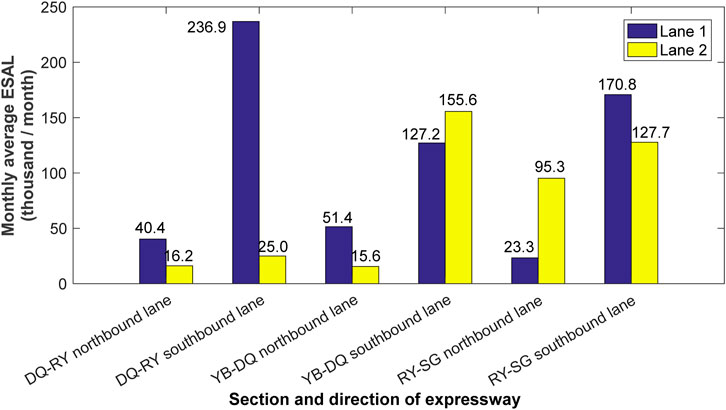
FIGURE 11. Monthly average ESAL times of each lane for sections of four bidirectional lanes.
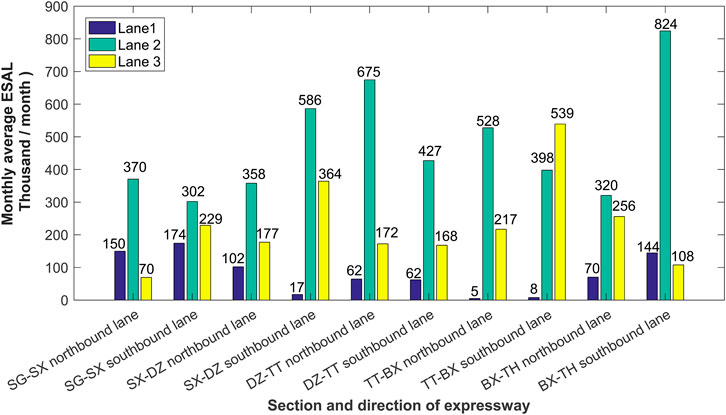
FIGURE 12. Monthly average ESAL times of each lane for sections of six bidirectional lanes.
Figures 11, 12 show that the monthly average ESAL times on different sections and lanes changes greatly. The percentage of ESAL in each lane and lane coefficient of expressway are counted and shown in Figures 13, 14, respectively.
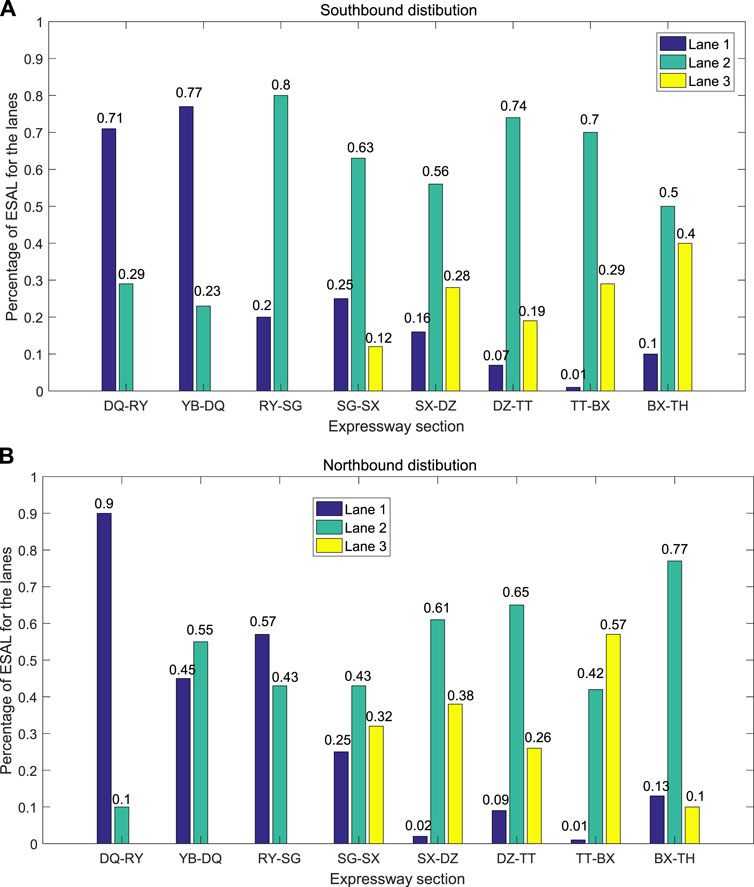
FIGURE 13. (A) Percentage of ESAL for the lanes in southbound distribution. (B) Percentage of ESAL for the lanes in northbound distribution.
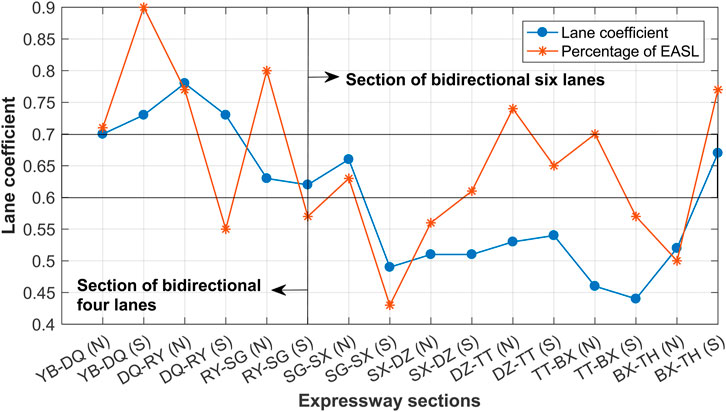
FIGURE 14. Comparison between the lane coefficient and percentage of ESAL on lanes.
It can be seen from Figure 11 that the distribution of EASL in lane 1 and lane 2 of two-way four-lane sections is not very regular. In some sections, EASL in lane 1 is significantly larger than that in lane 2 (e.g., DQ-RY southbound), while in others, it is opposite. However, for the section of six bidirectional lanes, a distinguishing feature is that, the EASL in lane two is significantly larger than that in the other lanes (see Figure 12). For instance, the number of EASL in lane two is 105.6 times that in lane 1 for the TT-BX northbound lane. On the whole, the ratio relationship between the lane two and the smallest ESAL of other lanes is within a range of 1.74–105.6. Obviously, there are three sections with very large ratios in Figure 12 (SX-DZ southbound, TT-BX northbound, and TT-BX southbound). According to the investigation of the highway management department, there are two reasons. The first is that the quality of the three sections of the pavement is poor and has not been timely maintained. The vehicles especially the trucks selectively avoid driving on the lane one. The second is that the subsequently temporary maintenance activities affect traffic flow to some extent.
It can be seen from Figures 13A,B that there is a significant difference in the ESAL for different lanes in the same section. In general, the percentage of EASL on Lane 1 is relatively large for four bidirectional lanes, while the percentage of EASL on the Lane 2 is relatively large for six bidirectional lanes. The change in range of the percentage of EASL for the four bidirectional lanes is 0.55–0.9 and that of the six bidirectional lanes is 0.43–0.77.
It can be seen that the lane coefficients of most sections are consistent with those of the design specification (Ministry of Transport of the People’s Republic of China, 2017), but the lane coefficients of nearly quarter of the sections are not within the range of the design specification. For the four bidirectional lanes, the lane coefficient of YB-DQ northbound and RY-SG northbound and southbound are, respectively, 0.07 and 0.06 lower than the lower limit of the lane coefficient in the specification (i.e., 0.7). For six bidirectional lanes, the lane coefficients of SG-SX northbound and BX-TH southbound are 0.06 and 0.07 higher, respectively, than the upper limit of the lane coefficient in the specification (i.e., 0.6).
Nevertheless, maintenance needs to make a maintenance plan according to the actual pavement quality which largely depends on the action of traffic loading. It can be seen from Figure 14 that the percentage of ESAL on different lanes varies sharply. For instance, in the eight sections from YB-DQ to BX-TH, the percentage of ESAL is extremely fluctuant, which indicates the degree of pavement subjected to traffic load changes greatly. Therefore, it will lead to a result that the pavement performance of lanes deteriorate rapidly are not maintained in time and that of lanes declines slowly in some sections are maintained in advance.
Likewise, due to the difference of the traffic flow in different lanes, the performance of each lane of the expressway declines unevenly, and the time for each lane to enter into the pre-maintenance is not the same. Therefore, it is necessary to analyze the traffic flow distribution of different lanes in spatial and temporal for decision making of pre-maintenance.
3.3 Distribution characteristics of traffic at different vehicle speeds
Different vehicle speed will cause different effects on the road surface and contribute to the occurrence and evolution of distress such as rutting, cracking, and water damage to some extent (Peng et al., 2019; Dan et al., 2020). In order to investigate the change law of speed distribution, the traffic flow of eight sections of the expressway from July 2014 to June 2017 is counted, and the statistical results are shown in Figure 15.
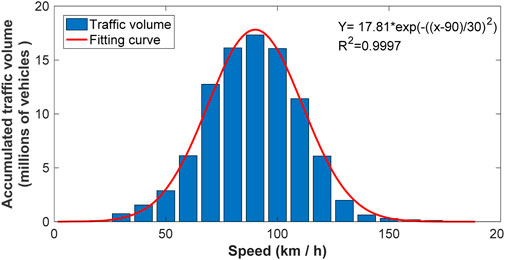
FIGURE 15. Histogram of traffic volume corresponding to different speeds.
Figure 15 shows that the proportions of vehicle speed in range of 40–60 km/h, 60–80 km/h, 80–100 km/h, 100–120 km/h, and above 120 km/h are 4.68%, 19.96%, 35.41%, 29.08%, and 6.45%, respectively. Without taking the vehicle types into account, more than 90% in total of the vehicles in these sections of expressway drive with speed ranging from 60 km/h to 120 km/h. Furthermore, the loading times of different vehicle types are converted into the ESAL times based on the equal failure principle according to the Chinese specification (Ministry of Transport of the People’s Republic of China, 2017), and the statistical results are shown in Figure 16.
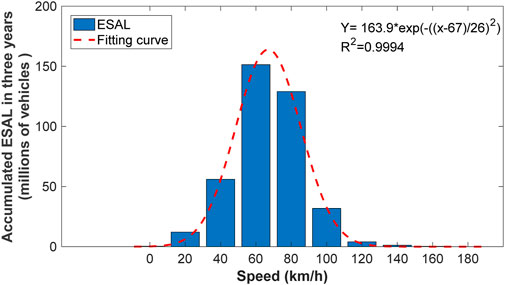
FIGURE 16. Histogram of ESAL times for different vehicle speeds.
It can be seen from Figure 16 that the proportions of the ESAL times in the range of 40–60 km/h, 60–80 km/h, 80–100 km/h, 100–120 km/h, and above 120 km/h are 14.49%, 39.19%, 33.4%, 8.24%, and 1.04%, respectively. More than 95% of the ESAL times range from 40 km/h to 100 km/h. Compared with Figure 15, the speed distribution range after axle load conversion (40–100 km/h) is 20 km/h lower than that before axle load conversion (60–120 km/h). The main reason is that a large number of heavy-duty vehicles traveling on the expressway with speeds ranging from 50 km/h to 80 km/h. A heavy-duty vehicle can be converted into a ESAL several hundred times, even thousands of times, while a small bus with a full load of vehicle type 11 can be converted into a ESAL only approximately 0.004 times. Most of the vehicles on the expressway at high speed are vehicle type 11. Although the number is large, the influence on the performance of the road is not as good as that of heavy vehicles due to the small axle weight. The proportion of the low-speed vehicle increases significantly after the axle load is converted, and the decrease in the speed of the vehicle increases the loading time and accelerates the occurrence of road surface distress. Therefore, it is significant that differentiating the speed distribution can help accurately predict the attenuation law of pavement performance (especially rutting).
Although the highway engineering technical standard recommends that the design speed of the expressway is 80–120 km/h which mainly considers the traffic capacity of expressways (Ministry of Transport of the People’s Republic of China, 2014), it does not consider the influence of the speed and vehicle type on the performance of the road. Therefore, it is not reasonable to apply this standard directly to road maintenance, and it is necessary to consider the speed of vehicle to refine traffic volume and obtain more accurate traffic characteristic data.
In addition, the vehicles distributed in different lanes are also investigated in this study. The following is a statistical distribution of the speed at different lanes based on the traffic volume in 2016 which are shown in Figure 17.
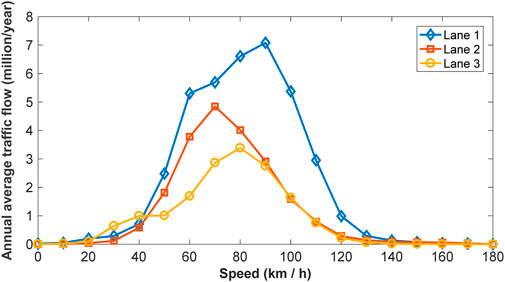
FIGURE 17. Statistics of vehicle speed in different lanes.
It can be seen from Figure 17 that most of vehicles are traveling at 90 km/h in Lane 1, with vehicle speeds ranging from 70 km/h to 110 km/h in Lane 1. Most of vehicles are traveling at 70 km/h in Lane 2, with vehicle speeds ranging from 60 km/h to 100 km/h in Lane 2. Most of vehicles are traveling at 80 km/h in Lane 3, with vehicle speeds ranging from 60 km/h to 100 km/h in Lane 3. It can be seen from the above analysis that vehicle speed varies greatly in different lanes, therefore, it is necessary to consider the influence of speed of different lanes on road performance when analyzing road performance degradation in different lanes.
3.4 Distribution characteristics of traffic at different time periods
As we known that the traffic distribution is not only different in space, but also unevenly distributed in time (Turochy et al., 2005), accordingly, the traffic volume corresponding to different times of a 24 h day is calculated based on the traffic volume in 2016, and the statistical results are shown in Figure 18.
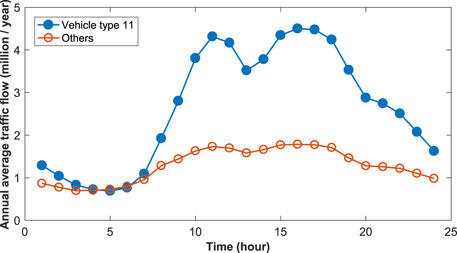
FIGURE 18. Statistics of traffic flow corresponding to different times of a 24 h day.
Obviously, Figure 18 shows the bimodal distribution. That’s to say, the traffic volume gradually increases from 6 a.m., and the maximum traffic flow is between 11:00 and 17:00 for vehicle type 11. Other type vehicles contribute to the largest traffic flow between 10:00 and 18:00, and the traffic flow of all type vehicles starts to decrease gradually after 18:00, and the traffic volume during the day accounts for more than 70% of the total traffic flow. The corresponding temperature varies at different times of the day, and traffic flow is not evenly distributed throughout the day. Likewise, the influence of the same traffic flow on pavement performance at different times of the day is also different. Therefore, the attenuation law of road performance can be predicted more accurately by comparing the traffic flow in each time period with the temperature field of road structure in the time period.
Furthermore, considering the large temperature changes in different months, the traffic volume of different months is also counted based on the traffic volume from July 2014 to June 2016. The statistical results are shown in Figure 19.
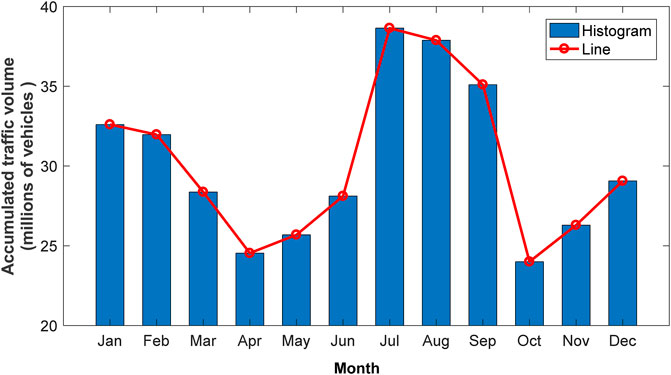
FIGURE 19. Statistical traffic flow in different months from July 2014 to June 2016.
It can be seen from Figure 18 that the traffic volume in July is the largest, while that in October is the smallest. The traffic volume in July is 1.6 times higher than that in October. The traffic volume varies greatly in different months. The temperature in Guangdong province is higher in summer, and the high temperature adversely affects the performance of asphalt pavement. In other words, the temperature varies from month to month in Guangdong province, and the damage degree of the same traffic flow to asphalt pavement varies from month to month as well. Therefore, for instance, it is significant to evaluate the rutting of the asphalt pavement caused by the traffic flow monthly so that the predicted rutting depth of the pavement can be more representative of the attenuation law of asphalt pavement.
3.5 Impact of traffic distribution on pavement performance
In order to investigate the impact of the non-uniformity of traffic load distribution in time and in space on pavement performance, we adopt the rutting depth of pavement as the comparison index, and four sections of expressway are selected for comparison of rutting depth. The pavement structure and materials are listed in Table 2.
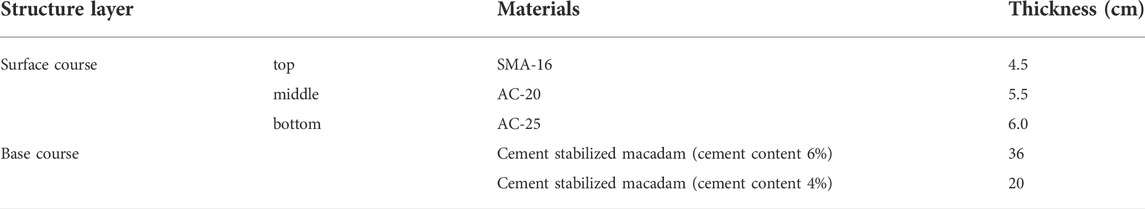
TABLE 2. Pavement structure of the case study.
The computing method rutting depth can refer to the study by Gao et al. (2017), which proposed a model on predicting the rutting of asphalt pavement based on a simplified Burgers creep model. According to Gao’s model, the Burgers model parameters of asphalt mixture are obtained by laboratory test (Table 3).
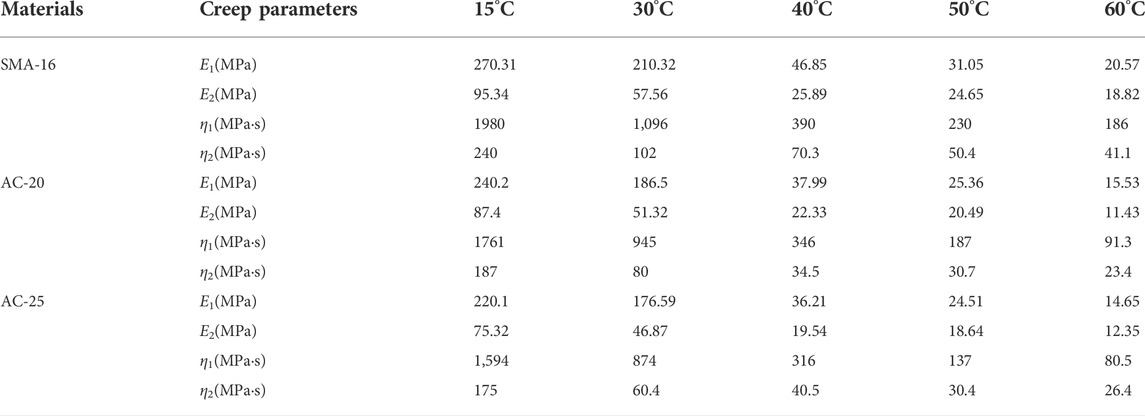
TABLE 3. Burgers model parameters.
The lane coefficients are respectively based on the data analysis results in this study and the Specification for Design of Highway Asphalt Pavement (0.3 is used as standard value for calculation) (Ministry of Transport of the People’s Republic of China, 2017). The vehicle speed is selected to be 100 km/h. The traffic flow in each period is considered (every 2 h is a period, and 1 day is divided into 12 periods) and the traffic flow without considering the period is substituted into the established rutting prediction model (Dan et al., 2015; Gao et al., 2017). Accordingly, the rutting depth can be calculated for pavement of each road section, which is shown in Figures 20–22, respectively.
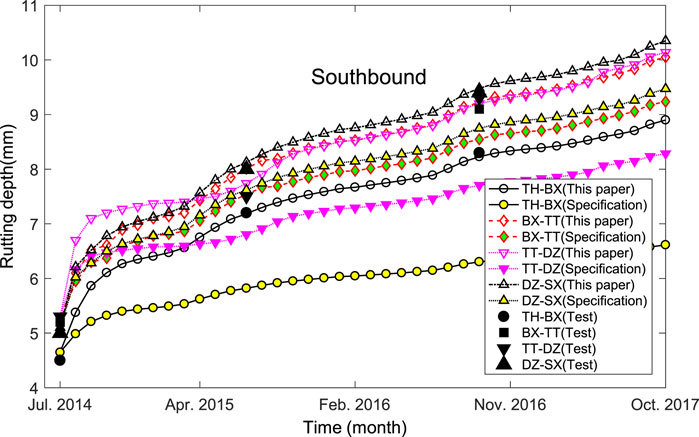
FIGURE 20. Comparison of rutting depth between the lane coefficient calculated by the standard value and the presented value in this study.
As can be seen from the comparison results in Figure 20, the maximum difference of rutting depth between the lane coefficient calculated by the standard value and the presented value in this study is 24% (only the lane with the maximum rutting depth is calculated), because the lane coefficient specified in the standard does not reasonably reflect the characteristics of channelized traffic on the expressway. As a matter of fact, due to the influence of lane division, traffic organization and management and channelized traffic of expressway, the distribution of different vehicle types on different lanes is extremely varied, and the vehicle types on the same lane are also complex (Jasim et al., 2019). Therefore, it is necessary to divide the expressway traffic flow into lanes to obtain the actual lane coefficient, obtain the accurate traffic flow of each lane, and accurately detect the pavement performance of the expressway, so as to guide the maintenance decision and construction.
Secondly, it can be seen from Figure 21 that the maximum difference between the fixed speed (100 km/h) and the actual speed is about 6.9%. Inevitably, there are vehicles traveling at low speed (less than 60 km/h) on expressways, and the influence of driving speed on the anti-rut performance of asphalt pavement is mainly reflected in the duration of loading. The vehicle traveling at low speed is equivalent to increasing the duration of loading, thus leading to the rapid increase of rutting depth. Although speed has less influence on rut performance than load and temperature, low speed is often associated with heavy load, which will aggravate rutting damage. Therefore, it is necessary to consider speed to carry out refined treatment on traffic flow.
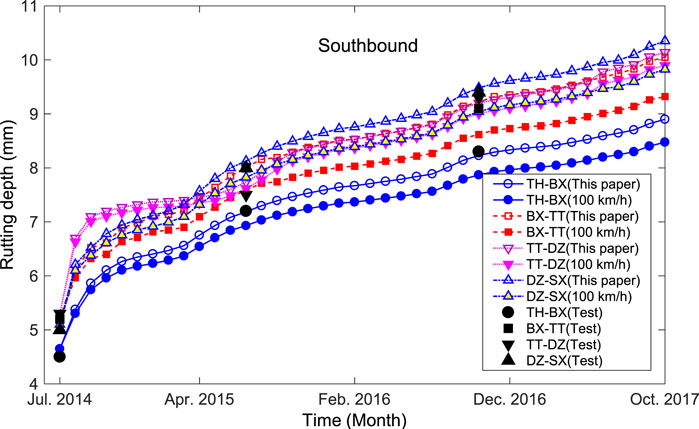
FIGURE 21. Comparison of calculated rutting depth between distinguish and not distinguish different speeds of traffic flow.
In addition, Figure 22 shows that the maximum difference of calculated rutting depth is about 8.8% between distinguish and not distinguish different periods of traffic flow. The diurnal cycle and seasonal cycle of temperature are often ignored in the traditional analysis, however, the asphalt mixture is a temperature sensitive material, and its pavement performance is closely related to its temperature sensitivity. Furthermore, the traffic volume is not uniformly distributed in different time periods of each day, and the pavement structure temperature field is not the same in different time periods. Thus, the same traffic volume has different influence on the pavement rut in different time periods. That’s to say, a one-to-one correspondence between the traffic volume in a certain period and the temperature field of the pavement structure in that period can be used to calculate rutting depth more accurately. Therefore, the fusion and calculation of multisource data is an important means to improve the study of pavement rutting development.
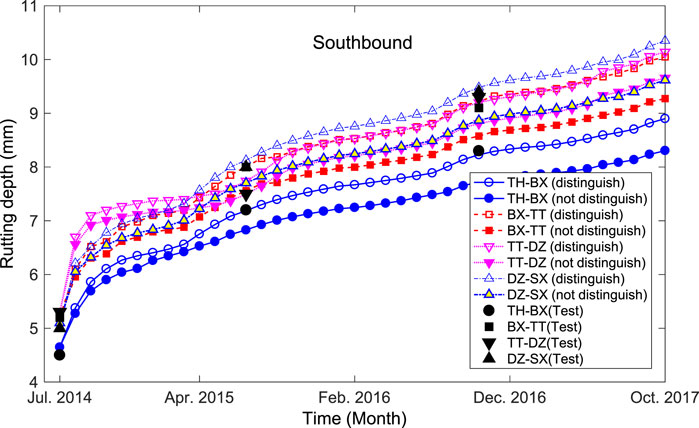
FIGURE 22. Comparison of calculated rutting depth between distinguish and not distinguish different periods of traffic flow.
Currently, traffic analysis in the MEPDG (e.g., Level 2 and Level 3) (MEPDG Documentation, 2010; Hasan, et al., 2020) is different from the actual situation (Level 1) to some extent, and various factors (lane distribution characteristics of traffic load, difference in speed and time period) also have different influences on the pavement performance analysis, and such differences become more and more significant with the passage of time (See Figures 20–22). More importantly, these differences may lead to misjudgment in the decision of preventive maintenance of road surface, which to some extent affects the determination of maintenance timing, the accuracy and scientificity of preventive maintenance decision. For instance, from the perspective of rutting depth development, there is an apparent difference (e.g., beyond 20%) when the lateral distribution in lanes is taken into account. Although the difference is less than 10% by considering vehicle speed and time periods, the time to reach the same value of rutting depth maybe more than 1 year because the rut depth increases slowly. This may greatly affect the accurate determination of preventive maintenance timing. Therefore, it is very important to carry out traffic multi-data fusion analysis, which is the basis for the research on pavement performance decay and preventive maintenance decision.
4 Concluding remarks
The findings of this study are summarized in brief as follows.
(1) The maximum traffic volume of eight sections of an expressway in Guangdong province is 9.76 times the minimum traffic volume, and the traffic flow of different sections is quite different.
(2) Compared with the lane coefficient in the specification, a considerable amount of road sections of which the lane coefficient is higher and lower than the limit of the lane coefficient in the Chinese specification. The percentage of ESAL is extremely fluctuant, which indicates the degree of pavement subjected to traffic load changes greatly.
(3) The speed of vehicles in different lanes is quite different, and the average speed of vehicles on the Lane 1, Lane 2, and Lane 3 is 90 km/h, 70 km/h, and 80 km/h, respectively. It is proposed that the traffic flow should be refined according to the lane and the speed of the vehicle, and it helps more specifically to guide the maintenance department to accurately maintain the road lanes.
(4) The distribution of the traffic flow in different months and different time periods are uneven, which leads to the rutting of asphalt pavement varying from month to month accordingly. It is significant to evaluate the rutting of the asphalt pavement caused by the traffic flow monthly due to more representative of the attenuation law of asphalt pavement in Guangdong province.
(5) From the perspective of rutting depth development, it may greatly affect the accurate determination of preventive maintenance timing by considering the vehicle speed and time periods or not.
In practical application of preventive maintenance, it needs to determine the pavement condition in time and the maintenance timing, and reasonable preventive maintenance measures can be applied. Therefore, from the perspective of application, it is suggested to combine the pavement management system (PMS) with the method presented in this study to analyze the traffic volume and axle load data in detail. Then it is more reasonable to combine the data analysis results with the attenuation model of pavement quality to predict the variation of performance indexes of pavement (e.g., skid resistance performance, rutting resistance performance, etc.) by considering the influence of lane, vehicle speed and time period, and finally comprehensively determine the timing of pavement preventive maintenance.
Generally speaking, the traffic data can be put into use of predicting pavement condition in the future study, for instance, the rutting, fatigue, skid resistance performance can be investigated through the integration analysis and refinement processing. As mentioned in Section 2.1, a large amount of maintenance data can be also utilized to validate the deterioration law and condition of pavement.
Data availability statement
The original contributions presented in the study are included in the article/Supplementary Material; further inquiries can be directed to the corresponding authors.
Author contributions
H-CD: conceptualization, methodology, funding, and writing—original draft preparation; CL: methodology and writing—original draft preparation; ZZ: methodology, programming, and writing—reviewing and editing; LG: writing—original draft preparation; XZ: data resources.
Funding
This research was supported by the Natural Science Foundation of Hunan Province (Grant No. 2020JJ4702), Guizhou Transportation Science and Technology Foundation of China (Grant No. 2019-122-006), and Jiangxi Transportation Science and Technology Foundation of China (Grant No. 2020H0028).
Acknowledgments
Special acknowledgement to the Guangdong Hualu Transportation Technology Co., Ltd. for providing the traffic multi-source data.
Conflict of interest
XZ was employed by Guangdong Hualu Transportation Technology Co., Ltd.
The remaining authors declare that the research was conducted in the absence of any commercial or financial relationships that could be construed as a potential conflict of interest.
Publisher’s note
All claims expressed in this article are solely those of the authors and do not necessarily represent those of their affiliated organizations, or those of the publisher, the editors, and the reviewers. Any product that may be evaluated in this article, or claim that may be made by its manufacturer, is not guaranteed or endorsed by the publisher.
References
AASHTO (2020). Mechanistic empirical pavement design guide: a manual of practice. 3rd Edition. Washington, DC, USA: American Association of State Highway and Transportation Officials.
Abbas, A. R., Frankhouser, A., and Papagiannakis, A. T. (2014). Effect of traffic load input level on mechanistic-empirical pavement design. Transp. Res. Rec. 2443, 63–77. doi:10.3141/2443-08
Ali, Y., Irfan, M., Zeeshan, M., Hafeez, I., and Ahmed, S. (2018). Revisiting the relationship of dynamic and resilient modulus test for asphaltic concrete mixtures. Constr. Build. Mater. 170, 698–707. doi:10.1016/j.conbuildmat.2018.03.098
Amorim, S. I. R., Pais, J. C., Vale, A. C., and Minhoto, J. C. (2015). A model for equivalent axle load factors. Int. J. Pavement Eng. 16 (10), 881–893. doi:10.1080/10298436.2014.968570
Chen, X., Dong, Q., Gu, X., and Mao, Q. (2019). Bayesian analysis of pavement maintenance failure probability with Markov chain Monte Carlo simulation. J. Transp. Eng. Part B Pavements 145 (2), 04019001. doi:10.1061/jpeodx.0000107
Cirilovic, J., Mladenovic, G., and Queiroz, C. (2015). Implementation of preventive maintenance in network-level optimization case study of the Serbian low-volume road network. Transp. Res. Rec. 2473, 49–55. doi:10.3141/2473-06
Dan, H. C., Bai, G. W., Zhu, Z. H., Liu, X., and Cao, W. (2022b). An improved computation method for asphalt pavement texture depth based on multiocular vision 3D reconstruction technology. Constr. Build. Mater. 321, 126427. doi:10.1016/j.conbuildmat.2022.126427
Dan, H. C., He, L. H., Zhao, L. H., and Chen, J. Q. (2015). Coupled hydro-mechanical response of saturated asphalt pavement under moving traffic load. Int. J. pavement Eng. 16 (2), 125–143. doi:10.1080/10298436.2014.937712
Dan, H. C., He, L. H., and Zhao, L. H. (2020). Experimental investigation on the resilient response of unbound graded aggregate materials by using large-scale dynamic triaxial tests. Road Mater. Pavement Des. 21 (2), 434–451. doi:10.1080/14680629.2018.1500300
Dan, H. C., Zeng, H. F., Zhu, Z. H., Bai, G. W., and Cao, W. (2022a). Methodology for interactive labeling of patched asphalt pavement images based on U-net convolutional neural network. Sustainability 14, 861. doi:10.3390/su14020861
Dan, H. C., Zhou, Z. M., Chen, J. Q., and Peng, A. P. (2019). DEM-aided method for predicting the hydraulic properties with particle-size distribution of porous media. Eng. Comput. Swans. 36 (5), 1716–1743. doi:10.1108/ec-09-2018-0398
Dhatrak, O., Vemuri, V., and Gao, L. (2020). Considering deterioration propagation in transportation infrastructure maintenance planning. J. Traffic Transp. Eng. Engl. Ed. 7 (4), 520–528. doi:10.1016/j.jtte.2019.04.001
Dinegdae, Y. H., and Birgisson, B. (2018). Effects of truck traffic on top-down fatigue cracking performance of flexible pavements using a new mechanics-based analysis framework. Road Mater. Pavement Des. 19 (1), 182–200. doi:10.1080/14680629.2016.1251958
Dos, S., Thais, A., Prado, D. S. J., Carlos, A., and Fontenele, H. B. (2019). The effect of axle load spectra from AASHTO method on flexible pavement performance. Acta Sci. Technol. 41, 35117. doi:10.4025/actascitechnol.v41i1.35117
Febres, J. D., Mohamadi, F., Mariscal, M. A., Herrera, S., and Garcia-Herrero, S. (2019). The role of journey purpose in road traffic injuries: a bayesian network approach. J. Adv. Transp. 2019, 1–10. doi:10.1155/2019/6031482
Feng, M. Q., Leung, R. Y., and Eckersley, C. M. (2020). Non-contact vehicle weigh-in-motion using computer vision. Measurement 153, 107415. doi:10.1016/j.measurement.2019.107415
Fleischhacke, A., Ghonima, O., and Schumacher, T. (2020). Bayesian survival analysis for US concrete highway bridge decks. J. Infrastruct. Syst. 26 (1), 04020001. doi:10.1061/(asce)is.1943-555x.0000511
Gao, L. S., Dan, H. C., and Chen, J. Q. (2017). Research on predicting the rutting of asphalt pavement based on a simplified burgers creep model. Math. Problems Eng. 2017, 1–14. doi:10.1155/2017/3459704
Gao, L. S., Dan, H. C., and Li, L. (2019). Response analysis of asphalt pavement under dynamic loadings: loading equivalence. Math. Problems Eng. 2019, 1–15. doi:10.1155/2019/7020298
Haider, S. W., Harichandran, R. S., and Dwaikat, M. B. (2010). Effect of axle load measurement errors on pavement performance and design reliability. Transp. Res. Rec. 2160, 107–117. doi:10.3141/2160-12
Hasan, M. M., Asifur Rahman, A. S. M., and Tarefder, R. A. (2020). Investigation of accuracy of pavement mechanistic empirical prediction performance by incorporating Level 1 inputs. J. Traffic Transp. Eng. Engl. Ed. 7 (2), 259–268. doi:10.1016/j.jtte.2018.06.006
Heymsfield, E., and Tingle, J. S. (2019). State of the practice in pavement structural design/analysis codes relevant to airfield pavement design. Eng. Fail. Anal. 105, 12–24. doi:10.1016/j.engfailanal.2019.06.029
Jasim, A. F., Wang, H., and Bennert, T. (2019). Evaluation of clustered traffic inputs for mechanistic-empirical pavement design: case study in New Jersey. Transp. Res. Rec. 2673 (11), 332–348. doi:10.1177/0361198119853557
Liu, K., Xu, P. X., Wang, F., You, L. Y., Zhang, X. C., Fu, C. L., et al. (2022). Assessment of automatic induction self-healing treatment applied to steel deck asphalt pavement. Automation Constr. 133, 104011. doi:10.1016/j.autcon.2021.104011
Mai, D., Turochy, R. E., and Timm, D. H. (2013). Quality control of weigh-in-motion data incorporating threshold values and rational procedures. Transp. Res. Part C Emerg. Technol. 36, 116–124. doi:10.1016/j.trc.2013.08.012
Mai, D., Turochy, R. E., and Timm, D. H. (2014). Sensitivity of flexible pavement thickness to traffic factors in mechanistic-empirical pavement design. J. Transp. Eng. 140 (12), 04013005. doi:10.1061/(asce)te.1943-5436.0000628
MEPDG Documentation (2010). Guide for mechanistic-empirical design of new and rehabilitated pavement structures. Washington, DC: National Cooperative Highway Research Program, Transportation Research Board, National Research Council. Available at: http://onlinepubs.trb.org/onlinepubs/archive/mepdg/guide.htm.
Ministry of Transport of the People’s Republic of China (2017). Specifications for design of highway asphalt pavement. Beijing, China: JTG D50, China Communications Press.
Ministry of Transport of the People’s Republic of China (2014). Technical standard of highway engineering. Beijing, China: JTG B01, China Communications Press.
Mohammed, B., Hassan, R., and Alaswadko, N. (2018). The effect of traffic data source on deterioration rates of heavy-duty flexible pavements. Int. J. Pavement Eng. 19, 1096–1110. doi:10.1080/10298436.2016.1240562
Peng, A. P., Dan, H. C., and Yang, D. (2019). Experiment and numerical simulation of the dynamic response of bridges under vibratory compaction of bridge deck asphalt pavement. Math. Problems Eng. 2019, 1–16. doi:10.1155/2019/2962154
Perez-Acebo, H., Mindra, N., Railean, A., and Roji, E. (2019). Rigid pavement performance models by means of Markov chains with half-year step time. Int. J. Pavement Eng. 20 (7), 830–843. doi:10.1080/10298436.2017.1353390
Ren, J., Thompson, R. G., and Zhang, L. H. (2019). Impact of payload spectra of heavy vehicles on pavement based on weigh-in-motion data. J. Transp. Eng. Part B Pavements 145 (2), 04019005. doi:10.1061/jpeodx.0000099
Shi, Y., Xiang, Y. S., and Li, M. Y. (2019). Optimal maintenance policies for multi-level preventive maintenance with complex effects. IISE Trans. 51 (9), 999–1011. doi:10.1080/24725854.2018.1532135
Song, Y. Z., Wang, X. Y., Wright, G., Thatcher, D., Wu, P., Felix, P., et al. (2019). Traffic volume prediction with segment-based regression kriging and its implementation in assessing the impact of heavy vehicles. IEEE Trans. Intell. Transp. Syst. 20 (2), 232–243. doi:10.1109/tits.2018.2805817
Tang, J. J., Chen, X. Q., Hu, Z., Zong, F., Han, C., and Li, L. (2019). Traffic flow prediction based on combination of support vector machine and data denoising schemes. Phys. A Stat. Mech. its Appl. 634, 120642. doi:10.1016/j.physa.2019.03.007
Tang, Y., and Huang, S. P. (2019). Assessing seismic vulnerability of urban road networks by a bayesian network approach. Transp. Res. Part D Transp. Environ. 77, 390–402. doi:10.1016/j.trd.2019.02.003
Tarefder, R. A., and Hasan, M. A. (2016). Development of weight-in-motion data analysis software. International conference on human factors, software, and systems engineering. Adv. Intelligent Syst. Comput. 492, 13–22. doi:10.1007/978-3-319-41935-0_2
Tarefder, R., and Rodriguez-Ruiz, J. I. (2013). WIM data quality and its influence on predicted pavement performance. Transp. Lett. 5 (3), 154–163. doi:10.1179/1942786713z.00000000017
Turochy, R. E., Baker, S. M., and Timm, D. H. (2005). Spatial and temporal variations in axle load spectra and impacts on pavement design. J. Transp. Eng. 131 (10), 802–808. doi:10.1061/(asce)0733-947x(2005)131:10(802)
Wang, F. Y., Du, L. M., Li, G., and Dong, J. (2019). Research on the influencing factors of residents' travel based on bayesian network. Int. Conf. Cyber Secur. Intell. Anal. (CSIA), Shengyang, China 928, 1354–1359. doi:10.1007/978-3-030-15235-2_186
Wang, H., and Zhang, J. (2016). Development of overweight permit fee using mechanistic-empirical pavement design and life-cycle cost analysis. Transport 31 (2), 156–166. doi:10.3846/16484142.2016.1191039
Wang, S. L., Huang, W., and Lo, H. K. (2019). Traffic parameters estimation for signalized intersections based on combined shockwave analysis and bayesian Network. Transp. Res. Part C Emerg. Technol. 104, 22–37. doi:10.1016/j.trc.2019.04.023
Wang, Y. H., Hancher, D. E., and Mahboub, K. (2007). Axle load distribution for mechanistic-empirical pavement design. J. Transp. Eng. 133 (8), 469–479. doi:10.1061/(asce)0733-947x(2007)133:8(469)
Wen, H. Y., Zhang, X., Zeng, Q., and Sze, N. N. (2019). Bayesian spatial-temporal model for the main and interaction effects of roadway and weather characteristics on freeway crash incidence. Accid. Analysis Prev. 132, 105249. doi:10.1016/j.aap.2019.07.025
Keywords: traffic distribution, asphalt pavement, multisource traffic data, data fusion, video surveillance
Citation: Dan H-C, Ling C, Zhu Z, Gao L and Zeng X (2022) A data fusion approach for estimating traffic distribution characteristics of expressway: A case study of guangdong province, china. Front. Mater. 9:939579. doi: 10.3389/fmats.2022.939579
Received: 09 May 2022; Accepted: 08 July 2022;
Published: 31 August 2022.
Edited by:
Hugo M. R. D. Silva, University of Minho, PortugalReviewed by:
Bin Hong, Harbin Institute of Technology, ChinaSongtao Lv, Changsha University of Science and Technology, China
Copyright © 2022 Dan, Ling, Zhu, Gao and Zeng. This is an open-access article distributed under the terms of the Creative Commons Attribution License (CC BY). The use, distribution or reproduction in other forums is permitted, provided the original author(s) and the copyright owner(s) are credited and that the original publication in this journal is cited, in accordance with accepted academic practice. No use, distribution or reproduction is permitted which does not comply with these terms.
*Correspondence: Han-Cheng Dan, ZGFuaGFuY2hlbmdAY3N1LmVkdS5jbg==; Zhiheng Zhu, enpoODIwN0AxNjMuY29t