 Lianheng Zhao1,2
 Min Deng
 Xiang Wang
 Dongliang Huang
- 1School of Civil Engineering, Central South University, Changsha, China
- 2Key Laboratory of Heavy-Haul Railway Engineering Structure, Ministry of Education, Changsha, China
With the increasing usage of porous rocks in engineering construction, their well-performed properties (e.g., permeability and heat insulation) have attracted increasing attention from researchers in engineering geology. In nature, the vesicles in porous rocks always exhibit irregularity in morphology. This article proposes a workflow combining photogrammetry and Fourier transform to accurately acquire, characterize, and regenerate the natural pore morphology of porous rocks, including four steps: 1) initially, several 3D digital models of volcanic porous rock surfaces are reconstructed through a photogrammetry system, and the hollow pores in the surface are split into assemblies; 2) then, the 3D pore assembly is projected to a 2D reference plane with each pore being recognized and extracted; 3) the contours of a single pore are processed based on discrete Fourier transform (DFT), and a series of Fourier descriptors (mainly consist of D2, D3, and D8) are then statistically analyzed; 4) an inverse discrete Fourier transform (IDFT) is then conducted to quantitatively reconstruct the pores. Based on the earlier processes, the pores are distributed in a numerical model (rock failure and process analysis code, RFPA2D), and uniaxial compression simulations are performed to further investigate the influences of porosity and pore morphology on rock strength and stiffness. Herein, we introduce significant Fourier descriptors (i.e., D2, D3, and D8) as representations of three levels of pore morphology. Thus, 12 groups of numerical simulations considering the impact of porosity, pore orientation, D2, D3, and D8 are conducted. Results show that the porosity exerts a first-order control on the mechanical properties of rocks, while the effect of pore orientation is related to D2. All of them closely match those typically observed in previous studies. Furthermore, these simulations also highlight the influence of detailed pore morphology, such as convex hulls and subtle zigzags characterized by D3 and D8, respectively, on the rock failure process, marking that a more complicated morphology (e.g., with more convex hulls) may result in a reduction in rock strength and Young’s modulus. The proposed study provides a novel perspective on natural pore morphology together with its influence on rock strength and stiffness.
Introduction
Porous rocks, e.g., vesicular basalt, carbonates, sandstones, and tuff, are widely used in engineering constructions, mainly due to their superior quality in noise reduction and thermal insulation. However, pores always impose an adverse effect on the mechanical behavior of rocks, viz., compressive strength, elastic modulus, and Poisson’s ratio. In the early stages of research studies on the relationship between porosity and mechanical properties, researchers proposed empirical relations between porosity and compressive strength or Young’s modulus for several types of rocks, such as quartz arenites (Dunn et al., 1973), siliciclastic rocks (Vernik et al., 1993), sandstones (Ju et al., 2013), and carbonates (Farquhar et al., 1994; Chang et al., 2006). On the other hand, porosity also affects the inelastic and failure behavior of rock, such as compaction localization (Olsson and Holcomb, 2000), shear-enhanced compaction, and strain hardening (Vajdova et al., 2004; Gao and Kang, 2017; Zhao H. et al., 2018). Regarding the failure mode of porous rock, Sammis and Ashby (1986) first proposed a pore-based crack model that some researchers, Wong et al. (2006) and Lin et al. (2015), have modified and combined with more general conditions to study the influence of other pore indices, such as size, on the brittle failure of porous rocks. In early laboratory testing, Peng and Podnieks (1972) conducted a series of uniaxial tests to study the time-dependent behavior of porous tuff, interpreting various phenomena of rock fracture due to changes in strain rate. Baud et al. (2004) further studied the damage evolution and acoustic emission activity on strain localization of porous sandstones through triaxial compression tests.
Actually, the vesicles on porous rocks play a crucial role in mechanical behavior. Heap et al. (2014) and Griffiths et al. (2017) have investigated the influences of basic pore geometry on the compressive strength and stiffness of porous rocks containing circular and elliptical pores, respectively. However, the shapes of pores or vesicles in rocks show obvious irregularities in profile. With the development of X-ray microcomputed tomography (μXCT) and image processing technology, it is possible for researchers to acquire the natural pores. A large number of research studies verify the shape irregularity and spatial distribution variation of pores in on-site rock samples such as basalt, carbonates, and limestones (Cilona et al., 2014; Jeong et al., 2014; Rozenbaum and Du Roscoat, 2014; Ji et al., 2015). Based on their CT results, Bubeck et al. (2017) further studied the influences of porosity and pore orientation relating to the coring direction of samples on the rock strength, only considering the samples cored normal to bedding and parallel to bedding of a lava.
In previous studies, they either focused on the influence of basic pore morphology, such as basic shape (e.g., circular, elliptical), pore orientation, and pore aspect ratio (Heap et al., 2014; Griffiths et al., 2017; Gui et al., 2017), or performed several laboratory tests on rock samples through analyzing their pore structure (Bubeck et al., 2017). However, they seldom characterize the irregularity of comprehensive pore morphology and study the influence of detailed pore morphology such as convex hulls or corners on the rock strength and stiffness.
Based on photogrammetry, a more efficient and convenient way to visualize external contour features of objects compared to μXCT (Paixão et al., 2018; Zhao et al., 2020a; Zhao et al., 2020b; Lianheng et al., 2020), it is easier to acquire digital models of rock samples. In order to characterize and analyze the morphology of pores, herein, we introduce a workflow to extract each pore. Further processes applying discrete Fourier transform (DFT) and inverse discrete Fourier transform (IDFT) are performed in the extracted pore contour, obtaining a series of Fourier descriptors (mainly including D2, D3, and D8, as seen in similar cases for rock particles) (Mollon and Zhao, 2013; Lianheng et al., 2017) to characterize rock pore morphology and regenerate a large number of shape-controlled pores. Later, uniaxial compressive simulations using rock failure processing analysis (RFPA, Chun’an Tang, 1997) are conducted to investigate the influence of pore morphology on rock strength and Young’s modulus. Initially, several groups of numerical simulations considering the influence of porosity and pore orientation are performed and compared with previous studies (Heap et al., 2014; Bubeck et al., 2017; Griffiths et al., 2017) for verification. To demonstrate that significant Fourier descriptors (i.e., D2, D3, and D8) could be representations of pore morphology, we compared the results of D2 with data of aspect ratio from Griffiths et al. (2017), which shows a high agreement. In this case, three significant Fourier descriptors D2, D3, and D8 relating to the pore elongation, convexity, and roughness, respectively (as similarly seen in Lianheng et al., 2017), are regarded as different levels of pore morphology and their influence on rock strength and stiffness are studied.
Workflow of Rock Pore Extraction
Unlike solid objects, porous rock includes empty pores with solid rock boundaries. The pore part is a little darker than the solid rock part in the natural light, showing an inconspicuous color difference. Moreover, the color difference is actually sensitive to the numerous micropore-induced noises and the shadow darkness, causing the grayscale close and indistinguishable from their neighbor surface. With the usage of photogrammetry in geomaterials, 2D pore geometries can be obtained through 3D porous rock models with higher precision and less noise.
In this article, a workflow for acquiring the 2D pore geometry of natural volcanic rocks is proposed based on photogrammetry, mesh processing, and image recognition techniques. The main steps are as follows:
(1) taking pictures along a shooting path; (2) defining the local coordinate system and aligning photos for sparse point cloud establishment; (3) reconstructing the dense point cloud and tilt correction; (4) meshing and splitting the hollow pores and rock surface; (5) projecting the 3D mesh model of the pore assembly to the 2D plane; and (6) recognizing and extracting each pore for the subsequent Fourier analysis.
Materials and Equipment
A typical porous rock, namely, volcanic rock, is studied in this section. There are various particle shapes in volcanic rocks, for instance, slick-surfaced volcanic rock blocks and spherical volcanic rock particles. To simply obtain 2D surface pore geometries, the selected specimens of volcanic rock (Figure 1) are several smooth rock blocks from Tengchong, Yunnan Province, China. The density and coefficient of water absorption are 3.52 g/cm3 and 11.7%, respectively. All of these specimens are cuboids with uniform dimensions of 150 mm*150 mm*30 mm. For convenience, we set surfaces with dimensions of 150 mm*150 mm as the major principal surfaces and surfaces with dimensions of 150 mm*30 mm as the minor principal surfaces. In this way, there are six surfaces with approximately 70 external pores in total for a single specimen. Additionally, the pore size is mainly within the range of 2–20 mm.
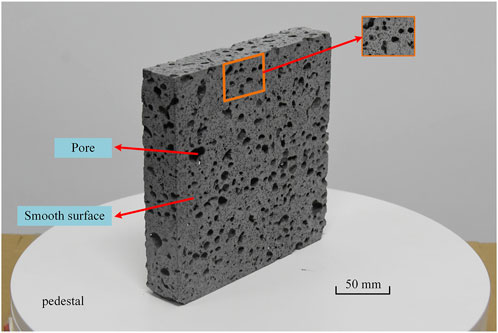
FIGURE 1. Diagram of volcanic rock specimens.
A Nikon D7200 digital camera with an AF-S DX NIKKOR 18–200 mm f/3.5–5.6G ED VR II camera lens is used to photograph the volcanic rock specimens. Moreover, a calibration board of the same size as the rock specimens is selected to define a local coordinate system. It contains a number of orderly distributed white dots surrounded by a black background (Figure 2C).
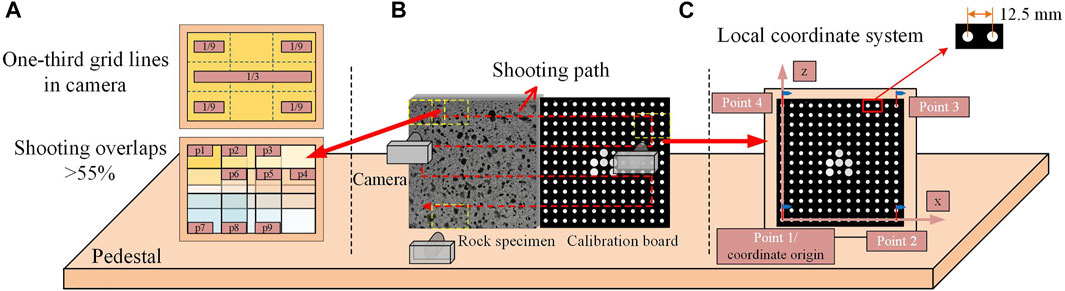
FIGURE 2. Schematic diagram of the photogrammetry framework: (A) necessary overlaps between the adjacent images both horizontally and vertically; (B) the shooting route and subjects; (C) the calibration board and establishment of local coordinate system.
Photogrammetry Framework
Therefore, a systematic photogrammetry framework is established, as Figure 2B shows, mainly including the pedestal, camera, calibration board, and some fixed supports behind. The rock specimen is placed on the center of the pedestal so that its major principal surface can be photographed by the camera. The distance between the camera and the rock specimen is approximately 0.5 m, ensuring that both the rock surface and hollow pores are in focus.
During the process of image collection, the calibration board is placed on the right of the rock specimen. A shooting route is designed to traverse all of the points of the rock surface and calibration board. There are necessary overlaps between the adjacent images both horizontally and vertically, as Figure 2A shows, to ensure that the same points are sufficient for the subsequent reconstruction (Zhu et al., 2016). In detail, the one-third grid lines in the camera are activated, and the image is divided into nine parts of equal area. Therefore, the overlaps between the horizontally adjacent images are the right (or left) 1/3 part, while between the vertically adjacent images are the bottom (or top) 1/3 part. In this way, there is at least a 55% overlap for each image.
The calibration board contributes to the establishment of a local coordinate system (Figure 2C). Its front surface along with the smooth part on the front major surface of the rock specimen is approximately in the same plane. The four white dots in the corners are selected as the major reference points. Point 1 is set as the coordinate origin, point 2 defines the positive direction of the x-axis, and point 4 defines the z-axis. Additionally, point 3 serves as a control point for error reduction.
Reconstruction of 3D Dense Point Cloud and Tilt Correction
A series of images along the shooting path is then processed through the structure from the motion (SfM) technique (Longuet-Higgins, 1981; Spetsakis and Aloimonost, 1991; Pollefeys et al., 2004; Carrivick et al., 2016), in which the camera position and pose relative to objects can be estimated. For this purpose, the 3D modeling and mapping software Agisoft Metashape (version 1.8.1, commercial, www.agisoft.com) is employed. In the Agisoft Metashape workflow, the digital images are first aligned, and a sparse point cloud is built. However, the object is originally in the global coordinate system. To shift to the local coordinate system built from the calibration board, reference points 1–4 are marked accurately in every image containing the calibration board, and the images are aligned once again. The sparse point cloud in the local coordinate system is further used for generating a dense point cloud by multi-view stereo (MVS) algorithms (Furukawa and Ponce, 2009), which are also applied in the software.
Although the local coordinate system built from the calibration board is sufficient to characterize the surface of the rock specimen, it may be slightly shifted off of the smooth surface of the rock specimen, which affects the practicality of the subsequent splitting process. For this reason, a secondary correction of the dense point cloud is conducted based on the iterative closest point (ICP) algorithm that was first proposed by Besl and McKay (1992) and applied to point cloud registration. In this article, a raster reference plane coinciding with the xOz plane is introduced. The boundary of the reference plane is approximately the same as that of the rock specimen. Figure 3A shows the dense point cloud before and after ICP algorithm processing.
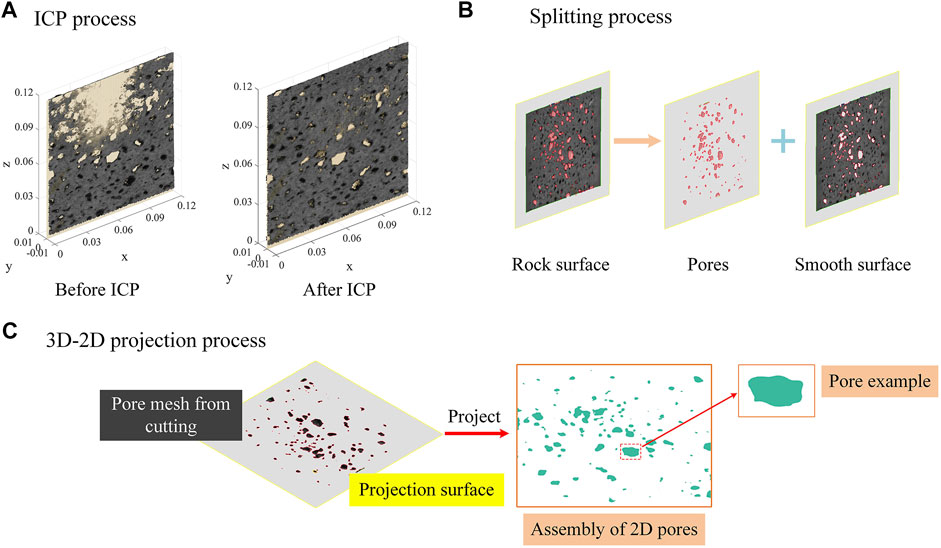
FIGURE 3. Schematic diagram of processes for rock pore extraction after obtaining the 3D model: (A) tilt correction based on ICP algorithm; (B) process of splitting the pores and smooth surface; (C) 3D-to-2D projection process of rock pores.
Meshing and Splitting the Rock Surface
Reconstructing the triangle mesh is then conducted based on the screened Poisson algorithm, a watertight surface reconstruction algorithm, proposed and modified by Kazhdan et al. (2006) and Kazhdan and Hoppe (2013). Notably, since the rock surface investigated was not sealed, some extra mesh around the real surface was reconstructed and should be deleted during the process of screened Poisson surface reconstruction. MeshLab software (www.meshlab.net), which is free for research, was applied to implement all of these processes, and a watertight mesh of the rock surface was established.
Splitting the resulting smooth surface part and hollow pore part is easy to execute along a simple plane parallel to the xOz plane. The smooth surface part is deleted, and the hollow pore part is reserved, so a number of bumps protruding from the cutting plane can be saved. These bumps consist of the 3D digital model of the volcanic pore assembly. Figure 3B shows the diagram of the splitting process.
Acquisition of 2D Projection of Rock Pores
To obtain the 2D pores from the 3D mesh model of the rock pores, projection is a convenient method. Owing to the watertight surface reconstruction algorithm, all of the pore bumps protruding from the cutting plane are semi-closed, making the 3D model easier to project. On the other hand, the 3D pores are transformed during the tilt correction of the whole dense point cloud, where the raster reference plane coincides with the xOz plane. Consequently, all of the 3D pores can be directly projected to the xOz plane and outputted to one image, in which the highest resolution was set. Figure 3C shows the process of rock pore projection from 3D bumps to 2D faces. The 3D pores split from the rock surface were projected onto a plane, and a series of 2D pores were obtained.
Recognition and Extraction of 2D Pore Contours
Combining the previous steps, all of the 2D projected pores are distributed in one region, and each single pore should be recognized and extracted for analysis. Whereas the recognition and classification of each pore during the previously described photogrammetry process are impractical, the open-source library OpenCV (version 3.4.1) embedded in MATLAB is employed to recognize and extract the 2D contours of each pore. OpenCV is a computer vision and machine learning software library that was built to provide a common infrastructure for computer vision applications and to accelerate the use of machine perception (www.OpenCV.org).
To recognize the pores, the background is set as white, and the faces are set as green in the projection process (Figure 3C). A high-resolution image is then imported to MATLAB through the “cv.imread” function, where the prefix “cv.” means that the function belongs to the OpenCV library. Therefore, the processes of graying and binarization are conducted via the functions “cv.cvtColor” and “cv.threshold,” respectively. A gray threshold of 10 is chosen for binarization. Notably, the gray threshold is flexible if only the object and background must be distinguished.
As a result, images of rock surfaces with black rock and white pores are built. The function “cv.findContours” is then applied to the binary image to identify the contours via the binary codes of 0 and 1, and then the contours are exported as coordinate points in the pixel coordinate system. Each contour, described as a series of coordinate points
Characterization and Regeneration of Rock Pores
DFT and IDFT are the two inverse mathematical processes for mutual conversion between the time domain and frequency domain. The DFT can transform the irregular time-domain (or space domain) signal into regular and periodic sine (or cosine) waves in the frequency domain with a continuous spectrum from low frequency to high frequency, where the sine (or cosine) waves depend on only the amplitude and phase angle. In contrast, IDFT can integrate those sine (or cosine) waves and transform them back into a new time-domain signal. Actually, these two methods are widely used in the problems relating to signals, whether they are periodic or non-periodic. For instance, Lianheng et al. (2017) conducted a series of studies on the reconstruction of non-periodic 2D contours of granular ballast based on IDFT. This article combined the DFT and IDFT techniques to characterize and regenerate rock pores with a similar application.
Fourier Descriptors of Real Pore Contours
The whole DFT procedure is executed in MATLAB, and the Fourier descriptors D1–D64 are calculated. Figure 4A shows a sample of 2D natural volcanic pore contours extracted and the frequency spectrum (i.e., Fourier descriptors D0–D64, where D0 and D1 are set as constants 1 and 0, respectively) after the DFT process.
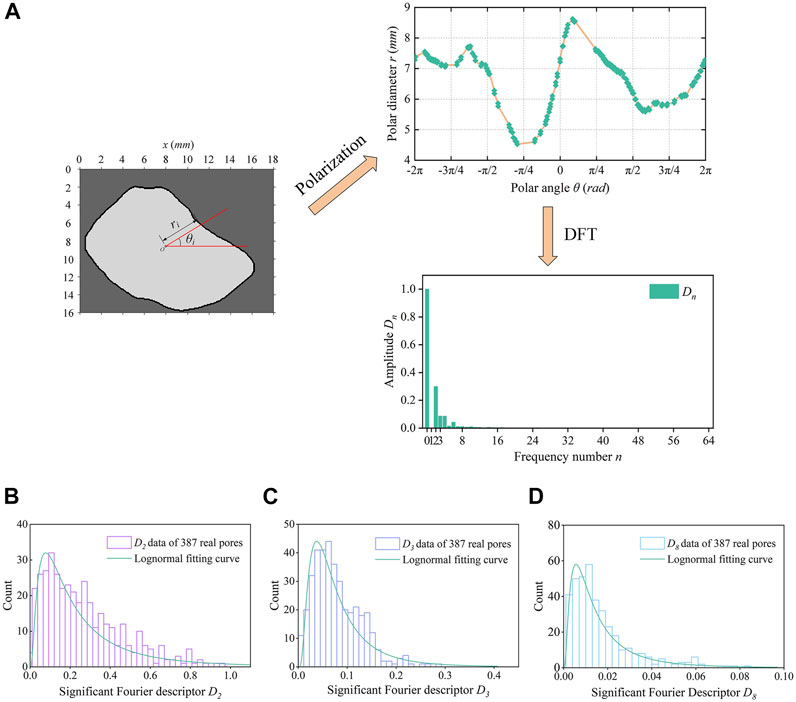
FIGURE 4. Analysis for extracted natural pores: (A) process of polarization and DFT for a natural pore example; (B)–(D) the statistical results of Fourier descriptors D2, D3, and D8, respectively, from 387 extracted pores.
Several studies (Mollon and Zhao, 2012; Lianheng et al., 2017; Zhao L. et al., 2018; Zhao et al., 2021) have shown that Fourier descriptors are related to the shape characteristics of 2D particle contours or cavity contours, especially the significant Fourier descriptors D2, D3, and D8, which represent the corresponding series of Fourier descriptors: D2, D3–D7, and D8–D64. These three types of Fourier descriptors can be related to three different levels of shape features. Specifically, D2 relates to elongation, D3–D7 relates to convexity, and D8–D64 relates to roughness. In this case, we statistically analyze the distribution of D2, D3, and D8. Figures 4B–D show the statistical histogram of significant Fourier descriptors D2, D3, and D8 from 387 real pore contours. All three descriptors have mainly lognormal distributions. On the other hand, the ranges of D2, D3, and D8 were also calculated. Instead of selecting the whole range of data, we set a confidence level of 95% and regard the left side of the confidence interval as the acceptable range for reducing extreme points. The final ranges of D2, D3, and D8 are listed in Table 1.
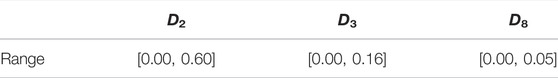
TABLE 1. The ranges of significant Fourier descriptors for pore contours.
During the IDFT, the two series of Fourier descriptors D3–D7 and D8–D64 are generally calculated through empirical formulas that are controlled by D3 and D8 (Mollon and Zhao, 2012):
Based on the numerous Fourier descriptors D1–D64 acquired earlier, the mean values of D3–D64 are calculated and divided into two categories, namely, those of D3–D7 and those of D8–D64, for fitting the parameters α and β. In this case, the fitting values of α and β are -1.246 and -1.731 with the goodness of fit R2 values of 0.724 and 0.907, respectively.
Reconstruction of 2D Pores Based on Inverse Discrete Fourier Transform
After obtaining the actual range of the significant Fourier descriptors D2, D3, and D8 for the pore contours of the real volcanic rock, we further reconstruct the 2D pores through IDFT based on reasonable Fourier descriptors, which are more similar to the real volcanic rock pore geometries than the regular pore geometries such as circles, ellipses, and squares. According to the theory of IDFT, the number of harmonics (N) is a factor that cannot be ignored (Su and Xiang, 2020). Figures 5A–G show the reconstruction results of the pore contours for N = 1, 2, 4, 8, 16, 32, and 64, and Figure 5H shows the result of the original contours. With increasing harmonic number N, the difference between the reconstructed pore contours and original pore contours decreases. Furthermore, the difference can be ignored when N = 64, which also verifies the practicality of this method. Therefore, we set 64 as the harmonic number for the IDFT process.
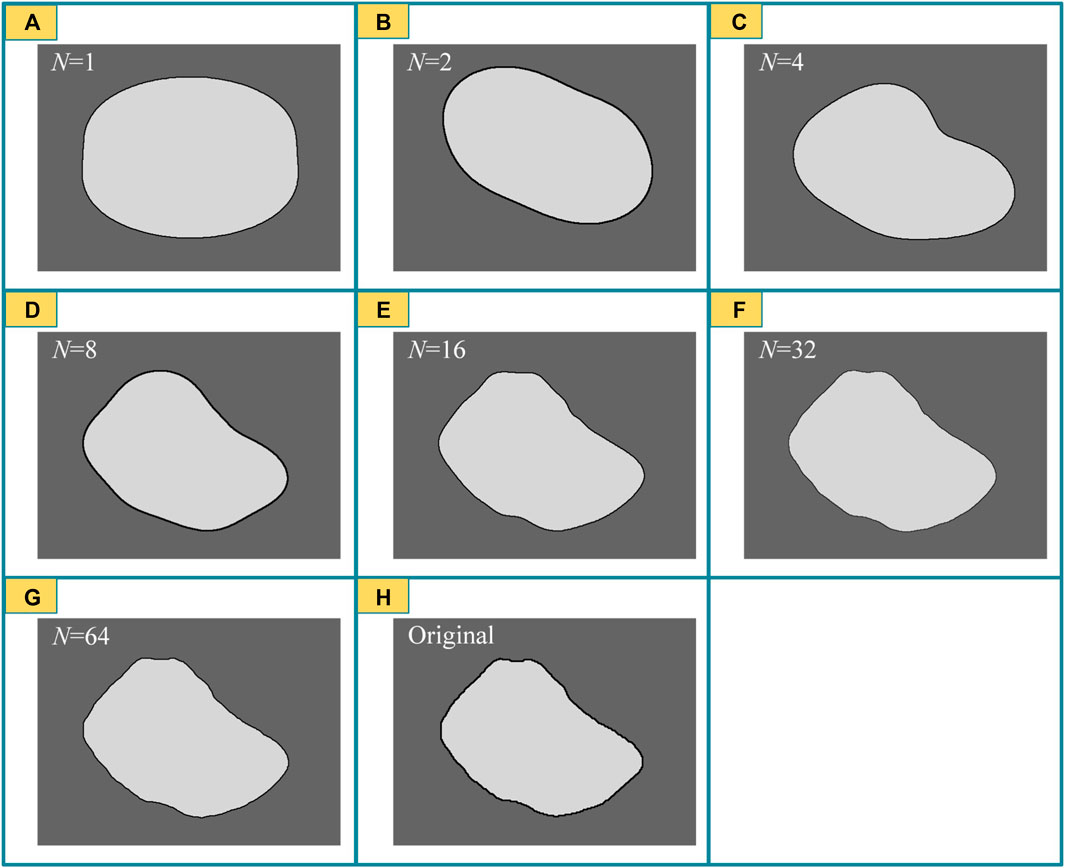
FIGURE 5. Comparison between reconstructed pores based on IDFT with different numbers of harmonics N = (A) 1; (B) 2; (C) 4; (D) 8; (E) 16; (F) 32; (G) 64; and (H) natural extracted (original) pores.
Results
Numerical Modeling Based on the RFPA Method
RFPA is a numerical solution based on the linear finite element method and allows the simulation of the progressive failure leading to rock collapse. A numerical model can become more realistic by considering the heterogeneity of the material and assigning different parameter values to different elements. The parameter value of each element in the same material statistically obeys a Weibull distribution and is controlled by the homogeneity coefficient (Tang, 1997).
The numerical models in this section are a series of 2D rectangular rock models with dimensions of 150 mm*100 mm. They are established by inputting the digital bitmap images into the RFPA code (version 2D-DIP). The number of finite elements is equal to the number of pixels. Also, the image sizes are uniformly set as 360 × 240 pixels, within the limit of the total number of elements (100,000) allowed for computational efficiency; hence, the numerical model resolution is 2.4 pixels/mm. In addition, the plane strain model has been adopted in the numerical experiments of the uniaxial compressive loading process.
Several pores reconstructed are randomly or certainly distributed that depend on the research factors in the rock range without contact based on overlapping detection algorithms, both global and local (Wang et al., 2019). However, the pores are allowed to contact the rock boundary to more closely reflect reality. The average diameter of pores is approximately 7 mm, and the number of pores contained in the numerical model is controlled by the index porosity (p). The pore direction angle (ω) is first defined as the angle between the major axis of the pore and the vertical direction (parallel to the direction of loading stress). Figure 6 shows some examples of porous rock images with different porosities, pore direction angles, and significant Fourier descriptors. The images are two-phase images, with the discrete white areas representing pores and the continuous gray part representing rock. All of the images are generated in MATLAB by combining the IDFT and an overlapping detection algorithm.
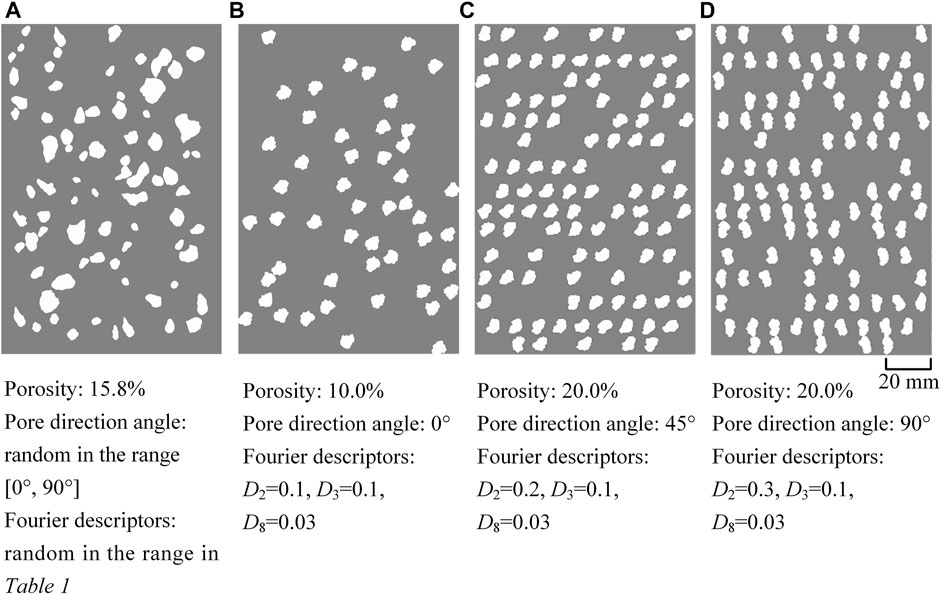
FIGURE 6. Examples of generated porous rock samples with parameters porosity of (A,B) 15.8%; (C,D) 20.0%; pore direction angle of (A) random in the range of [0°, 90°]; (B) 0°; (C) 45°; (D) 90°; Fourier descriptors D2, D3, and D8 of (A) random in the range in Table 1; (B–D) 0.1, 0.1, and 0.03, respectively.
After inputting the images into the RFPA2D code, each element is assigned material properties, mainly including Young’s modulus, the uniaxial compressive strength, and Poisson’s ratio, all of which follow Weibull distributions. The detailed mesoscopic values are listed in Table 2, where the parameters of rock mass are the same as those used in recent studies (Griffiths et al., 2017). In terms of the mechanical parameters of pores, Sammis and Ashby (1986) proposed a pore-emanating crack model, which idealizes pores as equant spheres within an elastic medium and is widely applied (Heap et al., 2014). So, in this study, the mechanical parameters of pores are set small enough instead of regarding as voids. Notably, the homogeneity index is the same as the shape parameter of the Weibull distribution. During the uniaxial compression numerical tests, the bottom boundary is set as a fixed boundary, while the other boundaries (i.e., top, left, and right boundary) are set as free boundaries.
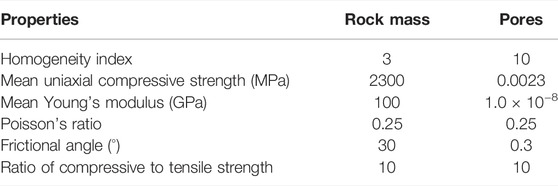
TABLE 2. The physical and mechanical properties of the numerical models utilized in RFPA2D.
To investigate the influence of pores on the failure of porous rock and verify the feasibility of the porous rock regeneration method proposed earlier, three indices, i.e., the porosity (p), pore direction angle (ω), and significant Fourier descriptors D2, D3, and D8 of the pores (D2, D3, and D8), were introduced. The significant Fourier descriptors D2, D3, and D8 reflect the different levels of two-dimensional object morphology, mainly the aspect ratio, angularity, and roughness, respectively (Lianheng et al., 2017). Correspondingly, the numerical models are then established, and the results are analyzed in the following sections. Notably, to control the influence of pore distribution, the pores are only randomly placed in models studying the factor porosity, while in models studying other factors (i.e., pore direction angle and significant Fourier descriptors D2, D3, and D8 of the pores), the pores in each group are under the same distribution. In addition, three models were performed at least for each sample configuration in groups studying the factor porosity to further minish the influence of pore distribution.
All the numerical models are divided into five parts with regard to those five factors, as listed in Table 3. A total of 12 groups of numerical experiments are conducted.
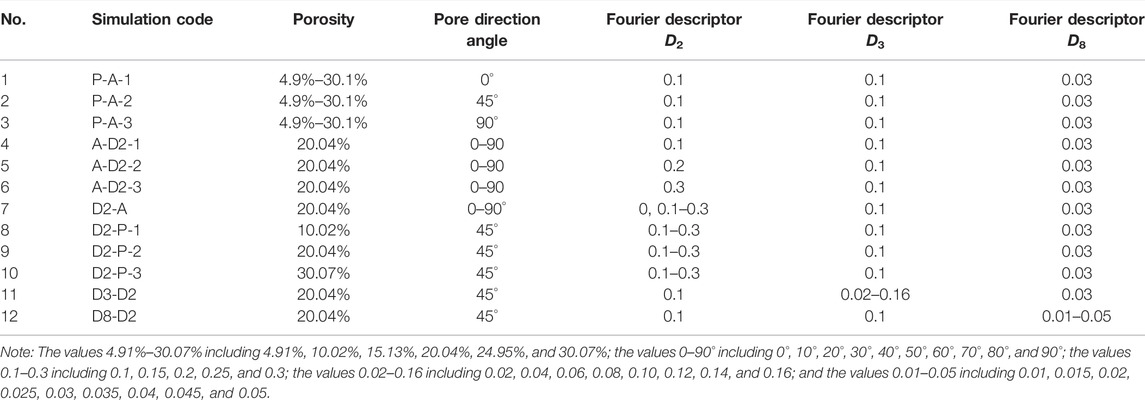
TABLE 3. The uniaxial compressive simulation projects.
Porosity is one of the main factors impacting the failure mechanism of porous rocks (Chang et al., 2006; Heap et al., 2014). To study this influence, three groups of numerical experiments (i.e., P-A-1, P-A-2, and P-A-3) with different porosities are performed, in which the significant Fourier descriptors D2, D3, and D8 are set as constants 0.1, 0.1, and 0.03. The pore direction angles ω = 0°, 45°, and 90° are assigned to those three groups, respectively, and the porosity changes from 4.91% to 30.07% at an approximately 5% interval. After establishing the numerical model, a displacement control method was employed to load the rock model parallel to its long axis, and the increments were set as 0.02 mm.
Figure 7 illustrates the compressive peak strength and corresponding Young’s modulus in the three tested groups. The value of a data point is the mean value of at least three numerical models to eliminate the influence of random pore distribution. The results show that both the compressive peak strength and Young’s modulus decrease with increasing porosity. Additionally, the results of group P-A-3 are mainly smaller than those of group P-A-1 with the same porosity, while the results of group P-A-2 fall between those of P-A-1 and P-A-3. Figure 8 shows the stress-strain curves of the three groups. In all three groups, with increasing porosity, the porous rock may reach failure earlier with a smaller strain. The failure strain is no more than 0.6% for models that are the most difficult to fail and no less than 0.3% for those models that are the easiest to fail.
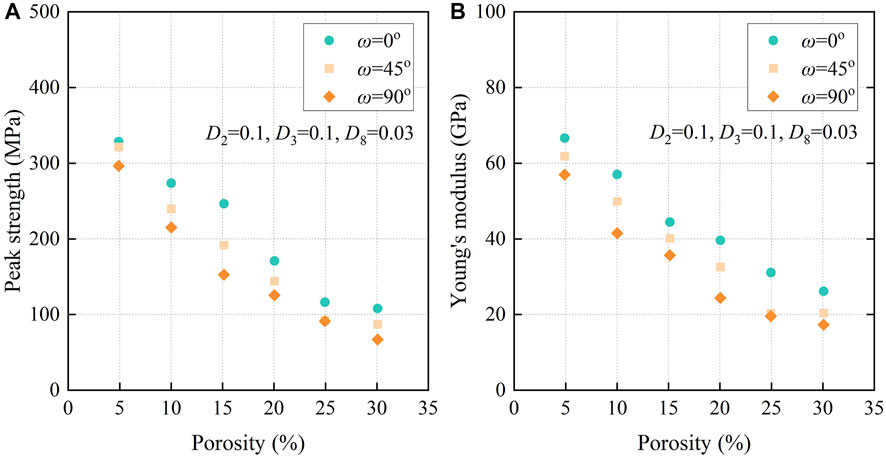
FIGURE 7. Results of (A) compressive peak strength; and (B) corresponding Young’s modulus for groups P-A-1, P-A-2, and P-A-3.
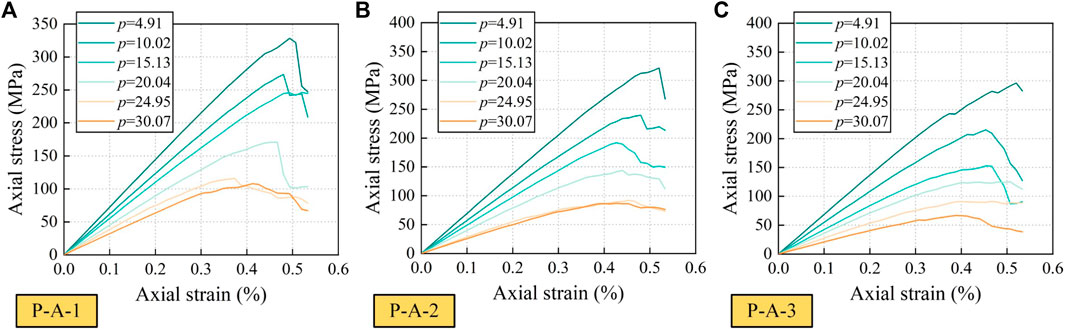
FIGURE 8. Uniaxial stress-strain curves of groups (A) P-A-1; (B) P-A-2; and (C) P-A-3.
The Influence of Pore Direction Angle
The orientation of pores in porous rock is another key factor influencing the mechanical behavior of the porous rock (Bubeck et al., 2017; Griffiths et al., 2017). In this article, the pore direction angle is defined as the angle between the major axis of the pore and the vertical direction, which is also parallel to the loading direction. Therefore, another three groups of numerical simulations (i.e., A-D2-1, A-D2-2, and A-D2-3) with the same porosity p = 20.04% and significant Fourier descriptors D3 = 0.1 and D8 = 0.03 are conducted. The D2 values of these three groups are 0.1, 0.2, and 0.3, while the pore direction angle changed from 0° to 90° at an interval of 10°.
Figure 9 shows the compressive peak strength and corresponding Young’s modulus data of the three groups. Overall, the results show that both the compressive peak strength and Young’s modulus decrease with increasing pore direction angle for these groups. On the other hand, with an increasing value of D2, the growth becomes more significant. For example, for a D2 value of 0.1, the Young’s modulus decreases from 40 to 35 GPa, while for a D2 value of 0.3, the Young’s modulus drops from 41 to 26 GPa. In addition, when the pore direction angle exceeds 70° (i.e., 70°, 80°, and 90°), in other words, the major axis of the pore is further away from the loading direction, the changes in compressive peak strength and Young’s modulus turn into steady.
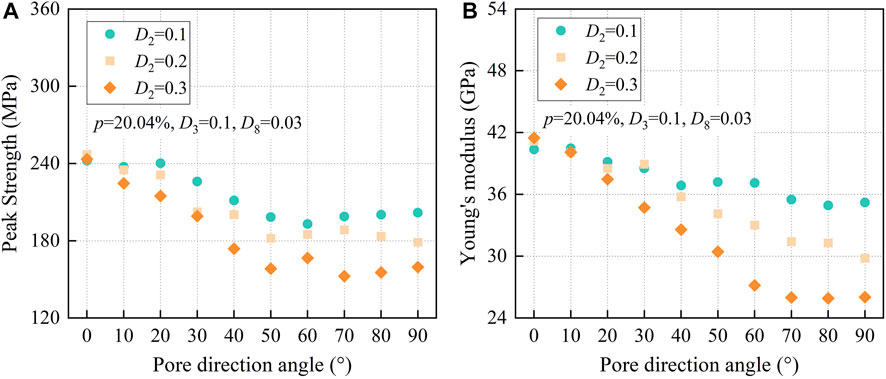
FIGURE 9. Results of (A) compressive peak strength; and (B) corresponding Young’s modulus for groups A-D2-1, A-D2-2, and A-D2-3.
The Influence of the Significant Fourier Descriptors D2, D3, and D8
The three significant Fourier descriptors D2, D3, and D8 control the morphology of two-dimensional object contours at three different levels, elongation, convexity, and roughness, gradually becoming more detailed (Lianheng et al., 2017). Recent studies have investigated the influence of the aspect ratio on the failure behavior of porous rocks with regular pores (Griffiths et al., 2017). Therefore, considering the relationship between D2 and the elongation of pores, another series of numerical models were established and performed.
In order to underline the combined effect of D2 and pore direction angle, several simulations with D2 = 0, D2 = 0.15, and D2 = 0.25 were implemented into groups A-D2-1, A-D2-2, and A-D2-3 and set the D2 as x-axis, forming the group D2-A. Figure 10 compares the compressive strength and Young’s modulus in the group D2-A. Results show that for low angles (0–10°), both strength and Young’s modulus show little growth or fluctuation as D2 increases. For higher angles (20°–90°), an increasing D2 would result in reductions in strength and Young’s modulus. In addition, the pore direction angle also relates to the range of strength and Young’s modulus. As the pore direction angle grows, the magnitude of decline becomes larger. For example, for a pore direction angle of 40°, the Young’s modulus decreases from 39 to 32 GPa, while for a pore direction angle of 90°, the Young’s modulus drops from 39 to 26 GPa. It is worth mentioning that when D2 is close to 0, the aspect ratio of the corresponding pores is close to 1, i.e., the major axis and minor axis are almost the same, where the pores have no specific direction. Hence, the results of the strength and Young’s modulus for D2 = 0 in Figure 10 share the same value.
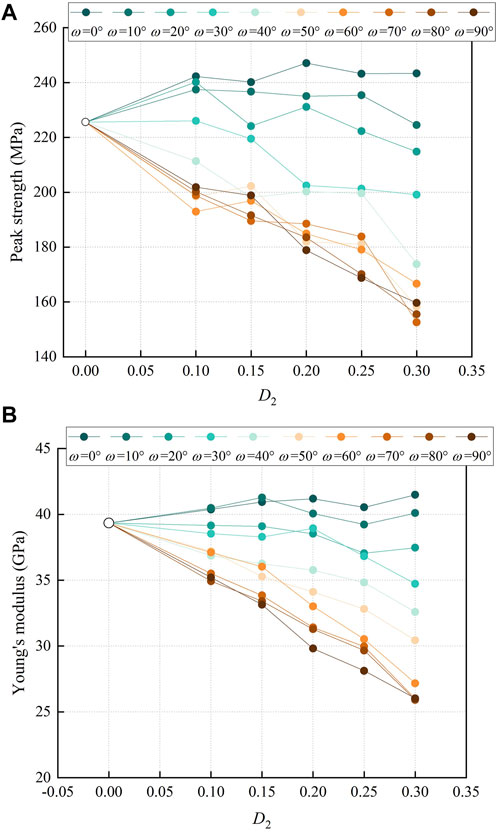
FIGURE 10. Results of (A) compressive peak strength; and (B) corresponding Young’s modulus for group D2-A.
To study the impact of D2 further, groups D2-P-1, D2-P-2, and D2-P-3 were conducted to investigate the influence of D2 through different porosities, where D3 and D8 were set as constants 0.1 and 0.03. Figure 11 shows the compressive peak strength and Young’s modulus data of groups D2-P-1, D2-P-2, and D2-P-3 with the same pore direction angle of ω = 45°, while D2 changes from 0.1 to 0.3 at an interval of 0.05. As for different D2 values with the same porosity, both the results of strength and Young’s modulus are nearly constant. This mainly means that the influence of D2 is insignificant compared with the influence of porosity on the strength and Young’s modulus.
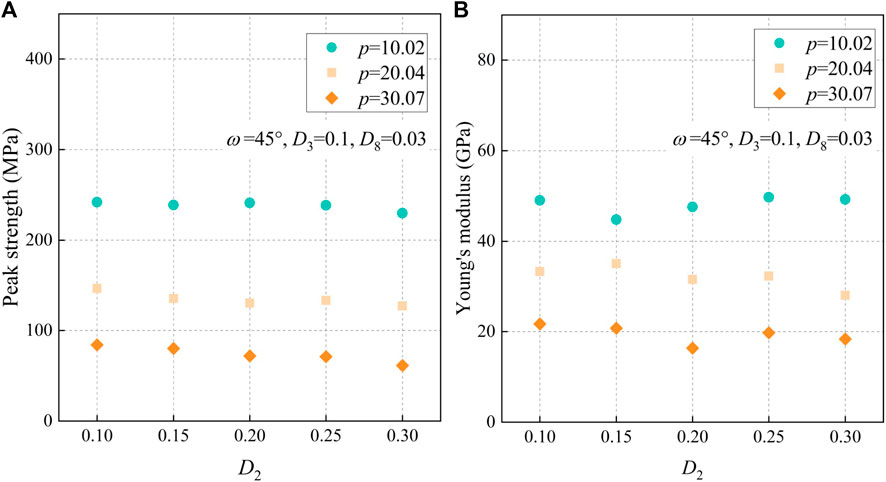
FIGURE 11. Results of (A) compressive peak strength; and (B) corresponding Young’s modulus for groups D2-P-1, D2-P-2, and D2-P-3.
Compared with D2, another two significant Fourier descriptors D3 and D8 reflect more detailed morphology of pores, i.e., convexity and roughness, respectively. To further study the effects of pore morphology on the mechanical properties of porous rocks, groups D3-D2 and D8-D2 were conducted. Figures 12A and B show results of compressive peak strength and Young’s modulus for group D3-D2, where the porosity, pore direction angle, and D8 were set as 20.04%, 45°, and 0.01, respectively. As we can see, an increasing value of D3 leads to a decrease in strength and Young’s modulus. Also, for different values of D2, the magnitude of the difference is almost similar. Figures 12C and D show results of compressive peak strength and Young’s modulus for group D8-D2, where the porosity, pore direction angle, and D3 were set as 20.04%, 45°, and 0.1, respectively. Unlike the regular trends during investigating factors D2 and D3, the results for group D8-D2 reveal more fluctuation, which has no obvious pattern.
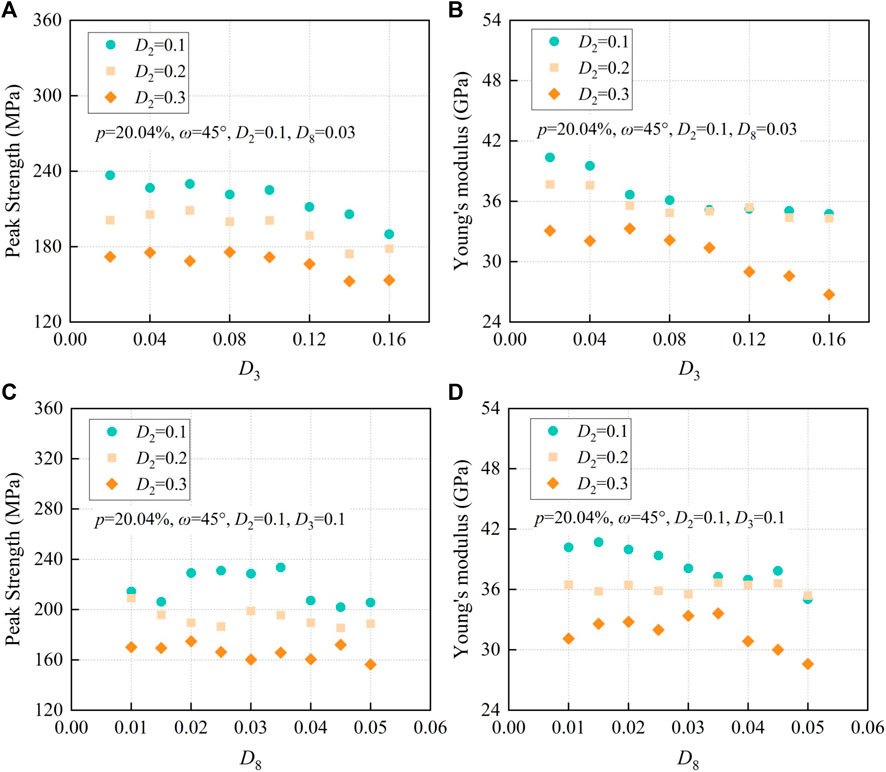
FIGURE 12. Results of (A) compressive peak strength for group D3-D2; (B) corresponding Young’s modulus for group D3-D2; (C) compressive peak strength for group D8-D2; and (D) corresponding Young’s modulus for group D8-D2.
Discussion
We have shown that the porosity, pore direction angle, and Fourier significant descriptors D2, D3, and D8 as controls on porous rocks affected the mechanical behavior under uniaxial compression loading through RPFA2D simulations. In the following section, we conduct a comparison with existing experimental and numerical data to verify our simulations and further give explanations and discussion about the influences of natural pore morphology on the mechanical properties of porous rocks.
Comparison With Previous Studies
X-ray computed tomography (X-ray CT) is a more complicated and accurate method of acquiring the realistic morphology of objects, which is, however, also expensive and time-consuming. The CT volume analysis of porous basalts conducted by Bubeck et al. (2017) reveals that the individual pores in their studied region are not spherical, which range from sub-spherical to elongated and flat ellipsoids. In this study, we introduce the significant Fourier descriptor D2 as a representation of aspect ratio, which is actually inversely proportional to aspect ratio. Table 4 compares the aspect ratio obtained by Bubeck et al. (2017) (defined as c/a for pores with semi-axes a = b >> c) in three field zones and calculated from pores controlled by index D2, which is acquired from the workflow of rock pore extraction or applied in RFPA2D simulations. It can be seen that the range of aspect ratio obtained from our porous rock specimens (0.50–1.00, converted by D2) is a little larger than that acquired by Bubeck et al. (2017) from the top and core zones of a lava in the field (0.60–1.00). In this case, the range of aspect ratio utilized in our simulations (0.65–1.00, converted by D2) is set in the range obtained by Bubeck et al. (2017) from the top and core zones of a lava in the field.
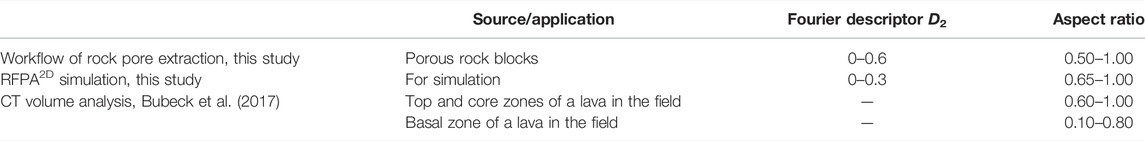
TABLE 4. Comparison between pore aspect ratio obtained by Bucket et al. (2017) and converted by D2 in this study.
To further investigate the influence of pore geometry on rock strength, Bubeck et al. (2017) carried out several uniaxial compressive tests on porous lava samples. All of their samples are classified into two types relative to the measured pore shape: (1) horizontal, oriented normal to bedding, with the pore direction angle almost 0° and (2) vertical, oriented parallel to bedding, with the pore direction angle almost 90°. Herein, we compare the results of Bubeck et al. (2017) from top and core zones on strength and Young’s moduli with our simulations. As shown in Figure 13, the porosity of samples from top zones is nearly centered between 20% and 30%, while that from core zones is centered between 10% and 15%. Compared to the results on a similar porosity, we can see that in top zones, both the strength and Young’s moduli from Bubeck’s experiments are close to that in our simulations, especially for those from the upper top zones with horizontal orientation. However, in the core zone, the experimental results are considerably lower than our simulations. The main reason for this consequence, we guess, is the discrepancy between pore distribution and pore diameter. For a lower porosity, the diversity of pore distribution on different samples is larger, causing a more discrepant influence on the strength and Young’s modulus. On the other hand, the average pore diameter in the core zone is lower than that in the top zone in Bubeck’s study, where the latter one is similar to it in our simulations. Notably, Bubeck et al. (2017) also draw the same conclusion as our study that rock samples are weaker in cases where the compression is applied parallel to the pore short axis, i.e., the pore direction angle is 90°.
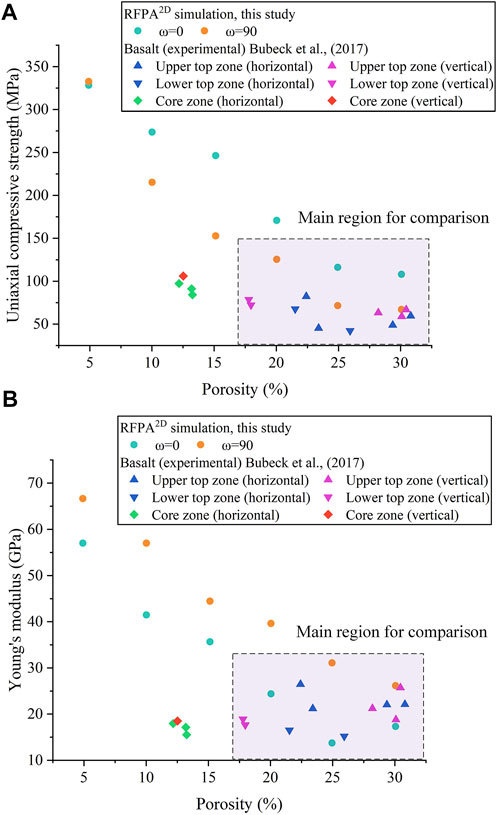
FIGURE 13. Comparison between RFPA2D simulation results with experimental data from Bubeck et al. (2017) of (A) strength and (B) Young’s modulus. The purple box highlights the main region for comparison.
Griffiths et al. (2017) also performed a series of simulations on porous rocks considering the influence of porosity, pore aspect ratio, and pore orientation through RFPA2D and compared results with several experimental data on different types of rocks. Although they simplified the pore shape as an ellipse, which could not represent the real pores well, the results are still helpful to verify our simulations. Using the same definition of pore aspect ratio (the ratio of the minor to major semi-axis) as Bubeck et al. (2017) and Griffiths et al. (2017) studied this factor in the range from 0.2 to 1.0, which has little overlap with our simulations (0.6–1.0, as mentioned earlier). In this case, we mainly compare the results considering the influence of porosity and pore orientation. As shown in Griffith’s study, with an increasing value of porosity or a growing angle between the loading direction and the major axis of a pore, the strength and Young’s modulus are dropped, which shows a high degree of agreement with our simulations. At the same time, the results considering the influence of pore aspect ratio relating to pore orientation also show a similar trend to the data presented in Griffiths et al. (2017): (1) at low angles (0°–10°), an increase in aspect ratio (decrease in D2) reduces the strength and Young’s modulus; (2) at higher angles (40°–90°), an increase in aspect ratio (decrease in D2) results in an increase in the strength and Young’s modulus, and as the angle grows, the change is more significant; (3) at intermediate angles (20°–30°), there is a little discrepancy with that in Griffith’s research, and strength and Young’s modulus first increase and then decrease as pore aspect ratio approaches unity (D2 approaches 0). While in our study, there is a small reduction as D2 increases (pore aspect ratio decreases).
The Major Influences of Porosity, Pore Direction Angle, and D2
Numerical models studying the effects of porosity, pore direction angle, and significant Fourier descriptor D2 in Figure 7 and Figures 9–11 show that pore geometry controls the strength and Young’s modulus of porous rock samples in different aspects.
In terms of porosity, results in our simulations show that strength and Young’s modulus are inversely proportional to the porosity, which is observed in several kinds of rocks such as basalts, sandstones, and limestones (Al-Harthi et al., 1999; Sabatakakis et al., 2008). For higher porosity (20%–30%), our results are in agreement with Bubeck’s experimental data (Figure 13, in the purple main region). However, for lower porosity (10%–15%), the results show a high discrepancy (Figure 13, out of the purple main region). Actually, the porosity in some of the basaltic rocks is far low (1%–4%, e.g., Mt. Etna volcano, Heap et al., 2009; Heap et al., 2010), representing the strongest part of the lava. In such cases, the rock mass strength and stiffness are principally influenced by intact rock and pore distribution. It is therefore essential to study the impact of pore distribution on low porosity rock samples through numerical modeling and be verified by experimental results.
The field lava sample observations always show that oblate vesicles are aligned and relate to bedding orientation, e.g., aligned sub-horizontally, parallel to bedding, in the basal zones of Kilauea pahoehoe lava (Bubeck et al., 2017). The results considering the different angles between the loading stress and major axis of pores (i.e., pore direction angle in this study) in our simulations demonstrated the influence on strength and Young’s modulus. It is weaker for a vertical load than a horizontal load if the pores' major axis is oriented parallel to bedding in lavas. Also, for a tilt load, as the orientation is closer to the horizontal direction, the rocks are stronger.
The pore shape also shows a large diversity on lava samples from oblate to spherical pores with the pore aspect ratio ranging from 0.1 to 1.0, which exhibits a regional relevance. For instance, from the south flank of Kilauea volcano, Hawaii (Bubeck et al., 2017), individual pores in the top and core zones typically have aspect ratios between 0.60 and 1.00, while in the basal zone, there is a mixture of large oblate geometries with aspect ratios between 0.10 and 0.40 and smaller pores with lower aspect ratios in the range of 0.41–0.80. Herein, we introduce the significant Fourier descriptor D2 as a new representation of pore shape, which is inversely proportional to the aspect ratio. Compared with porosity, the effects of D2 on strength and Young’s modulus are subtle (Figure 11). However, considering pore direction angle, mechanical results are impacted by D2 in two types: for low angles (0°–10°), they are positively related, while for higher angles (20°–90°), there is a negative correlation. Also, in Griffith’s research, there are three types of angles ranging from 0 to 90°. Overall, these rough results show an associated influence between pore direction angle and D2 (or aspect ratio) on rock strength and stiffness, which is meaningful to further investigate in follow-up studies.
Different Levels of Pore Morphology Affect Differently
Three significant Fourier descriptors (i.e., D2, D3, and D8) control the contour of a two-dimensional closed area at different levels. Several researchers applied this signal processing method (i.e., discrete Fourier transform) to characterize the 2D morphology of rock materials such as railway ballast, sand particles, coral reefs, etc. (Mollon and Zhao, 2013; Davis and Chojnacki, 2017; Lianheng et al., 2017), and verified the quantitative relation between significant Fourier descriptors and shape indices such as elongation, convexity, and roughness. If we sort out the 2D morphology into three levels: 1) basic level, which describes basic shapes such as circular, elliptical, and oblate; 2) local level, such as some large convex hulls or apparent corners; 3) global detailed level, such as some subtle zigzag and wave, the significant Fourier descriptors D2, D3, and D8 could represent them, respectively. Researchers studying the effect of detailed pore morphology on rock strength and Young’s modulus have mainly focused on the pore aspect ratio (i.e., the basic level) (Bubeck et al., 2017; Griffiths et al., 2017) and seldom considered the influence of obvious convex hulls or subtle zigzags. Results in our simulations show that D2, D3, and D8 affect the strength and Young’s modulus at distinct levels, showing a decreasing trend in terms of the influence significance (Figure 12). As mentioned earlier, D2 that relates to aspect ratio has an obvious impact on rock strength and Young’s modulus, whereas D3 exhibits a relatively small impact. In the range of 0.02–0.16, although there is a little fluctuation in some parts, for instance, the strength first decreases, then increases, and decreases again for D3 from 0.02 to 0.08 when D2 = 0.1, the overall trend is that the strength and Young’s modulus decrease as D3 increasing (Figures 12A, B). It means that D3 has the same but smaller impact on rock mechanical properties versus D2. As discussed in Heap et al. (2014), the vesicle clustering, and the stress field overlap and interaction may be more likely to occur as porosity increases. In this case, with more and more convex hulls or obvious corners (Figure 14), the possibilities of vesicle clustering and stress field overlap are larger, resulting in the reduction of strength and Young’s modulus. However, as for D8, the results are more unpredictable, and there is a discrepancy between different D2 values or even between strength and Young’s modulus. This mainly implies that D8 has little effect on the rock's mechanical properties. Therefore, we should not only focus on the influence of obvious pore shapes such as circular or elliptical but also consider the impact of local pore features such as convex hulls or apparent corners, which although has a smaller effect when studying the rock strength and stiffness.
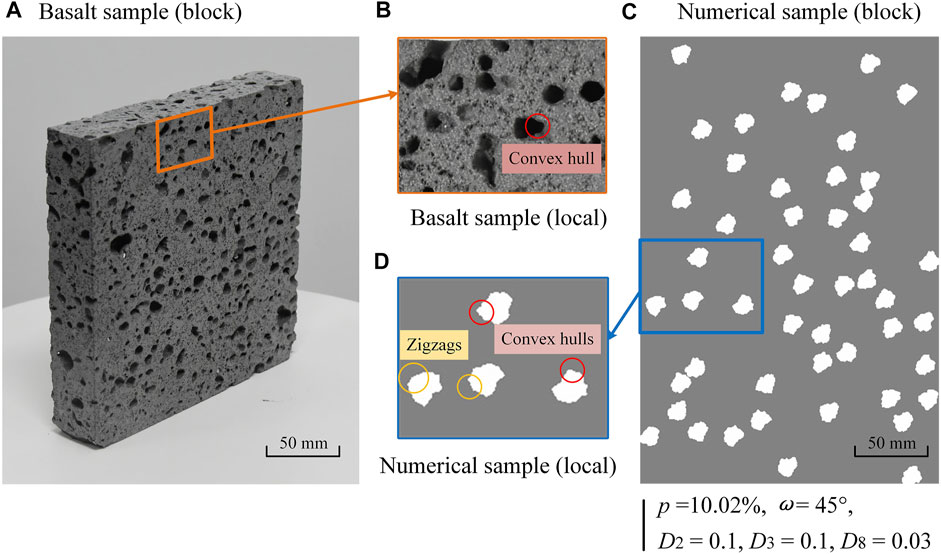
FIGURE 14. Convex hulls and zigzags of pores in natural basalts and regenerated numerical porous sample: (A) basalt sample; (B) local basalt sample; (C) numerical sample with porosity of 10.02%, pore direction angle of 45°, and Fourier descriptors D2 = 0.1, D3 = 0.1, and D8 = 0.03; and (D) local numerical samples.
Conclusion
This article proposes a novel perspective on natural pore morphology, together with its influence on rock strength and stiffness. Initially, a workflow based on photogrammetry is established to digitize rock pores. The following processes consist of dense point cloud reconstruction, meshing, splitting, projection, and extraction are then conducted to acquire a two-dimensional single pore. Adapting to discrete Fourier transform (DFT) and inverse discrete Fourier transform (IDFT), all of the pores are statistically analyzed and Fourier descriptors (mainly including D2, D3, and D8) are introduced to represent pore morphology and regenerate a series of shape-controlled pores. Next, uniaxial compressive simulations utilizing rock failure process analysis (RFPA) are then performed, considering the influence of porosity, pore orientation, and pore morphology on rock strength and stiffness. Results are eventually compared with previous experimental and numerical data. The main conclusion is as follows:
(1) Photogrammetry and OpenCV along with DFT and IDFT theory provide effective means for acquiring, characterizing, and regenerating volcanic porous rocks with irregular pores, which are more realistic. The significant Fourier descriptors D2, D3, and D8 can be used to represent different levels of shape features in rock pores.
(2) The numerical simulation results show that porosity exerts a crucial control on the rock strength and stiffness, while there is an associated influence between pore orientation and D2 value of pores (inversely proportional to pore aspect ratio), all of which are in agreement with previous studies.
(3) The detailed pore morphology, such as convex hulls or obvious corners, represented by significant Fourier descriptor D3, performs a small but cannot be ignored impact on rock strength and stiffness, that as D3 increasing (i.e., detailed morphology is more complicated), the rock strength and stiffness are dropped. This is mainly due to the fact that the vesicle clustering and stress field overlap are larger. However, the more detailed pore morphology, such as subtle zigzags and waves, represented by significant Fourier descriptor D8, has fewer effects that can be neglected.
Data Availability Statement
The original contributions presented in the study are included in the article/Supplementary Material; further inquiries can be directed to the corresponding author.
Author Contributions
LZ: conceptualization, supervision, project administration, and funding acquisition; MD: methodology, investigation, and writing-original draft; XW: conceptualization, methodology, writing-review, and editing; DH: methodology and resources; SZ: investigation. All authors have read and agreed to the published version of the manuscript. We confirm that the order of authors listed in the manuscript has been approved by all named authors.
Funding
This study was financially supported by the National Natural Science Foundation of China (grant number 51878668) and the Science and Technology Progress and Innovation Project of the Department of Transportation of Hunan Province (grant numbers 202017, 202008, and 202115).
Conflict of Interest
The authors declare that the research was conducted in the absence of any commercial or financial relationships that could be construed as a potential conflict of interest.
Publisher’s Note
All claims expressed in this article are solely those of the authors and do not necessarily represent those of their affiliated organizations, or those of the publisher, the editors, and the reviewers. Any product that may be evaluated in this article, or claim that may be made by its manufacturer, is not guaranteed or endorsed by the publisher.
References
Al-Harthi, A. A., Al-Amri, R. M., and Shehata, W. M. (1999). The Porosity and Engineering Properties of Vesicular Basalt in Saudi Arabia. Eng. Geol. 54, 313–320. doi:10.1016/s0013-7952(99)00050-2
Baud, P., Klein, E., and Wong, T.-f. (2004). Compaction Localization in Porous Sandstones: Spatial Evolution of Damage and Acoustic Emission Activity. J. Struct. Geol. 26, 603–624. doi:10.1016/j.jsg.2003.09.002
Besl, P. J., and McKay, N. D. (1992). A Method for Registration of 3-D Shapes. IEEE Trans. Pattern Anal. Mach. Intell. 14, 239–256. doi:10.1109/34.121791
Bubeck, A., Walker, R. J., Healy, D., Dobbs, M., and Holwell, D. A. (2017). Pore Geometry as a Control on Rock Strength. Earth Planet. Sci. Lett. 457, 38–48. doi:10.1016/j.epsl.2016.09.050
Carrivick, J. L., Smith, M. W., and Quincey, D. J. (2016). Structure from Motion in the Geosciences. Chicester: John Wiley & Sons. doi:10.1002/9781118895818
Chang, C., Zoback, M. D., and Khaksar, A. (2006). Empirical Relations between Rock Strength and Physical Properties in Sedimentary Rocks. J. Petroleum Sci. Eng. 51, 223–237. doi:10.1016/j.petrol.2006.01.003
Cilona, A., Faulkner, D. R., Tondi, E., Agosta, F., Mancini, L., Rustichelli, A., et al. (2014). The Effects of Rock Heterogeneity on Compaction Localization in Porous Carbonates. J. Struct. Geol. 67, 75–93. doi:10.1016/j.jsg.2014.07.008
Davis, J. D., and Chojnacki, J. D. (2017). Two-dimensional Discrete Fourier Transform Analysis of Karst and Coral Reef Morphologies. Trans. GIS 21 (3), 521–545. doi:10.1111/tgis.12277
Dunn, D. E., LaFountain, L. J., and Jackson, R. E. (1973). Porosity Dependence and Mechanism of Brittle Fracture in Sandstones. J. Geophys. Res. 78, 2403–2417. doi:10.1029/jb078i014p02403
Farquhar, R. A., Somerville, J. M., and Smart, B. G. D. (1994). “Porosity as a Geomechanical Indicator: An Application of Core and Log Data and Rock Mechanics,” in European Petroleum Conference - Proceedings (London: Society of Petroleum Engineers). doi:10.2118/28853-ms
Furukawa, Y., and Ponce, J. (2009). Accurate Camera Calibration from Multi-View Stereo and Bundle Adjustment. Int. J. Comput. Vis. 84, 257–268. doi:10.1007/s11263-009-0232-2
Gao, F., and Kang, H. (2017). Grain-Based Discrete-Element Modeling Study on the Effects of Cementation on the Mechanical Behavior of Low-Porosity Brittle Rocks. Int. J. Geomechanics 17, 04017061. doi:10.1061/(asce)gm.1943-5622.0000957
Griffiths, L., Heap, M. J., Xu, T., Chen, C.-f., and Baud, P. (2017). The Influence of Pore Geometry and Orientation on the Strength and Stiffness of Porous Rock. J. Struct. Geol. 96, 149–160. doi:10.1016/j.jsg.2017.02.006
Gui, Y. L., Zhao, Z. Y., Zhang, C., and Ma, S. Q. (2017). Numerical Investigation of the Opening Effect on the Mechanical Behaviours in Rocks Under Uniaxial Loading Using Hybrid Continuum-Discrete Element Method. Comput. Geotech 90, 55–72. doi:10.1016/j.compgeo.2017.05.021
Heap, M. J., Faulkner, D. R., Meredith, P. G., and Vinciguerra, S. (2010). Elastic Moduli Evolution and Accompanying Stress Changes with Increasing Crack Damage: Implications for Stress Changes Around Fault Zones and Volcanoes during Deformation. Geophys. J. Int. 183 (1), 225–236. doi:10.1111/j.1365-246X.2010.04726.x
Heap, M. J., Vinciguerra, S., and Meredith, P. G. (2009). The Evolution of Elastic Moduli with Increasing Crack Damage during Cyclic Stressing of a Basalt from Mt. Etna Volcano. Tectonophysics 471 (1–2), 153–160. doi:10.1016/j.tecto.2008.10.004
Heap, M. J., Xu, T., and Chen, C.-F. (2014). The Influence of Porosity and Vesicle Size on the Brittle Strength of Volcanic Rocks and Magma. Bull. Volcanol. 76, 856. doi:10.1007/s00445-014-0856-0
Jeong, Y. J., Kang, D. H., Kim, K. Y., and Yun, T. S. (2014). “Morphology-Based Characterization of 3D Anisotropy in Porous Rock: Pore Orientation,” in Geo-Congress 2014: Geo-characterization and Modeling for Sustainability (Atlanta: American Society of Civil Engineers). doi:10.1061/9780784413272.056
Ji, Y., Hall, S. A., Baud, P., and Wong, T.-f. (2015). Characterization of Pore Structure and Strain Localization in Majella Limestone by X-Ray Computed Tomography and Digital Image Correlation. Geophys. J. Int. 200, 701–719. doi:10.1093/gji/ggu414
Ju, Y., Yang, Y., Peng, R., and Mao, L. (2013). Effects of Pore Structures on Static Mechanical Properties of Sandstone. J. Geotechnical Geoenvironmental Eng 139 (10), 1745–1755. doi:10.1061/(asce)gt.1943-5606.0000893
Kazhdan, M., Bolitho, M., and Hoppe, H. (2006). “Poisson Surface Reconstruction,” in Eurographics Symposium on Geometry Processing (Goslar: The Eurographics Association). doi:10.5555/1281957.1281965
Kazhdan, M., and Hoppe, H. (2013). Screened Poisson Surface Reconstruction. ACM Trans. Graph. 32, 1–13. doi:10.1145/2487228.2487237
Lianheng, Z., Dongliang, H., Han-Cheng, D., Shuaihao, Z., and Dejian, L. (2017). Reconstruction of Granular Railway Ballast Based on Inverse Discrete Fourier Transform Method. Granul. Matter 19, 74. doi:10.1007/s10035-017-0761-2
Lianheng, Z., Dongliang, H., Jingyu, C., Xiang, W., Wei, L., Zhiheng, Z., et al. (2020). A Practical Photogrammetric Workflow in the Field for the Construction of a 3D Rock Joint Surface Database. Eng. Geol. 279, 105878. doi:10.1016/j.enggeo.2020.105878
Lin, P., Wong, R. H. C., and Tang, C. A. (2015). Experimental Study of Coalescence Mechanisms and Failure under Uniaxial Compression of Granite Containing Multiple Holes. Int. J. Rock Mech. Min. Sci. 77, 313–327. doi:10.1016/j.ijrmms.2015.04.017
Longuet-Higgins, H. C. (1981). A Computer Algorithm for Reconstructing a Scene from Two Projections. Nature 293, 133–135. doi:10.1038/293133a0
Mollon, G., and Zhao, J. (2012). Fourier-Voronoi-based Generation of Realistic Samples for Discrete Modelling of Granular Materials. Granul. Matter 14, 621–638. doi:10.1007/s10035-012-0356-x
Mollon, G., and Zhao, J. (2013). Generating Realistic 3D Sand Particles Using Fourier Descriptors. Granul. Matter 15, 95–108. doi:10.1007/s10035-012-0380-x
Olsson, W. A., and Holcomb, D. J. (2000). Compaction Localization in Porous Rock. Geophys. Res. Lett. 27, 3537–3540. doi:10.1029/2000GL011723
Paixão, A., Resende, R., and Fortunato, E. (2018). Photogrammetry for Digital Reconstruction of Railway Ballast Particles - A Cost-Efficient Method. Constr. Build. Mater. 191, 963–976. doi:10.1016/j.conbuildmat.2018.10.048
Peng, S., and Podnieks, E. R. (1972). Relaxation and the Behavior of Failed Rock. Int. J. Rock Mech. Min. Sci. Geomech. Abstr. 9 (6), 699–700. doi:10.1016/0148-9062(72)90031-9
Pollefeys, M., van Gool, L., Vergauwen, M., Verbiest, F., Cornelis, K., Tops, J., et al. (2004). Visual Modeling with a Hand-Held Camera. Int. J. Comput. Vis. 59 (3), 207–232. doi:10.1023/B:VISI.0000025798.50602.3a
Rozenbaum, O., and Du Roscoat, S. R. (2014). Representative Elementary Volume Assessment of Three-Dimensional X-Ray Microtomography Images of Heterogeneous Materials: Application to Limestones. Phys. Rev. E 89, 053304. doi:10.1103/PhysRevE.89.053304
Sabatakakis, N., Koukis, G., Tsiambaos, G., and Papanakli, S. (2008). Index Properties and Strength Variation Controlled by Microstructure for Sedimentary Rocks. Eng. Geol. 97 (1–2), 80–90. doi:10.1016/j.enggeo.2007.12.004
Sammis, C. G., and Ashby, M. F. (1986). The Failure of Brittle Porous Solids under Compressive Stress States. Acta Metall. 34 (3), 511–526. doi:10.1016/0001-6160(86)90087-8
Spetsakis, M., and Aloimonost, J. (1991). A Multi-Frame Approach to Visual Motion Perception. Int. J. Comput. Vis. 6, 245–255. doi:10.1007/bf00115698
Su, D., and Xiang, W. (2020). Characterization and Regeneration of 2D General-Shape Particles by a Fourier Series-Based Approach. Constr. Build. Mater. 250, 118806. doi:10.1016/j.conbuildmat.2020.118806
Tang, C. (1997). Numerical Simulation of Progressive Rock Failure and Associated Seismicity. Int. J. Rock Mech. Min. Sci. Geomechanics Abstr. 34, 249–261. doi:10.1016/S0148-9062(96)00039-3
Vajdova, V., Baud, P., and Wong, T.-F. (2004). Compaction, Dilatancy, and Failure in Porous Carbonate Rocks. J. Geophys. Res. 109, B05204. doi:10.1029/2003JB002508
Vernik, L., Bruno, M., and Bovberg, C. (1993). Empirical Relations between Compressive Strength and Porosity of Siliciclastic Rocks. Int. J. Rock Mech. Min. Sci. Geomech. Abstr. 30 (7), 677–680. doi:10.1016/0148-9062(93)90004-W
Wang, X., Liang, Z., Nie, Z., and Gong, J. (2019). Stochastic Numerical Model of Stone-Based Materials with Realistic Stone-Inclusion Features. Constr. Build. Mater. 197, 830–848. doi:10.1016/j.conbuildmat.2018.10.062
Wong, R. H. C., Lin, P., and Tang, C. A. (2006). Experimental and Numerical Study on Splitting Failure of Brittle Solids Containing Single Pore under Uniaxial Compression. Mech. Mater. 38, 142–159. doi:10.1016/j.mechmat.2005.05.017
Zhao, H., Zhou, S., Zhao, M., and Shi, C. (2018). Statistical Micromechanics-Based Modeling for Low-Porosity Rocks under Conventional Triaxial Compression. Int. J. Geomechanics 18 (5), 04018019. doi:10.1061/(asce)gm.1943-5622.0001121
Zhao, L., Huang, S., Zhang, R., and Zuo, S. (2018). Stability Analysis of Irregular Cavities Using Upper Bound Finite Element Limit Analysis Method. Comput. Geotechnics 103, 1–12. doi:10.1016/j.compgeo.2018.06.018
Zhao, L., Zhang, S., Deng, M., and Wang, X. (2021). Statistical Analysis and Comparative Study of Multi-Scale 2D and 3D Shape Features for Unbound Granular Geomaterials. Transp. Geotech. 26, 100377. doi:10.1016/j.trgeo.2020.100377
Zhao, L., Zhang, S., Huang, D., and Wang, X. (2020a). A Digitalized 2D Particle Database for Statistical Shape Analysis and Discrete Modeling of Rock Aggregate. Constr. Build. Mater. 247, 117906. doi:10.1016/j.conbuildmat.2019.117906
Zhao, L., Zhang, S., Huang, D., Wang, X., and Zhang, Y. (2020b). 3D Shape Quantification and Random Packing Simulation of Rock Aggregates Using Photogrammetry-Based Reconstruction and Discrete Element Method. Constr. Build. Mater. 262, 119986. doi:10.1016/j.conbuildmat.2020.119986
Keywords: porous rock, photogrammetry, Fourier transform, pore morphology, RFPA, rock strength
Citation: Zhao L, Deng M, Wang X, Huang D and Zuo S (2022) Stochastic Model Generation of Porous Rocks and Study on 2D Pore Morphology Influencing Rock Strength and Stiffness. Front. Mater. 9:956742. doi: 10.3389/fmats.2022.956742
Received: 30 May 2022; Accepted: 21 June 2022;
Published: 22 July 2022.
Edited by:
Weina Meng, Stevens Institute of Technology, United StatesReviewed by:
Tongming Qu, Swansea University, United KingdomTeguh Prayitno, Jakarta State University, Indonesia
Yingbin Zhang, Southwest Jiaotong University, China
Copyright © 2022 Zhao, Deng, Wang, Huang and Zuo. This is an open-access article distributed under the terms of the Creative Commons Attribution License (CC BY). The use, distribution or reproduction in other forums is permitted, provided the original author(s) and the copyright owner(s) are credited and that the original publication in this journal is cited, in accordance with accepted academic practice. No use, distribution or reproduction is permitted which does not comply with these terms.
*Correspondence: Xiang Wang, d2FuZ3hpYW5nX2NzdUAxMjYuY29t