 Mamoru Kitaura1*
 Artoni Kevin R. Ang2Yuta Yamamoto3Naohisa Happo4Koji Kimura5Kouichi Hayashi5,6
 Shinta Watanabe7Yuui Yokota8Yuji Ohashi9Kei Kamada9Akira Yoshikawa8,9Hisanori Yamane10Akimasa Ohnishi1
- 1Faculty of Science, Yamagata University, Yamagata, Japan
- 2Research Centre for Smart Energy Technology, Toyota Technological Institute, Nagoya, Japan
- 3Nara Institute of Science and Technology, Ikoma, Nara, Japan
- 4Graduate School of Information Science, Hiroshima City University, Hiroshima, Japan
- 5Department of Physical Science and Engineering, Nagoya Institute of Technology, Nagoya, Japan
- 6Japan Synchrotron Radiation Research Institute (JASRI), Sayo, Hyogo, Japan
- 7Institute of Innovative Research, Tokyo Institute of Technology, Meguro City, Japan
- 8Institute for Materials Research, Tohoku University, Sendai, Japan
- 9New Industry Creation Hatchery Center, Tohoku University, Sendai, Japan
- 10Institute of Multidisciplinary Research for Advanced Materials, Tohoku University, Sendai, Japan
The atomic positions and displacements of atoms around the Ta atom in piezoelectric materials Ca3TaGa3Si2O7 (CTGS) and Ca3TaGa1.5Al1.5Si2O7 (CTGAS) were investigated at 100 K by Ta-Lα X-ray fluorescence holography (XFH). The experimental atomic images were compared with the simulated ones using the crystal structures of CTGS and CTGAS, which were determined by single crystal X-ray diffractometry (SC-XRD). The atomic positions agreed between XFH and SC-XRD experiments. With the help of XFH simulation, the displacements of Ta, Ca, Si, and Ga atoms relative to the Ta atom were qualitatively analyzed using experimental atomic image intensities. The relative displacement of the Ca atom was increased by Al substitution, while those of the Ta and Ga atoms were decreased. The first principles calculation based on density-functional theory (DFT) was performed to understand bonding character between constituents. The evaluation of the crystal orbital Hamilton population (COHP) clarified that the Ca-O bond has strong ionic character different with the other bonds, suggesting that the positional shift of the Ca atom is responsible for the piezoelectricity in CTGS. The effect of Al substitution on piezoelectricity was also considered based on the change in the Ca-O bond.
Introduction
Ca3TaGa3Si2O7 (CTGS) is a well-known piezoelectric material that can operate at high temperatures (Zhang et al., 2009). This material belongs to the trigonal system of the space group P321 (No. 150) and is represented by the chemical formula A3BC3D2O14 with cations sites A-D (Wang Z. M. et al., 2003). A typical example of this type is La3Ga5SiO14 (langasite: LGS), and a number of LGS-related compounds have been synthesized so far (Uda et al., 1999; Bohm et al., 2000; Takeda et al., 2000; Jung et al., 2001; Wang Z. et al., 2003; Karaki et al., 2004; Zhou et al., 2004; Wu et al., 2005). The crystals structure of the LGS-related crystal is schematically shown in Figure 1, which was drawn using the software VESTA (Momma and Izumi, 2011). The cation sites A, B, C and D are 3e, 1a, 3f, and 2d in Wyckoff notation, respectively. The cation sites A and B represent dodecahedral and octahedral sites respectively, and C and D tetrahedral sites. The CTGS crystal has different four cations at the A-D sites, in contrast to the LGS crystal, and is called as ordered type. The piezoelectric constant of the ordered type is smaller than that of the disordered type, but the order type exhibits excellent properties such as low dielectric loss, high electric mechanical coupling coefficient, high sound velocity and temperature stability of dielectric properties, based on the homogeneity of crystal.
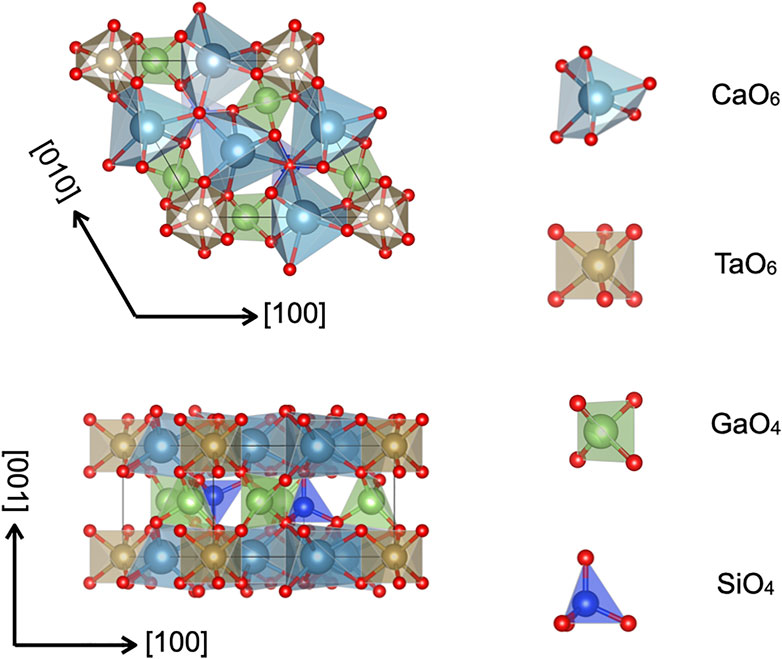
FIGURE 1. Schematic illustration of the crystal structure of CTGS.
It was reported that the piezoelectric constant d11 is changed according to the size of the A site cation (Fukuda et al., 1998). To explain this fact, the origin of the piezoelectricity in the LGS-related crystal has been proposed (Ohashi et al., 2017). As shown schematically in Figure 2, the LGS-related crystal has an A site cation in the dodecahedron and B and B′ site cations in octahedra along the [100] direction. The cation A is adjacent to the cation B, and there is an open space between A and B′ cations. When the pressure is applied in the [100] direction, the distance between A and B cations is not changed due to repulsion between cation charges, but the distance between A and B’ is changed because the A cation shifts from the barycenter toward the open space nearby. Consequently, the off-center shift of the A cation brings the piezoelectricity that the centers of the mass of positive and negative charges are in different positions. The other sites also deformed a little by applying the pressure, but they were not so important for piezoelectric properties in the LGS-related crystal.
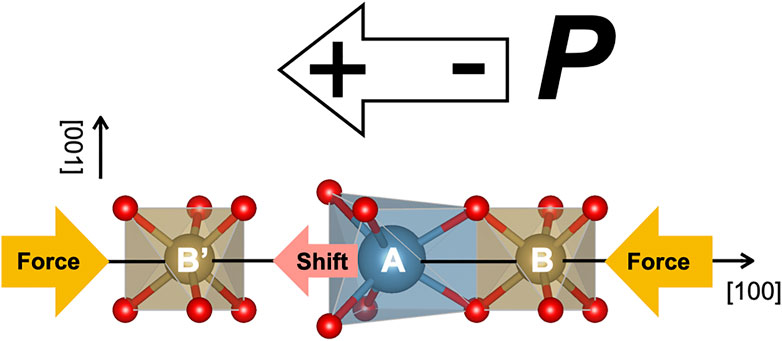
FIGURE 2. Schematic illustration representing the piezoelectricity in LGS-related compounds under the pressure application.
For the improvement of piezoelectricity, cation substitution is an effective manner in LGS-related crystals. This manner realizes the change of lattice by chemical route at ambient pressure, i.e., by chemical pressure, which affects physical properties such as electronic structure and chemical bonding of atoms in crystals (Lin et al., 2022). Furthermore, the cation substitution is significant in the sense that suppress the cost of raw materials for mass production. In the case of CTGS, the substitution of Al atom for the Ga atom at the C site led to the development of new crystals Ca3Ta(Ga1-xAlx)3Si2O14 (CTG3(1-x)A3xS) (Xiuwei et al., 2016; Yokota et al., 2017; Yokota et al., 2019; Xiong et al., 2020). The piezoelectric constant d11 was improved compared to those of CTGS. However, the Al substitution caused inhomogeneity in crystal, which were problematic in LGS-related crystals of disorder-type (Yokota et al., 2017). To clarify the change in piezoelectricity due to Al substitution, the crystal structures of CTG3(1-x)A3xS were analyzed by single crystal X-ray diffractometry (SC-XRD) (Yokota et al., 2019). The Al substitution decreased the lattice constants a and c. The position of the Si atom did not coincide with the barycenter of the D site tetrahedron in CTGS. The off-center shift of the Si atom was reduced by Al substitution. This feature was also seen for the Ga (Ga/Al) atom at the C site. The positions of Ca and Ta atoms hardly change with Al substitution. The off-center shift of Si and Ga (Ga/Al) atoms by Al substitution was correlated with the change in dielectric constant ε11s/ε0. The substitution effect of other elements on the piezoelectricity of CTGS has been little reported.
To understand the effect of Al substitution on the piezoelectricity in CTGS crystal, it is convenient to focus on the displacement of Ca atoms relative to the Ta atom. Generally, the piezoelectricity originates from the formation of electric polarization by applying the pressure. Since the magnitude of it is affected by radial distances between cation-cation and cation-anion, it is crucial to evaluate the change in relative distance between them. X-ray fluorescence holography (XFH) is one of the structure analysis methods that make it feasible (Hayashi et al., 2012). This method has the advantage to obtain three-dimensional structural information on positions and displacements of atoms around a specific element, which is hard to obtain from SC-XRD and X-ray absorption spectroscopy (XAS) experiments. This type of the method has not yet been applied to CTGS and CTG3(1-x)A3xS crystals. In the present study, XFH experiment was performed at 100 K using Ta-Lα X-ray fluorescence to investigate positions and displacements of atoms around the Ta atom in CTGS and CTG1.5A1.5S (CTGAS) crystals. SC-XRD experiment was also performed at 100 K to obtain comparative data. The positions and displacements of atoms around the Ta atom were analyzed with the help of simulation and were compared between XFH and SC-XRD. The change in lattice parameters was compared to the results of the first principles calculation based on the density functional theory (DFT). From the results obtained, the effect of Al substitution on piezoelectricity in CTGS was discussed.
Experimental and computational methods
2 inch CTGS and 1 inch CTGAS single crystals were grown from the melt in Ar + 2%O2 mixed gas by the Czochralski (CZ) method using an Iridium crucible. Details of crystal growth were described in Ref. (Yokota et al., 2017). CTGS and CTGAS single crystals with c-axis orientation were used as a seed crystal for crystal growths of CTGS and CTGAS single crystals, respectively. The growth rate was 0.3–2 mm/h. The orientations of the obtained crystals were determined according to Laue spots. The CTGS crystal and back reflection Laue image on the crystal facet are shown in Figure 3. The CTGS crystal is transparent and slightly colored. The Laue spot is clearly observed. The image reveals that the CTGS crystal has a large (001) plane. The CTGAS crystal was also of comparable quality. The CTGS and CTGAS crystals were cooled to 100 K during SC-XRD and XFH experiments.
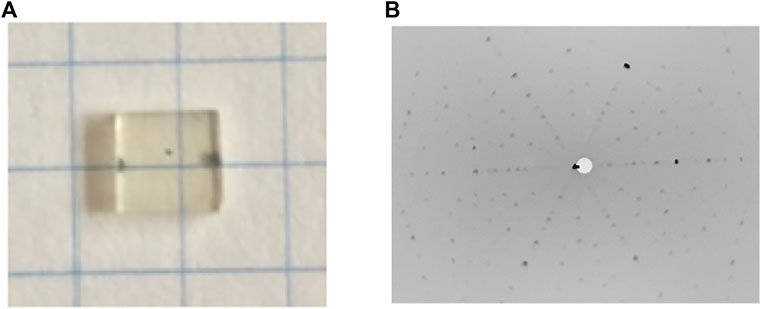
FIGURE 3. CTGS crystal (A) and back reflection Laue image on the crystal facet (B).
The SC-XRD experiment was performed using a single-crystal X-ray diffractometer with a two-dimensional CMOS detector and a Mo Kα radiation source (Bruker D8 QUEST). The APEX3 software (Bruker, 2015a) was used for the data acquisition, extraction, and reduction. Analytical absorption correction was applied to the SC-XRD intensity with the program SADABS (Bruker, 2015b). The crystal structure refinement was carried out using SHELXL-97 (Sheldrick, 2008).
Ta Lα XFH experiment were carried out at the beamline BL13XU (Tajiri et al., 2019) in SPring-8 and the BL6C in Photon Factory. An incident X-ray was monochromatized using a silicon (111) double-crystal monochromator. The intensity of the incident X-ray was detected using an ionization chamber in front of a diffractometer. The photon energy of the X-ray was set in the range of 11.0–14.5 keV above the Ta-L3 absorption edge. To obtain X-ray fluorescence holograms, Ta-L X-ray fluorescence were detected using a graphite toroidal monochromator and an avalanche photodiode (APD) detector. An Al foil was inserted in front of the APD detector for the interruption of visible scintillation light. Holograms were obtained by rotating two-axes of the diffractometer: polar angles from 0 to 75o and azimuth angles from 0 to 360o. A three-dimensional atomic image was reconstructed from eight holograms by using the 3D air image software package (Atomic Resolution Holography Analysis Tools, 2022), in which the simulation function was implemented. For comparison with the results of XFH experiment, theoretical images were obtained by the simulation with a cluster of a 50 Å-radius sphere around the Ta atom in model structures determined from SC-XRD analyses. In CTGAS, the simulation was carried out by assuming uniform distribution of Ga and Al atoms. The image intensity was calculated with the data of atomic form factors and equivalent isotropic displacement factors. The absorption effect for the incident and fluorescent X-rays was corrected.
First-principles DFT calculations were performed using the projector augmented-wave (PAW) method (Blöchl, 1994) as implemented in QUANTUM ESPRESSO code (Giannozzi et al., 2009; Giannozzi et al., 2017). The exchange-correlation potential was considered within the generalized gradient approximation (GGA) proposed by Perdew, Burke, and Ernzerhof (PBE) (Perdew et al., 1996). The cut-off energy of the plane wave was set to 40 Ry. The model of CTGAS was constructed by substituting Al for half of Ga atoms in 1 × 1×2 supercell of CTGS. There are two Ga layers and two Si layers in the [001] plane direction, in which the Ga layer has three Ga sites. The substitution of Ga atoms with Al atoms is expected random in CTGAS. However, the random distribution of Ga/Al atoms is hard to reproduce, because large scale calculations with computational resources are required. For this reason, we considered following two types of CTGAS models. One is a structure in which Ga and Al layers are alternately stacked along the c-axis direction, and the other is a structure in which two Ga and one Al layer and one Ga and two Al layer are alternately stacked along the c-axis direction. The former was more stable in toral energy calculations, so that this model was adopted in the present study. The Brillouin zone was sampled on the 4 × 4 × 6 and 4 × 4 × 4 Monkhorst–Pack grid for CTGS unit cell and 1 × 1 × 2 supercell of CTGAS. The geometry of these models was fully optimized until the residual forces and stresses dropped below 1 × 10⁻³ Ry/Bohr and 0.05 GPa, respectively. For the chemical bonding analysis, the crystal orbital Hamiltonian populations (COHPs) were calculated using LOBSTER (Maintz et al., 2016).
Results and discussion
The details of data collection and structure refinement by SC-XRD experiment are listed in Table 1. The crystal structure was refined to give the trigonal space group P321. The lattice constants of CTGS (a = 8.0976 (2) and c = 4.9780 (10) Ǻ) and CTGAS (a = 8.0553 (2) and c = 4.94460 (10) Ǻ) are comparable with previously reported one of CTGS (a = 8.107 and c = 4.982 Ǻ) and CTGAS (a = 8.057 Å and c = 4.947 Å) (Yokota et al., 2019). Table 2 shows refined atomic positions and equivalent isotropic displacement parameters. The equivalent isotropic displacement parameters in Table 2 were obtained from the anisotropic displacement parameters shown in Table 3.
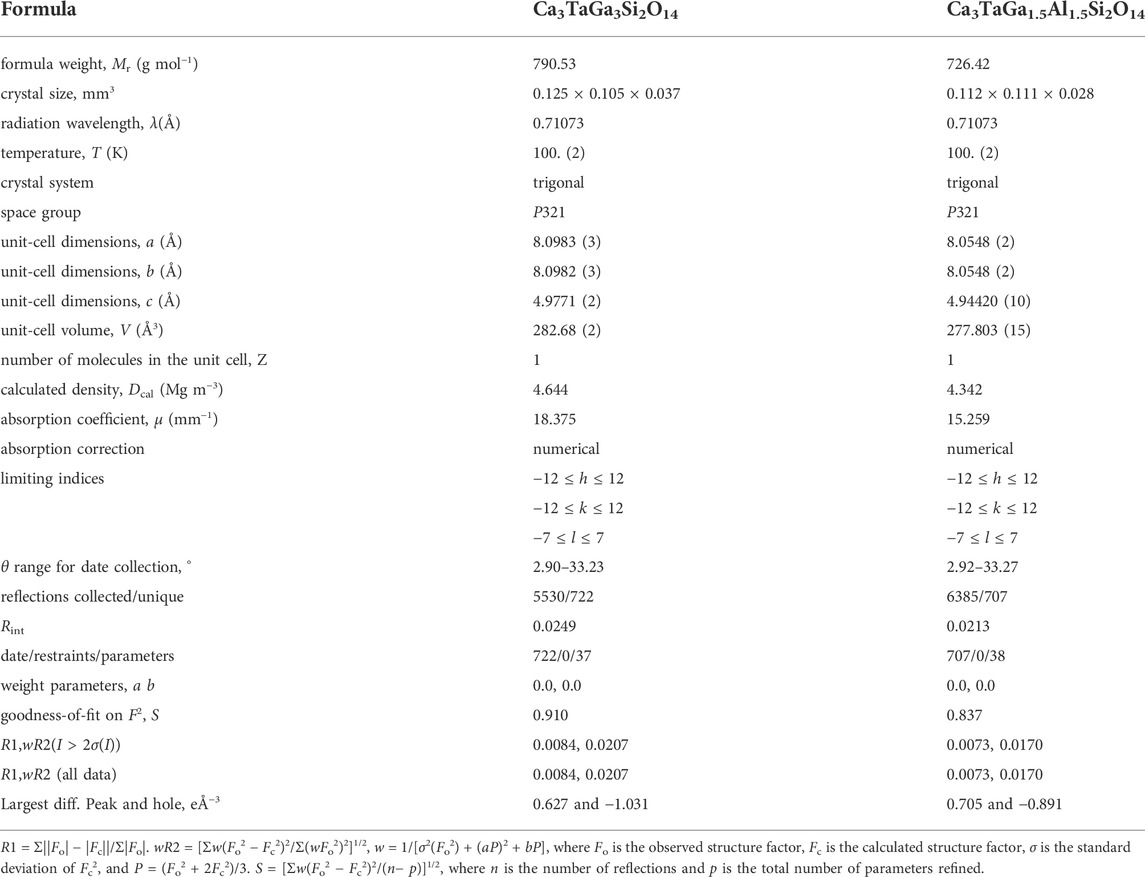
TABLE 1. Crystal data and refinement results for Ca3TaGa3Si2O14 (CTGS) and Ca3TaGa1.5Al1.5Si2O14 (CTGAS).
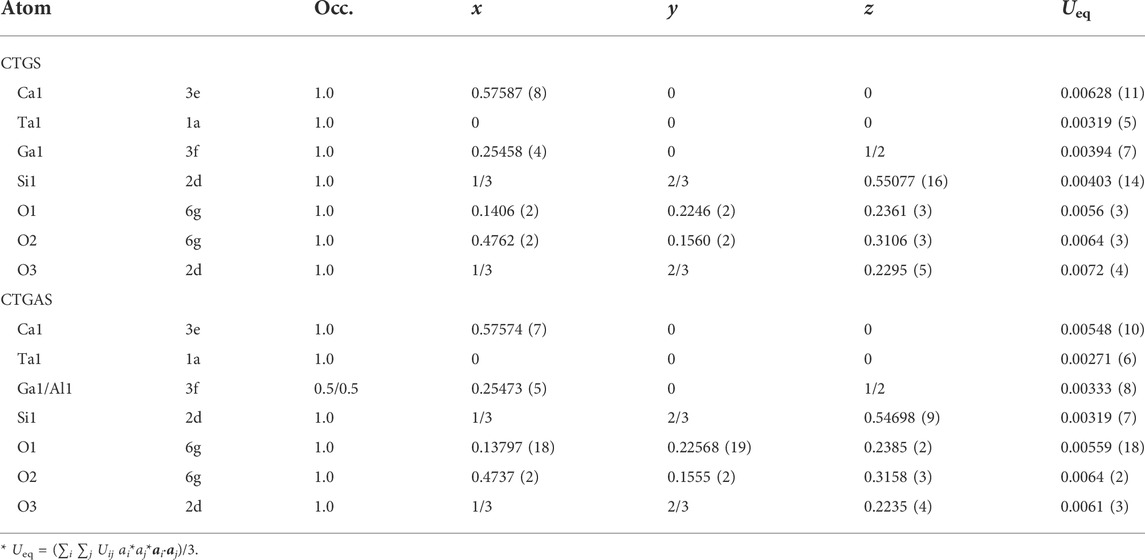
TABLE 2. Atomic positions, site occupancies, and equivalent isotropic displacement parameters (Ueq/Å2) for CTGS and CTGAS crystals.
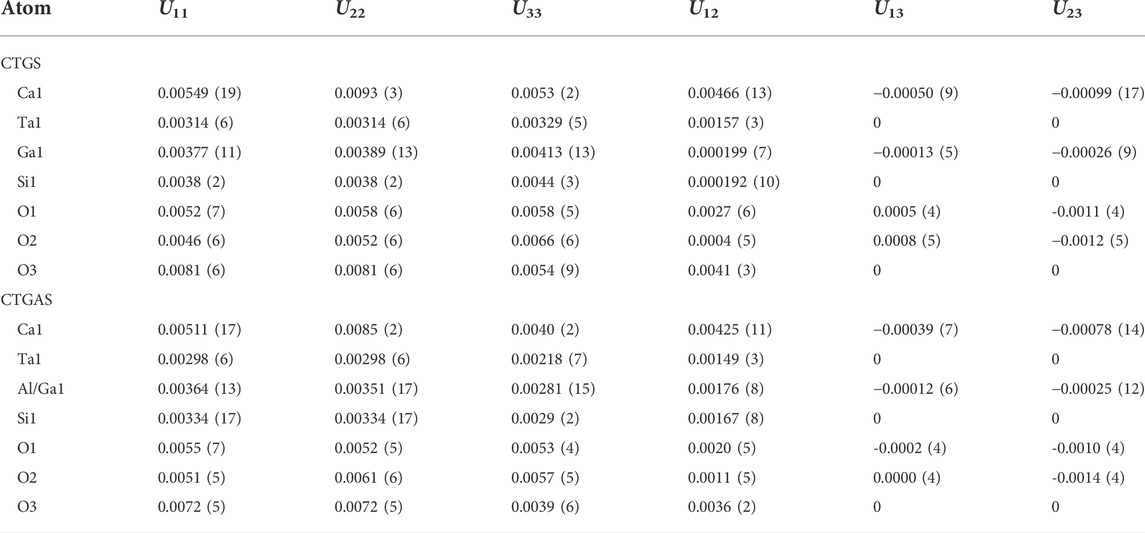
TABLE 3. Anisotropic displacement parameters (Uij/Å2) for CTGS and CTGAS.
In Table 2, equivalent isotropic displacement parameters become small by Al substitution. If the parameters are changed by the local strain due to Al substitution, the decrease in the equivalent isotropic displacement parameters indicates that the local strain is weakened by Al substitution. This is in contrast with the increase in the piezoelectric constant d11 by Al substitution. The piezoelectricity results from the formation of electric dipole due to the movement of atoms. The weakening of the local strain decreases the movement of atoms. Thus, the local strain does not affect the piezoelectric constant d11.
Next, let us exhibit the results of XFH experiment. Figures 4 shows fully symmetrized Ta-Lα X-ray fluorescence holograms of CTGS and CTGAS crystals, measured using an X-ray of 11.0 keV. These images were orthographically projected from the [001] direction. Various patterns of straight and curved lines due to X-ray standing waves can be seen in these holograms. This feature indicates that the CTGS and CTGAS crystals have good crystallinity.
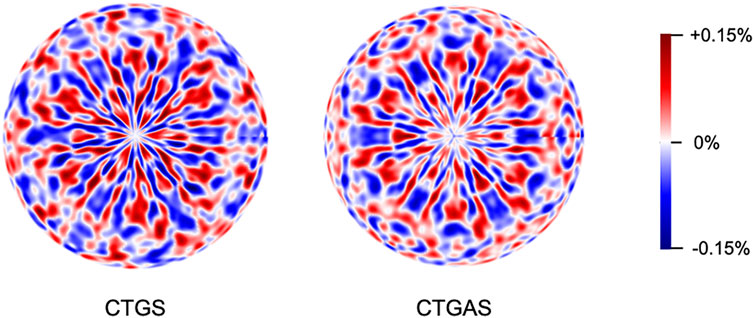
FIGURE 4. Ta-Lα X-ray fluorescence holograms of CTGS and CTGAS crystals, which were measured at 100 K under irradiation with X-rays of 11.0 keV.
The real part atomic images around the central Ta atom on the (001) plane of CTGS, analyzed from Ta‐Lα holograms, are shown in Figure 5. The upper (A-C) and lower parts (D-F) correspond to experimental and simulated images, respectively. The atomic images in (A) and (D) are composed of Ta and Ca atoms at z = 0 Å, those in (B) and (E) are of Si atoms at z = 2.24 Å, and those in (C) and (F) are of Ga atoms at z = 2.49Å. The Ta atom was placed at the center in (A) and (D). Open circles indicate the atomic positions determined by the SC-XRD analysis. The size of the open circles is not meaningful. The positions of Ca, Ta, Si, and Ga atoms were drawn by green, red, purple, and blue, respectively. The atomic images are within open circles. The XFH reproduces atomic positions determined by SC-XRD. In (A), Ta images are much stronger than Ca ones. This is reasonable because the atomic image is proportional to the atomic number. The Ca image are clearly observed at the right-hand side of the central Ta atom, but it is not observed at the left-hand side. In (D), the Ca image are observed not only at the left-hand side but also the right-hand side, but they appear weak image compared to those in (A). The intensity of the Ca image at the right-hand side in (A) was 1.11 times larger than that in (D), and thus the experimental Ca image was reproduced by the simulated one. The Si images in (B) are weak compared to those in (E). The Ga in (C) are also weaker than those in (F). No O images were found because X-ray scattering factors are small for light elements.
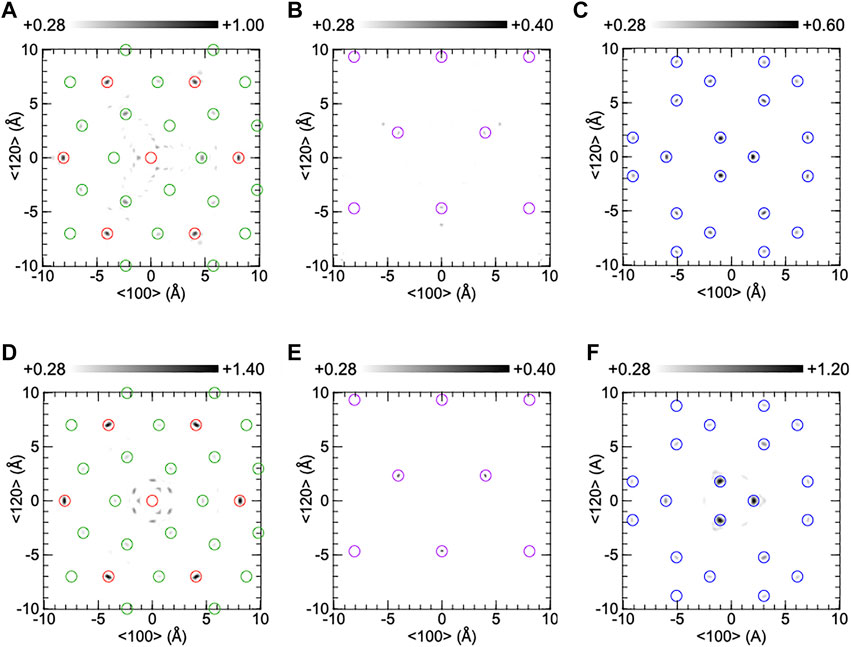
FIGURE 5. Reconstructed atomic images on the (001) plane of CTGS crystal at z = 0Å (A,D), 2.24Å (B,E), and 2.49Å (C,F). The upper and lower parts were obtained from experiment and simulation, respectively. Red, green, purple, and blue circles indicate the positions of Ta, Ca, Si, and Ga atoms.
Figure 6 shows the reconstructed atomic images around the central Ta atom on the (001) plane of CTGAS. The experimental and simulated atomic images are shown in (A)-(C) and (D)-(F), respectively. The atomic images in (A) and (D) are composed of Ta and Ca atoms at z = 0 Å, those in (B) and (E) are of Si atoms at z = 2.24 Å, and those in (C) and (F) are of Ga/Al atoms at z = 2.47Å. The atomic images are within open circles, indicating that the atomic positions are consistent between XFH and SC-XRD. The Ca and Ta images in (A) are almost the same as those of CTGS (Figure 5A). The image intensities are larger than that of CTGS. The intensity of the Ca image at the right-hand side in (A) was 0.97 times compared to that in (D), and thus the intensity of the Ca image in (A) was almost the same as that in (D). The Si images in (B) are enhanced by Al substitution, compared to those of CTGS (Figure 5B). The intensity is comparable to the that in (E). The Ga/Al images in (C) are weaker than those of CTGS (Figure 5C). This is reasonable because the substitution of Al atoms for Ga atoms decreases the Ga image intensity. The Ga/Al images in (C) is weaker than those in (F). The O images were invisible in CTGAS, similarly to CTGS.
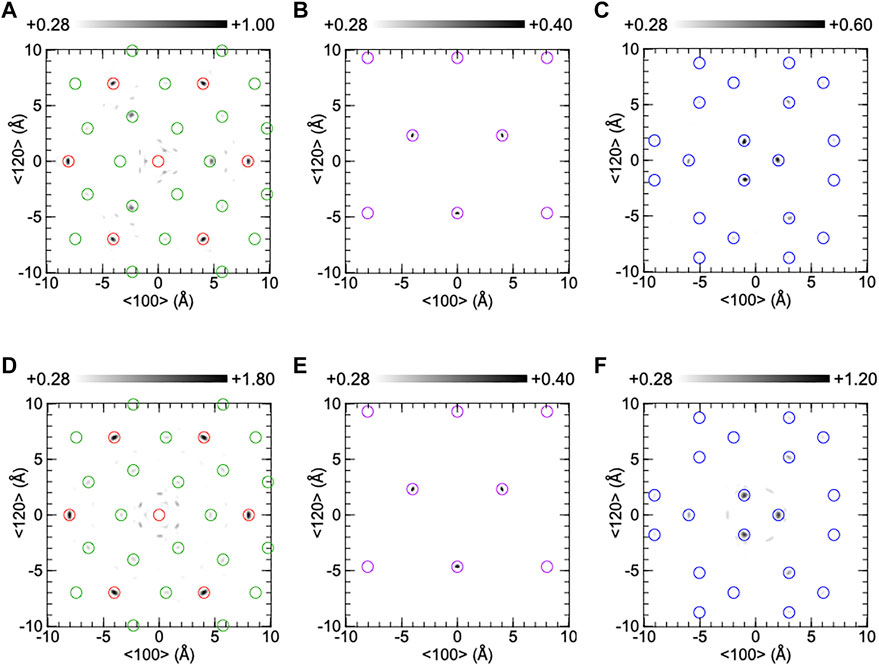
FIGURE 6. Reconstructed atomic images on the (001) plane of a CTGAS crystal at z = 0Å (A,D), 2.24Å (B,E), and 2.47Å (C,F). The upper and lower parts were obtained from experiment and simulation, respectively. Red, green, purple, and blue circles indicate the positions of Ta, Ca, Si, and Ga/Al atoms.
In Figures 5, 6, experimental atomic images were partially weaker than simulated ones. Generally, the image intensity depends on the atomic number, radial distance, and atomic displacement. Since the decrease in experimental image intensity is attributed to the increase in positional shift of an atom relative to another atom, the relative positional shift is larger than the root means square of equivalent isotropic displacement parameters in Table 2. XFH can analyze relative positional shifts of atoms precisely. This is the excellent feature of XFH. The precise analysis of such relative positional shifts is difficult to analyze with SC-XRD experiment, because it is simply provided by the convolution of equivalent isotropic atomic displacement parameters.
In Figures 5A, 6A, the intensity ratio of the experimental Ca image to the Ta image is larger than the simulated ones in Figures 5D, 6D. The enhancement in Ca image is due to the weakening of the Ta image, which is caused by a large movement of Ta atoms. The Ca image is clearly observed at the right-hand side of the central Ta atom, but the Ca image is not seen at the left-hand side. These results are different with those in Figures 5D, 6D and cannot be explained by considering equivalent isotropic displacement parameters of Ca and Ta atoms separately. The different Ca images around the central Ta atom are explained as follows. The Ca atom at the left-hand side moves largely relative to the central Ta atom. Such a large movement reduces the Ca image intensity, and thus the Ca image is not observed at the left-hand side. In contrast, the Ca atom at the right-hand side displaces in the same way as the central Ta atom. In this case, since the image intensity is not decreased, the Ca image is clearly seen at the right-hand side.
In CTGS, the experimental Si image in Figure 5B is weaker than the simulated one in Figure 5E. The Si atoms moved largely relative to the central Ta atom. In CTGAS, the experimental Si image in Figure 6B is comparable with the simulated one in Figure 6E. The relative positional shift of the Si atom was suppressed in CTGAS and is correlated with the fact that the off-center shift of the Si atom from the barycenter of a tetrahedron is suppressed by Al substitution (Yokota et al., 2019). The relative positional shift of the Ga atom was also found in CTGS (Figure 5C). However, the relative positional shift of the Ga/Al atom was not suppressed in CTGAS (Figure 6C). This is because of inhomogeneity due to the coexistence of Ga/Al atoms at the D site.
To evaluate relative positional shifts of atoms quantitatively, the absolute values of atomic images were obtained using real and imaginary parts of atomic images. The image intensities were plotted as a function of the radial distance from the Ta atom to scattered atoms. The results of CTGS and CTGAS crystals are shown in Figures 7A,B, respectively. Here, the image intensities were divided by atomic numbers of scattered atoms. Solid lines are the fit of experimental image intensities with the formula a/r, where r is the radial distance from the central Ta atom and a is the fitting parameter. It may be noticed that some data points deviate significantly from the solid lines. The deviations are larger for Ca and Ga (Ga/Al) atoms, compared to Ta atoms. The reconstructed images of Ta atoms can be seen more intensely in Figures 5, 6, compared to those of Ca and Ga (Ga/Al) atoms. The image intensities of Ca and Ga atoms (Ga/Al) may be significantly affected by the uncertainty in the image intensity from the Fourier transform using holograms with the limited θ range (Hosokawa et al., 2014). Furthermore, extrinsic factors such as local distortions may also be responsible for such deviations. The value of a includes the information on relative atomic displacement (Hayashi et al., 2016). The average value of a for each atom was determined using visible images in the range of 4-15Å. The values of a were determined for Ta, Ca, and Ga (Ga,Al) atoms in CTGS and CTGAS crystals. In CTGS, the value of a was 2.50 for Ta, 3.83 for Ca, and 2.84 for Ga. In CTGAS, the value of a was 2.92 for Ta, 3.74 for Ca, and 3.51 for Ga/Al. The value of a was not determined for the Si atom, because Si images could not be found except those nearest to the central Ta atom.
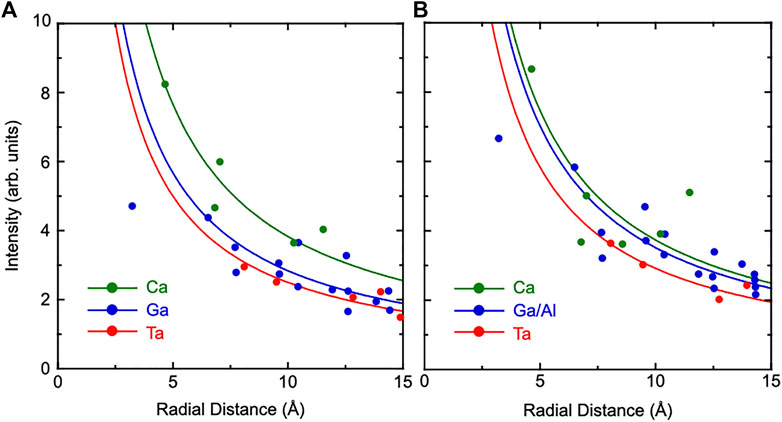
FIGURE 7. Image intensities plotted as a function of the radial distance from the Ta atom to scattered atoms in CTGS (A) and CTGAS (B) crystals. Green, red, and blue circles indicate image intensities for Ca, Ta, and Ga (Ga/Al) atoms, respectively. Solid lines are the fit of image intensities with the formula a/r, where r is the radial distance from the Ta atom and a is an adjusting parameter. All the intensities were divided by atomic numbers of scatterer atoms.
In refernces (Happo et al., 2014; Hayashi et al., 2016), the values of a were estimated using a reference sample with the same crystal structure, in which root mean square displacements of constituents were already obtained by other methods. However, such a reference sample could not be available for CTGS and CTGAS. As mentioned above, the intensities of the experimental Ca images were almost the same as those of the simulated ones. There is no serious problem in determining the values of a by using the intensities of simulation. Thus, we obtained image intensities as a function of the relative positional shift in the range of 0–0.3 Å. The values of a were estimated from the fit of image intensities with the formula a/r. The results for Ta, Ca, and Ga (Ga/Al) atoms are shown in Figure 8. The values of a are decreased with increasing relative positional shift σ. As mentioned above, the values of a were determined from the fit of experimental image intensities. In Figure 8, these values provide realistic positional shifts of Ta, Ca, and Ga (Ga/Al) atoms relative to the central Ta atom. The values of σTa-Ta, σTa-Ca, and σTa-Ga for CTGS were 0.181, 0.113, and 0.144 Å, respectively, while the values of σTa-Ta, σTa-Ca, and σTa-Ga/Al for CTGAS were 0.161, 0.127, and 0.121 Å, respectively. There is no meaning in comparing the values of σ between different atoms in CTGS and CTGAS, because the chemical environments around them are different. However, it is meaningful to compare the change of σ for each atom by Al substitution. The value of σTa-Ta is decreased by Al substitution. The value of σTa-Ga/Al is also smaller than that of σTa-Ga. In contrast, the value of σTa-Ca becomes larger by Al substitution.
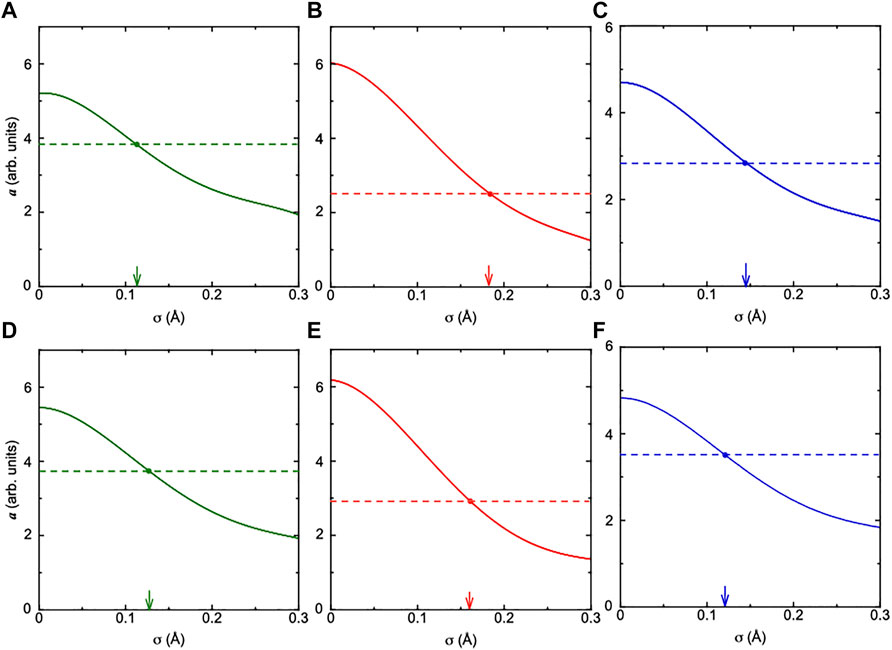
FIGURE 8. Calculated a values for Ca (green), Ta (red), and Ga (Ga/Al) (blue) atoms in CTGS (A,B,C) and CTGAS (D,E,F), plotted as a function of the atomic displacement σ. Filled circles indicate a values obtained from Figure 7.
The values of a were estimated by eliminating the image intensities of Ga (Ga/Al) atoms nearest to the central Ta atom, because their intensities were substantially below the fitting curve determined using the formula a/r (Figure 7). Furthermore, the Ca atom at the left-hand side of the central Ta atom was invisible in Figures 5B, 6B. These facts imply that the Ca atom largely moves near the central Ta atom. A similar result was obtained for CaTaO2N (Yamamoto et al., 2021). The cause for the larger movement of the Ca atom around the Ta atom in CaTaO2N was tentatively attributed to the random distribution of N and O atoms and the site exchange of Ta and Ca atoms. In CTGS and CTGAS, there is no information on the site exchange of Ca, Ta and Ga (Ga/Al) atoms. The possibility of the site exchange is excluded for CTGS and CTGAS. The radial distance between the central Ta and 1st and 2nd nearest neighbor Ga (Ga/Al) and Ca atoms will be constrained in the radial direction (Hosokawa et al., 2013), so that the atoms largely move along the angular directions. In Figures 5C, 6C, the image intensity of the nearest neighbor Ga atoms is weaker than that of the nearest neighbor Ga/Al atoms. The Al substitution suppressed the off-center shift of Ga/Al atoms and is consistent with the fact that the value of a becomes larger by Al substitution.
Figure 9 show the COHPs for Ta-O, Ca-O, Ga-O, Al-O and Si-O bonds in CTGS and CTGAS crystals. It is known that COHP is a useful physical quantity for evaluating the chemical bonding between atoms in solids. We note that the COHP indicates a bonding interaction with a negative sign and vice versa for antibonding contributions. The -COHP was plotted such that bonding and antibonding contributions are shown on the right and left, respectively. They were drawn separately for each bond. The chemical bonding between Ca and O atom is mainly composed of the ionic character, and there is few covalency, whereas the Ta-O, Ga-O, Al-O and Si-O bonds have the covalent character. Comparing the COHPs for CTGS and CTGAS, the substitution of Ga atoms with Al atoms has no significant effect on the bonding state of others. Since the bonding nature appears just below the Fermi level (EF) for the Al-O bonds in CTGAS, Al atoms stably substitute the Ga site. This feature is not satisfied for other elements in the group III, because the size and valence of them are largely different from those of Ga atoms. The maximum expansion and contraction of the Ca-O bond length is about 2%. The maximum change in bond length between other cations and oxygen is about 0.1%. The calculated bond length between Ca and O atoms is most affected by Al substitution. On the other hand, the changes in relative distances were -0.05, -0.06, -0.07, and -0.04% for Ta-Ta, Ta-Ca, Ta-Si, and Ta-Ga/Al, respectively. The relative distances between Ta and cations were almost unchanged by Al substitution. The effect of Al substitution appears as a remarkable change in the Ca-O bond distance.
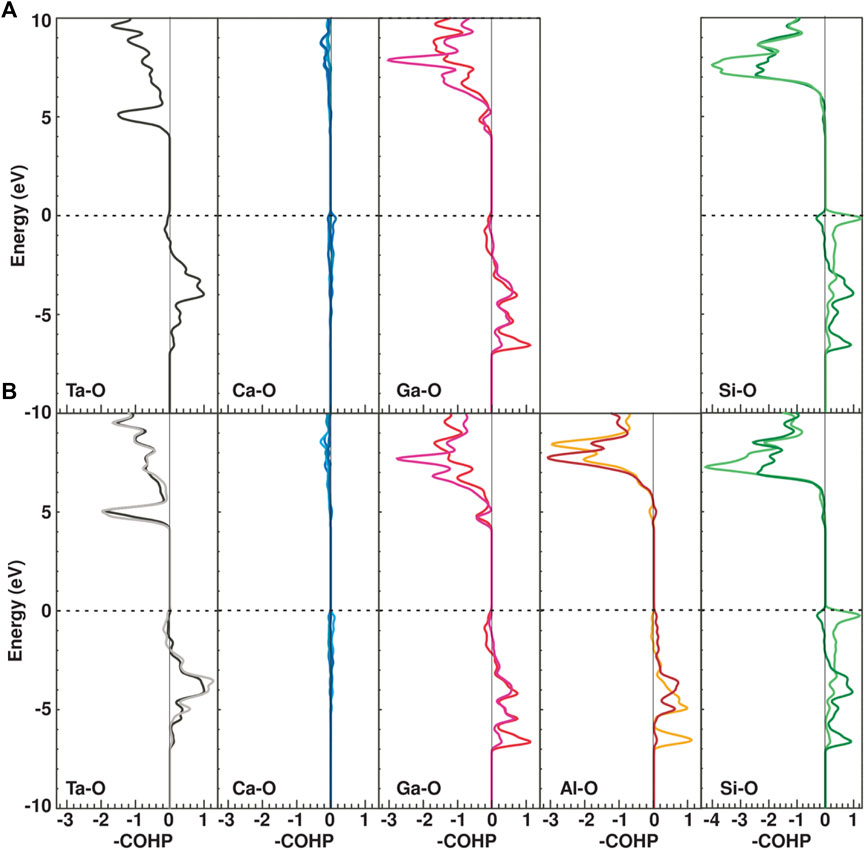
FIGURE 9. COHP per bond for Ta-O, Ca-O, Ga-O, Al-O, and Si-O bonds in CTGS (A) and CTGAS (B) crystals. The EF was indicated by horizontal broken lines and was set to zero on the vertical axes.
As mentioned above, the piezoelectricity in CTGS originates from the positional shift of the Ca atom to the adjoining open space, which is induced by applying the pressure. From the analysis of DFT calculation, the Ca-O bond was a strongly ionic character, different with the other bonds. The charge balance around the Ca atom in the dodecahedron is easily destructed by the positional shift of the Ca atom under the pressure application. The positional shift of the Ca atom is regarded as an important key to cause the piezoelectricity in CTGS. This is consistent with the existing model (Ohsato et al., 2012) schematically shown in Figure 2. In the present study, the positional shift of Ca, Ta, and Ga (Ga/Al) atoms relative to the Ta atom could be estimated quantitatively. The value of σTa-Ta was decreased by Al substitution. The value of σ is generally affected by various physical factors, i.e., thermal vibration, inhomogeneous atomic distribution, and bonding character. Assuming that the value of σTa-Ta is most influenced by the bonding character in the Ta-O bond, it is suggested that the Ta-O bond is strengthened by Al substitution. In contrast, the value of σCa-Ta was increased by Al substitution. This implies that that Ca-O bonds are weakened by Al substitution, in agreement with the results of DFT calculation. The weakening of Ca-O bonds causes larger positional shift of the Ca atom, which would be responsible for improving the piezoelectric constant d11 by Al substitution. However, since it remains unclear whether the value of σ is directly linked to the bonding character, this is an open subject to be solved in near future. To elucidate the origin of the piezoelectricity in LGS-related compounds including CTGS, the XFH experiment should be carried out under the application of physical pressure. This type of the experiment can be a unique tool to allow to observe the off-center shift of the A site atom relative to the B site atom under the application of physical pressure, much higher than chemical pressure.
Conclusion
We have investigated positions and displacements of atoms relative to the Ta atom in CTGS and CTGAS piezoelectric materials through SC-XRD and XFH experiments. The positions of atomic images reconstructed by XFH reproduced the results of SC-XRD. The intensities of atomic images did not agree with those simulated using the results of SC-XRD. The experimental images of Ta and Ga (Ga/Al) atoms were remarkably weak compared to the simulated ones. The experimental images of Si atoms were strengthened by Al substitution and were comparable with simulated ones. The experimental images of Ca atoms almost agreed with the simulated ones. The magnitudes of relative positional shifts, σ, were analyzed by simulation using a cluster model with the central Ta atom. The values of σ for Ta and Ga atoms were decreased by Al substitution, whereas that for Ca atom was increased. The evaluation of the COHP by the first principles DFT calculations revealed that the Ca-O bond has ionic character, while the others have covalent nature. These features suggested that the relative positional shift of the Ca atom generates the polarization in the A site, which is responsible for the piezoelectricity in CTGS. The improvement of the piezoelectric constant d11 by Al substitution was caused by larger positional shift of the Ca atom, which was supposed to be due to the weakening of Ca-O bond.
Data availability statement
The raw data supporting the conclusions of this article will be made available by the authors, without undue reservation.
Author contributions
MK contributed to conception and design of this study and wrote the first draft of the manuscript. AA, YYA, NH, KKI, KH performed X-ray fluorescence holography experiment and atomic image reconstuction analysis. SW evaluated COHPs for CTGS and CTGAS by first-principles DFT calculations. YYO, YO, KKA, AY perfromed the crystal growth of CTGS and CTGAS crystals and determined their crystal orientaions. HY analyzed the crystal structure parameters by single crystal X-ray diffractometry. All authors contributed to manuscript revision, read, and approved the submitted version.
Funding
This work was partially supported by JSPS Grants-in-Aid for Transformative Research Areas (A) “Hyper-Ordered Structures Sciences” via Grant Nos. 20H05878, 20H05881, 21H05546, the Cooperative Research Program of the “Network Joint Research Center for Materials and Devices”, the Research Center for Biomedical Engineering. The XFH experiments were carried out at the BL13XU of SPring8 (Proposal No. 2019B1080) and the BL6C of Photon Factory (Proposal No. 2022G079).
Acknowledgments
The authors would like to thank Mr. Yuuki Kudo and Mr. Kouichi Kawai for his assistance with XFH experiment.
Conflict of interest
The authors declare that the research was conducted in the absence of any commercial or financial relationships that could be construed as a potential conflict of interest.
Publisher’s note
All claims expressed in this article are solely those of the authors and do not necessarily represent those of their affiliated organizations, or those of the publisher, the editors and the reviewers. Any product that may be evaluated in this article, or claim that may be made by its manufacturer, is not guaranteed or endorsed by the publisher.
References
Atomic Resolution Holography Analysis Tools (2022). Atomic resolution holography analysis tools (photoelectron holography and X-ray fluorescence holography). Available at: https://ja.osdn.net/projects/tmcoca/releases/p14436. (Accessed 31st May, 2021).
Blöchl, P. E. (1994). Projector augmented-wave method. Phys. Rev. B 50, 17953–17979. doi:10.1103/physrevb.50.17953
Bohm, J., Chilla, E., Flannery, C., Fröhlich, H. J., Hauke, T., Heimann, R. B., et al. (2000). Czochralski growth and characterization of piezoelectric single crystals with langasite structure: La3Ga5SiO14 (LGS), La3Ga5. 5Nb0. 5O14 (LGN) and La3Ga5.5Ta0. 5O14 (LGT) II. Piezoelectric and elastic properties. J. Cryst. Growth 216, 293–298. doi:10.1016/s0022-0248(00)00440-1
Fukuda, T., Takeda, H., Shimamura, K., Kawanaka, H., Kumatoriya, M., Murakami, S., et al. (1998). “Growth of new langasite single crystals for piezoelectric applications, ISAF 1998,” in Proceedings of the Eleventh IEEE International Symposium on Applications of Ferroelectrics (Cat. No.98CH36245), Montreux, Switzerland, 315–319. doi:10.1109/ISAF.1998.786697
Giannozzi, P., Andreussi, O., Brumme, T., Bunau, O., Nardelli, M. B., Calandra, M., et al. (2017). Advanced capabilities for materials modelling with QUANTUM ESPRESSO. J. Phys. Condens. Matter 29, 465901. doi:10.1088/1361-648x/aa8f79
Giannozzi, P., Baroni, S., Bonini, N., Calandra, M., Car, R., Cavazzoni, C., et al. (2009). QUANTUM ESPRESSO: A modular and open-source software project for quantum simulations of materials. J. Phys. Condens. Matter 21, 395502. doi:10.1088/0953-8984/21/39/395502
Happo, N., Hayashi, K., Senba, S., Sato, H., Suzuki, M., and Hosokawa, S. (2014). Distorted and undistorted atomic sites in a ferromagnetic semiconductor Ge0.6Mn0.4Te film determined by X-ray fluorescence holography. J. Phys. Soc. Jpn. 83, 113601. doi:10.7566/jpsj.83.113601
Hayashi, K., Happo, N., Hosokawa, S., Hu, W., and Matsushita, T. (2012). X-ray fluorescence holography. J. Phys. Condens. Matter 24, 093201. doi:10.1088/0953-8984/24/9/093201
Hayashi, K., Uchitomi, N., Yamagami, K., Suzuki, A., Yoshizawa, H., Asubar, J. T., et al. (2016). Large as sublattice distortion in sphalerite ZnSnAs2 thin films revealed by x-ray fluorescence holography. J. Appl. Phys. 119, 125703. doi:10.1063/1.4945004
Hosokawa, S., Happo, N., Ozaki, T., Ikemoto, H., Shishido, T., and Hayashi, K. (2013). Extent and feature of lattice distortions around Ga impurity atoms in InSb single crystal. Phys. Rev. B 87, 094104. doi:10.1103/physrevb.87.094104
Hosokawa, S., Happo, N., Senba, S., Ozaki, T., Matsushita, T., Koura, A., et al. (2014). Local clusters in a distorted rocksalt GeTe crystal found by X-ray fluorescence holography. J. Phys. Soc. Jpn. 83, 124602. doi:10.7566/jpsj.83.124602
Jung, I. H., Yoshikawa, A., Lebbou, K., Fukuda, T., and Auh, K. H. (2001). Crystal growth by micro-pulling-down of Ca3Ga2Ge4O14 (CGG) type-Sr3Nb1− xGa3+ (5/3)xSi2O14 compounds. J. Cryst. Growth 226, 101–106. doi:10.1016/s0022-0248(01)01356-2
Karaki, T., Sato, R., Adachi, M., Kushibiki, J., and Arakawa, M. (2004). Piezoelectric properties of Ca3NbGa3Si2O14 single crystal. Jpn. J. Appl. Phys. 43, 6721–6724. doi:10.1143/jjap.43.6721
Lin, K., Li, Q., Yu, R., Chen, J., Attfield, J. P., and Xing, X. (2022). Chemical pressure in functional materials. Chem. Soc. Rev. 51, 5351–5364. doi:10.1039/d1cs00563d
Maintz, S., Deringer, V. L., Tchougréeff, A. L., and Dronskowski, R. (2016). Lobster: A tool to extract chemical bonding from plane-wave based DFT. J. Comput. Chem. 37, 1030–1035. doi:10.1002/jcc.24300
Momma, K., and Izumi, F. (2011). VESTA 3 for three-dimensional visualization of crystal, volumetric and morphology data. J. Appl. Crystallogr. 44, 1272–1276. doi:10.1107/s0021889811038970
Ohashi, Y., Kitahara, M., Kudo, T., Arakawa, M., Yokota, Y., Shoji, Y., et al. (2017). Relationships among chemical composition, lattice constants, and acoustic properties for Ca3Ta(Ga1− xAlx)3Si2O14 single crystals. J. Cryst. Growth 468, 376–381. doi:10.1016/j.jcrysgro.2016.10.040
Ohsato, H., Iwataki, T., and Morikoshi, H. (2012). Crystal structure and piezoelectric properties of four component langasite A3BGa3Si2O14 (A= Ca or Sr, B= Ta or Nb). Trans. Electr. Electron. Mat. 13, 171–176. doi:10.4313/TEEM.2012.13.4.171
Perdew, J. P., Burke, K., and Ernzerhof, M. (1996). Generalized gradient approximation made simple. Phys. Rev. Lett. 77, 3865–3868. doi:10.1103/physrevlett.77.3865
Sheldrick, G. M. (2008). A short history of SHELX. Acta Crystallogr. A 64, 112–122. doi:10.1107/s0108767307043930
Tajiri, H., Yamazaki, H., Ohashi, H., Goto, S., Sakata, O., and Ishikawa, T. (2019). A middle energy-bandwidth X-ray monochromator for high-flux synchrotron diffraction: Revisiting asymmetrically cut silicon crystals. J. Synchrotron Radiat. 26, 750–755. doi:10.1107/s1600577519003473
Takeda, H., Sato, J., Kato, T., Kawasaki, K., Morikoshi, K., Shimamura, K., et al. (2000). Synthesis and characterization of Sr3TaGa3Si2O14 single crystals. Mat. Res. Bull. 35, 245–252. doi:10.1016/s0025-5408(00)00201-4
Uda, S., Akihiro, B., and Chunyun, J. (1999). Growth of 3-inch langasite single crystal and its application to substrate for surface acoustic wave filters. Jpn. J. Appl. Phys. 38, 5516–5519. doi:10.1143/jjap.38.5516
Wang, Z., Yuan, D., Cheng, X., Shi, X., Wei, X., Duan, X., et al. (2003). Growth and characterization of Sr3NbGa3Si2O14 single crystals. J. Cryst. Growth 252, 236–240. doi:10.1016/s0022-0248(03)00826-1
Wang, Z. M., Yu, W. T., Yuan, D. R., Wang, X. Q., Xue, G., Shi, X. Z., et al. (2003). Crystal structure of tricalcium tantalum trigallium disilicon oxide, Ca3TaGa3Si2O14. Z. fur Kristallogr. - New Cryst. Struct. 218, 421–422. doi:10.1524/ncrs.2003.218.jg.421
Wu, A., Xu, J., Qian, G., and Wu, X. (2005). Growth of new piezoelectric Sr3Ga2Ge4O14 crystals by the modified Bridgman method. J. Cryst. Growth 275, e703–e708. doi:10.1016/j.jcrysgro.2004.11.116
Xiong, K., Wang, S., Tu, X., Zheng, Y., Karaki, T., and Shi, E. (2020). Growth and piezoelectric properties of large size Ca3Ta(Ga0. 5Al0. 5)3Si2O14 crystals with langasite structure. J. Cryst. Growth 535, 125525. doi:10.1016/j.jcrysgro.2020.125525
Xiuwei, F., Villora, E. G., Matsushita, Y., Kitanaka, Y., Noguchi, Y., Miyayama, M., et al. (2016). Temperature dependence of electrical resistivity, dielectric and piezoelectric properties of Ca3TaGa3− xAlxSi2O14 single crystals as a function of Al content. J. Alloys Compd. 687, 797–803. doi:10.1016/j.jallcom.2016.06.126
Yamamoto, Y., Kimura, K., Ang, A. K. R., Hirose, Y., and Hayashi, K. (2021). X-Ray fluorescence holography measurement of oxynitride thin film of SrTaO2N. e-J. Surf. Sci. Nanotechnol. 19, 99–103. doi:10.1380/ejssnt.2021.99
Yokota, Y., Kudo, T., Ohashi, Y., Inoue, K., Yoshino, M., Yamaji, A., et al. (2019). Al concentration dependence of crystal structure for Ca3Ta(Ga, Al)3Si2O14 piezoelectric single crystals. J. Solid State Chem. 277, 195–200. doi:10.1016/j.jssc.2019.06.009
Yokota, Y., Ohashi, Y., Kudo, T., Kochrikuhin, V. V., Medvedev, A., Kurosawa, S., et al. (2017). Effects of Al substitution for Ca3Ta (Ga1− xAlx)3Si2O14 piezoelectric single crystals. J. Cryst. Growth 468, 321–325. doi:10.1016/j.jcrysgro.2016.10.044
Zhang, S., Zheng, Y., Kong, H., Xin, J., Frantz, E., and Shrout, T. R. (2009). Characterization of high temperature piezoelectric crystals with an ordered langasite structure. J. Appl. Phys. 105, 114107. doi:10.1063/1.3142429
Keywords: piezoelectric materials, langasite structure, X-ray fluorescence holography, X-ray diffractometry, positional shift
Citation: Kitaura M, Ang AKR, Yamamoto Y, Happo N, Kimura K, Hayashi K, Watanabe S, Yokota Y, Ohashi Y, Kamada K, Yoshikawa A, Yamane H and Ohnishi A (2022) Atomic positions and displacements in piezoelectric materials Ca3TaGa3Si2O14 and Ca3TaGa1.5Al1.5Si2O14 investigated by Ta-Lα X-ray fluorescence holography. Front. Mater. 9:977371. doi: 10.3389/fmats.2022.977371
Received: 24 June 2022; Accepted: 03 August 2022;
Published: 02 September 2022.
Edited by:
Stefan Karlsson, RISE Research Institutes of Sweden, SwedenReviewed by:
José Manuel Recio, University of Oviedo, SpainSudeshna Samanta, University of Alabama at Birmingham, United States
Copyright © 2022 Kitaura, Ang, Yamamoto, Happo, Kimura, Hayashi, Watanabe, Yokota, Ohashi, Kamada, Yoshikawa, Yamane and Ohnishi. This is an open-access article distributed under the terms of the Creative Commons Attribution License (CC BY). The use, distribution or reproduction in other forums is permitted, provided the original author(s) and the copyright owner(s) are credited and that the original publication in this journal is cited, in accordance with accepted academic practice. No use, distribution or reproduction is permitted which does not comply with these terms.
*Correspondence: Mamoru Kitaura, a2l0YXVyYUBzY2kua2oueWFtYWdhdGEtdS5hYy5qcA==