 Zhangyang Shao1
 Yong Yang1*
 Junyi Yang1*Wenfa Zhou2Kun Liu1Zhongguo Li3
 Yu Fang4
 Xingzhi Wu4
 Yinglin Song1,2*
- 1School of Physical Science and Technology, Soochow University, Suzhou, China
- 2Department of Physics, Harbin Institute of Technology, Harbin, China
- 3School of Electronic and Information Engineering, Changshu Institute of Technology, Suzhou, China
- 4Jiangsu Key Laboratory of Micro and Nano Heat Fluid Flow Technology and Energy Application, School of Physical Science and Technology, Suzhou University of Science and Technology, Suzhou, China
On the basic that the phase object (PO) is the key optical device in the 4f imaging system, a modified high sensitivity optical nonlinear measurement technique with an absorptive homemade phase object (HPO) is reported in order to characterize the value of weak nonlinear refraction material. The absorptive HPO used in this technique is two transparent glass plates on which a liquid film between two pieces of transparent glasses is deposited and added a rotating object at the below HPO to modulate the phase of a PO. The measuring sensitivity can be improved by changing the transmittance of the absorptive HPO. Meanwhile, because the phase retardation of HPO can be continuously adjustable by modulate the rotating object, it makes the sensitivity of measurement at different wavelengths of laser optimal. Results show that the measuring sensitivity is improved 2-4 times compare with the conventional 4f imaging technique. Furthermore, the modified technique can be used to measure the spectrum of nonlinear refraction coefficients of materials at the continuous wavelength. This method further expands the 4f phase coherent imaging measurement technology, not only solves the deficiencies of the conventional phase object, but also improves the accuracy of the measurement. Experiment and theoretical analysis results are presented to validate our technique.
1 Introduction
In recent years, a large number of non-linear optical (NLO) materials have been investigated for their potential use in photoelectronic devices (Zhang et al., 2022), optical information processing (Wu et al., 2020) and optical communication (SOROKINA et al., 2016). In particular, large attention has been paid to the development of simple and accurate measurement techniques, with emphasis on measurement sensitivity. Highly sensitive measurements play a significant role in characterizing optical non-linearities, especially those of weak NLO materials. The Z-scan technique (Pereira and Correia, 2020) is a popular method to obtain information about third- and higher order non-linearities. The method provides estimate of NLO and is based on the analysis of the distortion of a beam passing through non-linear materials. However, high quality Gaussian beams are not readily available. Hence, Zhao et al. reported that the use of the s-called top-hat (Zhao and Palffy-Muhoray, 1993) beams instead of Gaussian beams in Z-scan setups improves the measurement sensitivity by a factor of 2.5. However, the technique requires multiple irradiations by strong laser pulses to obtain the complex non-linear NLO of optical materials and involves measurements at focal plane. This may damage the sample, especially for photo-sensitive materials, and suggests the use of single-shot techniques, which would overcome the above difficulties. One powerful technique is based on single-shot 4f coherent imaging system (Cherukulappurath et al., 2004). The method involves a different spatial distribution of beams compared to Z-scan, and allows one to obtains accurate measurements of the intensity when equipped with a charge-coupled device (CCD) camera. The setup is based on the Zernike spatial filtering principle to transform the phase changes caused by non-linear refraction into light intensity changes in the plane. Other advantages of the method include the simplicity of the alignment, and the high measurement sensitivity. Furthermore, as it happens for Z-scan experiments, sensitivity may be improved using top-hat beams instead of Gaussian beams (Cherukulappurath et al., 2004). Boudebs et al. reported a 4f non-linear-imaging technique with improved sensitivity and involving a phase object (NIT-PO) (Boudebs and Cherukulappurath, 2004) to analyze the sign of non-linear index. Later on, the technique has been modified with considerable effort, see e.g., Yang et al. ( Yang et al., 2017) about Z-scan technique with absorptive PO. The sensitivity of the technique can be improved by the changing absorption index of PO which, however, cannot be changed arbitrarily. In addition, an important limitation of 4f NIT-PO techniques employed so far, is the impossibility to use the same PO with a continuous spectrum, as the phase retardation of PO cannot be changed arbitrarily. Indeed, it is significant for the 4f imaging technique to modulate phase and there are piezoelectric ceramic and phase modulators to this aim. However, those devices are expensive and their use complex. Therefore, an alternative simple method with high precision would be exceedingly welcome.
In this paper, the use with a homemade phase object (HPO) added to the 4f imaging technique to and put forward a high sensitivity measurement technique. The materials of the HPO are readily available and the manufacturing is simple. Additionally, our HPO may be used with pulses with a continuous spectrum. The non-linearity of CS2 and absolute ethanol are considered in this new technique in order to assess its sensitivity and verify the enhancement compared to traditional 4f imaging techniques. Our results confirm that the use of a wideband (The phase object is suitable for optical non-linear measurement at multiple wavelengths) HPO improves the sensitivity of 4f imaging systems and may be used with beams characterized by a continuous spectrum.
2 Theoretical analysis and model
Our HPO is composed of two round pieces of transparent glass with a liquid film in between. The liquid film required by the homemade phase object (HPO) in the technique can be any pure absorptive or transparent liquid. The black ink is used to be a liquid film in our method. The radius is
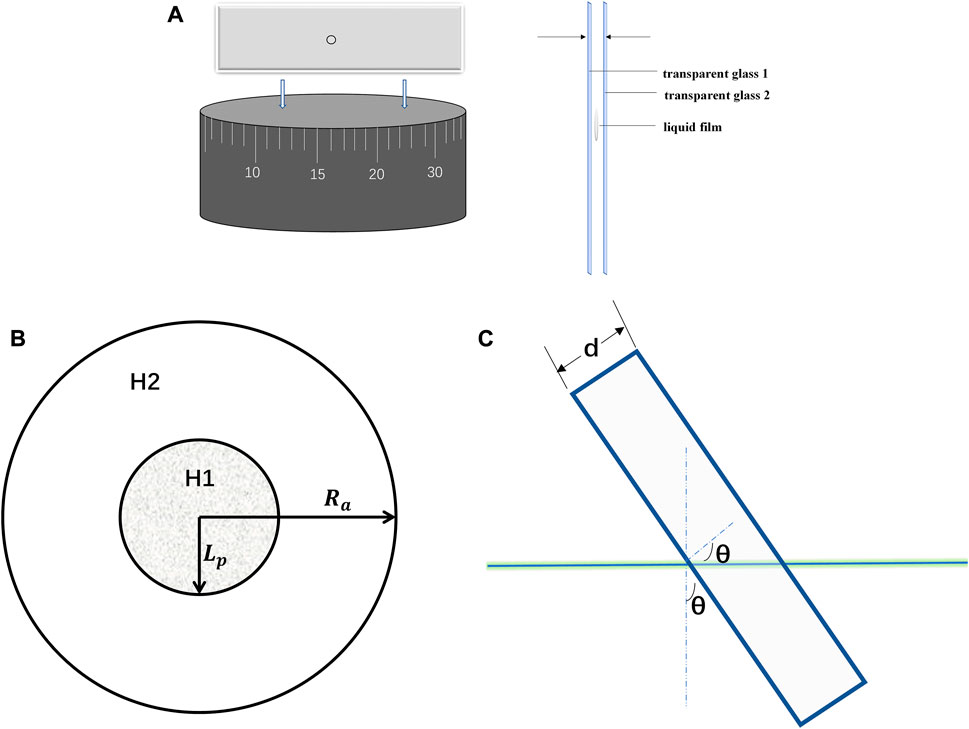
FIGURE 1. (A,B) Schematic of the HPO used in the 4f imaging system. (C) Schematic of the HPO changing the angle of the rotating object.
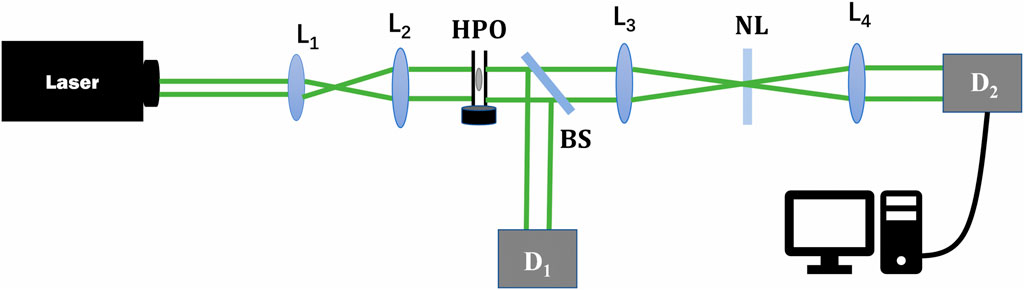
FIGURE 2. Schematic of 4f imaging system with HPO. L1-L4, lenses; BS, beam splitter; D1 is used to detect the reference light, D2 is used to detect the linear and non-linear images.
In order to analyze the scheme, let us start from a traditional 4f imaging system (see Ref (Cherukulappurath et al., 2004; Boudebs and Cherukulappurath, 2004; Yang et al., 2017; Fedus and Boudebs, 2013). for more details) and assume that we use a top-hat beam and that the HPO is placed on the object plane. Further, we assume for simplicity that a non-linear medium is placed on the focal plane. We refer to Ref (Fedus and Boudebs, 2013). for situations where the non-linear medium is far away from the focus. Finally, we assume that Fourier optics can fully describe the 4f imaging technique. The HPO and the transparent glasses are illuminated at normal incidence by a linearly polarized monochromatic plane wave
The two parts of the HPO, H1 and H2, are shown in Figure 1B. The central region H1 has radius
where
where
where
where, if the sample is a Kerr medium, a and
The technique is described with more details in the following two Subsections.
2.1 Improve sensitivity of 4f imaging system with the absorptive HPO
The non-linear sample in our setup may be regarded as a low-frequency filter. The portion of the incident light passing through the H2 is spread less than the portion passing through H1 because Ra is much larger LP (Shui et al., 2010). Hence, the modulation induced by H1 may be ignored and we only consider the non-linear modulation induced by H2. The on-axis field intensity for H1 is then considered. The complex field amplitude at the output plane of 4f imaging system can be expressed as:
The electric field amplitudes coming from the regions H1 and H2 of HPO can be written as E1 and E2 respectively. The light coming from H1 is considered a uniform background distribution (regarded as a direct light) because the non-linear modulation is negligible, whereas the light from H2 is modulated by the non-linear medium at the focal plane and produce a small perturbation of the incident wave (as diffracted light). The second term (∆
The interference induced by the diffracted light is insensitive to phase changes (
The first term (
The difference
where
In our measurements, the signal received by CCD on the exit plane of the 4f system has been processed using the above analysis (Eqs. 1–9). The extension of the PO region increases if the non-linear sample has a positive phase shift, whereas it decreases otherwise. Here a non-linear sample producing a positive shift has been simulated. In Figure 3A we show the difference transmittance (
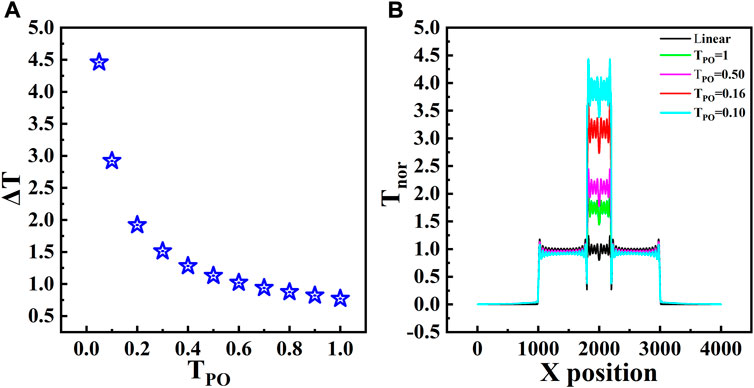
FIGURE 3. (A) Normalized transmittance
The simulation results show that when the electric field amplitude (transmittance) in the PO region is less than 50% of the original, the sensitivity is increased by 2–4 times. For example, for
2.2 The use of the HPO in 4f imaging system with light with a continuous spectrum
In Figures 4A, B, we show theoretical results and simulations for the case of the phase shift
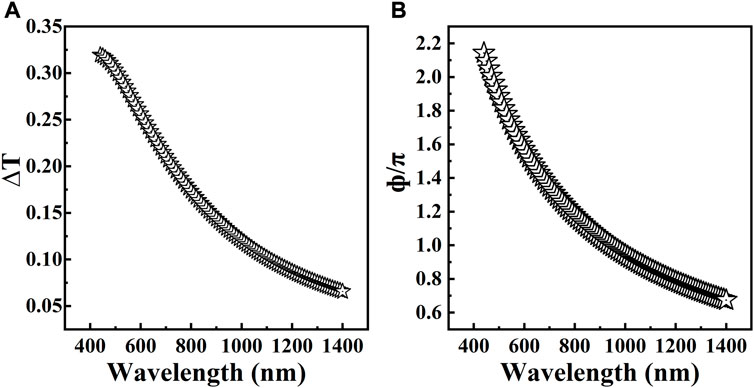
FIGURE 4. (A) Transmittance changes
And the thickness of the HPO can be expressed as:
Where
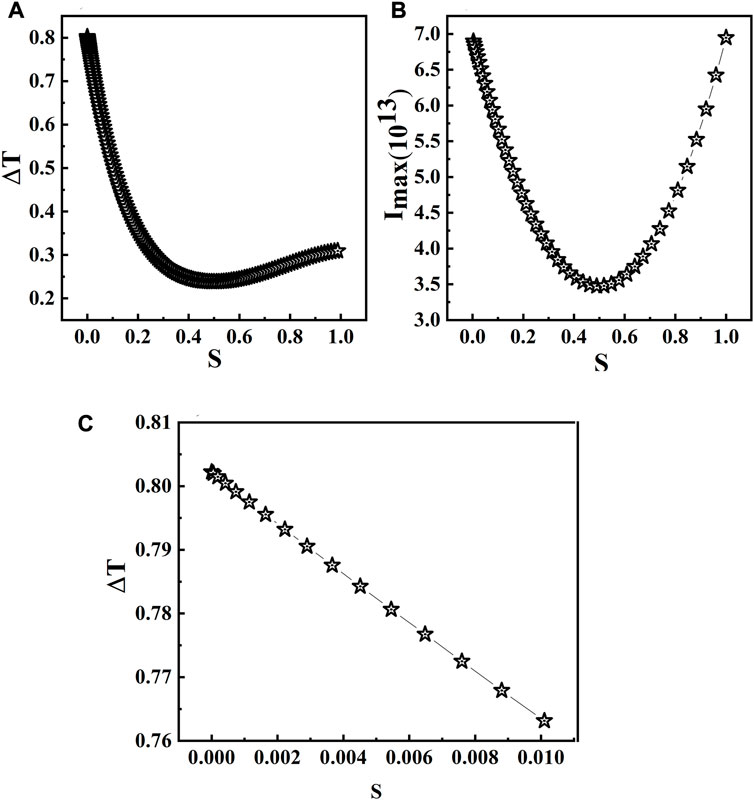
FIGURE 5. (A) Transmittance changes
The sensitivity of 4f phase coherent imaging technology is determined by the phase retardation of PO, and the phase retardation of PO, given a certain thickness, is different at different wavelengths. This means that the sensitivity of the system may be optimized only for a specific wavelength given the thickness of PO. In order to ensure the optimal measurement sensitivity of the system at different wavelengths, it is necessary to continuously change the optical path difference of PO. This also means that conventional transparent PO cannot be used to perform measurements with a continuous spectrum. For example, a conventional transparent PO using light at 400 nm cannot be used to perform measurements at 905 nm. The simulation results also show that the sensitivity is higher when S is smaller (
3 Experimental results and discussion
In order to order to assess the reliability and precision of our technique we have implemented it to measure the third-order non-linear refraction index of Carbon disulfide (CS2) and absolute ethanol using an absorptive HPO. Among them, CS2 is a standard sample to verify the validity of characterization techniques. The solvent CS2 and the absolute ethanol are loaded into a 2 mm glass sell. The excitation source is a Q-switched and mode-locked Nd: YAG laser which provides 21ps output laser pulses, with a wavelength of 532 nm and a repetition rate of 10-Hz. As a benchmark, the solvent is also measured with a HPO and conventional transparent PO at 905 nm (100 mW) with a continuous laser.
Three kinds of imaging data are needed in experiment. i) No sample: The acquisition is reference light. ii) Linear image: The image acquisition is obtained with low intensity by placing high-density neutral filters before the non-linear samples. iii) Non-linear image: The image is acquired with high intensity by placing the same high-density neutral filters after the non-linear samples. The linear and non-linear images are used to calculate the refraction index n2 using Eqs 1–9. The non-linear signal processing leads to
The absorptive HPO used in our experiments consists in two transparent glass plates with a liquid film in between. The absorption index can be changed by changing the thickness of the liquid film. The phase
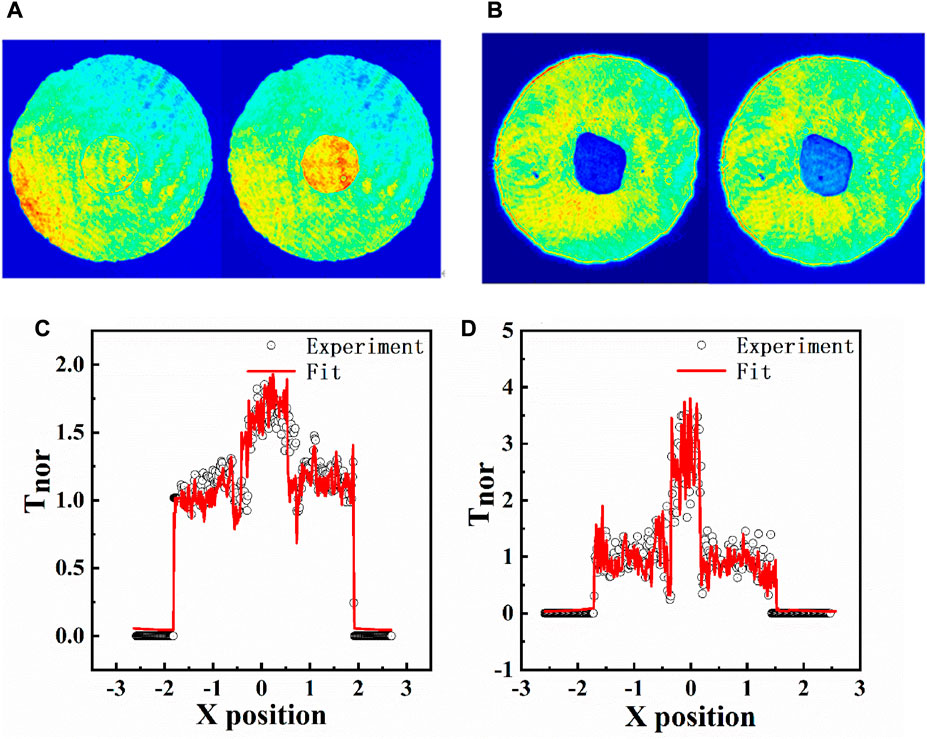
FIGURE 6. (A,B) Linear and non-linear images for CS2 as acquired by our experimental 4f imaging system with a conventional transparent PO and absorptive (TPO≈16%) HPOs. (C,D) Profiles of images (A,B) by processing
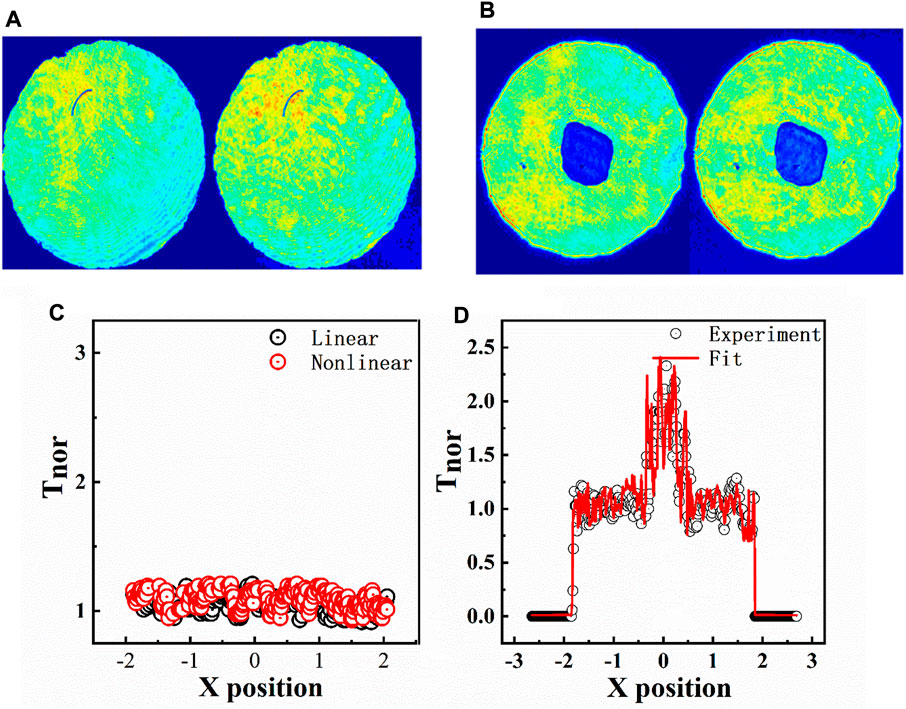
FIGURE 7. (A,B) Linear and non-linear images for ethanol as acquired by our experimental 4f imaging system with a conventional transparent PO and an absorptive (TPO≈16%) HPO. (C,D) Profiles of images (A,B) by processing
Figure 8 is instead the results obtained with conventional transparent POs (a conventional transparent PO of 400 nm, a conventional transparent PO of 532 nm and a conventional transparent PO of 800 nm) and a transparent HPO to measure the solvent using a 905 nm continuous laser at the power of 1 mW. The results shows that the conventional transparent PO cannot be used with a continuous spectrum. The results also shows that the HPO can be modulated to produce a complete cycle and overcome the disadvantage of the conventional transparent PO. Overall, these results confirm the validity of our approach. Furthermore, from our experimental results, the thickness of the HPO is calculated to be approximately 0.634 μm from the Eq. 11. Therefore, if other experimental factors are not considered, it can theoretically be used in a range of about 304 nm–1752 nm by the Eq. 10.
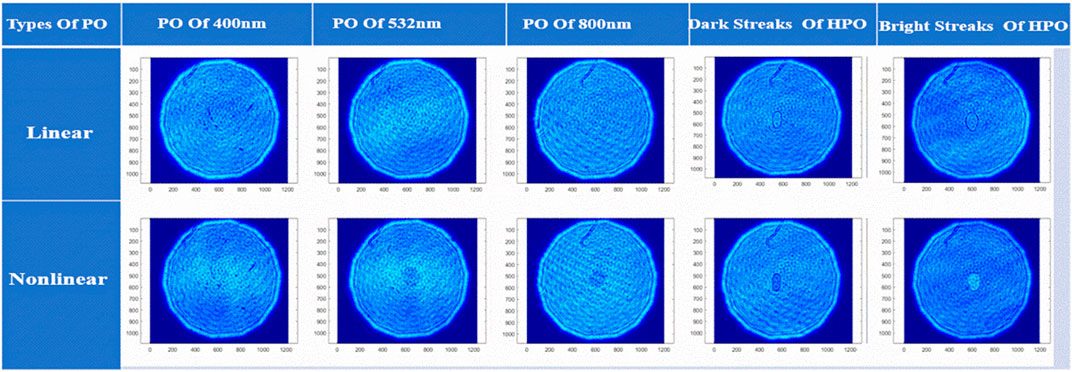
FIGURE 8. Experimental 4f imaging with conventional transparent POs (a conventional transparent PO of 400 nm, a conventional transparent PO of 532 nm and a conventional transparent PO of 800 nm) and linear and non-linear images acquired with a transparent HPO.
4 Conclusion
In summary, a simple and high-sensitive 4f imaging technique has been suggested and demonstrated to measure the non-linear refractive coefficient. In particular, we have illustrated numerically that the use of the low transmittance HPO lead to a higher sensitivity compared to a conventional transparent PO in a 4f imaging system. The sensitivity improves by a factor of
Data availability statement
The original contributions presented in the study are included in the article/supplementary material, further inquiries can be directed to the corresponding authors.
Author contributions
ZS: Investigation, writing—Original draft, writing—Review and editing. YY and JY: Provide ideas. And all authors take part in formal analysis.
Funding
This work was supported by National Natural Science Foundation of China (Nos. 11804244, 11704273), Natural Science Foundation of Jiangsu Province (Nos. BK20180965, BK20170375), the National Safety Academic Fund (Grant No. U1630103).
Acknowledgments
We gratefully acknowledge National Natural Science Foundation of China (11704273, 51607119), National Safety Academic Fund (U1630103).
Conflict of interest
The authors declare that the research was conducted in the absence of any commercial or financial relationships that could be construed as a potential conflict of interest.
Publisher’s note
All claims expressed in this article are solely those of the authors and do not necessarily represent those of their affiliated organizations, or those of the publisher, the editors and the reviewers. Any product that may be evaluated in this article, or claim that may be made by its manufacturer, is not guaranteed or endorsed by the publisher.
References
Boudebs, G., and Cherukulappurath, S. (2004). Nonlinear optical measurements using a4fcoherent imaging system with phase objects. Phys. Rev. A 69 (5), 053813. doi:10.1103/physreva.69.053813
Cherukulappurath, S., Boudebs, G., and Monteil, A. (2004). 4f coherent imager system and its application to nonlinear optical measurements. J. Opt. Soc. Am. B 21 (2), 273–279. doi:10.1364/josab.21.000273
Fedus, K., and Boudebs, G. (2013). Experimental techniques using 4f coherent imaging system for measuring nonlinear refraction. Opt. Commun. 292, 140–148. doi:10.1016/j.optcom.2012.11.074
Ganeev, R. A., Ryasnyansky, A. I., Baba, M., Suzuki, M., Ishizawa, N., Turu, M., et al. (2004). Nonlinear refraction in CS2. Appl. Phys. B 78, 433–438. doi:10.1007/s00340-003-1389-y
Ho, P. P., and Alfano, R. R. (1979). Optical Kerr effect in liquids. Phys. Rev. A 20 (5), 2170–2187. doi:10.1103/physreva.20.2170
Pereira, M. K., and Correia, R. R. B. (2020). Z-scan and eclipsing Z-scan analytical expressions for third-order optical nonlinearities. J. Opt. Soc. Am. B 37 (2), 478–487. doi:10.1364/josab.376541
Shui, M., Luo, X., Zhang, X., Jin, X., Li, C., Yang, J., et al. (2010). Phase filtering in nonlinear-imaging technique with a phase object. J. Opt. Soc. Am. A 27 (11), 2514–2523. doi:10.1364/josaa.27.002514
Sorokina, M., Sygletos, S., and Turitsyn, S. (2016). Sparse identification for nonlinear optical communication systems: SINO method. Opt. Express 24 (26), 30433–33044. doi:10.1364/oe.24.030433
Wu, J., Li, Z., Luo, J., and Jen, A. K. Y. (2020). High-performance organic second- and third-order nonlinear optical materials for ultrafast information processing. J. Mater. Chem. C 8, 15009–15026. doi:10.1039/d0tc03224g
Yang, Y., Yang, J. Y., Li, Z. G., Wu, X. Z., and Song, Y. L. (2017). Sensitive measurement of optical nonlinearity using an absorptive phase object. Appl. Phys. B 123 (9), 248. doi:10.1007/s00340-017-6825-5
Yi, J., Miao, L., Li, J., Yi, Q., Huang, J., and Zhao, C. (2020). Self-defocusing of light in ethanol around 1550 nm. IEEE Photonics J. 12 (1), 1–8. doi:10.1109/jphot.2019.2960392
Zhang, F., Mi, Z., Hao, W., Chen, H., Zhang, Y., Zhao, J., et al. (2022). Tunable engineering of photo- and electro-induced carrier dynamics in perovskite photoelectronic devices. Sci. China Mater. 65 (4), 855–875. doi:10.1007/s40843-021-1906-5
Keywords: non-linear optical, phase object, 4f imaging, non-linear refractive, measure sensitivity, continue wavelength
Citation: Shao Z, Yang Y, Yang J, Zhou W, Liu K, Li Z, Fang Y, Wu X and Song Y (2023) Sensitivity optical non-linear measurement based on wide-band phase objects. Front. Mater. 10:1144236. doi: 10.3389/fmats.2023.1144236
Received: 14 January 2023; Accepted: 09 March 2023;
Published: 22 March 2023.
Edited by:
Fei Sun, Taiyuan University of Technology, ChinaReviewed by:
Zhongquan Nie, Taiyuan University of Technology, ChinaChujun Zhao, Hunan University, China
Copyright © 2023 Shao, Yang, Yang, Zhou, Liu, Li, Fang, Wu and Song. This is an open-access article distributed under the terms of the Creative Commons Attribution License (CC BY). The use, distribution or reproduction in other forums is permitted, provided the original author(s) and the copyright owner(s) are credited and that the original publication in this journal is cited, in accordance with accepted academic practice. No use, distribution or reproduction is permitted which does not comply with these terms.
*Correspondence: Yong Yang, eWFuZ3lAc3VkYS5lZHUuY24=; Junyi Yang, eWp5MjAxMEBzdWRhLmVkdS5jbg==; Yinglin Song, eWxzb25nQGhpdC5lZHUuY24=