 Feng Xu
 Jianwei Jiang
- State Key Laboratory of Explosion Science and Safety Protection, Beijing Institute of Technology, Beijing, China
Impact and protection are hot topics of concern in modern military and civilian fields. However, existing research focuses more on high-speed, high-frequency impact, explosion, and other loading conditions, while studies on the protective mechanisms and stress-deformation processes of materials during long-pulse-width and low-amplitude dynamic impact processes are relatively limited. This work investigates the interfacial stress control mechanism of engineering plastic gaskets on protected components under long-pulse-width loading, and employs the finite element method (FEM) to simulate the impact protection processes of gaskets with different material parameters. The influence of gasket material parameters on the interface protection effects for protected vulnerable components was obtained, and the relevant protective mechanisms were revealed. The surface fitting method was used to optimize the performance parameters of protective materials, and the impact protection effect of optimized gaskets under simulated launch loading was verified through large-scale drop hammer tests. Key findings include: (1) Under long-pulse, low-amplitude dynamic loading, the Von Mises stress distribution on impact surfaces of vulnerable components correlates with the anisotropic deformation capacity of protective materials; (2) Controlling the variation and coupling of triaxial stresses at the interface between protective materials and vulnerable components is critical for achieving protection; (3) Engineering plastic protective materials with moderate de-formation capabilities demonstrate superior effects in improving interface stress distribution of typical composite vulnerable components. The research outcomes provide important references for impact protection design under long-pulse dynamic loading process.
1 Introduction
Impact and protection have emerged as critical concerns in modern military and civilian applications. Although research on protective materials has expanded from conventional engineering materials (e.g., polycarbonate, polyethylene, polyurethane elastomers, soft rubber) to composite and structural materials such as fiber-reinforced materials, surface-engineered materials, sandwich materials, gradient materials, and biomimetic materials. Compared with composite and structural materials, traditional engineering protective materials offer the advantages of mature processing technologies, stable mechanical-thermal-chemical properties, and superior cost-effectiveness ratio. These properties make them widely used in military and civilian products.
Nowadays, certain efforts devoted to conventional impact protection research predominantly focus on the safety and protection of critical vulnerable components under high-amplitude, high-frequency impact and explosive loading conditions. For instance, Mohammad (Mohammad and Mohammadzadeh Gonabadi, 2019) employed small-scale drop hammer tests to evaluate the impact resistance of aluminum foam materials, concluding that aluminum foam is suitable as an impact energy-absorbing material. In low-velocity impact tests, Liu Y. R. et al. (2024) found that artificial cartilage materials provide effective cushioning and energy absorption capabilities, which significantly reducing surface stress on aluminum alloys. Furthermore, Sun et al. (2025) conducted high-velocity ballistic impact tests on biomimetic borosilicate glass composites. The results reveal that structural modifications enhance energy dissipation during impact events, thereby improving the protective performance of materials. Similarly, such efforts are reflected in current impact protection research within the military munitions field. For instance, in studies concerning projectile-target plate impact protection: Li et al. (2021) discovered that the stress attenuation capacity of gasket materials is the main factor in determining their protective performance, by compared the impact protection capabilities of different gasket materials using finite element method. However, Li et al. (2017) found the impact protection characteristics of gasket materials are controlled by stress attenuation and dispersion effects, as evidenced by numerical simulations conducted using finite element method. Liang et al. (2020) combined theoretical and experimental methods to analyze projectile penetration processes, demonstrating that foam aluminum-filled thin-walled metal liners effectively reduce impact overload through energy absorption mechanisms. Thus, the dominant factors determining impact protection efficacy remain controversial under identical impact loading conditions due to variations in loading characteristics and protective material properties. Whether in military or civilian applications, it is essential to explore the impact of protective mechanisms and stress-deformation processes on the efficacy of impact protection.
As a distinct form of impact loading, projectiles load launched by artillery exhibit launch overload peaks compared with projectile-target impact loading. These peaks typically range from several thousand to over ten thousand g, with pulse durations of approximately 10 milliseconds. However, projectile-target impacts generate overload magnitudes of tens of thousands of g, characterized by pulse widths spanning several to tens of micro-seconds (Jia et al., 2023; apps.dtic.mil, 2025). Therefore, compared to the projectile-target impact process, the impact during projectile launch constitutes a typical low-amplitude, long-pulse-duration dynamic loading. Under such loading conditions, the motion characteristics of projectile-borne components resemble mechanical vibrations under high accelerations. However, there is currently no research on the protective effects of common engineering gasket materials on vulnerable components under projectile launch loading.
Based on this, this work employs the finite element method to establish simplified models and calculate the impact protection process of traditional energetic composite gaskets under low-amplitude, long-pulse-duration dynamic loading. The influence of gasket material parameters on the surface/interface protection of vulnerable components is investigated, with the axial loading of projectile launch as the typical external load. Further mechanistic studies identify that the relevant protection mechanisms and optimal material ranges. Finally, experimental verification is conducted with selected typical engineering plastic gaskets.
2 Finite element simulation model and verification
Existing formulas can be used to calculate the axial stress σz at the impact interface of protected vulnerable components under launch overload, but the stress distribution cannot be determined. Therefore, this article explores the role of gaskets based on numerical simulation methods and verifies the effectiveness of the simulation calculation model using classical theoretical formulas.
2.1 Finite element model
In the internal ballistic simulation, this study rationally simplifies the projectile structural calculation model, as shown in Figure 1. The simplified model consists of the protected vulnerable component, the gasket bonded to its base, and the simplified projectile casing structure. In this model, Dm denotes the projectile diameter, D represents the diameter of both the vulnerable component and gasket, Le is the vulnerable component length, Hp is the gasket thickness, and HM the equivalent thickness at the projectile casing base. A gap of 0.02%D is configured between the vulnerable component and circumferential projectile casing to simulate actual assembly clearances. During launch simulation, pressure load is applied to the projectile casing base, inducing impact loading throughout the entire model.
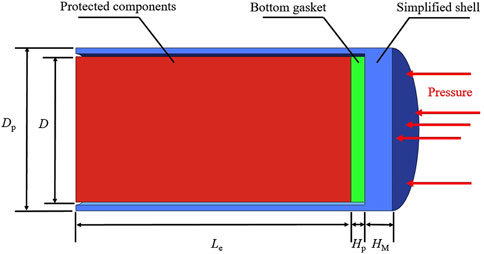
Figure 1. Simplified model of charge structure with gasket.
The TRUE GRID software was employed to establish the corresponding finite element model, as illustrated in Figure 2. The computational structure utilizes an axisymmetric model, with a two-dimensional axisymmetric approach adopted to optimize computational efficiency. To maintain consistency with the dimensions of vulnerable component in the experimental action and to amplify the influence of different gasket materials for enhanced differentiation of the result, the finite element model incorporates specific dimensional parameters: a vulnerable component size of D = 40 mm and Le = 40 mm, and a significantly thick gasket layer of Hp = 10 mm.
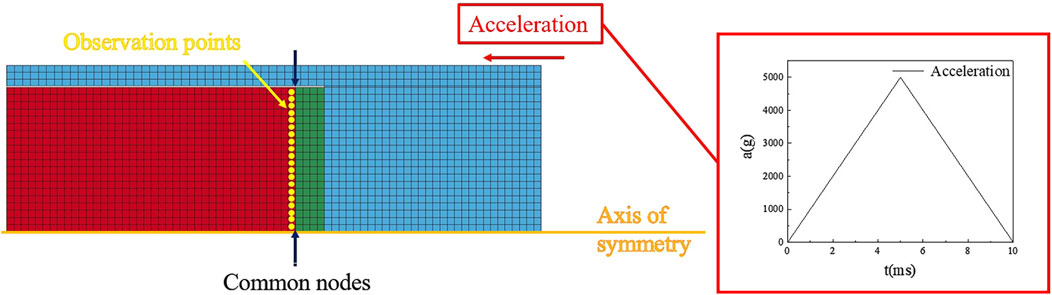
Figure 2. Two-dimensional finite element model.
All external surfaces of the components are designed as free collision boundaries, and symmetric constraints are imposed on the symmetry plane. In actual physical assembly relationships, the adhesive is used to tightly fit vulnerable components and gaskets. This bonding fit is not easily damaged under axial stress load, resulting in synchronous deformation of vulnerable components and gaskets at the bonding interface. Therefore, shared nodes are used between vulnerable components and gaskets in the finite element calculation of this article to simulate the bonding surface of the actual interface. Meanwhile, the load width is usually 6–13 m according to the load characteristics during the firing process of artillery projectile. The input load waveform is set as a triangular wave, as shown in Figure 2, to simulate the chamber pressure overload with a load time of 10 m. To facilitate the collection and statistical analysis of data, establish 20 observation points along the bottom interface of the vulnerable component, arranged sequentially from the axis of symmetry outwards (i.e., the center of the bottom surface of the vulnerable component is the first observation point and the outer edges are the 20 the observation points).
2.2 Material constitutive model and parameters
2.2.1 The constitutive model of gasket material
Considering strain rate effects and deformation magnitude, the gasket material adopts a kinematic hardening combined elastic-plastic constitutive model in the calculation. As the present computational analysis covers a relatively broad range of material parameters, this section provides the parameter ranges of the material model used in the calculations, as listed in Table 1. The specific elastic modulus E and Poisson’s ratio μ adopted in the actual computations will be specified in subsequent sections. Additionally, the influence of gasket material density (ρ) on calculation results is negligible, as demonstrated by theoretical formulas and simulation results in Section 2.3. Therefore, except for the three typical materials specified in Section 2.3 for model validation, all other calculations use a fixed density of 1.5 g/cm3.
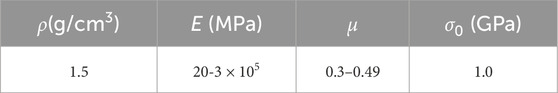
Table 1. Parameter range of gasket materials.
2.2.2 The constitutive model of shell
In the present computational analysis, the shell material is specified as steel. Based on the same considerations, the constitutive model employed for the shell material in the calculations is tabulated in Table 2.
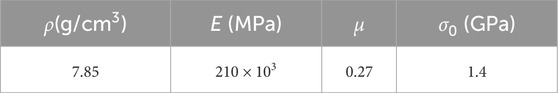
Table 2. Steel material parameter.
2.2.3 The constitutive model of protected component
Considering the requirements for facilitate experimental validation in Section 4.2 and the operational status of actual projectile-borne vulnerable components, this study configures the vulnerable components with typical projectile-borne energetic composite material. This material is characterized by a generalized Maxwell viscoelastic constitutive model, as shown in Figure 3.
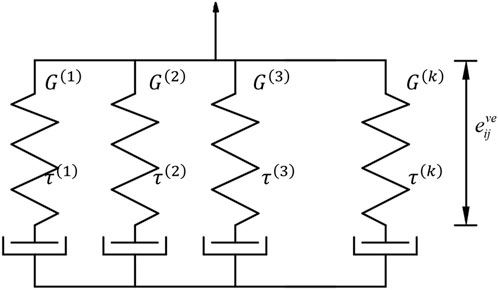
Figure 3. Generalized Maxwell constitutive model.
The generalized Maxwell visco-elastic model consists of K visco-elastic elements. The relationship between deviatoric strain and deviatoric stress of visco-elastic elements as Equation 1.
In Equation 2, G(k) and τ(k) represent the shear modulus and relaxation time of the Kth Maxwell body, respectively;
In the finite element computations, analogous formulation mechanical parameters are employed as substitutes, as tabulated in Table 3. This generalized Maxwell viscoelastic constitutive model for the vulnerable composite materials is implemented in the ANSYS/LS-DYNA explicit dynamics solver for computational analysis via secondary development methodology.

Table 3. Vulnerable composite material parameters based on the generalized Maxwell viscoelastic constitutive model (Liu W. et al., 2024; Zhang et al., 2016).
2.3 Meshing sensitivity analysis
Analyze the meshing sensitivity for a gasket with an elastic modulus of E = 800 MPa and a Poisson’s ratio of μ = 0.4. The mesh element type is quadrilateral shell element mesh. And the calculate results of meshing sensitivity are shown in Figure 4. The X-axis represents the number of grids per millimeter, and the Y-axis represents the maximum Von Mises stress at the bottom layer of protected component. The grid density of 1 grid per millimeter is sufficient to ensure computational accuracy while maximizing computational efficiency. Therefore, the final model was determined to comprise 1880 nodes and 1720 elements.
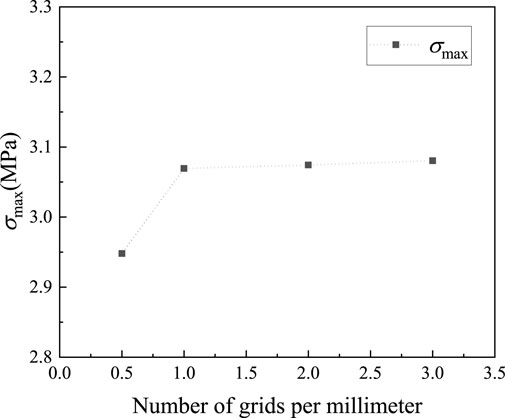
Figure 4. Calculate results of meshing sensitivity.
2.4 Finite element model validation and comparison
Common gasket materials used in engineering include metal, high-molecular engineering plastics, and flexible materials, etc. This article selects steel, low-density polyethylene, and soft rubber as representatives of three different types of materials. These three materials are utilized for model validation and comparative analysis to produce typical calculation results. The parameter values of the three gasket materials are shown in Table 4.
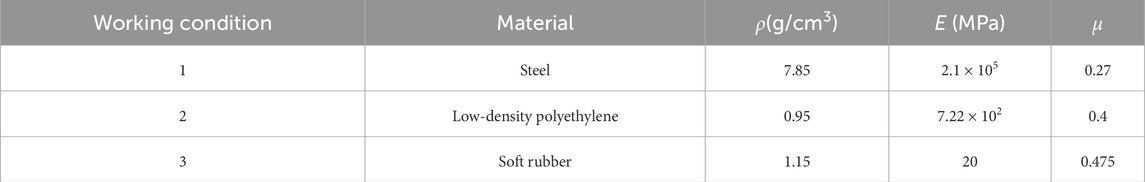
Table 4. Typical gasket material parameters for model validation.
2.4.1 Finite element model validation
According to classical theory, under axial high-g loading the axial stress in the bottom layer of the protected vulnerable component is (Huang, 2014):
Where, “Fz” is the axial force on the bottom surface of the vulnerable component. “a” represents the acceleration of the entire projectile system. “me” denotes the mass of the vulnerable component. “Mp” indicates the projectile mass. “Pm” refers to the single-shot maximum chamber pressure. “Dp” represents the projectile diameter. “Dn” is the outermost diameter of the vulnerable component (in this paper, taken as the vulnerable component diameter D). “Dn0” indicates the innermost diameter of the vulnerable component (in this paper, taken as 0).
Since the calculation result of Equation 3 represents the average axial stress on the bottom surface of the vulnerable component, this article collects data from 20 uniformly distributed stress monitoring points on the bottom surface of the vulnerable component under three typical simulation conditions. It calculates the average axial stress and compares it with the theoretical calculation results of Equation 3, as shown in Table 5. The calculation results indicate that the maximum percentage error between the finite element simulation results and the theoretical prediction results in this article are less than 0.8%. This proves that the simulation model is accurate and effective.
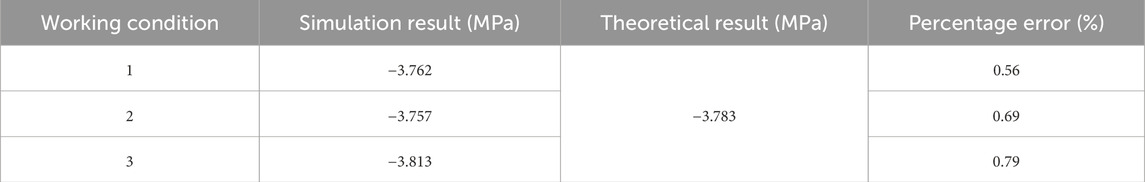
Table 5. Comparison between simulated and theoretical axial stress results under typical working conditions.
2.4.2 Comparison of simulation outcomes for typical working conditions
Obtain axial stress data from 20 observation points on the bottom surface of the vulnerable component under three typical simulation conditions, as shown in Figure 5.
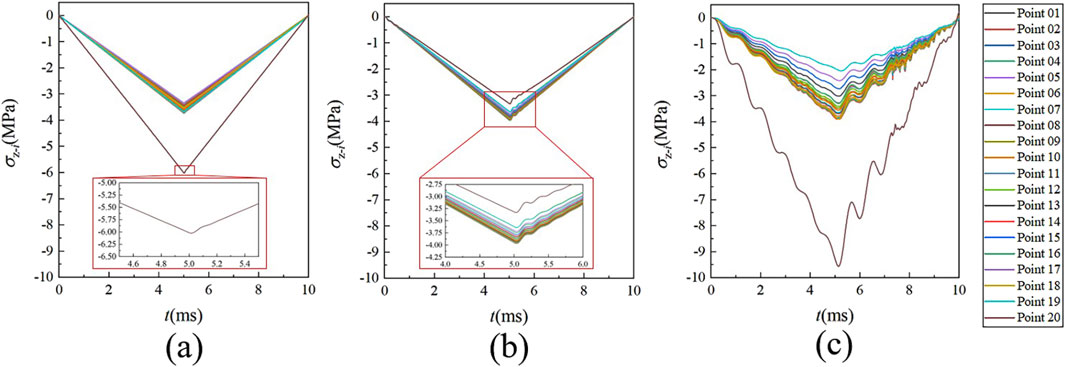
Figure 5. Axial stress-time curves of the bottom layer of the vulnerable component under three typical operating conditions. (a) Steel; (b) Low-density polyethylene; (c) Soft rubber.
As shown in Figure 5, different bottom gasket materials not only affect the magnitude of the bottom layer stress of the vulnerable component, but also affect the axial stress distribution and temporal variation at various monitoring points on the bottom layer of the vulnerable component. More importantly, comparing the stress oscillations in Figures 5b,c, it is found that the compression and release of the gasket interferes with the vibration of the underlying stress of the vulnerable component under impact. This interference results increases in the peak stress of the bottom layer of the vulnerable component. And this effect occurs for gasket materials with better elasticity when overloaded during launch. Therefore, the protection of the vulnerable composite material component by the gasket under the launch load is not achieved through “buffering,” “attenuation” or similar effects.
The Figures 6a,b show the Von Mises stress and axial stress contour charts at the moment of maximum stress in the bottom layer of the vulnerable component under three different working conditions.
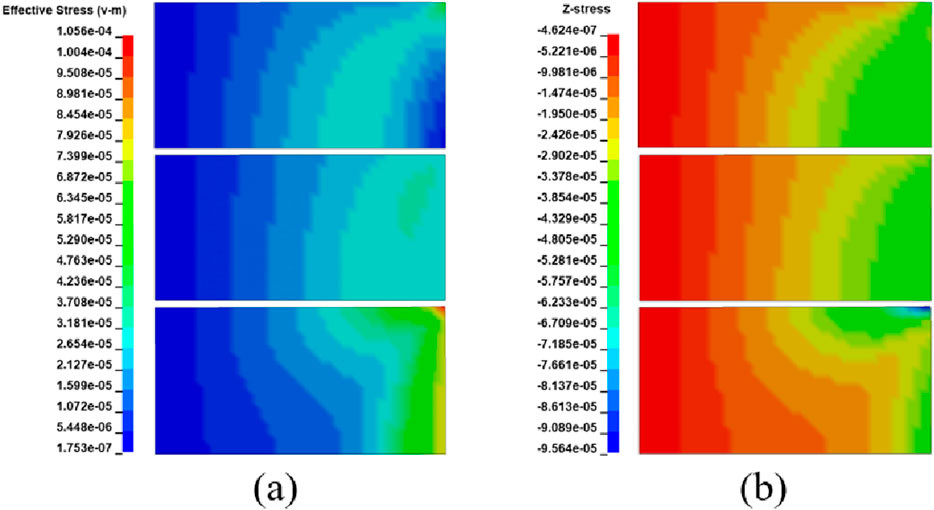
Figure 6. Contour chart of stress peak moment under typical working conditions. (a) Von Mises stress; (b) Axial stress.
The calculation results indicate that the value and distribution of stress in the bottom layer of the vulnerable component vary among three distinct gasket conditions under the same load. Additionally, it is necessary to distinguish and describe different stresses, such as Von Mises stress and axial stress. Therefore, for the convenience of discussion, all stresses mentioned in this article refer to the corresponding values at the moment of maximum stress occurrence. The parameters are introduced such as(σ)i and σmax, and their definitions are provided in Table 6. During the discussion, subscripts are added to parameter (z for axial stress, r for radial stress, and τ for circumferential stress), whereas Von Mises stress does not have subscript.
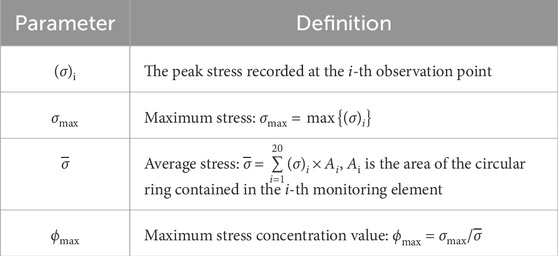
Table 6. Definitions of parameters for stress distribution.
The relationship between the peak stress values and distribution positions of (σz)i and (σ)i at each monitoring point under three typical working conditions is shown in Figures 7a,b, respectively.
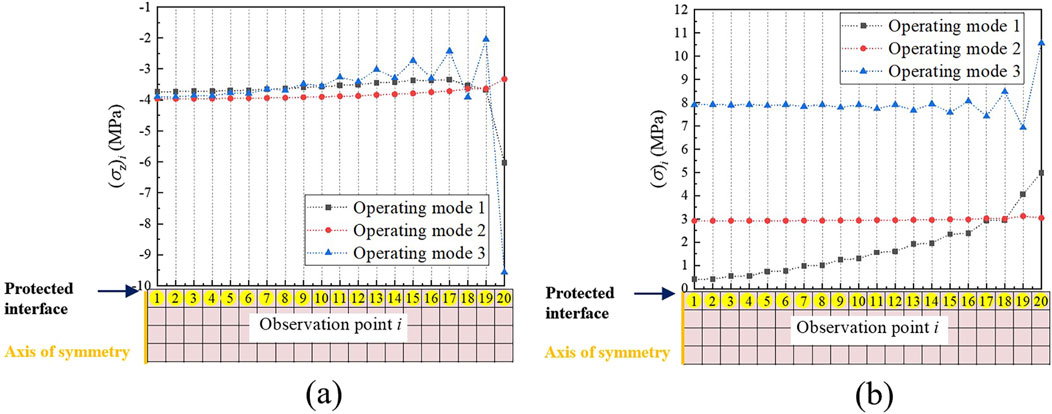
Figure 7. Stress distribution in the bottom layer of the vulnerable component under typical working conditions. (a) (σz)i distribution; (b) (σ)i distribution.
As shown in Figure 7a, the (σz)i distribution at the center of the vulnerable component’s bottom surface remains relatively consistent across the three working conditions. However, notable differences emerge in (σ)i at the outer edge, primarily due to local stress concentration effects resulting from the deformation of the vulnerable component under stress. This deformation also significantly impacts (σ)i on the bottom surface of the vulnerable component. As shown in Figure 7b, (σ)i in the central area of the bottom surface of the vulnerable component is consistently low across all three working conditions. In contrast, (σ)i on the outer edge is generally higher. Among them, (σ)i in working condition 3 is consistently higher than that in working conditions 1 and 2. Although (σ)i under condition 1 is generally lower than that under condition 2, the peak value on the outer side is higher.
3 Simulation calculation and analysis
Further analyze the influence of E and μ of the gasket material on the stress distribution on the bottom surface of the vulnerable component to reveal the underlying mechanism and provide guidance for optimal material selection. This article conducts numerical simulations across 6 groups, totaling 90 working conditions. In the specific calculation conditions, μ is taken as 0.25, 0.3, 0.35, 0.4, 0.45, and 0.49, respectively. At the same time, 15 E values (20, 50, 100, 300, 500, 800, 1,000, 2000, 3,000, 5,000, 1 × 10⁴, 3 × 10⁴, 5 × 10⁴, 1 × 10⁵ and 3 × 10⁵ MPa) are taken for each μ. The overall range of parameter values covers the vast majority of commonly used engineering materials.
3.1 Finite element calculation results
Figures 8, 9 respectively show the variation of the maximum stress and average stress of the bottom layer of the vulnerable component with material parameters. For σz, since its sign only indicates the direction, its absolute value is taken here.
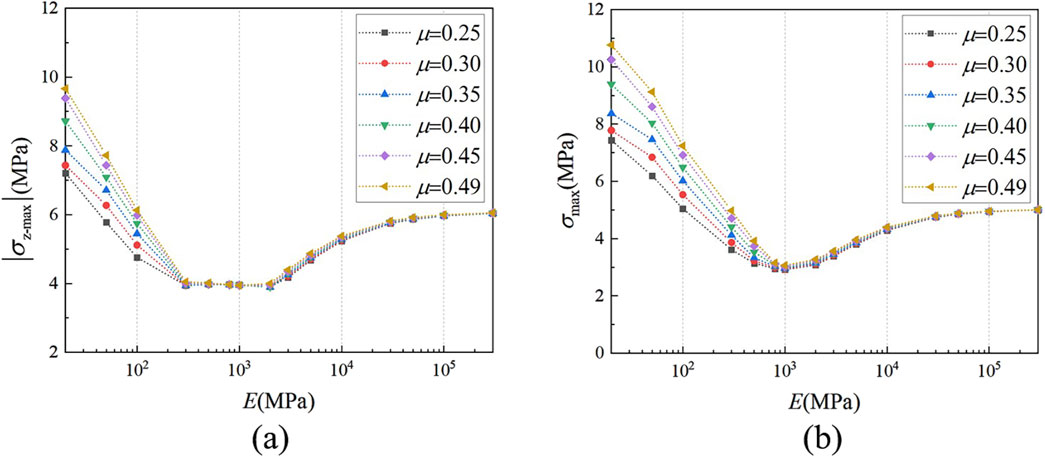
Figure 8. The influence of material parameters on maximum stress. (a) σz-max; (b) σmax.
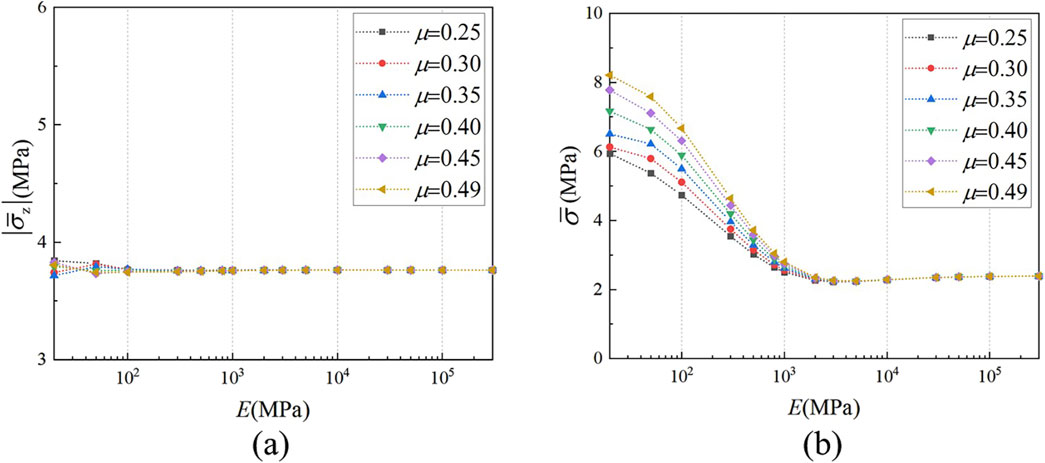
Figure 9. The influence of material parameters on average stress. (a)
As shown in Figure 8b, the maximum stresses value σ exhibits a trend of decreasing initially, followed by the increases as E of the gasket increases. This is roughly consistent with the variation law of σz with E of the gasket in Figure 8a. This indicates a strong correlation between the σ and σz. Meanwhile, as shown in Figure 8, when E of the gasket is small, its μ exhibits a significant positive correlation with the value of σ and σz in the bottom layer of the vulnerable component. Conversely, when E of the gasket is large, its μ has minimal influence on σ and σz.
For the average stress, as shown in Figure 9a, the change in gasket material has almost no effect on the average σz. There is only a slight difference when E ≤ 100 MPa. This indicates that the deformation ability of the gasket material is enhanced, resulting in a large amplitude oscillation of the overall σz. As shown in Figure 9b, the average σ in the bottom layer of the vulnerable component initially decreases and then stabilizes with the increase of E of the gasket, which is significantly different from the trend of the average σz.
3.2 Analysis of the protective mechanism of gasket materials on vulnerable components
3.2.1 Stress homogenization and deformation equilibrium point
As discussed in Section 3.1, significant changes occur in the regularity of force distribution on the bottom layer of the vulnerable component when E of the gasket ranges from 100 to 2000 MPa. Therefore, this E range is crucial for revealing the underlying mechanism. Meanwhile, the difference in regularity between axial stress σz and corresponding Von Mises stress σ in Figures 8, 9 indicates that other factors affect σ, leading to its current state. To better understand the protective mechanism of the gasket on the bottom layer of the vulnerable component, we investigated the variations in the value and distribution of the radial stress σr and circumferential stress στ in this layer when E of the gasket ranges from 100 to 2000 MPa.
The working condition with μ = 0.4 is selected as the research object. Figure 10a illustrates the value and distribution of σz under various working conditions within this range. The contour charts of σz of the vulnerable component under various working conditions within this interval are presented in Figures 10b–g. The symmetrical axis of each contour chart is on the left side of the graph. The interface between the vulnerable component and gasket (i.e., the bottom of the vulnerable component) is positioned in the upper region of the graph. The overall positional relationship is consistent with Figure 10a for comparison purposes.
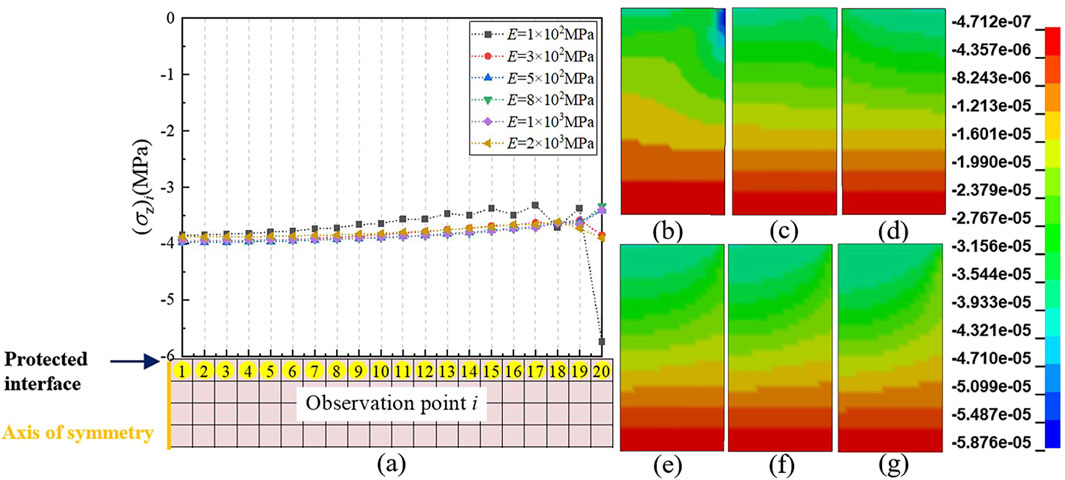
Figure 10. Axial stress state with elastic modulus of 100–2000 MPa (μ = 0.4) for the gasket. (a) Axial stress value and distribution; (b–g) Contour charts: (b) E = 100MPa, (c) E = 200MPa, (d) E = 500 MPa, (e) E = 800 MPa, (f) E = 1,000 MPa, (g) E = 2000 MPa.
Firstly, as shown in the axial stress contour charts in Figures 10b–g, within the range of 100–2000 MPa for E of the gasket, the peak area (blue part) of the absolute σz of the vulnerable component has undergone a shift. At the same time, according to the information in Figure 7a of Section 2.4.2 and Figure 10a, the absolute value of σz at the center is higher than that at the outer edge only when E is in the range of 300–1,000 MPa. And in other ranges, the peak σz of the bottom layer is always located at its outer edge.
As described in Section 2.4.2, when the range of E is less than 300 MPa or greater than 1,000 MPa, the stress concentration of vulnerable components is mainly near the outer edge. This is due to the difference in radial deformation between vulnerable components and gaskets under axial force. This results in a sharp change in the local shape of the outer edge of vulnerable components. When the E ranges from 300 to 1,000 MPa, the peak stress in the bottom layer of the vulnerable component is observed at the of its the center of bottom. This phenomenon is more akin to the stress distribution on the cross-section of an ideal cylindrical structure under axial loading. Therefore, there is reason to suspect that, within E range of the gasket (between 300 and 1,000 MPa), the existence of a point of E that results in no axial stress concentration in the bottom layer of the vulnerable component at this value. This point is the deformation equilibrium point Eeq described in this article.
The σr state of the vulnerable component supports this hypothesis. Figure 11 shows σr state of the vulnerable component when E is in the range of 100–2000 MPa (μ = 0.4), which has similar meaning to that of Figure 10. As shown in Figures 11b–g, when E ≤ 300 MPa, σr in the bottom layer is positive. This indicates that when E of the gasket is low, the overall radial deformation of the gasket exceeds that of the vulnerable component. This causes the bottom layer of the vulnerable component to become compressed. Based on the data in Figure 11a, a deformation equilibrium point Eeq for the gasket material is proven in the range of 300 MPa < E < 500 MPa (μ = 0.4), which makes σr zero. At this time, no axial stress is concentrated in the bottom layer of the vulnerable component. Thus, a reasonable gasket material can play a role in homogenizing the bottom stress of the vulnerable component.
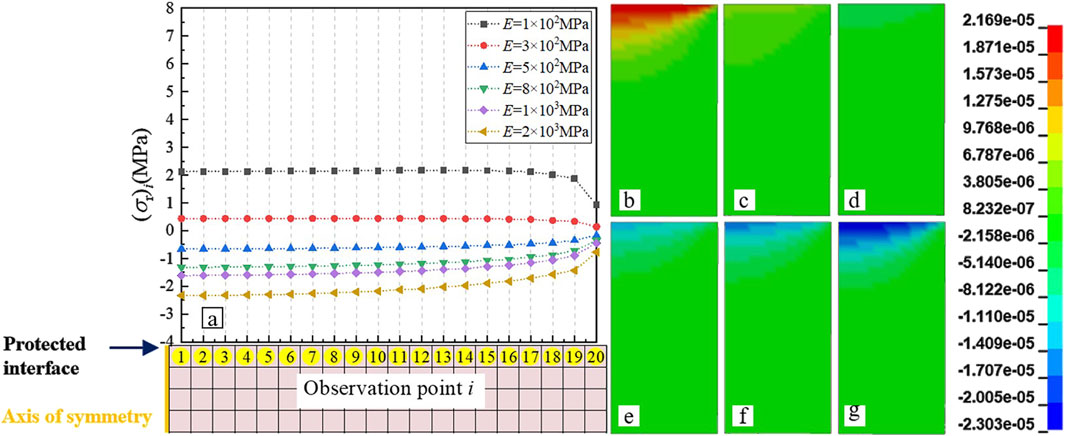
Figure 11. Radial stress state with elastic modulus of 100–2000 MPa (μ = 0.4) for the gasket. (a) Radial stress value and distribution; (b–g) Contour charts: (b) E = 100MPa, (c) E = 200MPa, (d) E = 500MPa, (e) E = 800MPa, (f) E = 1000MPa, (g) E = 2000 MPa.
3.2.2 Stress coordination function and stress coordination point
First, it is defined that the “stress coordination function” in this paper specifically refers to the mechanism of reducing von Mises stress through controlled variations in triaxial stresses.
Based on the above conclusions, this section further discusses the regularity of Von Mises stress σ. Figure 12 shows σ state (μ = 0.4) of the vulnerable component when E of the gasket is in the range of 100–2000 MPa. Figures 12a–g has a similar meaning to Figures 10a–g. As shown in Figure 12a, the σ distribution in the bottom layer of the vulnerable component is essentially uniform in the elastic modulus range of 300–500 MPa for the gasket material. According to Figure 8b in Section 3.1, within the elastic modulus range of 20–300 MPa, the overall σ increases, accompanied by local stress concentration at the outer edge. In the elastic modulus range of 300–3 × 10⁵ MPa, the σ gradually increases from the center towards the outer edge.
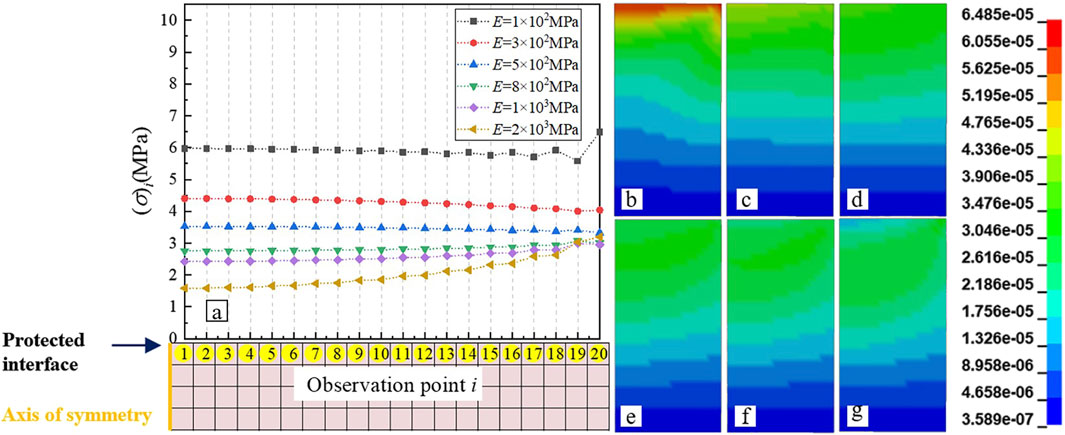
Figure 12. Von Mises stress with elastic modulus of 100–2000 MPa (μ = 0.4) for the gasket. (a) Von Mises stress value and distribution; (b–g) Contour charts: (b) E = 100MPa, (c) E = 200MPa, (d) E = 500MPa, (e) E = 800MPa, (f) E = 1000MPa, (g) E = 2000 MPa.
We discussed the homogenization issue of Von Mises stress in the bottom layer of vulnerable component within the 300∼500 MPa range, and verified that the σz distribution of the gasket material at Eeq is uniform (σr = 0). Meanwhile, existing theories have shown that an ideal cylinder component experiences circumferential stress σr = στ (Huang, 2014) under axial overload conditions. This is consistent with the simulation results presented in this paper, which will not be further elaborated. Therefore, combining the σ formula shows that when the gasket material is near Eeq, its σ value and distribution are primarily determined by the σz value and distribution. This causes the similar stress distribution uniformity characteristics in the same interval. The Von Mises stress formula is shown in Equation 4.
Similarly, when σ not within the 300–500 MPa range, the influence of the distribution of σr and στ must be considered. Typically, under ideal conditions σr = στ. Therefore, the variation of vulnerable component deformation, gasket deformation, σz and σr with E of the gasket were plotted as shown in Figure 13. Among them, the stress coordination point (Esc) denotes E of the gasket corresponding to the point of minimum σ. Although the minimum value of the simulation result in Figure 8b of Section 3.1 corresponds to E = 1,000 MPa, the selection of simulation calculation parameters is spaced similarly to Eeq. This means that the Esc can only be determined to have a value ranging from 500 to 2000 MPa (μ = 0.4).
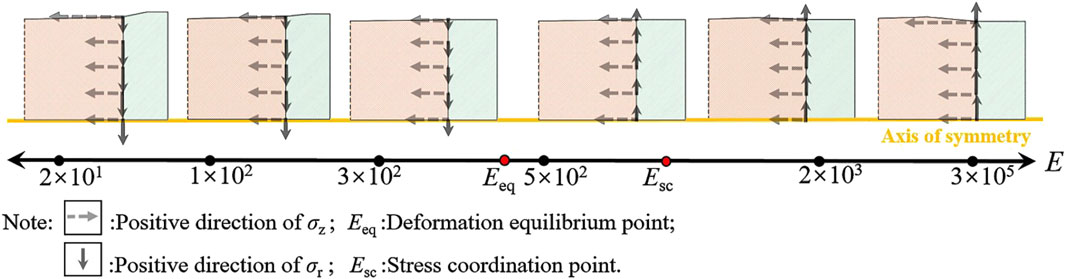
Figure 13. Schematic diagram illustrating the variation of σz and σr with E of the gasket (μ = 0.4).
As shown in Figure 13, under the condition of gasket μ = 0.4, the pattern of how σ varies with E of gasket is divided into the following five states.
State (1): When E of the gasket is less than or equal to 100 MPa, the deformation of the gasket increases significantly as its E decreases. This results in a concurrent increase in σz at the outer edge of the bottom layer of the vulnerable component. Simultaneously, this deformation causes a concurrent increase in σr. It should be noted that in this state, σz is negative while σr = στ is positive. Therefore, according to the Von Mises stress formula, σ at the bottom layer of the vulnerable component increases as E decreases.
State (2): When 100 MPa < E < Eeq, as E approaches Eeq, the connection between the gasket and the vulnerable component gradually becomes smoother, resulting to a more uniform distribution of σz. Simultaneously, σ continues to decrease as E increases, causing the peak position to shift towards the center of the bottom layer of the vulnerable component. At this state, the variation patterns of σr and στ are consistent with state (Mohammad and Mohammadzadeh Gonabadi, 2019), and they gradually approach zero as E of the gasket approaches Eeq. Therefore, according to the Von Mises stress formula, σ further decreases as E increases.
State (3): When E = Eeq, the smooth connection between the gasket and the vulnerable component eliminates stress connection, resulting the distribution of σz to approximate the ideal stress characteristics of a cylindrical pressure vessel with σr = 0 and στ = 0. At this state, the value and distribution of σ are equal to the absolute value of σz.
State (4): When Eeq < E ≤ Esc, E of the gasket gradually moves away from Eeq. The results in the peak position of σz shifting outward from the center to the outer edge of the bottom layer of the vulnerable component. Concurrently, peak stress values transition from initial stability to a gradual increase. However, i the radial deformation of the vulnerable component surpasses that of the gasket at this stage. Thus, both σr and στ turn negative. As E of the gasket increases, the value of σr and στ gradually rise. According to Equation 2, σ actually decreases as E increases, gradually reaching its minimum value. This occurs because the presence of negative values σr and στ in Equation 2 diminish the dominant influence of the negative value of σz on the outcome of formula.
State (5): When Esc < E, the deformation capacity of the gasket diminishes as E continues to increase. Concurrently, the deformation of the vulnerable component in relative to the gasket increases and gradually stabilizes at a fixed value. This value corresponds to the deformation of the vulnerable component when the gasket acts as a rigid body. Therefore, as E of the gasket increases, the value of σz at the outer edge of the bottom layer also increase, and gradually approaching a fixed value. At the same time, the values of σr and στ also increase synchronously and gradually tend to a fixed value. However, in the distribution of σr and στ, the values at the outer edge are the smallest, and their subsequent growth rate is significantly lower than that of σz. Therefore, according to the Von Mises stress formula, σ continues to rise as E, gradually approaching a fixed value.
3.2.3 The influence of Poisson’s ratio of gasket on the values of deformation equilibrium point and stress coordination point
Theoretically derivation of the calculation formulas for Eeq and Esc is challenging due to the adhesive bonding between the bottom layer of the vulnerable component and the gasket. However, the correlation between them and μ of the gasket can be discussed through classical material mechanics. Assuming that the vulnerable component and the gasket are both isotropic elastic cylinders, σz on both sides of the interface between the gasket and the vulnerable component is the same, σr is equal in magnitude and opposite in direction. According to the Poisson effect, the relationship between the radial strain εr and axial strain εz of the gasket on the bonding interface between the gasket and the bottom layer of the vulnerable component is as Equation 5.
Since the σz is the same on both sides of the bonding surface between the gasket and the vulnerable component. Therefore, axial strain can be expressed using Equation 6.
Assuming further that the σr and radial displacement ur on the constraint surface are both related to the geometric dimensions of the vulnerable component. We introduce a shear stress coefficient κ, which is assumed to depend on the material properties and geometric shape of the vulnerable component. The σr on the constraint surface can be approximately represented follows.
As mentioned earlier in Section 3.2.2, when E of the gasket material is set to Eeq, the σr is zero. Therefore, we assume that |σr| is a non-zero minimal value. Based on the left and right limits of the Formula 7, it is not difficult to find that the value of Eeq is related to the properties of the vulnerable component material, and geometric shape, and is directly proportional to Poisson’s ratio μ of the gasket. Esc is also directly proportional to μ. Figure 14 shows the relationship between material parameters and stress concentration factor. The relationship between Eeq and μ cannot be clearly determine due to the oscillation of axial stress in the bottom layer of the vulnerable component’s material near Eeq, as shown in Figure 14a. However, Figure 14b clearly indicates that as μ of the gasket material increases, so does E of the gasket, This corresponds to the minimum Von Mises stress concentration factor in the bottom layer of the vulnerable component. This suggests that Esc has shifted in the positive direction of the horizontal axis at this time.
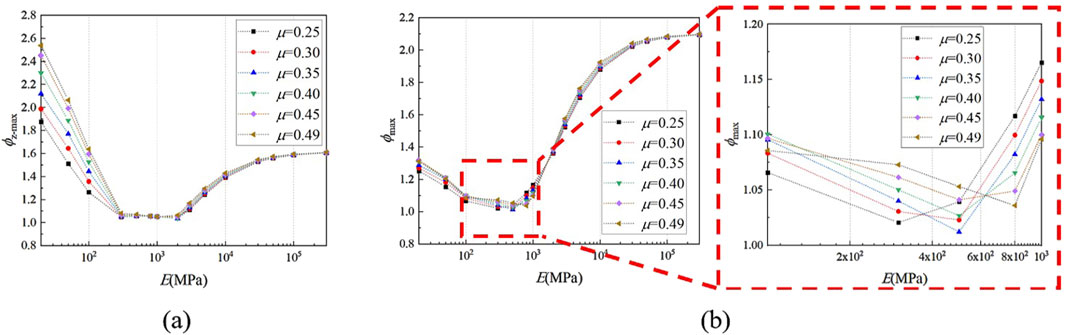
Figure 14. The influence of material parameters on stress concentration factor. (a) ϕz-max; (b) ϕmax.
Based on the above discussion, it is established that for given vulnerable component conditions, a specific Eeq necessarily exists for the gasket material’s elastic modulus. When E is set to this value, σz and σ at the bottom layer of the vulnerable component are uniformly distributed. At the same time, there exists a Esc that is slightly greater than Eeq. When E is set to this value, the peak of σ achieves its minimum under the combined effects of various stresses. Crucially, Eeq and Esc are positively correlated with μ of the gasket material.
3.2.4 The influence of thickness of gasket on the values of deformation equilibrium point and stress coordination point
The thickness variation of the gasket leads to changes in its longitudinal deformation, impacting the homogenization coordination effect. Therefore, further discussion is needed on the relationship between the thickness Hp of the gasket and the homogenization coordination effect. Take typical gasket thicknesses of Hp = 2, 10, 20 mm, and a material Poisson’s ratio of μ = 0.4. The calculation results under different elastic modulus E are shown in Figure 15.
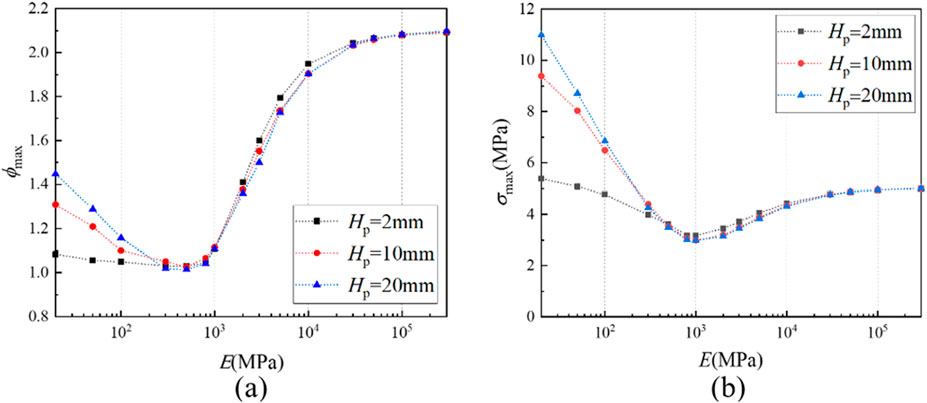
Figure 15. The influence of gasket thickness Hp on Von Mises stress in the bottom layer of the vulnerable component. (a) ϕmax; (b) σmax.
As shown in Figure 15, when the elastic modulus of the gasket material is small, the thickness of the gasket will significantly increase the longitudinal deformation difference at the interface between the gasket and the grain. The higher the thickness, the greater the stress concentration factor and stress peak. But when the elastic modulus of the gasket is higher than 300 MPa, the regularity of the three curves is consistent. Meanwhile, the optimal elastic modulus value corresponding to the lowest Von Mises stress suggests that the uniform coordination effect of the gasket on the bottom layer stress of the vulnerable component is independent of the thickness of the gasket.
3.2.4.1 Discussion on the mechanism of action of gasket materials
From the above analysis, the regularity observed in σ is actually a comprehensive reflection of the three-dimensional stress law in the Von Mises stress expression. The minimum value of σ arises from the combined effects of two factors. Firstly, when E of the gasket exceeds Eeq and gradually moves away from it, the axial stress σz undergoes a slow adjustment in stress distribution. At this time, its value remains relatively low, with the high distribution at the center and low distribution at the edges. Secondly, when E is greater than Eeq, σr and στ become negative, and their magnitudes increase as E increases. The combined effect of the above two factors results in σ not being the minimum value when the bottom layer of the vulnerable component is under uniform stress distribution at Eeq. On the contrary, when E is slightly greater than Eeq, the introduction of negative values of σr and στ weakens the dominant role of σz in Von Mises stress calculation to a certain extent. This can further reduce the calculated value of σ. As E continues to increase, the growth rate at the outer edge of the vulnerable component is much slower than that of σz due to their distribution characteristics. Conversely, σ starts to increase again.
Therefore, when E of the gasket is set at Eeq, the uniform distribution of stress in the bottom layer of the vulnerable component arises from the consistency of local longitudinal deformations in both the vulnerable component and the gasket. This phenomenon is defined as the stress homogenization effect of the gasket on the bottom layer of the vulnerable component in this article. When E is set at Esc, the numerical coordinates and coupling of the three-dimensional stresses in the bottom layer of the vulnerable component result in the lowest σ. This effect is referred to the multi-directional stress coordination effect of the gasket on the bottom layer of the vulnerable component. This paper terms these two effects collectively as the homogenization and coordinating effects of the gasket on the bottom interface of the vulnerable component.
3.3 Fast prediction model and gasket material selection
In Section 3.2 uses the example of gasket with μ = 0.4 to analyze and discuss how the gasket homogenizes and coordinates the stress reduction in the bottom layer of the vulnerable component. It is evident that obtaining the minimum σ by theoretically calculating the optimal material parameters of the gasket is challenging. Therefore, we utilize the finite element calculation results from Section 3.1 to establish a fast prediction model for σ with different gasket materials through numerical fitting of surfaces. This provides a basis for the optimal selection of gasket materials.
Based on the previous analysis, the objective function for σ, which involves E and μ of the gasket, is set as Equation 8.
Among them, σeq represents the reference stress, which is the Von Mises stress of the bottom layer of the vulnerable component when E = Eeq. As discussed in Section 3.2.1, the stress at the bottom layer of the vulnerable component at this moment corresponds to an ideal cylindrical, resulting in σeq = |σz|. Hence, the theoretical Formula 3 is used to directly calculate σeq. P1-P10 are all fitting coefficients. The Levenberg-Marquardt method is used for regression analysis fitting, and the parameter fitting results are shown in Table 7.
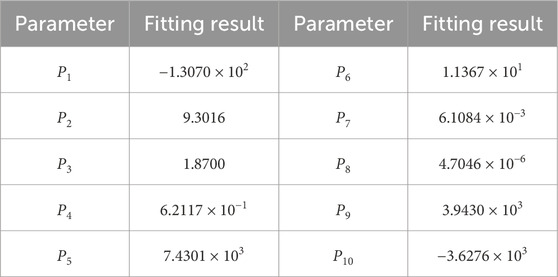
Table 7. Parameter regression fitting results.
The fitted function surface is depicted in Figure 16. In the diagram, the x-axis and y-axis represent E and μ of the gasket, respectively, while the z-axis represents the corresponding Von Mises stress peak at the bottom layer of the vulnerable component. The blue sphere represents the simulation calculation result. The RMSE (root-mean-square error) of the final function is 0.0846, and the coefficient of determination R-Square is 0.99796, indicating that the fitting results is satisfactory.
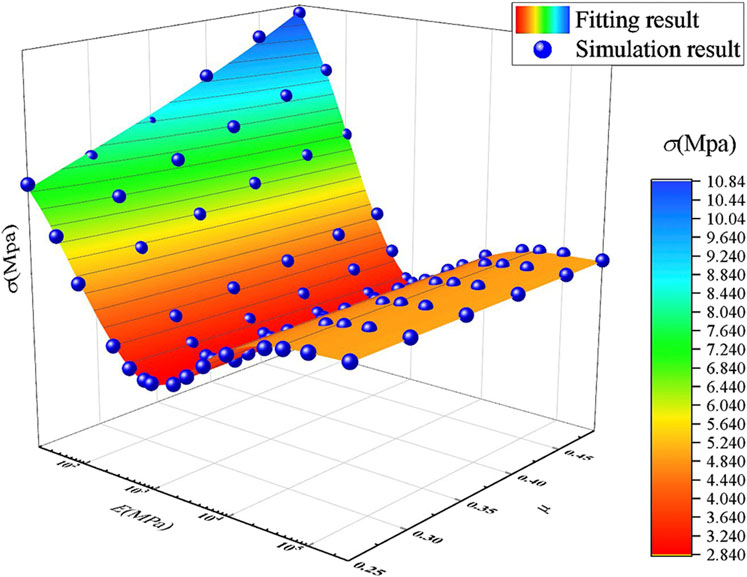
Figure 16. Fitted function surface.
To facilitate the optimal selection of gasket materials in practical design, we project Figure 16 upwards, obtaining a σ contour char, where E serves as the x-axis and μ as the y-axis, as shown in Figure 17. The area between the two yellow dashed lines in this figure represents the range of materials preferred in this article. Compared with the stress in the bottom layer of the vulnerable component under the traditional steel material bottom condition described in Section 2.4.2, the σ within the preferred interval are all below 3.24 MPa, showing a decrease of more than 34.4%. Reasonable selection of gasket materials effectively reduce the stress in the bottom layer of the vulnerable component, thus protecting the vulnerable component.
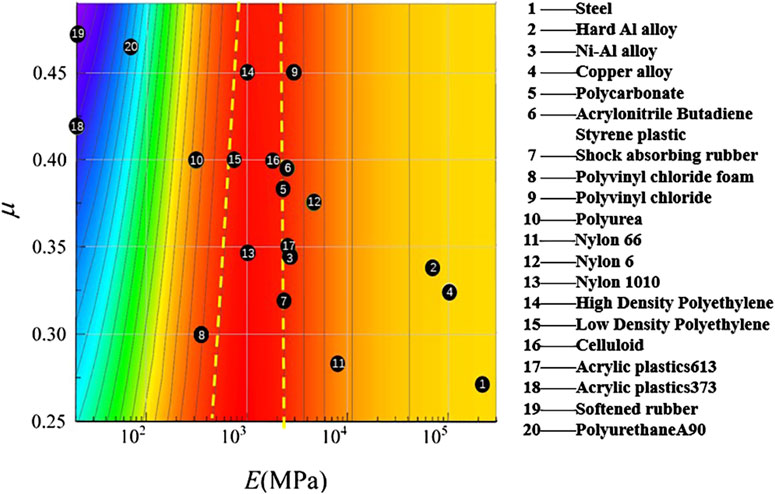
Figure 17. Performance projection chart of different gasket materials.
The black dots in Figure 17 are labeled with numbers, indicating the corresponding parameter positions for 20 traditional used materials or material types based on the statistical data presented in this article (Sachin and Ravindra, 2012; Iqbal et al., 2013; Kou and Xu, 2015; Huang et al., 2010; Li et al., 2006; O'Daniel et al., 2002; Riedel et al., 2009; Urtiew et al., 2008; Hou and Werner, 1996; Mu et al., 2010; Kim et al., 2005; Ackland et al., 2013; Nsiampa et al., 2011; Fu et al., 2022). From the perspective of the capacity of various materials to reduce the peak Von Mises stress in the bottom layer of the vulnerable component, high polymer materials like engineering plastics generally outperform most metal and flexible materials. For example, Nylon 1,010, High-density polyethylene, Low-density polyethylene and Celluloid are all excellent materials in terms of performance. Of course, in the actual engineering design process, material researchers should comprehensively consider the vulnerable components to be protected and the actual load conditions.
4 Verification test
To validate whether gasket materials within the optimized parameter range specified in Section 3.3 effectively reduce the bottom layer stresses of the vulnerable energetic composites through homogenization-coordination mechanisms under low-amplitude, long-pulse dynamic loading conditions. This study uses simulated launch load testing methodology for validation experiments and selects process-stabilized Nylon 1010 as the preferred representative gasket material.
4.1 Test method selection
Common simulated launch load testing methods mainly include: closed bomb test, semi-closed bomb test, and large-scale drop hammer test (Liu et al., 2022; Xu and Qu, 2015; Zhou et al., 2023). However, it is difficult to measure stress distribution without interfering with stress concentration in vulnerable components in practical testing. Since one end of the specimen is typically constrained by ground anchorage, it remains challenging to determine through mechanical analysis whether the stress concentration point at the bottom of component initiates failure first. But for large-scale drop hammer tests, existing literature confirms that shear failure preferentially occurs at surface/interface stress concentration points in the selected vulnerable energetic composite components. The energetic properties induce localized friction and temperature rise during failure, collectively triggering decomposition behavior — a characteristic advantageous for observing and validating surface/interface protection (Baker et al., 1992; Wu and Huang, 2013; Duan et al., 2023). Accordingly, this study addresses the challenge of stress concentration testing at vulnerable material interfaces by utilizing the unique properties of the protected material, implementing comparative drop hammer testing to validate gasket performance.
4.2 Experimental setup
The large-scale drop hammer test employs a 400 kg drop hammer that free-falls along preset guide rails under gravitational force. The impact energy is transmitted via a piston to the head face of the sample within the shell, thereby simulating high-g axial loading conditions. Concurrently, the underlying data acquisition system measures and records the average axial stress at the sample’s base surface with a sampling rate of 200,000 Hz. In large-scale drop hammer testing, the pulse duration of stress loading typically ranges from 3 to 10 ms, with peak stresses attainable up to 1,500 MPa and maximum stress rates achievable at 300 MPa·ms−1. The impact loading characteristics closely approximate artillery bore pressure profiles, making this method extensively utilized in simulating launch load-induced shock. Figure 18 schematically depicts the large-scale drop hammer apparatus and its operational principle.
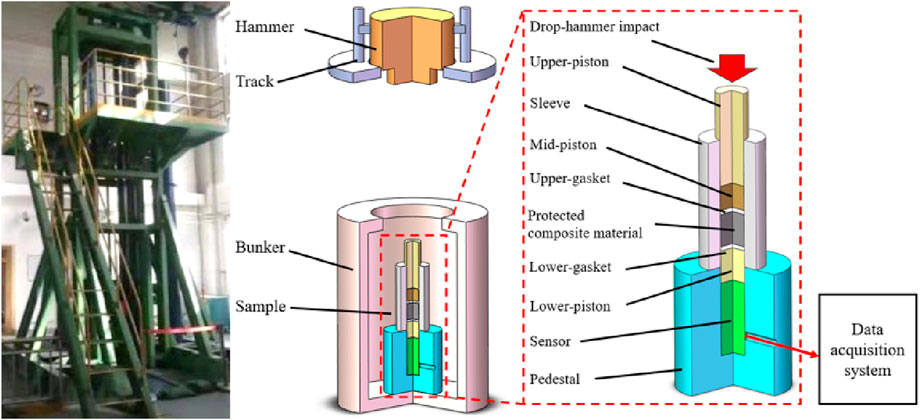
Figure 18. Large-scale drop hammer device and its schematic diagram.
It is difficult to completely extract the test sample after testing without altering its original state. Therefore, the study first uses the ‘up-and-down method' to determine the drop height corresponding to 100% decomposition reaction of the unprotected energetic composite material. Then, comparative tests are conducted on samples with gaskets under the same or even higher drop height conditions. Based on the preceding analysis of test methodologies, if the gasket-equipped samples can safely avoid decomposition reactions at higher drop heights, it can be concluded that the gasket protects typical vulnerable composite materials by reducing interface stress peaks.
The gasket material used in testing is Nylon 1010 (Wang and Huang, 1994; HG 2349, 1992; JB/ZQ 4196-2006, 2006), as shown in Figure 19a. As mentioned earlier, the thickness of the gasket in the preferred material range has almost no effect on the stress concentration and the peak Von Mises stress of the unprotected energetic composite material. Therefore, considering the convenience of experimental processing, the size of the gasket sample is taken as Φ 40 mm × 4 mm. During testing of samples containing gaskets, the gasket is bonded to the end face of the protected composite specimen using a two-component epoxy adhesive, as depicted in Figure 18. The protected vulnerable components are conventional energetic composites (Carlos and Scott, 2021), which are formed by compressing a mixture of 95.8 wt% 2,4,6,8,10,12-hexanitrohexaazaisowurtzitane (HNIW), 4.2 wt% plastic binder and graphite. Figure 19b shows 45 protected composite specimens manufactured under this formulation, designed as Φ40 mm × 40 mm cylinders with a density of 1.93 g·cm−3. These specimens are labeled c-1, c-2, c-3, etc., for identification.
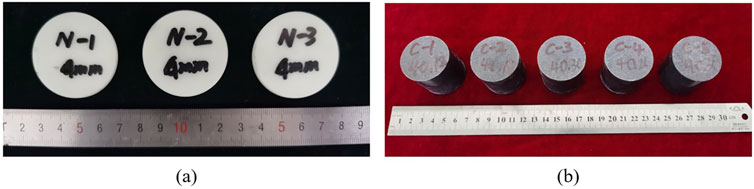
Figure 19. Photo of the test sample: (a) Nylon 1,010 gaskets; (b) Protected vulnerable components.
4.3 Experimental results and analysis
Based on gasket-free sample testing, impact-induced decomposition probabilities of vulnerable composite structures under 0.8–1.2 m drop height conditions were obtained as shown in Table 8. Through testing of samples with gaskets, decomposition probabilities of protected vulnerable structures under 1.0–1.2 m drop height conditions were acquired and presented in Table 9.
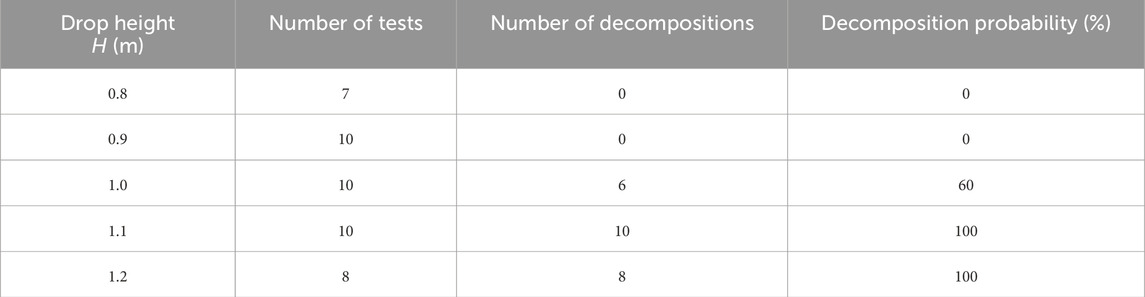
Table 8. Test results of drop hammer tests on gasket-free sample at different heights.
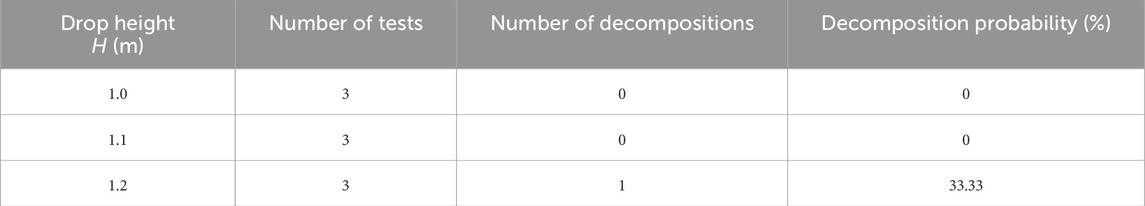
Table 9. Test results of drop hammer tests on samples with gaskets at different heights.
Test results demonstrate: Samples without gasket protection exhibited impact-induced decomposition reactions under all test conditions with drop heights H ≥ 1.1 m. In contrast, samples equipped with Nylon 1,010 gaskets showed no impact-induced decomposition reactions at H ≤ 1.1 m, with only small probabilities of reaction occurrence observed at H = 1.2 m.
For samples without gasket protection, measured stress-time profiles corresponding to critical drop height conditions in Table 8 were extracted and plotted in Figure 20a. For drop heights of 0.9 m and 1 m, maximum stress curves under non-decomposition conditions were selected. Regarding gasket-equipped samples, three experimental stress-time profiles from the H = 1.1 m condition in Table 9 are shown in Figure 20b.
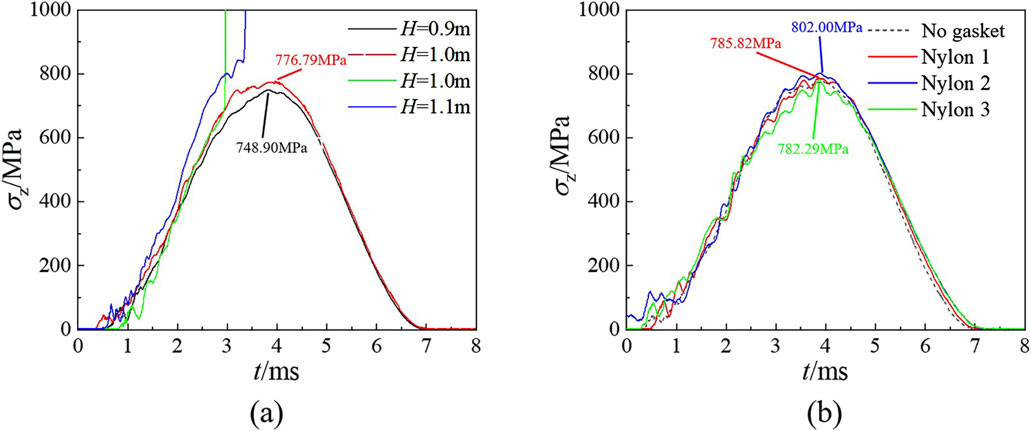
Figure 20. Stress-time curve of large-scale drop hammer tests: (a) Unprotected samples at different drop heights; (b) Gasket-protected samples at drop height of 1.1 m.
The experimental results demonstrate that the critical drop height threshold for impact-induced decomposition reactions in gasket-protected composite samples is significantly higher than in the unprotected state. Comparative analysis of the average axial stress on the surface of vulnerable samples in the drop hammer test reveals that the nylon gasket remains capable of effectively protecting the samples from impact-induced decomposition reactions, even under higher axial stress levels. Clearly, the gasket does not function by altering the actual magnitude of average stress, but rather improves the distribution of local stresses. This reduces the likelihood of localized thermal decomposition in energetic composites under simulated launch loads. The comparison of experimental results shows the optimally selected gasket material in this study indeed provides excellent protection for vulnerable composite materials subjected to low-amplitude, long-pulse dynamic loading conditions.
5 Conclusion
Through numerical simulation and large-scale drop hammer testing methodologies, this study investigates the impact protection mechanisms of engineering plastic gaskets on typical vulnerable components under low-amplitude, long-pulse dynamic loading conditions. The principal conclusions are as follows:
(1) The influence of gasket parameters on the stress in the bottom layer of the vulnerable component is presented. The σz and σ in the bottom layer of the vulnerable component with a gasket are influenced by the deformation capacity of the gasket material. Under the same μ, the σ value exhibits a trend of first decreasing and then increasing with the increase of the E of the gasket. This demonstrates a strong correlation with the magnitude of σz. For different μ, when the E of the gasket is small, its μ is positively correlated with σ and σz. When the E of the gasket is large, its μ has almost no effect on the σ and σz.
(2) The mechanism of the uniform and coordinated effect of the gasket on the bottom stress of the vulnerable component was revealed. The vulnerable component is protected under the launch load through deformation coordination by the gasket, which reduce the stress at the bottom of the vulnerable component, rather than through the mechanism of “buffering” or “attenuation”. Under the given μ, the E of the gasket material has a deformation equilibrium point Eeq, which results in uniform distribution of σ and σz. At the same time, a stress coordination point Esc is slightly greater than Eeq, which minimizes the peak σ under the combined action of various stresses. Both Eeq and Esc have values that are negatively correlated with the μ of the gasket material. The disparity in deformation capabilities between the gasket and the vulnerable component leads to changes in the triaxial stress on the contact surface. This is the key to achieving stress homogenization and coordination in the bottom layer of the vulnerable component.
(3) The optimal parameter ranges for gasket materials are defined, and the protective effects of engineering plastic gaskets under low-amplitude, long-pulse dynamic loading conditions are experimentally validated. Materials within the recommended parameter ranges—such as Nylon 1,010, high-density polyethylene (HDPE), low-density polyethylene (LDPE), and celluloid — reduce the bottom layer von Mises stress in vulnerable components by over 34.4% compared with traditional metallic substrates. Additionally, using Nylon 1010 as the optimized material, comparative testing between unprotected and gasket-protected samples was conducted through large-scale drop hammer simulation experiments. This conclusively verifies the protective effectiveness of engineering plastic gaskets under low-amplitude, long-pulse dynamic loading conditions.
Data availability statement
The original contributions presented in the study are included in the article/supplementary material, further inquiries can be directed to the corresponding author.
Author contributions
FX: Validation, Software, Investigation, Writing – original draft, Visualization, Writing – review and editing. JJ: Writing – review and editing, Methodology, Conceptualization. JM: Data curation, Writing – review and editing, Methodology. SW: Methodology, Writing – review and editing. ML: Writing – review and editing, Investigation.
Funding
The author(s) declare that no financial support was received for the research and/or publication of this article.
Conflict of interest
The authors declare that the research was conducted in the absence of any commercial or financial relationships that could be construed as a potential conflict of interest.
Generative AI statement
The author(s) declare that no Generative AI was used in the creation of this manuscript.
Publisher’s note
All claims expressed in this article are solely those of the authors and do not necessarily represent those of their affiliated organizations, or those of the publisher, the editors and the reviewers. Any product that may be evaluated in this article, or claim that may be made by its manufacturer, is not guaranteed or endorsed by the publisher.
References
Ackland, K., Anderson, C., and Ngo, T. D. (2013). Deformation of polyurea-coated steel plates under localised blast loading. Int. J. impact Eng. 51, 13–22. doi:10.1016/j.ijimpeng.2012.08.005
apps.dtic.mil (2025). Design accelerations for the army's excalibur projectile. Available online at: https://apps.dtic.mil/sti/tr/pdf/ADA435761.pdf/ (accessed on 15 April 2025).
Baker, P. J., Mellor, A. M., and Coffey, C. S. (1992). Critical impact initiation energies for three HTPB propellants. J. Propuls. power 8, 578–585. doi:10.2514/3.23517
Carlos, C., and Scott, I. J. (2021). Detonation performance of the CL-20-based explosive LX-19. Proc. Combust. Inst. 28, 3661–3669. doi:10.1016/j.proci.2020.07.089
Duan, H. Z., Wu, Y. Q., Yang, K., and Huang, F. L. (2023). Numerical simulation of drop weight impact sensitivity evaluation criteria for pressed PBXs. Def. Technol. 19, 76–90. doi:10.1016/j.dt.2022.01.013
Fu, J., Liu, G., Fan, C. H., Liu, Z. Y., and Luo, H. T. (2022). Design and experimental study on vibration reduction of an UAV lidar using rubber material. Actuators 11, 345. doi:10.3390/act11120345
Hou, X. F., and Werner, G. S. (1996). Projectile perforation of moving plates: experimental investigation. Int. J. Impact Eng. 18, 859–875. doi:10.1016/S0734-743X(96)00012-7
Huang, T. Y., Hong, Y., and Jin, S. L. (2010). Dynamic simulation of canister impact examination. Mach. Des. Manuf. Eng. 39, 74–76. doi:10.3969/j.issn.1672-1616.2010.05.019
Huang, Z. X. (2014). Theory and practice of shaped charge. 1st ed. Beijing: Beijing Institute of Technology Press, 216. Available online at: https://ss.zhizhen.com/detail_38502727e7500f2653114f3248dbb36576b35b9bb439a8a01921b0a3ea25510134114c969f2eae5cf859c3730be4d6288c64b13ae62da1f908e5d80a60b47bec3b971bc1e9c905f86254471b25d14ada (accessed on April 15, 2025).
Iqbal, M. A., Khan, S. H., Ansari, R., and Gupta, N. K. (2013). Experimental and numerical studies of double-nosed projectile impact on aluminum plates. Int. J. impact Eng. 54, 232–245. doi:10.1016/j.ijimpeng.2012.11.007
Jia, S. X., Huang, M., Zhang, H., Hu, B. W., Yan, M., and Zhang, Y. D. (2023). Performance comparison of different materials grain cushion under high overload. J. Proj. Rockets, Missiles Guid. 43, 32–38. doi:10.15892/j.cnki.djzdxb.2023.04.005
Kim, H. S., Yeom, K. S., Kim, S. S., and Sotsky, L. (2005). “Numerical simulation for the front section effect of missile warhead on the target perforation,” in Proceedings of the 22nd international symposium on ballistics, Vancouver, Canada. Available online at: https://www.researchgate.net/publication/313553392_Numerical_simulation_for_the_front_section_effect_of_missile_warhead_on_the_target_perforation (accessed on April 15, 2025).
Kou, J. F., and Xu, F. (2015). “The influence of bird's shape and attitude on bird-strike analysis of structure,” in Proceedings of the international conference on computer information systems and industrial applications (CISIA 2015), Bangkok, Thailand. Available online at: https://libresource.bit.edu.cn/https/443/cn/clarivate/webofscience/yitlink/wos/alldb/full-record/WOS:000359866200267 (accessed on April 15, 2025).
Li, D. W., Tan, Z. J., Hao, Y., Zeng, L. Q., and Wang, H. (2021). Effect of cushion materials and structure on protection effect of warhead charge. J. Ordnance Equip. Eng. 42, 36–41. doi:10.11809/bqzbgcxb2021.10.006
Li, Y. Y., Jia, X. Z., Gao, L. L., and Miao, X. (2017). Numerical simulation on cushion property of projectile inner cushion material during penetration. New Chem. Mater. 45, 128–130. Available online at: https://kns.cnki.net/nzkhtml/xmlRead/trialRead.html?dbCode=CJFD&tableName=CJFDTOTAL&fileName=HGXC201703044&fileSourceType=1&invoice=rZwY1U3NpNU5SuNISSVkHjfNH9z2enGpDpCu1Ml6poKpTCSOxgZpGQXUgvnf0%2buITb5BmVf5WU8dZIE0K9h%2fv6c5vg2YGiwMK8f%2f2slDGuUsI3BZmkEpyvToNEXQGsgDqIpLozFWfYrGzSFXcMQC2BE3b92OdjHJpi40Ez7FnF8%3d&appId=KNS_BASIC_PSMC (accessed on April 15, 2025).
Li, Z., You, M., and Kong, F. R. (2006). Numerical simulation for cleavage joints of two kinds of adhesives based on ANSYS. Chem. Adhesion 5, 299–301. doi:10.3969/j.issn.1001-0017.2006.05.004
Liang, F. D., Liang, Z. Y., and Deng, D. Z. (2020). Study on the composite structure of aluminum foam-filled thin-walled metal tube to reduce the charge overload inside the projectile during the penetration process. Shock and Vib. 2020, 1–11. doi:10.1155/2020/8887893
Liu, W., Wang, G. P., Rui, X. T., Gu, J., and Zhao, X. (2022). A hotspot model for PBX explosive charge ignition in a launch environment. Combust. Sci. Technol. 194, 1954–1972. doi:10.1080/00102202.2020.1849166
Liu, W., Wang, G. P., Rui, X. T., Li, C., and Wang, Y. (2024b). A test method for launch safety of explosive charge accurately simulating launch overload. J. Energetic Mater. 42, 479–499. doi:10.1080/07370652.2022.2108165
Liu, Y. R., Liu, Z. P., Ji, C. C., Yuan, D. X., and Jiang, L. (2024a). Experimental and numerical study on cushioning and energy absorption properties of artificial cartilage biomimetic material. Aerosp. Mater. and Technol. 54, 24–30. doi:10.12044/j.issn.1007-2330.2024.06.003
Mohammad, N. D., and Mohammadzadeh Gonabadi, A. (2019). Numerical study of energy absorption in aluminum foam sandwich panel structures using drop hammer test. J. Sandw. Struct. and Mater. 21, 3–18. doi:10.1177/1099636216685315
Mu, Y., Zhao, G. Q., and Zhang, C. R. (2010). Numerical investigation of die geometry effect on LDPE annular extrudate swell. J. Appl. Polym. Sci. 117, 91–109. doi:10.1002/app.31490
Nsiampa, N. N., Robbe, I. C., Papy, I. A., and Dr, I. (2011). “Development of a thorax finite element model for thoracic injury assessment,” in Proceedings of the 8th European LS-DYNA conference, strasbourg, France. Available online at: https://www.dynamore.de/de/download/papers/konferenz11/papers/session7-paper4.pdf (accessed on April 15, 2025).
O'Daniel, J. L., Krauthammer, T., Koudela, K. L., and Strait, L. H. (2002). An UNDEX response validation methodology. Int. J. Impact Eng. 27, 919–937. doi:10.1016/S0734-743X(02)00014-3
Riedel, W., Kawai, N., and Kondo, K. (2009). Numerical assessment for impact strength measurements in concrete materials. Int. J. Impact Eng. 36, 283–293. doi:10.1016/j.ijimpeng.2007.12.012
Sachin, S. G., and Ravindra, K. S. (2012). A numerical study on effect of strain rate and temperature in the taylor rod impact problem. Int. J. Struct. Changes Solids 4, 1–11. Available online at: https://www.researchgate.net/publication/259860307_A_numerical_study_on_effect_of_strain_rate_and_temperature_in_the_Taylor_rod_impact_problem (accessed on April 15, 2025).
Sun, J., Zhao, C. X., Li, J., Mei, H., Liu, X., and Yan, S. L. (2025). The fracture modes of biomimetic borosilicate glass protective composite. Materials 18, 739. doi:10.3390/ma18040739
Urtiew, P. A., Vandersall, K. S., Tarver, C. M., Garcia, F., and Forbes, J. W. (2008). Shock initiation of composition B and C-4 explosives: experiments and modeling. Russ. J. Phys. Chem. B Focus Phys. 2, 162–171. doi:10.1134/S1990793108020036
Wang, M. S., and Huang, J. C. (1994). Nylon 1010 properties and applications. J. Polym. Eng. 13, 155–174. doi:10.1515/POLYENG.1994.13.2.155
Wu, Y. Q., and Huang, F. L. (2013). Experimental investigations on a layer of HMX explosive crystals in response to drop-weight impact. Combust. Sci. and Technol. 185, 269–292. doi:10.1080/00102202.2012.716108
Xu, Z. F., and Qu, K. P. (2015). Study on experimental method of simulation loading for launch safety of charge. Initiators and Pyrotech. 6, 51–53. doi:10.3969/j.issn.1003-1480.2015.06.014
Zhang, Y. G., Lou, J. F., Zhou, T. T., Hong, T., and Zhang, S. D. (2016). Initial study on constitutive model of PBXs via viscoelastic statistical crack mechanics including anisotropic damage. Chin. J. High Press. Phys. 30, 301–310. doi:10.11858/gywlxb.2016.04.006
Keywords: long-pulse-width dynamic loading, interface impact protection, engineering plastics, finite element method, simulated impact test
Citation: Xu F, Jiang J, Men J, Wang S and Li M (2025) Interface stress control mechanism of engineering plastic gaskets during the low-amplitude and long-pulse-width dynamic loading process. Front. Mater. 12:1616537. doi: 10.3389/fmats.2025.1616537
Received: 23 April 2025; Accepted: 16 July 2025;
Published: 30 July 2025.
Edited by:
Erkan Oterkus, University of Strathclyde, United KingdomReviewed by:
Mehmet Eker, Tarsus University, TürkiyeCongjie Wei, Texas A and M University, United States
Copyright © 2025 Xu, Jiang, Men, Wang and Li. This is an open-access article distributed under the terms of the Creative Commons Attribution License (CC BY). The use, distribution or reproduction in other forums is permitted, provided the original author(s) and the copyright owner(s) are credited and that the original publication in this journal is cited, in accordance with accepted academic practice. No use, distribution or reproduction is permitted which does not comply with these terms.
*Correspondence: Feng Xu, MzIyMDIxNTAzOUBiaXQuZWR1LmNu