 Rayla Vilar1
 Kaoru Ikuma
- 1Department of Civil, Construction and Environmental Engineering, Iowa State University, Ames, IA, United States
- 2Department of Civil and Environmental Engineering, Michigan State University, East Lansing, MI, United States
In biocementation, the overall degree of cementation achieved is constrained by the successful completion of four individual, potentially rate-limiting steps: (i) adsorption of the biocatalyst urease onto the soil grains, (ii) retained enzymatic activity of adsorbed urease, (iii) calcium carbonate (CaCO3) precipitation, and (iv) soil strengthening. Failure in any single step can result in no or limited cementation thus limited strength gain. This study conducted a thorough analysis of each step and how they translated to the degree of cementation achieved in mixtures of uncoated, iron-coated, and hydrophobically treated sand. Our results showed that higher levels of protein adsorption and urease activity were found in columns containing 10% hydrophobic sand, but that did not translate to higher amounts of calcium precipitate produced. Approximately 23% more protein mass adsorbed onto the iron-coated columns compared to 100% sand columns, but the overall urease activity was similar among these columns. However, the strength gain was 100% higher in the iron-coated columns when compared to 100% sand columns, suggesting that CaCO3 bridging was highly effective in the iron-coated columns. Overall, the results from this study highlight the importance of considering each underlying mechanisms behind biocementation, especially when the goal is to optimize the technique for field applications.
1 Introduction
The growing efforts to reduce greenhouse gas emissions have led to an increased demand for sustainable engineering approaches within construction projects. In particular, chemical stabilization of soils, a commonly used ground improvement technique, has received significant concern due to the harmful effects it poses in the environment including the use of major contributors to greenhouse emissions such as fly ash, cement and lime and potential leaching of toxic contaminants to the environment (Anbu et al., 2016; Cetin et al., 2014; Dejong et al., 2010; Komonweeraket et al., 2015a; Komonweeraket et al., 2015b). To overcome this problem, researchers have proposed a new environmentally friendly technique for strengthening soils called biocementation. In biocementation, urea molecules (CO(NH2)2) are broken down to ammonium (NH4+) and carbonate (CO32-) ions in a chemical reaction catalyzed by urease enzymes. Carbonate ions can then precipitate as calcium carbonate (CaCO3) in the presence of calcium ions. The resulting CaCO3 acts as a cement bridging the soil particles, consequently leading to a stronger soil matrix. However, it is worth noting that urea hydrolysis is an extremely slow reaction that will not occur without the biocatalyst urease (Callahan et al., 2005; Krajewska and Functional, 2009; Ray et al., 2018). Therefore, biocementation can only be achieved if urease is present and catalytically active.
Biocementation can be performed through Microbial-Induced Calcite Precipitation (MICP), Enzyme-Induced Calcite Precipitation (EICP), or Bacterial Enzyme-Induced Calcite Precipitation (BEICP) [as reviewed by DeJong et al. (2010), Arab et al. (2021)]. The difference among these techniques lies in the form of urease used. MICP uses whole bacterial cells of the urease-secreting bacterium S. pasteurii and EICP utilizes purified plant urease, whereas BEICP uses crude bacterial protein extracts from Sporosarcina pasteurii. MICP has been shown to be effective for soil stabilization on coarse-grained soils (gravel and sand) with little success for finer soils such as silt and clay, primarily because bacterial cells are too large to move through the small voids of fine-grained soils (Hoang et al., 2018; Neupane et al., 2014; Neupane et al., 2015). Both EICP (Carmona et al., 2016; Kavazanjian and Hamdan, 2015; Neupane et al., 2013; Neupane et al., 2015; Yasuhara et al., 2012) and BEICP (Hoang et al., 2020; Hoang et al., 2018; Jiang et al., 2020) techniques can be effective for coarse and fine-grained soils, as both utilize the urease enzyme in a cell-free form to catalyze urea hydrolysis. However, EICP involves a single-protein system, while BEICP comprises a multi-component protein mixture. Prior studies have shown that in such multi-protein systems, adsorption occurs in a stepwise manner initially dominated by smaller proteins, which are later displaced by larger, higher-affinity proteins. This phenomenon is known as the Vroman effect (Noh and Vogler, 2007; Vilaseca et al., 2013; Lassen and Malmsten, 1997; Latour, 2008). Other studies have shown that proteins remaining in solution can dynamically interact with those already adsorbed, and potentially “turn” or “rotate” the initially adsorbed proteins, depending on their surface affinity (Hirsh et al., 2013; Latour, 2008). Therefore, the adsorption behavior of urease onto soil grains differs significantly between EICP and BEICP treatments. Moreover, the urease enzyme from S. pasteurii has been shown to have both greater activity and lower temperature of activation than jack bean ureases (Larson and Kalion, 1954), suggesting that the bacterial urease is more effective than jack bean urease for overall biocementation. From a techno-economical perspective, EICP approach involves extraction and purification of plant enzymes typically from jack bean, which adds complexity and extra costs to the technique. All considered, there is a need for a deeper study of the BEICP method.
The biocementation process, regardless of the technique employed, encompasses four critical and potentially rate limiting steps, in order of occurrence: (1) adsorption of the biocatalyst urease onto the soil grains; (2) retained enzymatic activity of adsorbed urease; (3) CaCO3 precipitation in the vicinity of adsorbed biocatalysts; and (4) soil strength gain. The overall degree of cementation achieved is constrained by the successful implementation of these individual steps; a single failure results in no or limited cementation. Nevertheless, no studies thus far have used a systematic approach to understand the impact of each of these rate limiting steps in the overall cementation achieved for BEICP. This knowledge is imperative for the optimization of biocementation techniques, especially for broader application of the method. In fact, most studies focused on optimizing the biocementation process have limited their consideration only to injection methods, reagent concentrations, and enzyme kinetics (Bachmeier et al., 2002; Harkes et al., 2010; Lauchnor et al., 2015; Ng et al., 2012).
Therefore, the overall goal of this study is to conduct a comprehensive analysis of each individual rate limiting step in the BEICP process and understand how they impact the degree of cementation achieved. In particular, this study aims to investigate the adsorption behavior of the S. pasteurii protein mixtures onto soils and the resulting urease activity over the course of the BEICP soil treatment. Furthermore, an assessment on calcium consumption, precipitation, and soil strength gain was conducted. To account for the intrinsic heterogeneity in natural soils, BEICP treatments were performed in soil mixtures with different surface chemistries including electric charge and hydrophobicity. Though natural soils typically have a net negative surface charge, positively charged patches are often present within a soil matrix. To mimic this scenario, Ottawa sand was coated with iron oxide to form positively charged soil particles. Similarly, Ottawa sand was coated with the hydrophobic agent siloxane to add hydrophobic patches that are often present in natural soils due to organic matter.
2 Materials and methods
2.1 Protein acquisition
The soil bacterium S. pasteurii (ATCC 11859) was used as the source of urease. Growth media and, cell harvesting followed previously described procedures (Pinto Vilar and Ikuma, 2021). In brief, cells were grown in a growth media comprising 20 g/L tryptic soy broth, 0.08 M ammonium sulfate and 0.13 M Tris base at pH 9, and incubated at room temperature and with continuous agitation until OD600nm values reached 1.2–1.3. At that points cells were harvested by centrifugation at 8000 g for 5 min at 20 °C. The cells were washed twice with 50 mM phosphate buffer (pH 8.0 ± 0.03) to remove the growth media and stored at 4 °C until the time of use. Protein extraction procedure was performed as previously described in (Pinto Vilar and Ikuma, 2022). In brief, cells pellets described above, were resuspended in a 50 mM HEPES buffer solution containing 2 mM EDTA (pH 8) to a final concentration that was approximately doubled the original. Cells were lysed through sonication, a total of 18 cycles were performed, with each cycle comprising 2 min of continuous sonication in an ultrasonic bath (40 kHz, M3800, Fisher Scientific, Waltham, MA) followed by 1 min of cooling. After completion of all cycles, the cell debris was removed by centrifugation at 8000 g for 5 min at 20 °C. The supernatant containing the protein extract was collected and filtered through a 0.8 μm pore size syringe filter. The concentrations of the total protein extract were measured using Nanodrop measurement at 280 nm wavelength and stored at −20 °C until further use.) All chemicals and materials were obtained from Fisher Scientific (Waltham, MA) unless otherwise noted.
2.2 Soil characterization
Iron and hydrophobic coated sand soils were obtained following procedures described previously (Pinto Vilar and Ikuma, 2022), where Ottawa silica sand 20/30 (Gilson Company Inc., Lewis Center, OH) was coated with iron or siloxane respectively. In short, iron-coated sand was obtained by mixing 80 g of standard Ottawa silica sand with 200 mL of 2.5 M FeCl3 solution and then oven-heated first for 3 h at 110 °C and then for additional 3 h at 550 °C. After cooling at room temperature samples were rinsed with DI water to remove excess chemicals and air dried. The final step comprised of mixing this air-dried sample in a 1:2 ratio with a 2.1 M solution of Fe(NO3)3 containing 1.5% w/w ratio of a 10 M NaOH solution. This mixture was heated to 110 °C overnight or until completely dried. The resulting coated sand aggregates were then mechanically broken and sieved through a U.S Sieve No. 20 and No.30 (0.85 and 0.6 mm openings, respectively); the portion retained between the two sieves was defined as iron-coated sand. To obtain the hydrophobic coated sand, Ottawa silica sand was mixed with 100% Organo Silane breathable-soil waterproofing from TerraSil (Zydex Industries, Gujarat, India) in a 10% weight ratio. The mixture was left at room temperature overnight and subsequently oven dried at 110 °C until completely dry. The dried sand aggregates were sieved through U.S Sieve No. 20 and No.30 following the process described for the iron-coated sand to yield a 100% hydrophobic sand. Streaming current and contact angle measurements were reported in our previous work to confirm positive charge and hydrophobicity of the iron- and siloxane-coated sands, respectively (Pinto Vilar and Ikuma, 2022).
To obtain the tested soil mixtures, coated sands were mixed with uncoated Ottawa silica sand 20/30 in a 10% ratio by weight to yield 10% iron soil and 10% hydrophobic soil mixtures, herein defined as 10% IRON and 10% HF. Soil samples composed of plain Ottawa silica sand are referred to as 100% SAND. Particle size distributions of each soil mixture were obtained using laser diffractometry analysis with a Malvern Mastersizer 3000 instrument (Malvern Panalytical Ltd., Malvern, UK) to confirm that all soil mixtures were composed of sandy soils only; even though the coatings slightly altered the particle sizes, mixtures of 10% coated with 90% uncoated sand resulted in similar particle size distributions (Supplementary Figure S1). The specific surface area of each soil mixture was determined through N2 physisorption analysis with a Micromeritics ASAP 2020 physisorption BET instrument (Micromeritics, Atlanta, GA) (Table 1). BET analysis was conducted as previously described (Pinto Vilar and Ikuma, 2022).
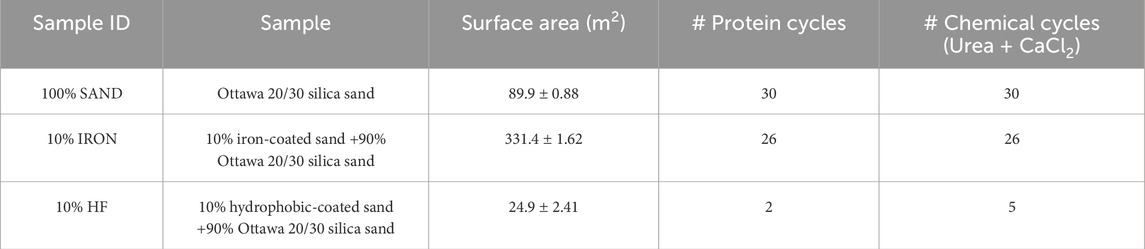
Table 1. Total surface area and treatment cycle configuration for each treated soil specimens.
2.3 BEICP soil column treatment
Soil columns were packed with 100% SAND, 10% IRON and 10% HF soil mixtures, premixed with nanopure water to achieve a 5% moisture content. Soil mixtures were packed into clear PVC cylindrical shape columns of 10 cm height and 5 cm diameter, following the column design and moist-tamping packing technique described previously (Hoang et al., 2018). Each column underwent treatment cycles with bacterial proteins and chemical solutions as described below.
For 100% SAND and 10% IRON columns, each treatment cycle started with recirculation of 2 pore volumes (PV) of crude protein extracts containing 1.5 mg/mL of proteins through each column for 2 h, followed by 30 min of free-gravity drainage. To remove unadsorbed proteins, columns were then rinsed with 3 PVs of a 50 mM HEPES buffer solution containing 2 mM EDTA (pH 8) without recirculation. Next, 6 PVs of an equimolar solution of urea and CaCl2 (0.15 M each) was recirculated to the columns for 16 ± 2 h, followed by another buffer rinse to flush out any unused chemical solution, which marked the end of a cycle. Columns were top fed at an approximate rate of 8 mL/min. The number of treatment cycles varied for each column type (Table 1) as all columns were treated until they were completely clogged. However, for the 10% HF columns, protein addition was only necessary in every other cycle because urease adsorbed in a given treatment cycle retained sufficient enzymatic activity to degrade the substrate urea in the subsequent two chemical treatment cycles. Additionally, the 10% HF columns were treated for a much lower number of cycles (Table 1) due to rapid clogging.
2.4 Quantification of protein adsorption
The total concentration of proteins was measured in the crude protein extract before the start of each cycle and after the 2 h recirculation period using Nanodrop measurement at 280 nm wavelength. The difference between these two values was considered the total amount of proteins adsorbed per cycle in each column.
2.5 Urea consumption and urease activity measurements
The amount of urea consumed during each treatment cycle was measured in all columns following previously described methods (Rahmatullah and Boyde, 1980). Urease activity measurements were conducted in selected cycles by measuring urea consumption over a 2 h period following the start of a chemical cycle, with drainage water samples taken approximately every 5 min. Urease activity was calculated based on the linear slope obtained for each reaction, and is herein expressed in U, with 1 U corresponding to 1 µmol of urea consumed per min. Furthermore, the theoretical calcium demand for each column was calculated as the sum of the demand for every cycle, assuming a 1:1 ratio of calcium needed to urea consumed as shown below (where i = treatment cycle; n = total number of treatment cycles; 16 h indicates chemical treatment time per cycle).
2.6 Soil strength measurements
BEICP treated soil samples were carefully removed from the PVC mold and oven dried at 60 °C for 24 h or until completely dried. Soil specimens were then subjected to unconfined compressive strength (UCS) tests following the ASTM D4219-08 standard procedure using a loading rate of 2 mm/min. Reported data represent peak values obtained before failure and are expressed in kPa. UCS tests were stopped immediately after failure to preserve the column structure as much as possible for subsequent measurements of the spatial distribution of CaCO3 precipitates.
2.7 Qualitative analysis of CaCO3 precipitates
Following UCS tests, qualitative analyses of the cemented soil samples were conducted at the Materials Analysis and Research Laboratory at Iowa State University. Specifically, X-ray diffraction (XRD) analysis was conducted to identify the crystalline phases of the CaCO3 precipitated in each column as described in the Supplementary Material.
Furthermore, to better visualize the configuration of the CaCO3 deposited onto the soil grains and the cementation patterns across the different BEICP treated samples, cemented pieces from each column were analyzed through scanning electron microcopy coupled with energy dispersive X-ray spectroscopy (SEM-EDS). SEM-EDS analyses were conducted as described in the Supplementary Material.
2.8 Quantification of calcium amount precipitated
After the completion of UCS tests, the cemented columns were roughly divided into three equal parts referring to the top, middle, and bottom sections of each column. To dissolve the precipitated CaCO3, each soil section from each column was digested with 1 M HCl until no bubbles were generated. The total amount of acid added was recorded, and aqueous calcium concentrations were measured using a Shimadzu-9000 Inductively Coupled Plasma Emission Spectrometer instrument. The total amount of calcium precipitated in each column per section was then calculated based on the total volume of HCl added during the acid digestion.
3 Results
3.1 Protein adsorption
The average amount of proteins adsorbed in each soil column per treatment cycles followed a decreasing order of 10% HF >10% IRON >100% SAND (Figure 1). These results suggest that overall, most of the proteins in the BEICP protein extract had higher affinity towards hydrophobic surfaces (Pinto Vilar and Ikuma, 2022). In fact, approximately 28% and 54% more proteins adsorbed in the 10% HF columns compared to the 10% IRON and 100% SAND columns, respectively. More proteins adsorbed onto 10% IRON columns compared to 100% SAND, suggesting that iron-coating of sand particles affected protein affinity for adsorption.
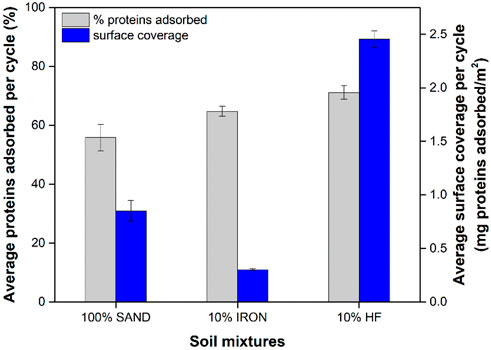
Figure 1. Average protein adsorption per cycle for each soil mixture shown as percentage of adsorbed proteins and surface coverage for each column type. The surface coverage was calculated assuming no changes in surface occurred due to CaCO3 precipitation over the course of BEICP treatments. Data shown represent averages of three independent experiments, with error bars indicating one standard deviation. Samples were found statistically different to each other based on t-tests (p-value <0.05).
Upon adsorption, adsorbed proteins often undergo conformation changes in their molecular structure, which are dependent on the protein-surface binding affinity and the surface coverage (Larsericsdotter et al., 2001; Norde and Favier, 1992; Norde and Giacomelli, 1999; Norde and Giacomelli, 2000). Surface coverage, herein defined as the ratio of the total amount of adsorbed proteins in mg to the total surface area in m2, provides information on the protein packing density and the extent of protein-protein interactions among adsorbed proteins in close vicinity. The surface coverage of treated soil specimens decreased in the order of 10% HF >100% SAND >10% IRON (Figure 1). The theoretical calculations of the percentage of surface covered by the adsorbed proteins suggest that adsorption onto the 10% HF was composed of multilayers with 154% coverage, whereas the 100% SAND and 10% IRON soil surfaces were only 18% and 6% covered, respectively (Supplementary Figure S2).
3.2 Urease enzymatic activity
Urease activity measurements were conducted in all treated soil columns for selected cycles (Supplementary Figure S3). The average urease activity per treatment cycle for each type of column is shown in Figure 2. The 10% HF columns exhibited the highest urease activity per cycle, whereas no significant difference was found among the 100% SAND and 10% IRON columns (p-value <0.05). These results correlated with the total amount of proteins adsorbed in each column (Figure 1), which showed higher amounts of proteins adsorbed in the 10% HF columns compared to 100% SAND and 10% IRON columns. However, the difference in the amounts of protein adsorbed between 10% HF and 100% SAND/10% IRON columns (Figure 1) were approximately three times smaller than the difference observed in their retained urease activity (Figure 2).
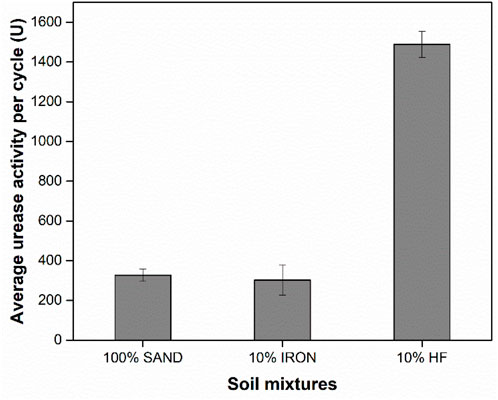
Figure 2. Urease activity measurements for each treated soil specimen normalized to the number of treatment cycles. Values represent averages of three independent experiments, with error bars indicating one standard deviation. 100% SAND and 10% IRON samples are not significantly different from each other based on t-tests (p-value <0.05).
3.3 Calcium carbonate precipitation
The theoretical calcium demand and overall calcium precipitated in each column are shown in Figure 3. Because the theoretical calcium demand is directly proportional to the urease activity and the number of treatment cycles, 100% SAND and 10% IRON columns had similar theoretical Ca demands (p-values >0.05), but the 10% HF columns were significantly lower due to the much lower number of treatment cycles (Table 1). More importantly, though urease activity was higher in the 10% HF columns (Figure 2), similar percentages of calcium precipitated in all columns when compared to their theoretical calcium demand (p-values >0.05). Thus, these results suggest that Ca precipitation rates are not directly proportional to retained urease activity, pointing to the need for further optimization of urea-to-CaCl2 ratios in BEICP treatments.
Figure 3. The total theoretical calcium demands and actual calcium precipitated (as % of Ca demand) in each column. Data shown represents the averages of three independent experiments with error bars indicating one standard deviation. Samples SAND and 10% IRON samples in both data sets were found not to be statistically different based on t-tests (p -value <0.05).
The distribution of Ca precipitates over the column depth is shown in Figure 4. Results show that Ca precipitates were more evenly distributed across the depth of 100% SAND and 10% IRON columns. However, approximately half of the Ca precipitated in the top section in 10% HF, which was likely the reason for the premature clogging observed in these columns. It is noteworthy that though not clearly statistically different, 10% IRON columns appeared to have more uniform distribution of precipitated Ca compared to 100% SAND. These trends were confirmed via thermogravimetric analysis of subsamples (data not shown), implying that the Ca distributions observed here were indeed attributable to CaCO3 precipitation instead of residual CaCl2. Ca concentration typically varies as depth increases with an increase in depth leading to a decrease in the Ca precipitation (Jiang et al., 2016). Whiffin et al. (2007) also showed that amount of Ca precipitation was proportional to the porosity of the material, and the precipitated Ca content decreased with increasing distance from the injection point (Whiffin et al., 2007). In addition, Ivanov and Chu (2008) observed such trends and claimed such decreases were expected via depth which was commonly attributed to the decrease in permeability of the top layers due to clogging of pores within the soil matrix.
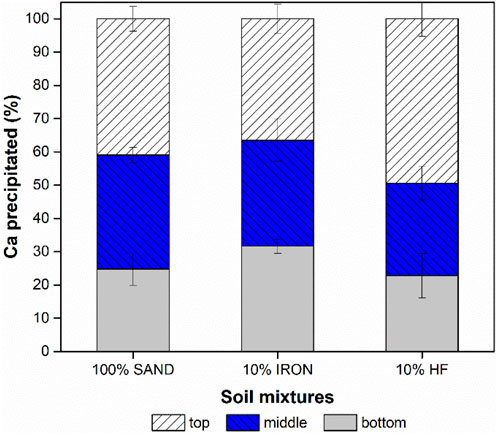
Figure 4. Distribution of Ca precipitates over the depth of each column type. Data shown represents the averages of three independent experiments with error bars indicating one standard deviation. Samples were found not to be statistically different based on t-tests (p-values >0.05).
Furthermore, to better visualize the shapes and structures of the CaCO3 precipitates on the soil grains, SEM analysis was conducted in cemented samples (Figure 5). Qualitative comparisons between the SEM pictures of each column suggests that biocementation in 100% SAND (Figures 5a–c) and 10% IRON (Figures 5d–f) columns yielded larger-sized and more disorganized crystal structures that were often fused together. On the other hand, samples from 10% HF columns (Figures 5g–i) exhibited discrete crystal structures with smoother surfaces. This difference in the crystal structure patterns of 100% SAND/10% IRON columns compared to the 10% HF columns can potentially be attributed to the much higher number of treatment cycles conducted in the SAND and IRON columns (Table 1). In addition, though CaCO3 can be biologically precipitated in several morphological forms (Li et al., 2013; Sondi and Salopek-Sondi, 2005), XRD analysis confirmed that all CaCO3 indeed precipitated as calcite (Supplementary Figure S4), which is the desired form for biocementation applications due to its high thermodynamic stability (Anbu et al., 2016). EDS analysis further confirmed the presence of Ca, C, and O in all types of columns (Supplementary Figure S5).
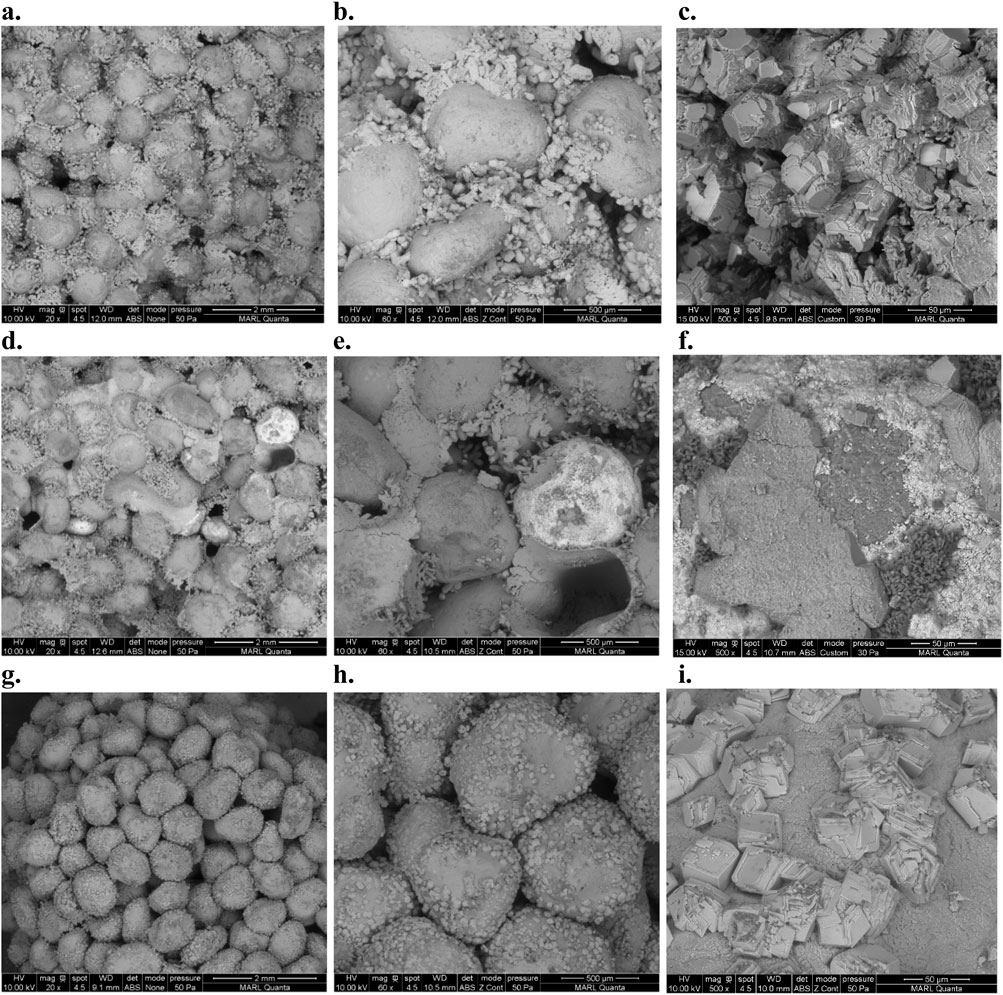
Figure 5. SEM pictures of cemented pieces from 100% SAND columns (a–c), 10% IRON columns (d–f), and 10% HF columns (g–i). The pictures shown were taken at 20× (a,d,g), ×60 (b,e,h), and ×500 (c,f,i) magnifications.
Indeed, previous studies have shown the crystal structure and morphology of biologically-precipitated CaCO3 are strongly influenced by reaction times as well as the enzyme and calcium concentrations (Anbu et al., 2016; Li et al., 2013; Meldrum and Cölfen, 2008; Sondi and Salopek-Sondi, 2005). CaCO3 precipitates appeared to evenly coat the soil grains in all columns (Figure 5). However, conclusions regarding the optimal distribution of CaCO3 crystals could not be formulated for the 100% SAND and 10% IRON columns because treatments were conducted until complete clogging was achieved, likely resulting in most soil voids being filled with CaCO3 precipitates.
3.4 Soil strengthening
Post-BEICP treatments, all columns were able to stand without support prior to drying, pointing to successful biocementation in all samples even in the 10% HF column that was subjected to a much smaller number of treatment cycles. Strength gain was quantified using UCS measurements (Figure 6). Substantial strength gain was achieved in 10% IRON and 100% SAND columns. The strength gain achieved in the two samples were comparable to those obtained in previous biocementation studies of sandy-soils (Al Qabany and Soga, 2013; Cui et al., 2017; Cui et al., 2021; Hoang et al., 2018; Krishnan et al., 2021; Yasuhara et al., 2012). However, the degree of cementation achieved in the 10% IRON columns was more than 2× the observed values for the 100% SAND, even though the retained urease activity in the 10% IRON columns was very low (Figure 2).
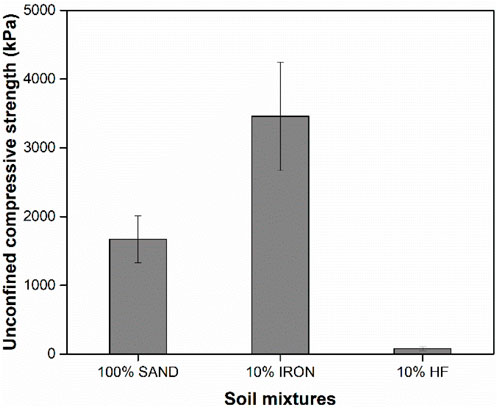
Figure 6. Unconfined compressive strength measurements conducted according to ASTM D42190-08 standard norm. Data shown represents averages of three independent experiments and error bars indicate one standard deviation. Samples were statistically different based on t-tests (p-value <0.05).
4 Discussion
This study highlights the importance of understanding the fundamental processes encompassed in biocementation techniques and specifically describes how each critical process correlate to the overall degree of cementation that can be achieved. The optimization of the BEICP technique and its application in the field are highly dependent on the identification of the rate limiting steps and finding solutions to increase their rates. Specifically, here we discuss three key rate limiting steps: protein adsorption, urease activity, CaCO3 precipitation, and soil strength gain.
For BEICP applications, the likelihood of protein adsorption is mainly influenced by the affinity of the S. pasteurii crude protein mixture towards the treated soil surfaces, and the total soil surface area available for adsorption (Pinto Vilar and Ikuma, 2021; Pinto Vilar and Ikuma, 2022). Here, we observed that the average amount of proteins adsorbed in each soil column per treatment cycle followed a decreasing order of 10% HF >10% IRON >100% SAND. In the 10% IRON and 100% SAND columns, electrostatic interactions are expected to be the major driving force behind adsorption since both surfaces are hydrophilic. The distinction between these two samples lies in their isoelectric points (pIs); the pI for Ottawa silica sand is 2 (Kuo and Angeles, 1987) whereas for the iron-coated sand is 9.3 (Benjamin et al., 1996). As the protein adsorption step was conducted at pH 8, the surface charge in 100% SAND columns was expected to be mostly negatively charged, whereas in 10% IRON columns several positively charged patches were likely present. At this pH, we found that S. pasteurii crude protein extracts were mostly composed of negatively charged proteins (Pinto Vilar and Ikuma, 2021) including urease (pI of 4.6 (Christians and Kaltwasser, 1986)), pointing to surfaces with lower pIs exhibiting stronger electrostatic repulsion. In the case of 10% HF columns, adsorption is likely driven by a synergistic combination of electrostatic and hydrophobic interactions (Pinto Vilar and Ikuma, 2022).
These results agree with several studies that show that proteins are in general highly attracted to hydrophobic surfaces (Absolom et al., 1987; Azioune et al., 2002; Huang et al., 1999; Kim and Somorjai, 2003; Robertson et al., 1991; Tangpasuthadol et al., 2003; Wang et al., 2017), and protein adsorption onto hydrophobic surfaces is likely to occur even under unfavorable electrostatic scenarios (Norde, 2003). However, it is important to note that most of these studies were conducted on single protein systems or binary/ternary mixtures. In contrast, our study employs a complex protein mixture comprising hundreds of proteins, making the system significantly more representative of natural conditions, but also more challenging to interpret. In such complex systems, adsorption behavior and retained enzymatic activity are strongly influenced by surface packing density, which is dependent on surface chemistry but also heavily influenced by intramolecular protein interactions. Our previous work using batch adsorption experiments showed that urease in a crude protein extract was preferentially adsorbed onto hydrophobic containing soils, despite the presence of many other proteins that competed for adsorption sites (Pinto Vilar and Ikuma, 2022). Therefore, though urease adsorption was not specifically measured here, it is likely that there was a high abundance of urease enzymes adsorbed on the 10% HF column as part of the crude protein adsorption.
Both the highest protein surface coverage and highest urease activity were observed in 10% HF columns compared to the 100% SAND and 10% IRON columns. Protein adsorption is often accompanied by a decrease in enzymatic activity. Several studies have shown enzyme immobilization alters Michaelis-Menten kinetic parameters resulting in a lower Vmax and higher Km (Datta et al., 2017; Gianfreda et al., 1991; Huang et al., 1999; Pflug, 1982), where Vmax is the maximum reaction rate and Km relates to the enzyme affinity to the substrate. Conformational changes, denaturation, and unfavorable orientations of adsorbed proteins are frequently associated with decreases in the catalytic efficiency of adsorbed proteins (Datta et al., 2017; Norde and Giacomelli, 1999; Secundo, 2013). In high surface coverage scenarios, adsorbed proteins are closely clustered and are more likely to overlay active sites, which in turn could decrease enzyme activity (Gianfreda et al., 1992; Kim and Somorjai, 2003). On the other hand, at low surface coverages, adsorbed proteins have more to room to spread on the surface and conformational changes in the molecular structure are more likely to be accompanied by protein denaturation (Hoeve et al., 1965; Larsericsdotter et al., 2001; Norde and Favier, 1992; Norde and Giacomelli, 2000). Indeed, our observations suggest that denaturation and/or unfavorable orientation of adsorbed urease might have caused the lower-than-expected activity values observed in the 100% SAND and 10% IRON columns. We hypothesize that in the 10% HF column proteins were tightly packed and adsorption happened in a multilayer fashion (Figure 1; Supplementary Figure S2), which then limited denaturation allowing for greater catalytic activity of adsorbed urease. In addition, our results suggest that urease was preferentially adsorbed onto hydrophobic patches of sand (Pinto Vilar and Ikuma, 2022), suggesting that there may have been more urease enzymes adsorbed in the 10% HF column that led to higher urease activities. Therefore, this study shows that a correlation between total amount of protein adsorbed and retained enzymatic is highly dependent on the soil surface chemistry and surface packing density.
Furthermore, although the 10% HF retained higher levels of urease activity, the amount of calcium precipitates formed (compared to theoretical demand of calcium) was similar to those found in 100% SAND and 10% IRON columns. While early clogging of the 10% HF column made direct comparisons difficult, our results suggest that retained urease activity and Ca precipitation are not necessarily proportionally correlated, perhaps pointing to an additional, unexplored rate limiting step in the BEICP process. This contrasts with the findings of most biocementation studies, which generally report a positive correlation between higher urease activity and increased calcium carbonate precipitation. However, it is important to note that previous studies typically measured urease activity in the treatment solution, i.e., the activity of free urease prior to adsorption, whereas the present study evaluated retained activity of the adsorbed urease. The decision to measure the activity of the adsorbed urease was based on the extensive literature showing decreased enzymatic activity upon protein adsorption to solid surfaces (Datta et al., 2017; Gianfreda et al., 1991; Huang et al., 1999; Pflug, 1982). These are fundamentally different variables, and a such additional studies are necessary to draw meaningful conclusions on the relationship between enzymatic activity of adsorbed urease and calcium precipitation. Though not enough data were collected here, the observed differences in CaCO3 morphology by SEM may provide a starting point for understanding this missing rate limiting step.
Finally, strength gain was much lower in the 10% HF columns compared to the other columns, which was partly due to early clogging of the columns (5 chemical treatments for HF compared to 26/30 treatments for others). We suspect that the higher urease activity retained in the 10% HF samples likely caused the premature clogging in above layers of specimen in these columns, which in turn resulted in an overall lower degree of cementation achieved based on UCS measurements. However, the high retained urease activity observed in these columns suggest that BEICP would be highly effective in soils with at least 10% hydrophobic content as long as appropriate design considerations are given. Therefore, we suggest that a treatment regimen with a lower total protein concentration would be more appropriate for hydrophobic soils to decrease the urease enzymatic activity and allow more cycles treatments to be performed prior to clogging. Using a lower total protein concentration can also significantly decrease the overall cost of BEICP application in the field. However, the high retained urease activity observed in these columns suggest that BEICP would be highly effective in soils with at least 10% hydrophobic content as long as appropriate design considerations are given.
On the other hand, strength gain was significantly higher in 10% IRON columns compared to 100% SAND and 10% HF (107% and over 4000% higher, respectively), even though the retained urease activity in the 10% IRON columns was very low; these observations suggest that BEICP for soil strengthening may be highly effective in soils with higher iron contents. This difference in retained urease activity and degree of cementation achieved suggests that there could be preferential CaCO3 precipitation occurring between soil grains in the presence of iron to promote bridging. Because the biocementation in this study were performed until complete clogging was achieved, the SEM images shown in Figure 5 are unable to provide information on that point. As soil iron content is considered to be generally inhibitory of urease activity and adsorption (Slimani et al., 2023; Pinto Vilar and Ikuma, 2022), this possible preferential Ca precipitation is likely not correlated to urease activity. However, the relatively more uniform distribution of Ca throughout the column depth in 10% IRON columns (Figure 4) may have contributed to greater strength, pointing to the possible importance of the surface distribution of the adsorbed proteins. Future studies are needed to better elucidate these possibilities.
Overall, while the four initially identified rate limiting steps for BEICP were shown to be important, our results suggest that there may yet be some missing links that lead to the ultimate goal of soil strengthening. However, our findings suggest that prior to implementation of BEICP, it is worthwhile to get a full profile of the soil to be treated, including but not limit to total surface area, pH, and soil composition, especially hydrophobicity and iron content, to design a customizable BEICP treatment for each soil. For example, if such soil characteristics are well documented, protein concentrations and numbers of treatment cycles could be tailored appropriately for each BEICP treatment scheme. In addition, applying a small amount of hydrophobic coating to soils prior to biocementation could potentially increase the likelihood of successful biocementation. Finally, this study proves that a crude bacterial protein extract can yield successful cementation in soils with different surface chemistries and that enzyme purification is not needed for biocementation applications.
Data availability statement
The original contributions presented in the study are included in the article/Supplementary Material, further inquiries can be directed to the corresponding author.
Author contributions
RV: Conceptualization, Investigation, Writing – original draft, Validation, Formal Analysis, Visualization, Methodology. KI: Writing – review and editing, Supervision, Resources, Project administration, Conceptualization, Visualization, Methodology. BC: Resources, Conceptualization, Writing – review and editing, Methodology.
Funding
The author(s) declare that no financial support was received for the research and/or publication of this article.
Acknowledgments
The authors thank Joel Nott, Warren Straszheim, Wenyu Huang, and Bradley Miller for providing instrument access and assistance in data interpretation.
Conflict of interest
The authors declare that the research was conducted in the absence of any commercial or financial relationships that could be construed as a potential conflict of interest.
Generative AI statement
The author(s) declare that no Generative AI was used in the creation of this manuscript.
Any alternative text (alt text) provided alongside figures in this article has been generated by Frontiers with the support of artificial intelligence and reasonable efforts have been made to ensure accuracy, including review by the authors wherever possible. If you identify any issues, please contact us.
Publisher’s note
All claims expressed in this article are solely those of the authors and do not necessarily represent those of their affiliated organizations, or those of the publisher, the editors and the reviewers. Any product that may be evaluated in this article, or claim that may be made by its manufacturer, is not guaranteed or endorsed by the publisher.
Supplementary material
The Supplementary Material for this article can be found online at: https://www.frontiersin.org/articles/10.3389/fmats.2025.1641275/full#supplementary-material
References
Absolom, D. R., Zingg, W., and Neumann, A. W. (1987). Protein adsorption to polymer particles: role of surface properties. J. Biomed. Mater. Res. 21, 161–171. doi:10.1002/jbm.820210202
Al Qabany, A., and Soga, K. (2013). Effect of chemical treatment used in MICP on engineering properties of cemented soils. Geotech. Eng. - Geotech. Symp., 107–115. doi:10.1680/bcmpge.60531.010
Anbu, P., Kang, C. H., Shin, Y. J., and So, J. S. (2016). Formations of calcium carbonate minerals by bacteria and its multiple applications. Springerplus 5, 250–26. doi:10.1186/s40064-016-1869-2
Arab, M. G., Alsodi, R., Almajed, A., Yasuhara, H., Zeiada, W., and Shahin, M. A. (2021). State-of-the-Art review of enzyme-induced calcite precipitation (EICP) for ground improvement: applications and prospects. Geosciences 11, 492. doi:10.3390/geosciences11120492
Azioune, A., Chehimi, M. M., Miksa, B., Basinska, T., and Slomkowski, S. (2002). Hydrophobic protein-polypyrrole interactions: the role of van der Waals and Lewis acid-base forces as determined by contact angle measurements. Langmuir 18, 1150–1156. doi:10.1021/la010444o
Bachmeier, K. L., Williams, A. E., Warmington, J. R., and Bang, S. S. (2002). Urease activity in microbiologically-induced calcite precipitation. J. Biotechnol. 93, 171–181. doi:10.1016/S0168-1656(01)00393-5
Benjamin, M. M., Sletten, R. S., Bailey, R. P., and Bennett, T. (1996). Sorption and filtration of metals using iron-oxide-coated sand. Water Res. 30, 2609–2620. doi:10.1016/s0043-1354(96)00161-3
Callahan, B. P., Yuan, Y., and Wolfenden, R. (2005). The burden borne by urease. J. Am. Chem. Soc. 127, 10828–10829. doi:10.1021/ja0525399
Carmona, J. P. S. F., Oliveira, P. J. V., and Lemos, L. J. L. (2016). Biostabilization of a sandy soil using enzymatic calcium carbonate precipitation. Procedia Eng. 143, 1301–1308. doi:10.1016/j.proeng.2016.06.144
Cetin, B., Aydilek, A. H., and Li, L. (2014). Trace metal leaching from embankment soils amended with high-carbon fly ash. J. Geotech. Geoenvironmental Eng. 140, 1–13. doi:10.1061/(ASCE)GT.1943-5606.0000996
Christians, S., and Kaltwasser, H. (1986). Nickel-content of urease from Bacillus pasteurii. Arch. Microbiol. 145, 51–55. doi:10.1007/BF00413026
Cui, M. J., Zheng, J. J., Zhang, R. J., Lai, H. J., and Zhang, J. (2017). Influence of cementation level on the strength behaviour of bio-cemented sand. Acta Geotech. 12, 971–986. doi:10.1007/s11440-017-0574-9
Cui, M. J., Lai, H. J., Hoang, T., and Chu, J. (2021). One-phase-low-pH enzyme induced carbonate precipitation (EICP) method for soil improvement. Acta Geotech. 16, 481–489. doi:10.1007/s11440-020-01043-2
Datta, R., Anand, S., Moulick, A., Baraniya, D., Pathan, S. I., Rejsek, K., et al. (2017). How enzymes are adsorbed on soil solid phase and factors limiting its activity: a review. Int. Agrophysics. 31, 287–302. doi:10.1515/intag-2016-0049
Dejong, J. T., Mortensen, B. M., Martinez, B. C., and Nelson, D. C. (2010). Bio-mediated soil improvement. Ecol. Eng. 36, 197–210. doi:10.1016/j.ecoleng.2008.12.029
Gianfreda, L., Rao, M. A., and Violante, A. (1991). Invertase β-fructosidase: effects of montmorillonite, AL-hydroxide and AL(OH)x-montmorillonite complex on activity and kinetic properties. Soil Biol. biochem. 23, 581–587. doi:10.1016/0038-0717(91)90116-2
Gianfreda, L., Rao, M. A., Violante, A., Chimico-agrarie, D. S., Federico, N., and Universitl, V. (1992). Adsorption, activity and kinetic properties of urease on montmorillonite, aluminium hydroxide and AL(OH)x-montmorillonite complexes. Soil Biol. biochem. 24, 51–58. doi:10.1016/0038-0717(92)90241-O
Harkes, M. P., Van Paassen, L. A., Booster, J. L., Whiffin, V. S., and Van Loosdrecht, M. C. M. (2010). Fixation and distribution of bacterial activity in sand to induce carbonate precipitation for ground reinforcement. Ecol. Eng. 36, 112–117. doi:10.1016/j.ecoleng.2009.01.004
Hirsh, S. L., McKenzie, D. R., Nosworthy, N. J., Denman, J. A., Sezerman, O. U., and Bilek, M. M. (2013). The vroman effect: competitive protein exchange with dynamic multilayer protein aggregates. Colloids Surfaces B Biointerfaces 103, 395–404. doi:10.1016/j.colsurfb.2012.10.039
Hoang, T., Alleman, J., Cetin, B., and Choi, S. G. (2018). Engineering properties of biocementation coarse- and fine-grained sand catalyzed by bacterial cells and bacterial enzyme. Can. Geotech. J., 1–66. doi:10.1139/cgj-2018-0191
Hoang, T., Alleman, J., Cetin, B., Ikuma, K., and Choi, S. G. (2020). Sand and silty-sand soil stabilization using bacterial enzyme induced calcite precipitation (BEICP). J. Mater. Civ. Eng. 32, 808–822.
Hoeve, C. A. J., DrMarzio, E. A., and Peyser, P. (1965). Adsorption of polymer molecules at low surface coverage. J. Chem. Phys. 42, 2558–2563. doi:10.1063/1.1696332
Huang, Q., Jiang, M., and Li, X. (1999). Adsorption and properties of urease immobilized on several iron and aluminum oxides (hydroxides) and kaolinite. Eff. Min. Interact. Soil Freshw. Environ., 167–168. doi:10.1007/978-1-4615-4683-2_17
Ivanov, V., and Chu, J. (2008). Applications of microorganisms to geotechnical engineering for bioclogging and biocementation of soil in situ. Rev. Environ. Sci. Bio/Technology 7, 139–153. doi:10.1007/s11157-007-9126-3
Jiang, N. J., Yoshioka, H., Yamamoto, K., and Soga, K. (2016). Ureolytic activities of a urease-producing bacterium and purified urease enzyme in the anoxic condition: implication for subseafloor sand production control by microbially induced carbonate precipitation (MICP). Ecol. Eng. 90, 96–104. doi:10.1016/j.ecoleng.2016.01.073
Jiang, X., Rutherford, C., Cetin, B., and Ikuma, K. (2020). “Reduction of water erosion using bacterial enzyme induced calcite precipitation (BEICP) for sandy soil,” in Geo-congress 2020 biogeotechnics (Reston, VA), 104–110. doi:10.1061/9780784482834.012
Kavazanjian, E., and Hamdan, N. (2015). “Enzyme induced carbonate precipitation (eicp) columns for ground improvement,” in Ifcee, 2252–2261. doi:10.1061/9780784479087.209
Kim, J., and Somorjai, G. A. (2003). Molecular packing of lysozyme, fibrinogen, and bovine serum albumin on hydrophilic and hydrophobic surfaces studied by infrared-visible sum frequency generation and fluorescence microscopy. J. Am. Chem. Soc. 125, 3150–3158. doi:10.1021/ja028987n
Komonweeraket, K., Cetin, B., Aydilek, A., Benson, C. H., and Edil, T. B. (2015a). Geochemical analysis of leached elements from fly ash stabilized soils. J. Geotech. Geoenvironmental Eng. 141, 04015012–04015014. doi:10.1061/(ASCE)GT.1943-5606.0001288
Komonweeraket, K., Cetin, B., Aydilek, A. H., Benson, C. H., and Edil, T. B. (2015b). Effects of pH on the leaching mechanisms of elements from fly ash mixed soils. Fuel 140, 788–802. doi:10.1016/j.fuel.2014.09.068
Krajewska, B., and Functional, U. I. . (2009). Catalytic and kinetic properties: a review. J. Mol. Catal. B 59, 9–21. doi:10.1016/j.molcatb.2009.01.003
Krishnan, V., Khodadadi Tirkolaei, H., Martin, K., Hamdan, N., van Paassen, L. A., and Kavazanjian, E. (2021). Variability in the unconfined compressive strength of EICP-treated “standard” sand. J. Geotech. Geoenvironmental Eng. 147, 06021001. doi:10.1061/(asce)gt.1943-5606.0002480
Kuo, J. F., Angeles, L., and Yen, T. (1987). Further investigation of the surface charge properties of oxide surfaces in oil-bearing sands and sandstones. J. Colloid. 115, 9–16. doi:10.1016/0021-9797(87)90003-8
Larsericsdotter, H., Oscarsson, S., and Buijs, J. (2001). Thermodynamic analysis of proteins adsorbed on silica particles: electrostatic effects. J. Colloid Interface Sci. 237, 98–103. doi:10.1006/jcis.2001.7485
Larson, A. D., and Kalion, R. E. (1954). Purification and properties of bacterial urease. J. Bacteriol. 68, 67–73. doi:10.1128/jb.68.1.67-73.1954
Lassen, Bo, and Malmsten, M. (1997). Competitive protein adsorption at plasma polymer surfaces. J. colloid interface Sci. 186 (1), 9–16. doi:10.1006/jcis.1996.4529
Latour, R. A. (2008). Biomaterials: protein-surface interactions. Encycl. biomaterials Biomed. Eng. 1, 270–284. eBook ISBN: 9780429154065. doi:10.1201/b18990-27
Lauchnor, E. G., Topp, D. M., Parker, A. E., and Gerlach, R. (2015). Whole cell kinetics of ureolysis by Sporosarcina pasteurii. J. Appl. Microbiol. 118, 1321–1332. doi:10.1111/jam.12804
Li, W., Chen, W. S., Zhou, P. P., Zhu, S. L., and Yu, L. J. (2013). Influence of initial calcium ion concentration on the precipitation and crystal morphology of calcium carbonate induced by bacterial carbonic anhydrase. Chem. Eng. J. 218, 65–72. doi:10.1016/j.cej.2012.12.034
Meldrum, F. C., and Cölfen, H. (2008). Controlling mineral morphologies and structures in biological and synthetic systems. Chem. Rev. 108, 4332–4432. doi:10.1021/cr8002856
Neupane, D., Yasuhara, H., Kinoshita, N., and Unno, T. (2013). Applicability of enzymatic calcium carbonate precipitation as a soil-strengthening technique. J. Geotech. Geoenvironmental Eng. 139, 2201–2211. doi:10.1061/(ASCE)GT.1943-5606.0000959
Neupane, D., Yasuhara, H., and Kinoshita, N. (2014). Soil improvement through enzymatic calcite precipitation technique: small to large scale experiments. Int. J. Landslide Environ. 1, 65–66.
Neupane, D., Yasuhara, H., Kinoshita, N., and Ando, Y. (2015). Distribution of mineralized carbonate and its quanti fi cation method in enzyme mediated calcite precipitation technique. Soils Found. 55, 447–457. doi:10.1016/j.sandf.2015.02.018
Ng, W., Lee, M., and Hii, S. (2012). An overview of the factors affecting microbial-induced calcite precipitation and its potential application in soil improvement, int. J. Civil. Environ. Struct. Constr. Archit. Eng. 6, 188–194. doi:10.5281/zenodo.1084674
Noh, H., and Vogler, E. A. (2007). Volumetric interpretation of protein adsorption: competition from mixtures and the vroman effect. Biomaterials 28 (3), 405–422. doi:10.1016/j.biomaterials.2006.09.006
Norde, W. (2003). “Driving forces for protein adsorption at solid surfaces,” in Biopolym. Interfaces. Second Ed., 30–46. Available online at: https://books.google.com/books?id=R_RkyT-NUjkC&pgis=1.
Norde, W., and Favier, J. P. (1992). Structure of adsorbed and desorbed proteins. Colloids Surfaces 64, 87–93. doi:10.1016/0166-6622(92)80164-W
Norde, W., and Giacomelli, C. E. (1999). Conformational changes in proteins at interfaces: from solution to the interface, and back. Macromol. Symp. 145, 125–136. doi:10.1002/masy.19991450114
Norde, W., and Giacomelli, C. E. (2000). BSA structural changes during homomolecular exchange between the adsorbed and the dissolved states. J. Biotechnol. 79, 259–268. doi:10.1016/S0168-1656(00)00242-X
Pflug, W. (1982). Effect of clay minerals on the activity of polysaccharide cleaving soil enzymes. Z. Für Pflanzenernährung Und Bodenkd 502, 493–502. doi:10.1002/jpln.19821450509
Pinto Vilar, R., and Ikuma, K. (2021). Adsorption of urease as part of a complex protein mixture onto soil and its implications for enzymatic activity. Biochem. Eng. J. 171, 108026. doi:10.1016/j.bej.2021.108026
Pinto Vilar, R., and Ikuma, K. (2022). Effects of soil surface chemistry on adsorption and activity of urease from a crude protein extract: implications for biocementation applications. Catalysts 12, 230. doi:10.3390/catal12020230
Rahmatullah, M., and Boyde, T. R. C. (1980). Improvements in the determination of urea using diacetyl monoxime; methods with and without deproteinisation. Clin. Chim. Acta. 107, 3–9. doi:10.1016/0009-8981(80)90407-6
Ray, H., Saetta, D., and Boyer, T. H. (2018). Characterization of urea hydrolysis in fresh human urine and inhibition by chemical addition. Environ. Sci. Water Res. Technol. 4, 87–98. doi:10.1039/c7ew00271h
Robertson, C. R., Gast, A. P., and Tilton, R. D. (1991). Manipulation of hydrophobic interactions in protein adsorption. Langmuir 7, 2710–2718. doi:10.1021/la00059a051
Secundo, F. (2013). Conformational changes of enzymes upon immobilisation. Chem. Soc. Rev. 42, 6250–6261. doi:10.1039/c3cs35495d
Slimani, I., Zhu-Barker, X., Lazicki, P., and Horwath, W. (2023). Reviews and synthesis: iron – a driver of nitrogen bioavailability in soils? Biogeosciences 20, 3873–3894. doi:10.5194/bg-20-3873-2023
Sondi, I., and Salopek-Sondi, B. (2005). Influence of the primary structure of enzymes on the formation of CaCO 3 polymorphs: a comparison of plant (Canavalia ensiformis) and bacterial (Bacillus pasteurii) ureases. Langmuir 21, 8876–8882. doi:10.1021/la051129v
Tangpasuthadol, V., Pongchaisirikul, N., and Hoven, V. P. (2003). Surface modification of chitosan films. Carbohydr. Res. 338, 937–942. doi:10.1016/S0008-6215(03)00038-7
Vilaseca, P., Dawson, K. A., and Franzese, G. (2013). Understanding and modulating the competitive surface-adsorption of proteins through coarse-grained molecular dynamics simulations. Soft Matter 9 (29), 6978–6985. doi:10.1039/c3sm50220a
Wang, W., Chen, L., Zhang, Y., and Liu, G. (2017). Adsorption of bovine serum albumin and urease by biochar. IOP Conf. Ser. Earth Environ. Sci. 61, 012143–13. doi:10.1088/1755-1315/61/1/012143
Whiffin, V. S., van Paassen, L. A., and Harkes, M. P. (2007). Microbial carbonate precipitation as a soil improvement technique. Geomicrobiol. J. 24 (February), 417–423. doi:10.1080/01490450701436505
Keywords: bacterial enzyme-induced calcite precipitation, urease, soil strengthening, protein adsorption, hydrophobic soil, iron
Citation: Vilar R, Ikuma K and Cetin B (2025) Impact of sand surface coating on biocementation mechanisms. Front. Mater. 12:1641275. doi: 10.3389/fmats.2025.1641275
Received: 04 June 2025; Accepted: 13 October 2025;
Published: 20 October 2025.
Edited by:
Wenkui Dong, University of New South Wales, AustraliaReviewed by:
Jue Li, Chongqing Jiaotong University, ChinaZhipeng Li, Washington State University, United States
Copyright © 2025 Vilar, Ikuma and Cetin. This is an open-access article distributed under the terms of the Creative Commons Attribution License (CC BY). The use, distribution or reproduction in other forums is permitted, provided the original author(s) and the copyright owner(s) are credited and that the original publication in this journal is cited, in accordance with accepted academic practice. No use, distribution or reproduction is permitted which does not comply with these terms.
*Correspondence: Kaoru Ikuma, a2lrdW1hQGlhc3RhdGUuZWR1