 Shixiang Yi1
 Xiang Liu
- 1Institute of Structural Material Failure and Strengthening Technology, Ningbo Polytechnic University, Ningbo, Zhejiang, China
- 2School of Civil Engineering, Fujian University of Technology, Fuzhou, China
Due to its efficient use of marine resources, seawater sea-sand concrete (SWSSC) has emerged as a promising sustainable building material and has garnered significant interest. At the same time, fiber reinforced polymer (FRP) materials show great potential for application in SWSSC structures owing to their excellent mechanical properties and corrosion resistance. However, the behavior of SWSSC is more uncertain compared to conventional concrete, which affects the reliability of structural members in terms of load-bearing capacity. To ensure the safety and reliability of FRP-SWSSC members, a database of 49 flexural tests on FRP-reinforced SWSSC beams was compiled to characterize the statistical distribution of the concrete material and the error associated with the computational model. Based on this data, a reliability analysis was conducted and a reliability model was developed. The partial factors were calibrated according to the target reliability index, resulting in recommended values of 1.4 for the Chinese code, 1.6 for ACI, 1.5 for CSA, and 1.3 for Eurocode.
1 Introduction
In recent years, the large-scale construction activities have led to a severe shortage of river sand resources, and the price of river sand has been continuously rising (Wang et al., 2023). At the same time, the global consumption of fresh water for preparing concrete amounts to about 2 billion tons annually (Miller et al., 2018), which has become an increasingly serious issue. Therefore, the using of sea water and sea-sand have attracted the attention of scholars.
The chemical and physical properties of sea sand vary significantly due to geographical factors. Chemically, research by Dhondy et al. (2024) indicated that the chloride ion content in sea sand is generally higher than that in river sand. The silicon content in sea sand can vary due to the presence of shells and organic materials, but it typically exceeds that of river sand. In terms of physical properties, Supplementary Appendix 1 compiles fineness modulus data for sea sand from various regions. The particle size distribution of sea sand varies by region. However, it generally complies with the second-class sand standards outlined in the guideline (GB/T14684-2011, 2011). The fineness modulus and particle size distribution of second-class sand meet the requirements for concrete mixing, making it an ideal material for concrete production.
The research on seawater sea-sand concrete (SWSSC) primarily focuses on its mechanical properties, durability, and issues related to rebar corrosion. Figure 1 synthesizes findings from 29 previous studies, illustrating the differences between SWSSC and ordinary concrete (OPC) in terms of slump, setting time, early compressive strength, 28-day compressive strength, elastic modulus, water absorption, resistance to chloride ion penetration, resistance to sulfate ion attack, and freeze-thaw durability. In this figure, the blue bars indicate improvements of SWSSC over OPC in certain metrics, while the red bars denote declines in other areas. The numbers in parentheses next to the axis labels represent the number of references cited.
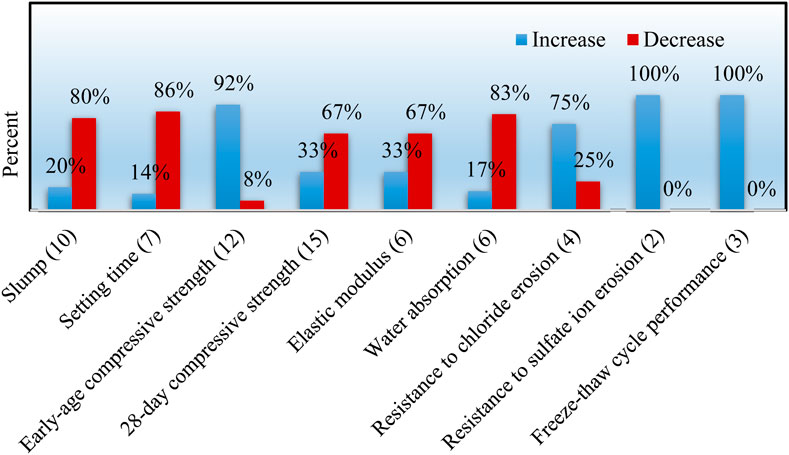
Figure 1. Difference between seawater sea sand concrete and river water river sand concrete.
In studies of mechanical properties, numerous findings indicate that concrete made with seawater sea sand experiences a slight increase in compressive strength during the first 7 days compared to freshwater river sand concrete (Pan et al., 2021). However, after 28 days of curing, its compressive strength typically falls below that of freshwater river sand concrete (Panchanathan and Paramasivam, 2022). The initial and final setting times of concrete, as well as its workability, significantly affect the construction methods and timeline of concrete structures. Most studies indicated (Lu et al., 2023a) that the initial and final setting times of SWSSC are shorter than those of freshwater river sand concrete.
Fiber-reinforced polymer (FRP) bars have been proposed as an ideal alternative. FRP bars, known for their lightweight, high strength, corrosion resistance, and fatigue resistance, are considered an ideal reinforcement material (Mai et al., 2023; Zeng et al., 2022). Their excellent corrosion resistance can effectively resist the erosion of chloride ions and moisture and oxygen in the air, thereby significantly improving the durability and reliability of concrete structures. Researchers had conducted various studies on FRP-reinforced concrete specimens, for examples, Jafari et al. (2025) presented experimental and analytical insights into hybrid FRP systems and may provide useful comparative data or modeling strategies relevant to the current study’s treatment of FRP types (CFRP, GFRP, BFRP). Zeng et al. (2025) FRP-3D printed concrete analyzed the bond performance between FRP bars and 3D-printed high-performance concrete. In addition, there are some related studies, such as the bond-slip behavior of FRP bars (Fahmy et al., 2021), steel-FRP (SFCB) composite bar concrete columns (Han et al., 2023), FRP bar and steel bar hybrid-reinforced concrete beams (Hussein et al., 2022), FRP fabric-reinforced concrete beams (Liao et al., 2022), FRP and steel bar-reinforced concrete slabs (Wang et al., 2020), FRP-confined concrete cylinders (Wu et al., 2006), long-term bond performance of FRP- concrete (Zhang et al., 2025), FRP- UHPC foundation (Fan et al., 2025a), and FRP-UHPC beam (Fan et al., 2025b). The combination of FRP and SWSSC is of great significance for engineering construction and has attracted increasing attention.
The bending effect of concrete structures under load is one of the most significant effects (Sun et al., 2025). Thus, numerous scholars had studied the flexural performance of FRP-reinforced concrete beams to explore the failure characteristics of FRP- concrete beams (Lu et al., 2023b; Younis et al., 2020). The properties and failure mode of FRP significantly differ from those of steel. FRP has a higher tensile strength than traditional steel reinforcement but a lower elastic modulus, and FRP does not exhibit plastic deformation, which means there are no obvious warning signs before its failure. Thus, FRP-reinforced concrete beams exhibit brittle failure characteristics under flexural action.
Concrete material is an artificially mixed material, and its performance inevitably has variability. In structural design, it is necessary to consider the impact of performance variability on structural safety, usually based on reliability indicators and the degree of material performance variability, to obtain the partial coefficients of the material performance. For example, in the specification (GB 50010-2010, 2010), the material safety factor for concrete strength is 1.40; The materials factor is suggested as 1.50 in European standards; The American standard ACI 318 does not use partial factors, but instead uses strength reduction factors. However, there are performance differences between SWSSC and RC, which pose new requirements for the reliability assessment of FRP-SWSSC beams, and it is necessary to conduct a more detailed reliability assessment of FRP-SWSSC beams to obtain the partial factor for SWSSC.
To this end, this paper first collected 49 groups of FRP-SWSSC test data and analyzed the model uncertainty based on the bearing capacity calculation model provided by guideline (GB 50608-2020, 2020); Secondly, statistical characteristics of SSSWC were collected, and the ultimate state function for the flexural bearing capacity of FRP-SWSSC beams was established, and the reliability index calculation method based on MCS L-moment was introduced. Thirdly, the analysis was conducted on the parameter sensitivity of the reliability of the flexural bearing capacity of FRP-SWSSC. Finally, the partial factor of SSSWC strength under a large number of conditions were calibrated, and reasonable partial factors were obtained.
2 Flexural load capacity model of FRP-SWSSC
2.1 Prediction model
The flexural capacity prediction model recommended in the guideline (GB 50608-2020, 2020) was employed as the prediction model for the reliability analysis of FRP-SWSSC beams, and the model includes three types of failure modes for FRP-RC beams, which are tension failure, compression failure, and boundary failure.
In the case of tensile failure, the concrete has not yet reached its ultimate compressive strain, while the FRP reinforcement has already attained its ultimate tensile strain. The corresponding stress-strain distribution is illustrated in Figure 2 During compressive failure, the concrete is crushed after reaching its ultimate compressive strain, even though the FRP reinforcement has not yet reached its ultimate tensile strain, and the stress-strain distribution is shown in Figure 3. In the boundary failure condition, both the concrete and the FRP reinforcement reach their ultimate compressive and tensile strains nearly simultaneously. The corresponding stress-strain distribution is depicted in Figure 4.
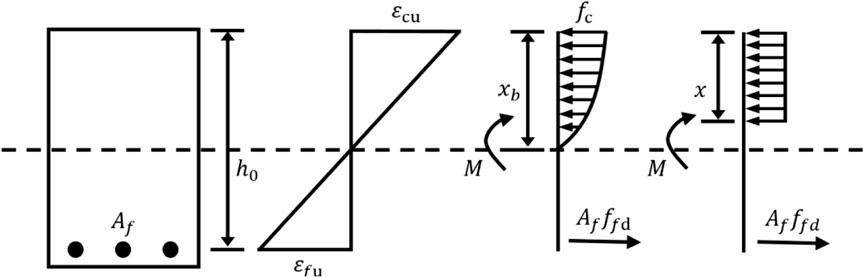
Figure 2. Stress-strain distribution of the tensile failure section.
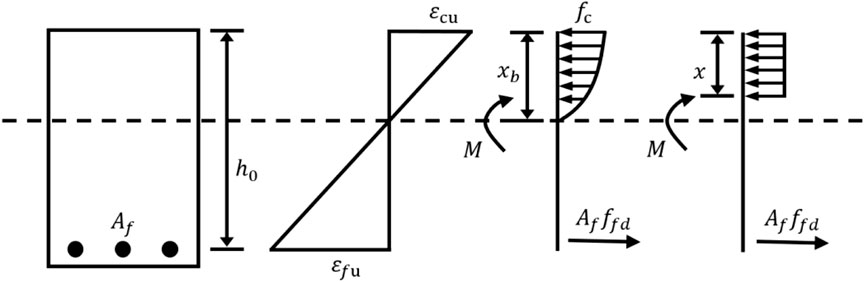
Figure 3. Stress-strain distribution of the boundary failure section.
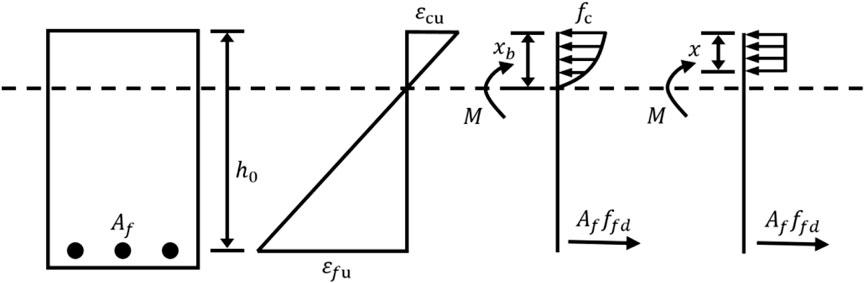
Figure 4. Stress-strain distribution of the compressive failure section.
According to the guideline (GB 50608-2020, 2020), the selection of different failure modes is based on the boundary reinforcement ratio ρfb, which is determined by Equation 1,
where α1 and β1 represent the coefficients for the equivalent rectangular stress distribution in the concrete compression zone, which are determined according to the (GB 50010-2010, 2010). Here, εcu is the ultimate compressive strain of the concrete, with a value of 0.0033. According to the guideline (GB 50068-2018, 2018), the design value for the axial compressive strength of concrete, denote as fc, is calculated using Equation 2.
where γf is the partial factor for SWSSC, which will be calibrated through reliability analysis described later. fc,k is the specified value for the axial compressive strength of concrete. The standard value for the cubic compressive strength of concrete fcu,k can be converted to fc,k.
The design value for the tensile strength of the FRP reinforcement, ffd, is determined by using Equation 3 as specified in the guideline (GB 50608-2020, 2020).
where ffd,k is the standard value of the tensile strength of FRP bars, γfd is the partial factor for FRP bars, with a value of 1.25. γe is the environmental influence factor for FRP bars. The factors γe for different FRP bars under indoor conditions are obtained from Table 1.
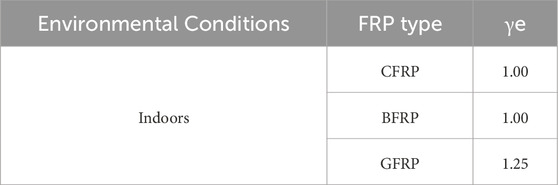
Table 1. Environmental reduction factor for FRP, γe.
For tensile failure, the guideline (GB 50608-2020, 2020) proposes that when the reinforcement ratio ρf < 1.5ρfb, the flexural member undergoes tensile failure, and the flexural capacity of the is calculated by using Equation 4,
where Af is the cross-sectional area of longitudinal FRP reinforcement in the tensile zone; h0 is the distance from the FRP reinforcement resultant point to the edge of the concrete compression zone; x is the height of the equivalent rectangular stress block in the concrete compression zone, determined by Equation 5,
where Ef is the elastic modulus of FRP reinforcement.
For compression failure, the guideline (GB 50608-2020, 2020) states that when the reinforcement ratio ρf > 1.5ρfb, the flexural member undergoes compression failure, and the flexural capacity can be calculated by the following formulas (Equations 6, 7),
with
2.2 Model error
The prediction model was obtained by the theory and the experimental experience, and it inevitably leads to errors in the model. To comprehensively evaluate the reliability of flexural capacity of FRP-SWSSC beams and obtain the appropriate partial factor of SWSSC, the experimental results of 49 FRP-reinforced concrete beams were collected, as shown in Supplementary Appendix 2. The investigated parameters include concrete compressive strength fcu, area of FRP bars Af, elastic modulus Ef, tensile strength ffd, reinforcement ratio ρf, and type of FRP. The distribution of material properties in the database is illustrated in Figure 5. The prediction model introduced in the above section was used to calculate the results corresponding to these parameters, and the model error μ is defined as Equation 8,
where Mu,exp represents the experimental result, while Mu,pre is the predicted result.
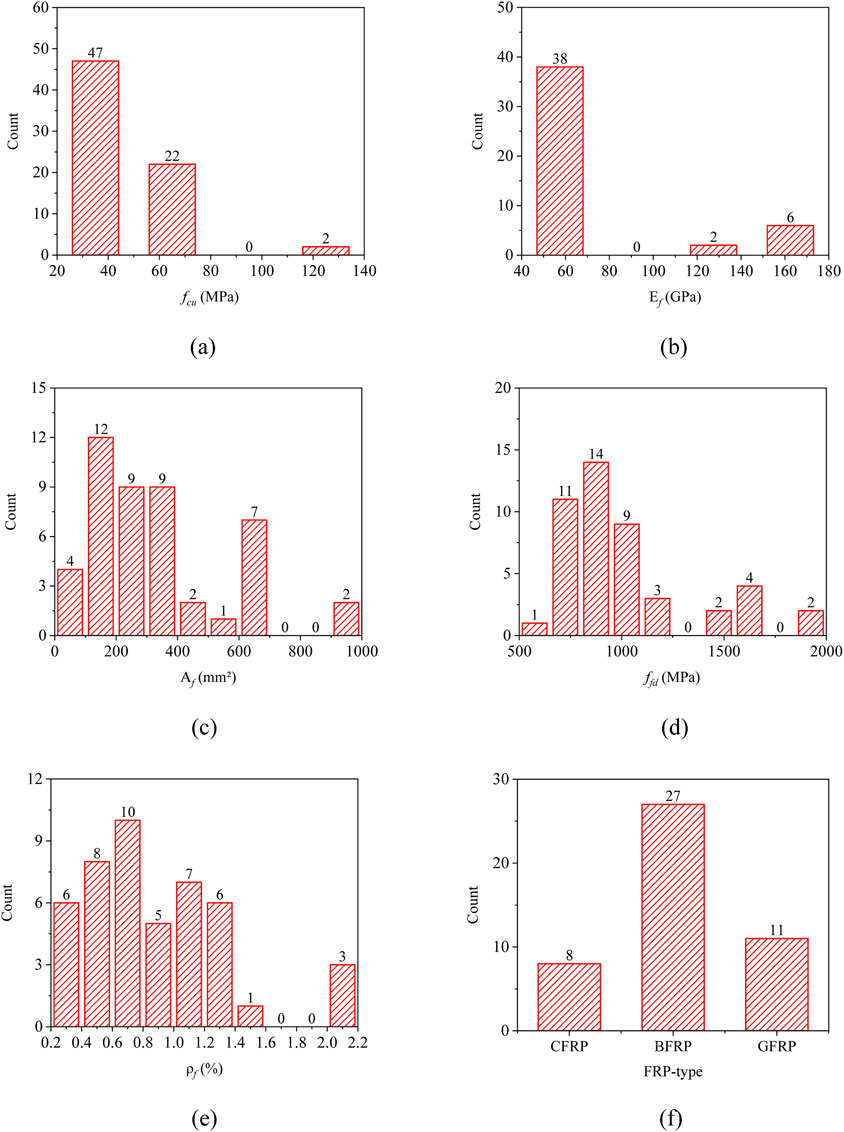
Figure 5. Distribution of database parameters. (a) Concrete compressive strength fcu (MPa). (b) FRP elastic modulus Ef (GPa). (c) FRP tensile zone area Af (mm2). (d) FRP tensile strength ffd (MPa). (e) Longitudinal reinforcement ratio ρf (%). (f) FRP-type.
The comparison between the experimental and predicted results is shown in Figure 6, the mean value of
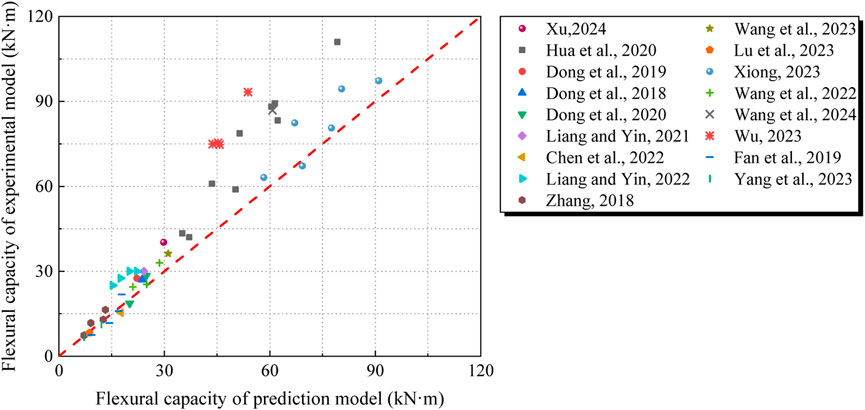
Figure 6. Comparison between the experimental and the predicted results.
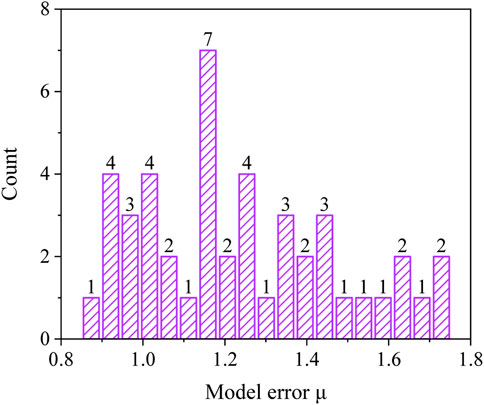
Figure 7. Distribution of model error.
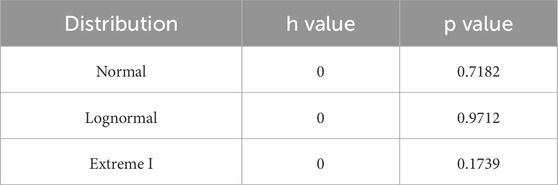
Table 2. Results of Kolmogorov- Smirnov test.
3 Statistical parameters of random variables
In the design of concrete structures, two aspects of uncertainty need to be considered, namely, the uncertainty of effects and the uncertainty of resistance. Effects include internal forces (such as bending moments, shear forces, etc.) and deformation, mainly generated by load effects, and their uncertainty is also due to the uncertainty of loads. The uncertainty of resistance includes uncertainties in material properties, structural dimensions, and calculation models.
3.1 Load factors
According to the GB 50068-2018 (2018), two combinations can be used for analyzing structural reliability, which are SG + SQ,O and SG + SQ,H. SG represents the dead load and SQ denotes the live load, the subscription “O” and “H” denotes office and house environments respectively. Table 3 lists the statistical parameters for the combination of dead load and live load.
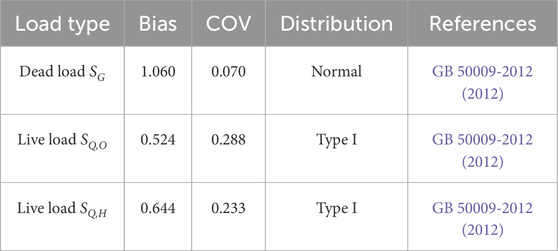
Table 3. Load statistical parameters.
3.2 Resistance factors
3.2.1 Material properties
Uncertainty in material properties mainly refers to the differences in material performance caused by factors such as process, loading, and environment. The reliability analysis in this paper involves material properties including the compressive strength of SWSSC, the elastic modulus of FRP bars, and the tensile strength of FRP bars.
In the work of Guo et al. (2020), 90 tests of SWSSC compressive performance were carried out, and the sea sands were from three regions in China (see Figure 8). The strength values ranged from 32.06 to 55.53 MPa. The statistical data were subjected to the K-S test protocol, indicating a good fit to a normal distribution, with none of the data rejecting the normal distribution hypothesis. The variability in the material properties of SWSSC can be represented by Equation 9,
where fs represents the measured material property value of the specimen, while fcu,k denotes the standard material property value of the specimen, and it is obtained by using Equation 10,
where
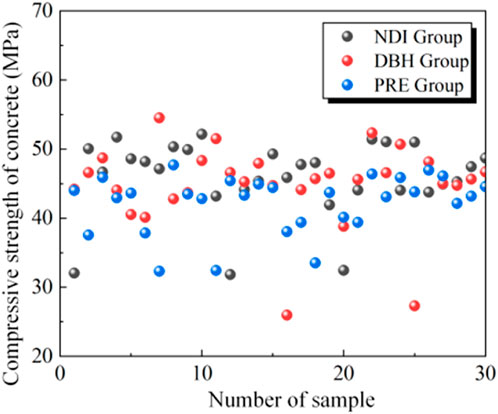
Figure 8. Strength of SSSWC samples from different region.
The mean value of Ωf, which is the bias, and the COV of fs can be obtained, as shown in Table 4.

Table 4. Statistical parameters of SWSSC.
The uncertainties of FRP bars were considered, including the uncertainties in the tensile strength and elastic modulus, and the statistical information of the two parameters can be found in Table 5.
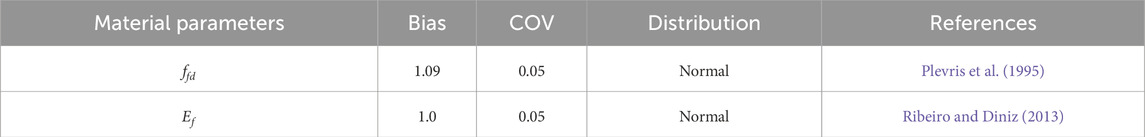
Table 5. Statistical parameters of FRP bars.
3.2.2 Geometric parameters
The uncertainties in geometric parameters refer to the deviations in the geometric dimensions of the component cross-section caused by manufacturing and installation, among other reasons. The uncertainties of section width b, effective section height h0, and FRP bar area Af were considered, and the statistical information of these parameters can be found in Table 6.
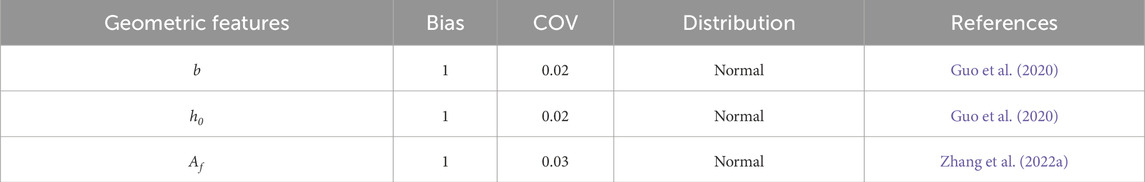
Table 6. Statistical parameters of geometric parameters.
4 Reliability analysis
In analyzing structural reliability, the primary load effects are the dead load effect SG and live load effect SQ, which are typically calculated first. These can be expressed as Equation 11,
Due to the significant uncertainty associated with load effects, various design guidelines specify corresponding partial factors for dead load γG and live load γQ to ensure structural reliability, as shown in Table 7. The load effect can then be expressed as Equation 12,
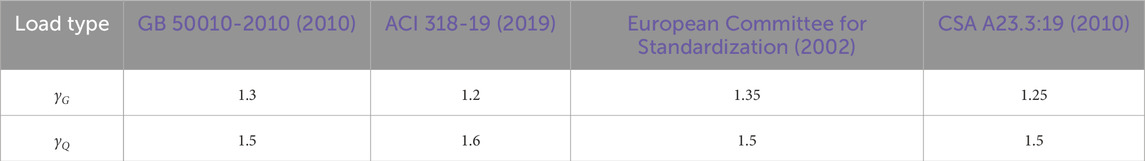
Table 7. Partial factors.
Structural component parameters can be designed based on GB 50608-2020 (2020), where the resistance, or bending capacity Mu of SWSSC beams, can be calculated using Equations 4, 6. The limit state function of SWSSC beam can be written as Equation 13,
The calculation model of structural resistance can be regarded as relatively accurate. From an economic perspective, the ideal scenario is for the load effects to be perfectly aligned with the resistance, and thus the actual load effects can be expressed as Equation 14,
In the above equation, random variables are not taken into account. When considering the load partial factors, the actual resistance can be expressed as Equation 15,
where Mu,G represents the portion of Mu that resists the dead load effects, while Mu,Q denotes the portion that resists the live load effects. Assuming the ratio of dead load to live load was k, the Equations 16, 17 can be drawn,
Thus, Equation 18 can be rephrased as follows,
Furthermore, due to the discrepancies between the computational model and actual results, these errors need to be accounted for in the function, leading to the structural resistance equation being expressed as Equation 19,
According to reliability theory, the limit state function can be rewritten as Equation 20,
When Z = 0, the system is in equilibrium. A positive Z (i.e., Z > 0) indicates a safe state, whereas a negative Z (i.e., Z < 0) denotes an unsafe state. While the resistance carries inherent uncertainty, the load effects are treated as deterministic. Given that the resistance model is affected by multiple factors, the limit state function also displays uncertainty. The failure probability related to the limit state equation can be formulated as Equation 21,
The failure probability can be determined using the Monte Carlo simulation (MCS) method, and the failure probability pf can be estimated using Equation 22,
where n denotes the number of failure samples, and N denotes the total number of samples, and in this study, 100,000 samples were used.
To quantify the failure probability pf, the reliability index β was introduced, which had a direct mathematical relationship with the failure probability pf, and it can be written as Equation 23,
where Φ−1 is the inverse function of the cumulative distribution function of the standard normal distribution.
Additionally, based on the error distribution discussed in Section 2.2 and illustrated in Figure 7, it was observed that the model error μ does not follow a clear distribution pattern. Therefore, the L-moment statistical analysis method was employed for simulation. L-moments, a variant of traditional moments, serve as a statistical tool for measuring the characteristics of probability distributions (Zhang F. et al., 2022).
The simulation was conducted using a section width b of 150 mm, an effective height h0 of 300 mm, concrete cubic compressive strength fcu of 30 MPa, FRP tensile strength Ef of 1,200 MPa, FRP elastic modulus Ef of 80 GPa, FRP area Af of 150 mm2, partial factor γf of 1.0, and a k of 0.1. In this case, the partial factor was 1.0. A significant number of beam response samples were generated based on the known probability distributions of these random variables. Figure 9a presents the histogram of the resistance samples, and Figure 9b shows the histogram of the generated samples of the load effects, it can be seen that the distribution range of resistance is broader than that of the load effects, with most values exceeding the load effects. By subtracting the load effects S from the resistance R, the frequency of failure indexes that are less than or equal to zero was analyzed, leading to a calculated failure probability of 0.1948 for the structure.
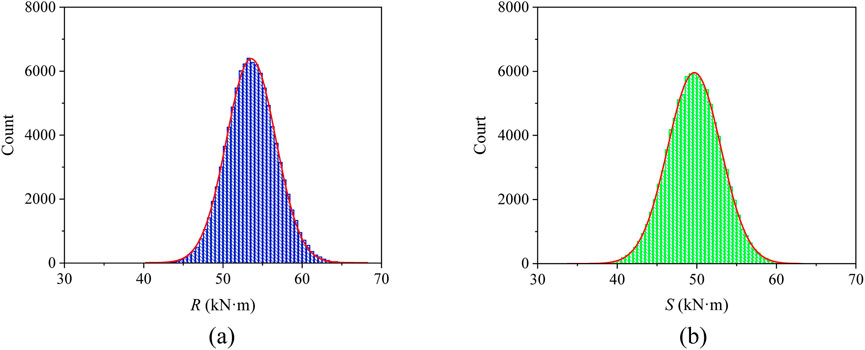
Figure 9. Resistance and load value distribution. (a) Resistance value distribution. (b) Load effect value distribution.
5 Sensitivity analysis
Given that various variables in the computational space impact the reliability indexes of FRP-SWSSC beams to differing extents, a sensitivity analysis of these indexes is essential. This section will analyze the impact of the following factors on the reliability indexes section width b, effective section height h0, concrete compressive strength fcu, FRP bar tensile strength ffd, FRP bar elastic modulus Ef, FRP bar reinforcement ratio Af, national code load partial factors, FRP bar type, live load environment, SWSSC material partial factor
5.1 Sensitivity analysis of beam parameters
The parameters in the calculation model of flexural capacity of beam include b, h0, fcu, ffd, Ef, and Af. The sensitivity analysis parameter values are shown in Table 8. For the analysis, each parameter’s range was set to 50% of its initial value, while others were derived from the parameter information space. For example, for parameter b, the initial value is 100 mm, with a variation of 50 mm, resulting in a range from 100 mm to 250 mm. The values for h0, fcu, ffd, Ef, and Af are respectively 350 mm, 52.5 MPa, 1400 MPa, 70 GPa, and 175 mm2.
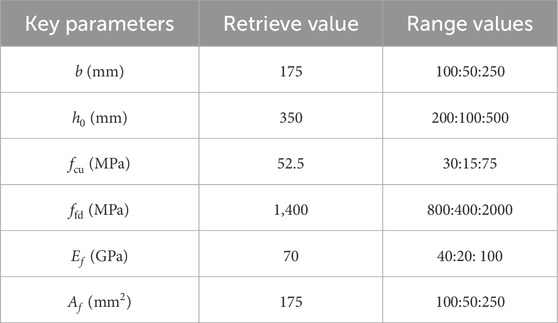
Table 8. Range of values for sensitivity analysis of beam parameters.
As shown in Figure 10, data analysis indicates that as γf increases, the reliability indexes also rise, and this is obvious because an increase in the material partial factor also means an increase in the material surplus, which further leads to an increase in the reliability index. Additionally, the effects of section width b, effective section height h0, FRP bar tensile strength ffd, FRP bar elastic modulus Ef, FRP bar reinforcement ratio Af, on the reliability index β are relatively minor. The compressive strength of concrete fcu has a significant impact on the reliability index, and the reliability index increases with the increase of concrete compressive strength. This is because the sensitivity of flexural bearing capacity to concrete compressive strength is relatively greater than other parameters.
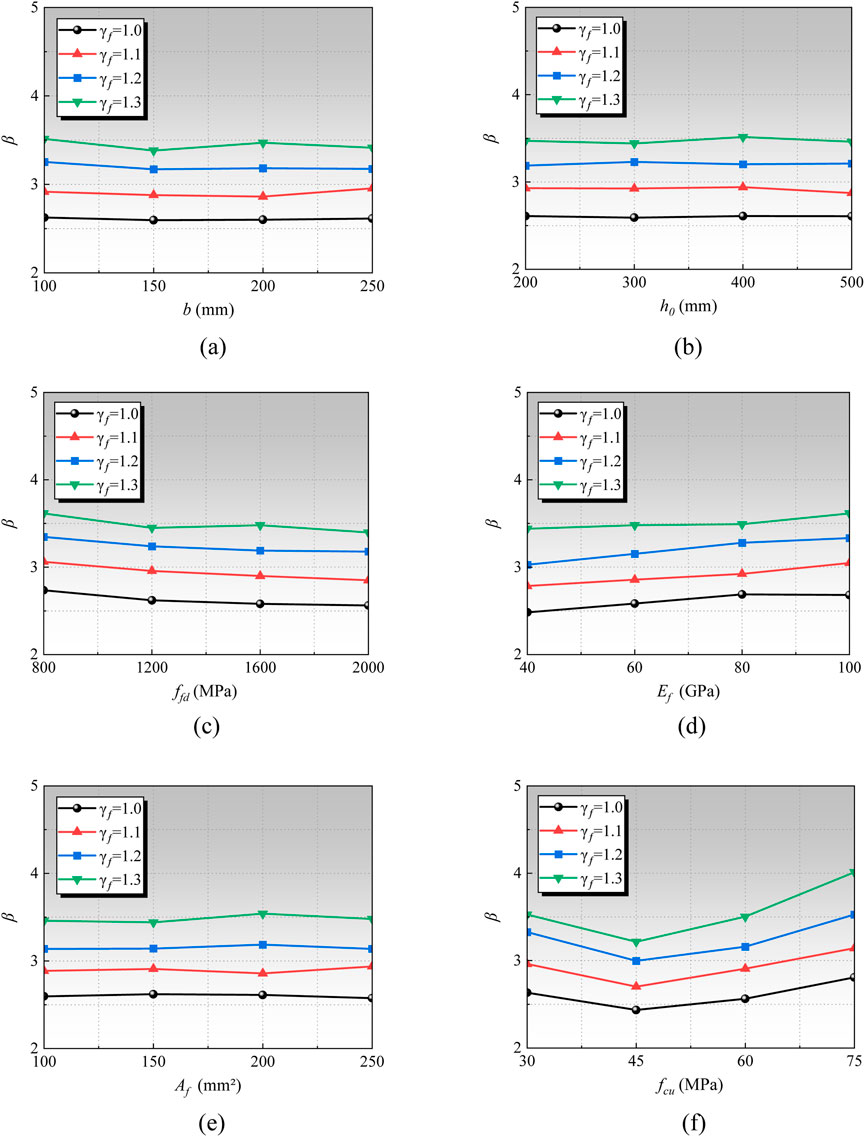
Figure 10. Reliability index with various parameter. (a) Section width b. (b) Effective height h0. (c) FRP tensile strength ffd. (d) FRP elastic modulus Ef. (e) FRP area Af. (f) Concrete compressive strength fcu.
5.2 Other factors
5.2.1 Load partial factor
To compare the influence of different load partial factors on the reliability index, parameters were set as shown in Table 9, and k values 1. The load partial factors were taken at intervals of 0.1 from 1.0 to 1.4, and the results are shown in Figure 11 it can be observed that as the load partial factor increases, the reliability index also rises, and the rate of increase is similar, indicating that the load partial factor has a significant impact on the reliability index.
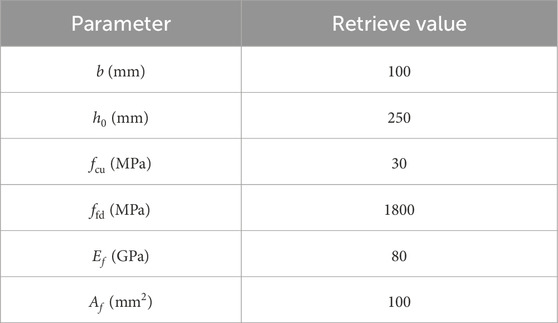
Table 9. Parameters for sensitivity analysis of other factors.
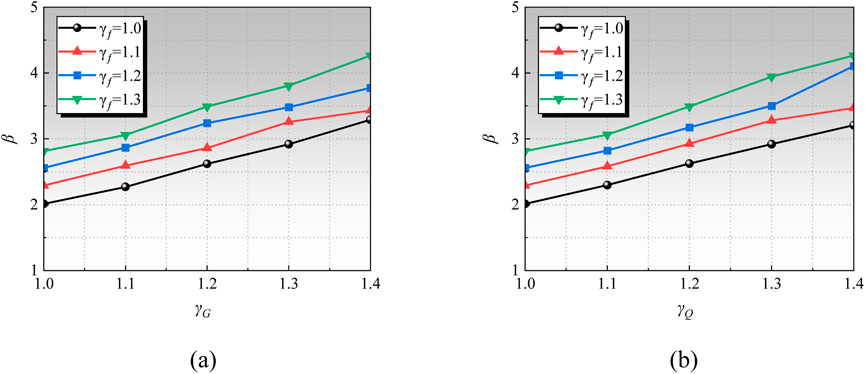
Figure 11. Influence of different load partial factors on reliability index. (a) Different live load partial factors. (b) Different dead load partial factors.
As illustrated in Figure 12, the Eurocode load partial factors benefit from a higher dead load partial factor, resulting in the highest overall reliability indexes. This indicates that, within the load partial factor values, this code provides the safest structural design, followed by the GB code and then the CSA code. Notably, as the live load proportion increases, the ACI code gradually surpasses the others in reliability indexes due to its higher live load partial factors, suggesting that under significant live-to-dead load effects, the structural design according to the ACI code is safer.
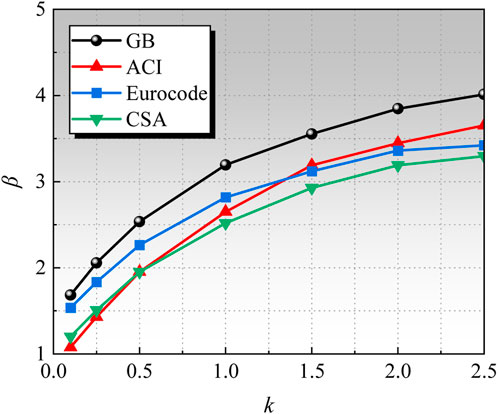
Figure 12. Influence of different k values on reliability index with different guideline.
In addition, an increase in the ratio of dead load to live load significantly increases the reliability index. This is because the coefficient of variation of the dead load (0.070) is much smaller than that of the live load (0.288 or 0.233). As the proportion of the dead load increases, the dispersion of the load action becomes smaller, further leading to a larger reliability index.
5.2.2 FRP type
The relationship between the reliability indexes β of different types of FRP and the k value was analyzed, and the results can be found in Figure 13. Generally, the reliability indexes β for GFRP beam under various load effect ratios are lower than those for CFRP and BFRP beams. This phenomenon is attributed to differences in environmental impact coefficients between GFRP and CFRP/BFRP.
Figure 13. Influence of k value and FRP type on reliability index.
5.2.3 Live load environment
The relationship between the reliability index β under different environments and k value was analyzed, and the results are shown in Figure 14. It can be observed that the reliability index β increases with the increase of the material partial factor, and the rate of increase gradually diminishes. Comparing residential loads with office loads, it is found that the reliability index for office loads is slightly higher at the same value of k. This is mainly due to the larger deviation coefficient of residential loads compared to office loads, while the variation coefficients of both are fairly similar. Consequently, the uncertainty of residential loads is higher, leading to an increased probability of failure and a lower reliability index. In contrast, the office load has a smaller deviation coefficient, and the load values are relatively stable and predictable, resulting in a lower probability of failure and a higher reliability index.
Figure 14. Influence of k value and environment type on reliability index.
6 Discussion of partial factor
6.1 Calculation space
Comprehensive structural reliability analysis requires designing a multi-dimensional calculation space. Therefore, this study considers the following parameters, concrete cube compressive strength fcu, FRP bar tensile strength ffd, FRP bar area Af, FRP bar elastic modulus Ef, section width b, effective section height h0, live load to dead load effect ratio k, and SWSSC material partial factor γf. Detailed information on the variation parameters for the FRP-SWSSC beam is provided in Table 10. There are six parameters in total, resulting in 29,568 design conditions based on the assigned values for each parameter. Additionally, the ratio k of live load to dead load significantly impacts the reliability of the beam, with k values set at 0.1, 0.25, 0.5, 1.0, 1.5, 2.0, and 2.5. To determine the SWSSC material partial factor γf, γf is varied from 1.0 to 1.8 with a step size of 0.05, resulting in 17 values. Consequently, 29,568 × 7 × 17 = 3,518,592 reliability calculations must be considered.
Table 10. Calculation space.
6.2 Calibration
In the process of calibrating the material partial factor γf for SWSSC, the target reliability index βT must first be defined. The target reliability index is used to reflect the acceptable probability of structural failure for people. Taking a large number of ordinary buildings as an example, the standard (GB 50068-2018, 2018) stipulates that the target reliability index for ductile failure components is 3.2 (failure probability of 6.9 × 10⁻⁴), and the target reliability index for brittle failure components is 3.7 (failure probability of 1.1 × 10⁻⁴). Based on previous study (Zhang W. et al., 2022), the failure mode of FRP concrete beams under bending is brittle failure. Therefore, the target reliability index of 3.7 was determined.
In such cases, the material partial factor can be calibrated using the reliability calculation results from the design space to obtain the optimal γf value. To assess the closeness of the partial factor γf to the target reliability index βT, the least squares method is employed. The formula is as follows,
where H is the deviation value, n represents the number of design instances; βi is the reliability index for the ith instance; βT is the target reliability index. By using this method, the partial factor of SWSSC can be calibrated, that is, the smaller the H value, the more reasonable the partial factor.
Figures 15, 16 shown the deviation value of SWSSC partial factor with different type of FRP. It can be noted that when k = 0.5, 1.0, 1.5, 2.0 and 2.5 respectively, the value of H increases with k, while the deviation H does not show a significant characteristic with the increase of the partial factor γf, resulting in a relatively flat curve. When k = 0.1 and 0.25, the deviation H initially decreases and then increases with the increase of γf. For the condition k = 0.1, the minimum H value occurs when γf is 1.4, suggesting that the lowest deviation occurs when γf is set around 1.4. As γf increases beyond this point, the deviation also increases. Therefore, it is recommended that the load partial factor γf be set to 1.4. On this basis, for k = 0.25, the optimal value for γf is determined to be 1.2. The aforementioned method was applied to analyze other conditions, and the optimal material partial factors can be found in Table 11.
Figure 15. Deviation of CFRP/BFRP SWSSC partial factors. (a) GB-House. (b) GB-Office. (c) ACI-House. (d) ACI-Office. (e) CSA-House. (f) CSA-Office. (g) Eurocode -House. (h) Eurocode -Office.
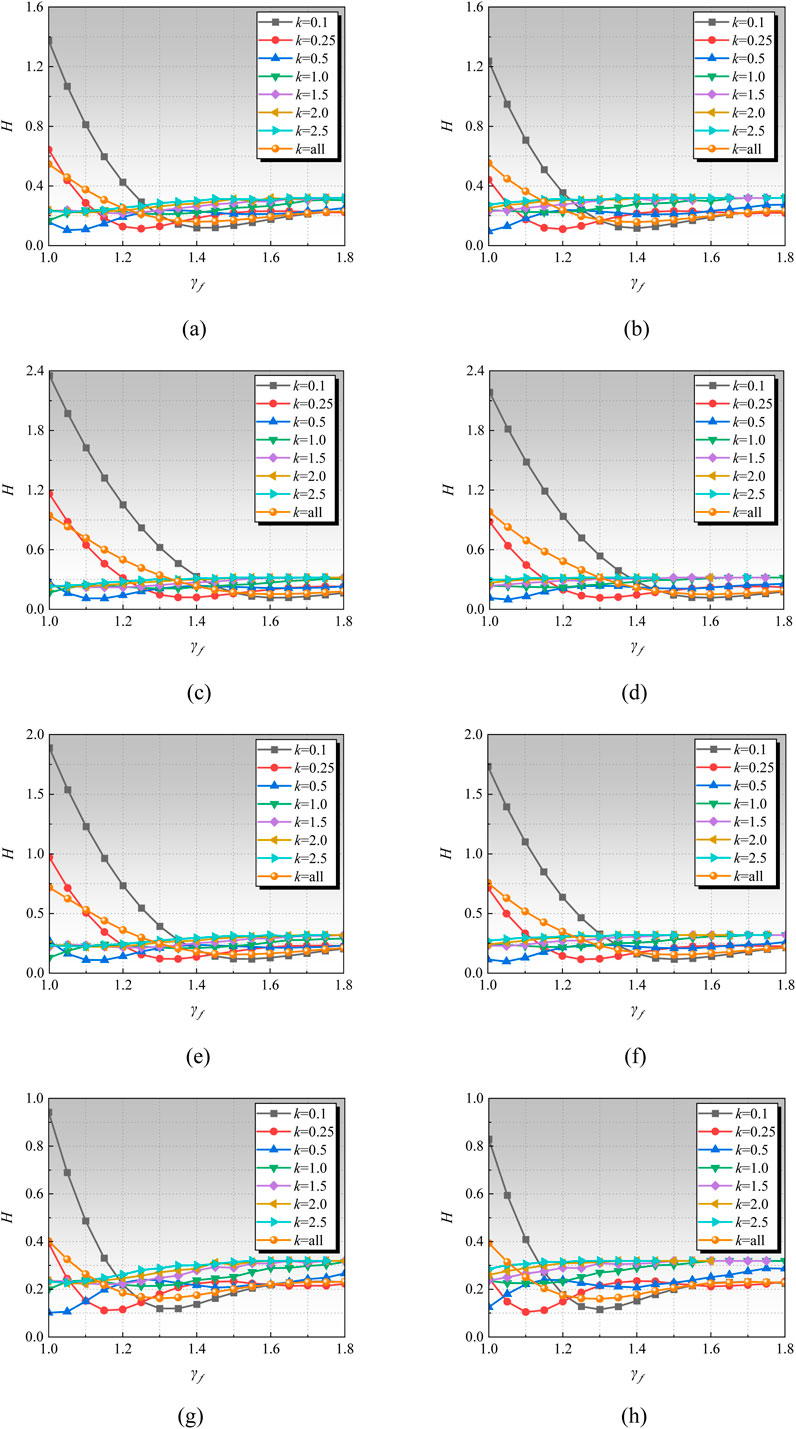
Figure 16. Deviation of GFRP SWSSC partial factors. (a) GB-House. (b) GB-Office. (c) ACI-House. (d) ACI-Office. (e) CSA-House. (f) CSA-Office. (g) Eurocode -House. (h) Eurocode -Office.
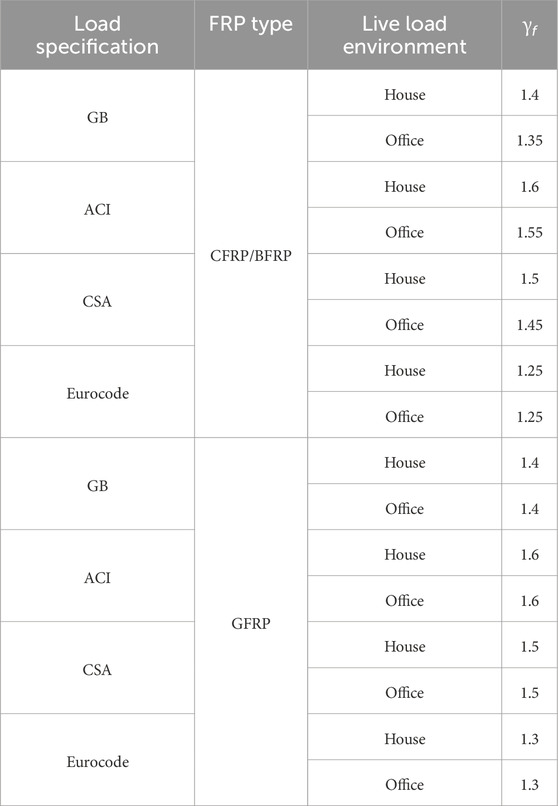
Table 11. Partial factors of SWSSC.
The recommended values for the SWSSC partial factor γf are listed under different load partial factor standards and varying live load environments. It can be observed that the recommended values are relatively close under different live load environments. In contrast, the influence of different load partial factor standards on the recommended values is significant. To facilitate the application of these analysis results in practical engineering, a comprehensive recommended value for the SWSSC partial factor γf under various load partial factor standards is provided in Table 12.
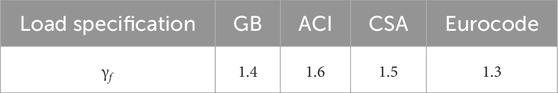
Table 12. Comprehensive recommendations for SWSSC partial factor.
6.3 Partial factor with various target reliability index
The above analysis focuses on the situation where the target reliability index is 3.7. The target reliability index is artificially determined based on acceptable conditions and may vary in different periods and regions. Therefore, based on the above model, the material partial factor for different target reliability indexes (taking GB as an example) were calibrated. The target reliability indicators include 2.5, 2.7, 3.0, 3.2, 3.5, and 3.9. The recommended material partial factors for SWSSC after calibration are shown in Table 13.
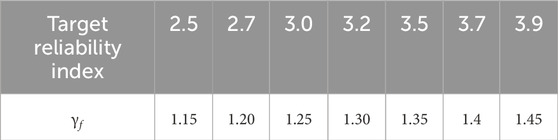
Table 13. Recommendations for SWSSC partial factor with various target reliability indexes.
7 Conclusion
To calculate the partial factors for SWSSC materials, this study examines the dependability of FRP-reinforced SWSSC beams utilizing experimental data from 49 groups worldwide. Using a thorough testing database, the uncertainty of the guideline (GB 50608-2020, 2020) model is evaluated. L-moments and Monte Carlo Simulation (MCS) are used in tandem to produce reliability indices. To assess how design variables affect average reliability indexes, a parameter analysis is carried out. Lastly, calibrated partial factors for SWSSC materials are suggested for two models using least squares averaging analysis in the design space. The following conclusions can be made in light of the results of this study and in-depth parameter studies:
1. According to the analysis, the prediction model’s mean value is 1.117, and its coefficient of variation is 0.210. Furthermore, an examination of the SWSSC samples reveals that the normalized compressive strength SWSSC mean compressive strength is 1.2531 with a 0.1228 coefficient of variation.
2. Sensitivity analysis of the FRP-SWSSC beams indicates that factors such as the section width b, effective section height ℎ0, tensile strength of FRP bars ffd, elastic modulus of FRP bars Ef, FRP reinforcement ratio Af, and type of FRP have minimal impact on reliability.
3. During the sensitivity analysis, it was observed that when fcu < 50 MPa, the reliability index decreases as fcu increases. Conversely, when fcu > 50 MPa, the reliability index increases with fcu. A higher constant live load ratio k leads to greater reliability. Furthermore, under various load specifications, larger load partial factor corresponds to increased reliability. Additionally, under the same conditions in an office live load environment, reliability indexes are higher. Lastly, an increase in the partial factor for SWSSC materials results in higher reliability indexes, demonstrating a linear relationship.
4. The following partial factors for SWSSC materials are suggested by an investigation of reliability indexes for FRP-SWSSC beams under different conditions: 1.4 for GB standards, 1.6 for ACI standards, 1.5 for CSA standards, and 1.3 for Eurocode standards.
This paper only discusses the reliability FRP SWSSC and and material partial factors of SWSSC under flexural effect, and the current model assumed a static condition. In addition, the structure is also subject to shear, torsion, serviceability (e.g., deflection, cracking), and long-term durability effect. The impact of these factors needs to be comprehensively considered in the design to determine reasonable material partial factors. Therefore, in future research, attention can be paid to this aspect to determine more comprehensive material partial factors. For static performance, the reliability model presented in this paper can be used for calculation. For long-term behavior, the degradation of concrete strength caused by factors such as carbonation can be considered. Due to the good durability of FRP reinforcement, its strength degradation does not need to be considered. However, if the structure is under fatigue load, the fatigue damage of FRP and concrete needs to be considered. It should be noted that the calibrated materials partial factor values were not validated against independent datasets or real-world case studies, and testing and verification can be conducted in practice in the future.
Data availability statement
The original contributions presented in the study are included in the article/Supplementary Material, further inquiries can be directed to the corresponding author.
Author contributions
SY: Writing – original draft. ZT: Conceptualization, Funding acquisition, Investigation, Writing – original draft. XL: Conceptualization, Investigation, Writing – original draft. HC: Data curation, Formal Analysis, Methodology, Validation, Writing – original draft.
Funding
The author(s) declare that financial support was received for the research and/or publication of this article. This work was supported by 2022 Open Fund Project of National Engineering Laboratory for Applied Technology of Forestry & Ecology in South China (2022NFLY01), Ningbo Polytechnic Faculty Recruitment Special Project (NZ24RC003) and the Natural Science Foundation of Fujian Province (2022J05184).
Conflict of interest
The authors declare that the research was conducted in the absence of any commercial or financial relationships that could be construed as a potential conflict of interest.
Generative AI statement
The author(s) declare that no Generative AI was used in the creation of this manuscript.
Any alternative text (alt text) provided alongside figures in this article has been generated by Frontiers with the support of artificial intelligence and reasonable efforts have been made to ensure accuracy, including review by the authors wherever possible. If you identify any issues, please contact us.
Publisher’s note
All claims expressed in this article are solely those of the authors and do not necessarily represent those of their affiliated organizations, or those of the publisher, the editors and the reviewers. Any product that may be evaluated in this article, or claim that may be made by its manufacturer, is not guaranteed or endorsed by the publisher.
Supplementary material
The Supplementary Material for this article can be found online at: https://www.frontiersin.org/articles/10.3389/fmats.2025.1677367/full#supplementary-material
References
ACI 318-19 (2019). Building code requirements for structural concrete. Farmington Hills, Michigan, USA: American Concrete Institute.
Dhondy, T., Remennikov, A., Asce, M., and Sheikh, M. N. (2024). Properties and application of sea sand in sea sand–seawater concrete. J. Mater. Civ. Eng. doi:10.1061/(ASCE)MT.1943-5533.00034
European Committee for Standardization (2002). EN 1990:2002 – Eurocode – basis of structural design. Brussels, Belgium: European Committee for Standardization (CEN).
Fahmy, M. F. M., Ahmed, S. A. S., and Wu, Z. (2021). Bar surface treatment effect on the bond-slip behavior and mechanism of basalt FRP bars embedded in concrete. Constr. Build. Mater. 289, 122844. doi:10.1016/j.conbuildmat.2021.122844
Fan, T.-H., Zeng, J.-J., Su, T.-H., Hu, X., Yan, X.-K., and Sun, H.-Q. (2025a). Innovative FRP reinforced UHPC floating wind turbine foundation: a comparative study. Ocean. Eng. 326, 120799. doi:10.1016/j.oceaneng.2025.120799
Fan, T.-H., Zeng, J.-J., Hu, X., Chen, J.-D., Wu, P.-P., Liu, H.-T., et al. (2025b). Flexural fatigue behavior of FRP-reinforced UHPC tubular beams. Eng. Struct. 330, 119848. doi:10.1016/j.engstruct.2025.119848
GB 50009-2012 (2012). Load code for the design of building structures. Beijing, China: Ministry of Housing and Urban-Rural Development of CHN.
GB 50010-2010 (2010). Code for design of concrete structures, Ministry of Housing and Urban-Rural Development of CHN, Beijing, China.
GB 50068-2018 (2018). Unified standard for reliability design of building structures. Beijing, China: Ministry of Housing and Urban-Rural Development of CHN.
GB 50608-2020 (2020). Technical standard for fiber reinforced polymer (FRP) in construction. Beijing, China: Ministry of Housing and Urban-Rural Development of CHN.
GB/T14684-2011 (2011). Sand for construction, Ministry of Housing and Urban-Rural Development of CHN.
Guo, M., Hu, B., Xing, F., Zhou, X., Sun, M., Sui, L., et al. (2020). Characterization of the mechanical properties of eco-friendly concrete made with untreated sea sand and seawater based on statistical analysis. Constr. Build. Mater. 234, 117339. doi:10.1016/j.conbuildmat.2019.117339
Han, S., Zhou, A., Fan, C., Xiao, G., and Ou, J. (2023). Axial-flexural performance of columns reinforced by steel-FRP composite bars and FRP ties. Compos. Struct. 322, 117435. doi:10.1016/j.compstruct.2023.117435
Hussein, A., Huang, H., Okuno, Y., and Wu, Z. (2022). Experimental and numerical parametric study on flexural behavior of concrete beams reinforced with hybrid combinations of steel and BFRP bars. Compos. Struct. 302, 116230. doi:10.1016/j.compstruct.2022.116230
Jafari, A., Shahmansouri, A. A., and Akbarzadeh Bengar, H. (2025). Hybrid CFRP-GFRP sheets for flexural strengthening of continuous RC beams: experimentation and analytical modeling. Struct. Concr. 26, 972–993. doi:10.1002/suco.202400264
Liao, J., Zeng, J.-J., Bai, Y.-L., and Zhang, L. (2022). Bond strength of GFRP bars to high strength and ultra-high strength fiber reinforced seawater sea-sand concrete (SSC). Compos. Struct. 281, 115013. doi:10.1016/j.compstruct.2021.115013
Lu, Z., Zhao, C., Zhao, J., Shi, C., and Xie, J. (2023a). Bond durability of FRP bars and seawater–sea sand–geopolymer concrete: Coupled effects of seawater immersion and sustained load. Constr. Build. Mater. 400, 132667. doi:10.1016/j.conbuildmat.2023.132667
Lu, Z., Li, W., Zeng, X., and Pan, Y. (2023b). Durability of BFRP bars and BFRP reinforced seawater sea-sand concrete beams immersed in water and simulated seawater. Constr. Build. Mater. 363, 129845. doi:10.1016/j.conbuildmat.2022.129845
Mai, G., Li, L., Lin, J., Wei, W., He, S., Zhong, R., et al. (2023). Bond durability between BFRP bars and recycled aggregate seawater sea-sand concrete in freezing-thawing environment. J. Build. Eng. 70, 106422. doi:10.1016/j.jobe.2023.106422
Miller, S. A., Horvath, A., and Monteiro, P. J. M. (2018). Impacts of booming concrete production on water resources worldwide. Nat. Sustain 1, 69–76. doi:10.1038/s41893-017-0009-5
Pan, D., Yaseen, S. A., Chen, K., Niu, D., Ying Leung, C. K., and Li, Z. (2021). Study of the influence of seawater and sea sand on the mechanical and microstructural properties of concrete. J. Build. Eng. 42, 103006. doi:10.1016/j.jobe.2021.103006
Panchanathan, A., and Paramasivam, A. (2022). Feasibility study on use of sea sand as partial replacemnt of fine aggregate in concrete. Mater. Today Proc. 65, 468–471. doi:10.1016/j.matpr.2022.03.016
Plevris, N., Triantafillou, T. C., and Veneziano, D. (1995). Reliability of RC members Strengthened with CFRP Laminates. J. Struct. Eng. 121, 1037–1044. doi:10.1061/(ASCE)0733-9445(1995)121:7(1037)
Ribeiro, S. E. C., and Diniz, S. M. C. (2013). Reliability-based design recommendations for FRP-reinforced concrete beams. Eng. Struct. 52, 273–283. doi:10.1016/j.engstruct.2013.02.026
Sun, H.-Q., Zeng, J.-J., Hong, G.-Y., Zhuge, Y., Liu, Y., and Zhang, Y. (2025). 3D-printed functionally graded concrete plates: Concept and bending behavior. Eng. Struct. 327, 119551. doi:10.1016/j.engstruct.2024.119551
Wang, X., Zhang, X., Ding, L., Tang, J., and Wu, Z. (2020). Punching shear behavior of two-way coral-reef-sand concrete slab reinforced with BFRP composites. Constr. Build. Mater. 231, 117113. doi:10.1016/j.conbuildmat.2019.117113
Wang, J., Xiao, F., and Yang, J. (2023). Experimental study on bond behavior between epoxy-coated reinforcement (ECR) and seawater sea-sand concrete (SSC) under FRP-steel confinement. Constr. Build. Mater. 385, 131426. doi:10.1016/j.conbuildmat.2023.131426
Wu, G., Lü, Z. T., and Wu, Z. S. (2006). Strength and ductility of concrete cylinders confined with FRP composites. Constr. Build. Mater. 20, 134–148. doi:10.1016/j.conbuildmat.2005.01.022
Younis, A., Ebead, U., Suraneni, P., and Nanni, A. (2020). Short-term flexural performance of seawater-mixed recycled-aggregate GFRP-reinforced concrete beams. Compos. Struct. 236, 111860. doi:10.1016/j.compstruct.2020.111860
Zeng, J.-J., Liao, J., Zhuge, Y., Guo, Y.-C., Zhou, J.-K., Huang, Z.-H., et al. (2022). Bond behavior between GFRP bars and seawater sea-sand fiber-reinforced ultra-high strength concrete. Eng. Struct. 254, 113787. doi:10.1016/j.engstruct.2021.113787
Zeng, J.-J., Sun, H.-Q., Deng, R.-B., Yan, Z.-T., and Zhuge, Y. (2025). Bond performance between FRP bars and 3D-printed high-performance concrete. Structures 73, 108377. doi:10.1016/j.istruc.2025.108377
Zhang, W., Liu, X., Huang, Y., and Tong, M.-N. (2022a). Reliability-based analysis of the flexural strength of concrete beams reinforced with hybrid BFRP and steel rebars. Arch. Civ. Mech. Eng. 22, 171. doi:10.1007/s43452-022-00493-7
Zhang, F., Feng, F., and Liu, X. (2022b). Reliability analysis of concrete beam with high-strength steel reinforcement. Materials 15, 8999. doi:10.3390/ma15248999
Keywords: sea water sea sand concrete beams, fiber-reinforced polymer (FRP, ), flexural capacity, reliability analysis, partial factor
Citation: Yi S, Tang Z, Liu X and Chen H (2025) Flexural capacity of fiber reinforced polymer sea sand seawater concrete: reliability analysis and calibration of partial factor. Front. Mater. 12:1677367. doi: 10.3389/fmats.2025.1677367
Received: 31 July 2025; Accepted: 01 September 2025;
Published: 01 October 2025.
Edited by:
Antonios Kanellopoulos, University of Hertfordshire, United KingdomReviewed by:
Amir Ali Shahmansouri, Washington State University, United StatesJun-Jie Zeng, Guangdong University of Technology, China
Copyright © 2025 Yi, Tang, Liu and Chen. This is an open-access article distributed under the terms of the Creative Commons Attribution License (CC BY). The use, distribution or reproduction in other forums is permitted, provided the original author(s) and the copyright owner(s) are credited and that the original publication in this journal is cited, in accordance with accepted academic practice. No use, distribution or reproduction is permitted which does not comply with these terms.
*Correspondence: Xiang Liu, bGl1eGlhbmdAZmp1dC5lZHUuY24=