 Han You
 Limei Zhang
 Xu Lin
 Ping Tang1
- 1School of Computer and Artificial Intelligence, Beijing Technology and Business University, Beijing, China
- 2School of Light Industry, Beijing Technology and Business University, Beijing, China
Introduction: DCO4 steel sheets with a finite thickness are the subject of this study.
Methods: Material mechanical properties were determined through tensile and shear tests, while fracture characteristics along the thickness direction were analyzed. Scanning Electron Microscopy (SEM) observation of fracture surfaces was combined with these tests to clarify the influence of holes on the mechanical behavior of the steel sheet. Subsequently, a finite element simulation of the tensile test on steel plates was performed in ABAQUS, with plate thicknesses ranging from 0.3 mm to 1.4 mm and central hole diameters from 2 mm to 6 mm, corresponding to width-to-diameter ratios of 0.2–0.6.
Results: The influence of hole shape on the stress concentration factor (SCF) was quantified. Relationships between sheet thickness, diameter-to-width ratio, and SCF were established. The results demonstrate that for a given diameter-to-width ratio, an optimal sheet thickness exists where the SCF stabilizes.
Conclusion: These findings provide a theoretical basis and technical support for the engineering design of perforated DCO4 thin steel sheet components.
1 Introduction
Stress concentration arises at geometrical discontinuities (such as holes, notches, and grooves) within continuous media under structural loading (Xu, 2006). Kirsch (1898) first introduced the problem of stress concentration, which has since prompted extensive research by numerous scholars, primarily focusing on: (1) The influence of geometric shape and structural design on stress distribution. Liu B et al. (2021) demonstrated that differences in pore structure between inner and outer layers affect the uniformity of stress concentration distribution. Zhang et al. (2024) further indicated that the positional angle of double holes is a key parameter influencing the stress concentration factor. (2) The effect of environmental factors on stress concentration. Luna V M et al. (2024) discovered that for corrosion damage, the morphology of pitting pits can be analogized to a sinusoidal surface, allowing the estimation of the stress concentration factor based on parameters such as wavelength and thickness. Qi W et al. (2021) revealed that the acidification process in ultra-deep well environments significantly exacerbates the stress corrosion cracking susceptibility of HP-13Cr stainless steel. (3) The impact of different loading conditions on stress distribution. Arcieri et al. (2024), in their study on Ti6Al4 V, confirmed that notched specimens exhibit substantially lower strength under axial fatigue loading compared to intact specimens, and that fatigue loading intensifies stress concentration phenomena. Fazlali et al. (2024) highlighted the differences in specimen responses under static and dynamic fatigue loading, identifying load type as a critical factor affecting stress concentration behavior.
In recent years, research has expanded to various materials. Wang et al. (2022) investigated different-shaped cavities in coal-rock masses, showing that cavity geometry influences both the maximum strength of the material and its crack propagation path. Yin et al. (2024) systematically studied and compared the net-section fracture behavior of circular, elliptical, hexagonal, and diamond-shaped holes in high-strength steel plates such as Q355D, confirming that hole shape is a decisive factor in stress concentration phenomena. Unlike high-strength materials, DC04 cold-rolled thin steel sheet—a typical low-carbon steel—exhibits high ductility achieved through microalloying and strict annealing processes, along with excellent formability and weldability. It is widely used in automotive bodies, electrical cabinets, and other structural applications. However, structural failures caused by stress concentration in perforated DC04 sheets occur frequently, yet studies systematically examining the influence of parameters such as plate thickness and hole shape on stress concentration in this material remain relatively limited. Therefore, investigating stress concentration in perforated DC04 thin sheets holds considerable practical significance.
In terms of research methodology, finite element analysis has become a key tool for studying stress concentration induced by geometric discontinuities. For structures such as pressure vessels, nonlinear finite element analysis (NL-FEA) is often employed. For instance, Pany (2021a); Pany (2021b) used this approach to accurately capture local stress increases resulting from profile deviations and weld depression defects. Similarly, Tadepalli et al. (2017) applied the finite element method to investigate stress concentration phenomena and determine the stress concentration factor (SCF) in both isotropic and orthotropic rectangular and circular plates under transverse static loading.
Early studies typically employed two-dimensional (2D) models, neglecting the relationship between plate thickness and stress concentration. However, deeper subsequent research and practical observations—revealing issues such as crack propagation occurring on free surfaces and internally and inaccuracies stemming from ignored transverse strains—demonstrate that the influence of plate thickness in thin steel sheet cannot be disregarded. Current research on sheet thickness primarily includes: Sternberg and Sadowsky (1949) provided an approximate three-dimensional solution for the stress distribution around a cylindrical hole in an infinite plate of arbitrary thickness. Folias and Wang (1990) solved the boundary value problem for an infinite plate with a circular hole based on Cosserat plate theory, finding that the maximum stress occurs at the mid-plane when the hole radius-to-thickness ratio exceeds 0.5, and near the free surface when the ratio is below 0.5. Kane and Mindlin (1956) proposed the Kane-Mindlin theory accounting for transverse strain; subsequently, Zhang T et al. (2000) derived an explicit theoretical solution for the stress concentration factor (SCF) around a circular hole using this theory combined with the stress function method. Li Z et al. (2000) employed three-dimensional finite element (3D FE) analysis to investigate the 3D stress distribution in finite-thickness plates with various shaped notches under remote uniaxial tension, elucidating the variation of SCF through the thickness. Liu H et al. (2024) analyzed SCF in finite-thickness plates with circular holes under biaxial loading, indicating that for thin plates, SCF gradually decreases towards the plate surfaces.
As a core indicator for strength assessment, the calculation methodology for SCF has been continuously refined. She Chongmin and Guo (2006) investigated the variation of SCF along the wall of elliptical holes in finite-thickness plates with changing thickness. Established an empirical formula relating the ratio of thickness to root radius, thickness, and the stress concentration factor. Ding et al. (2021) utilized numerical simulations to study the stress concentration mechanism in plates with semi-elliptical surface notches, deriving an empirical equation for the SCF of surface notches. Yuan and Liu (2022) proposed a two-dimensional weight function for the stress intensity factor of semi-elliptical surface cracks in plates of finite thickness and width under arbitrary stress. Dveirin et al. (2021) studied stress concentration phenomena near holes in mechanical joints, noting that SCF stabilizes once the aperture-to-thickness ratio reaches a certain value. Literature reveals that plate thickness is a key factor controlling stress concentration. The central objective of this paper is to find the optimal plate thickness for optimizing the stress concentration effect. Previous research (Lin et al., 2025) investigated DC04 steel sheet with circular and oval holes, considering the influence of the diameter-to-width ratio and hole shape factor on fracture. It analyzed aperture evolution and stress variation, deriving an empirical formula for the net section SCF. However, the influence of sheet thickness was not considered, limiting the formula’s applicability. Building upon foundation, the study specifically introduces plate thickness as a key variable, and further investigates the influence of factors such as plate thickness and the aperture-to-plate-width ratio (diameter-width ratio) on fracture and stress concentration in thin steel sheets. By combining experimental tests with scanning electron microscopy (SEM) observations, the fracture characteristics at the mesoscopic level within the fracture zone are examined, with particular attention to variations through the thickness. Through finite element simulation analysis, the variation trend of the stress concentration factor with plate thickness was obtained, and modifying the empirical SCF formula. An empirical formula for determining the optimal plate thickness was derived, providing valuable reference for engineering practice and effectively mitigating potential failure risks induced by stress concentration effects. The research workflow is shown in Figure 1.
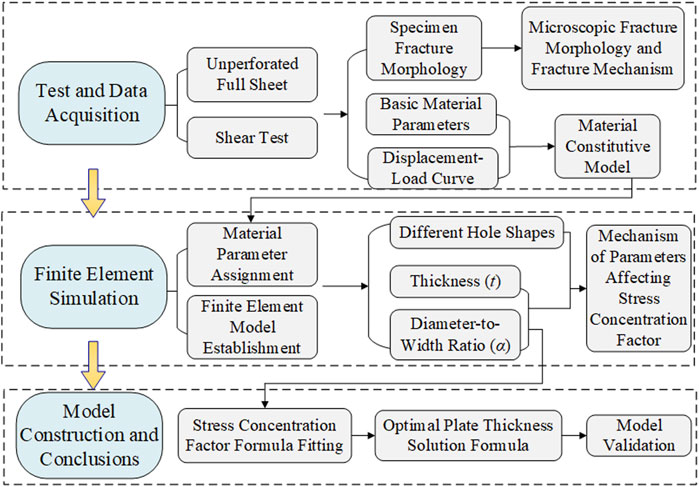
Figure 1. Workflow diagram.
2 Mechanical property testing of thin steel sheets
2.1 Test overview
In accordance with the relevant requirements of GB/T228.1-2021 (Xu and Xu, 2022), specimens for uniaxial tensile and shear tests were designed using 1 mm-thick DC04 thin steel sheets (Figure 2). The tests were divided into six groups based on three specimen types and orientations, with three specimens (S1, S2, and S3) per group, totaling 18 specimens. For Type I shear specimens, the shear tip aligns horizontally with the tensile direction. For Type II shear specimens, the shear tip is perpendicular to the tensile direction. Considering the processing direction, specimens were prepared both along the rolling direction (RD) and perpendicular to the rolling direction (TD). All mechanical tests were conducted at room temperature (23 °C ± 2 °C). The tensile specimens were loaded at a rate of 1 mm/min. Considering the lower strength of the shear specimens, a slower loading rate of 0.5 mm/min was adopted to mitigate insufficient stress relaxation and reduce the risk of unintended fracture caused by excessive loading speed.
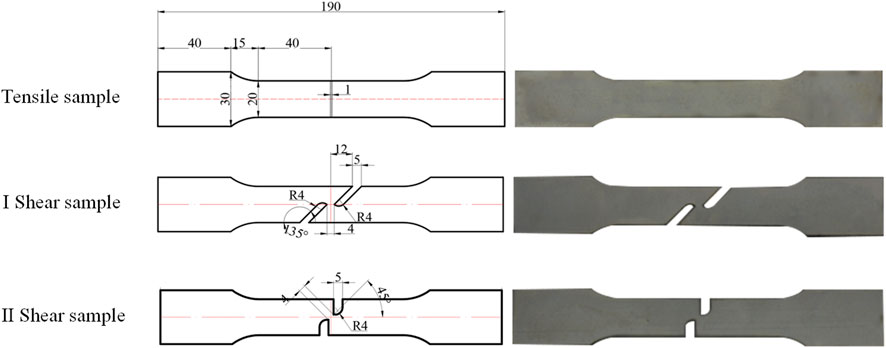
Figure 2. Tensile and shear specimens with design dimensions.
A microscale slippage, imperceptible to the naked eye, may occur between the fixture and the specimen, resulting in recorded displacement values slightly exceeding the actual deformation of the specimen. This leads to marginally lower calculated values for both strain and elastic modulus. Since such potential errors primarily affect the characterization of the material’s constitutive relationship, we adopted the approach of averaging results from multiple test sets to mitigate their impact.
2.2 Analysis of test results
2.2.1 Tensile test
The force-displacement curves for the tensile tests of DC04 steel sheets are shown in Figure 3A, and the relevant mechanical properties are summarized in Table 1.
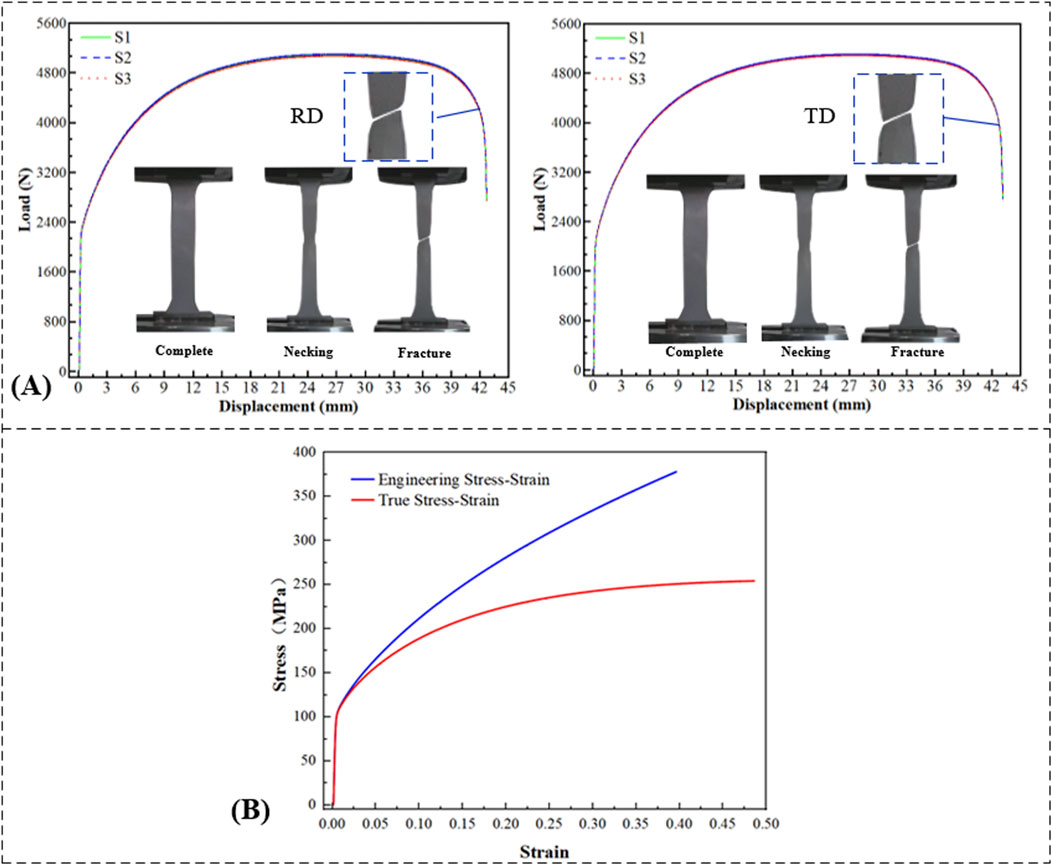
Figure 3. Tensile test. (A) Force-displacement curves of tensile tests. (B) Constitutive curve of tensile specimen.
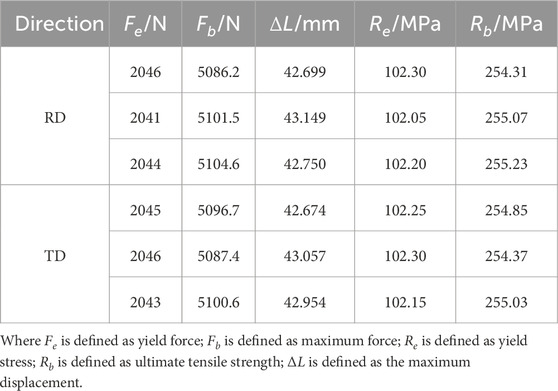
Table 1. Tensile test parameters.
In classical tensile testing, necking occurs when the stress on the specimen reaches the ultimate tensile strength. Consequently, the typical stress-strain curve obtained for ductile materials is only an approximation and cannot represent the actual stress-strain values. Thus, calibration of the engineering stress-strain curve is required to obtain the material’s true constitutive curve (Figure 3B).
2.2.2 Shear test
The fracture morphologies of both types of shear specimens for DC04 steel sheets are shown in Figure 4A. The force-displacement curves are presented in Figure 4B C, and the relevant mechanical properties from the shear tests are summarized in Table 2.
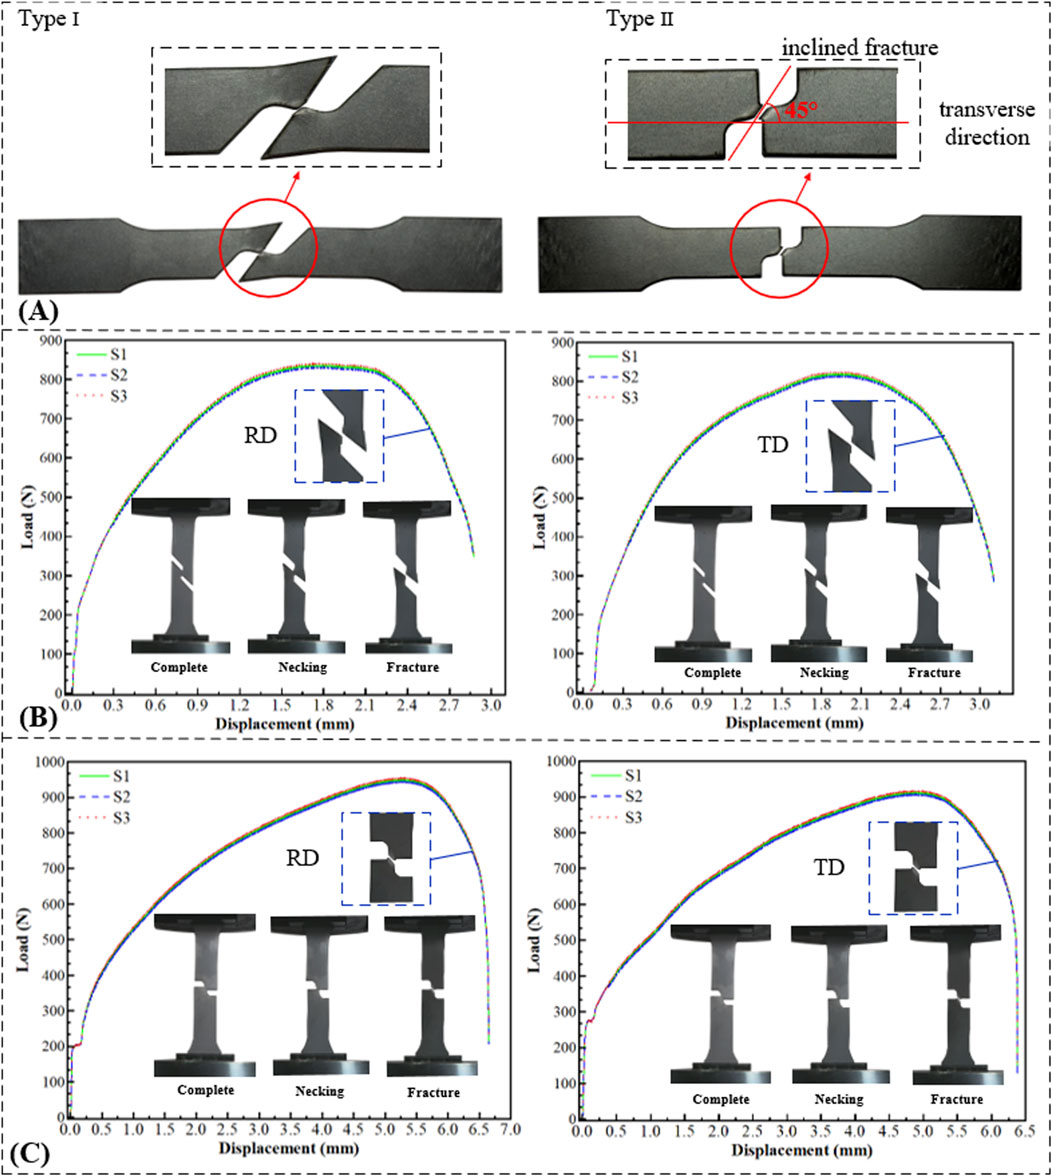
Figure 4. Shear test. (A) Morphology of shear specimens after fracture. (B) Force-displacement curves of Type I shear specimens. (C) Force-displacement curves of Type II shear specimens.
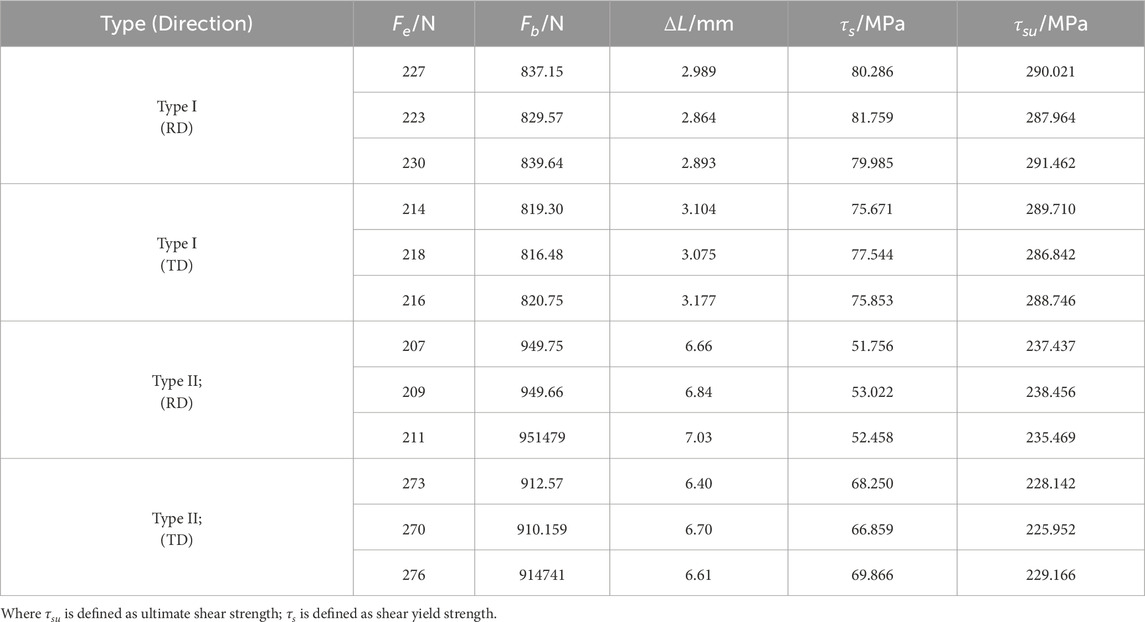
Table 2. Shear test parameters.
Macroscopic fracture morphology analysis of both shear specimen types. The results reveal fracture surfaces inclined at varying angles to the direction perpendicular to the tensile axis. Taking the Type II shear specimen as an example (Figure 4A), the fracture surface forms an angle of approximately 45° with the direction perpendicular to tension. This indicates that fracture evolution occurred both along the direction perpendicular to tension and through the specimen thickness, demonstrating that specimen thickness influences fracture behavior. Consequently, specimen thickness is identified as a key structural parameter for further investigation. Comparative observation of the macroscopic fracture morphologies of tensile and shear specimens revealed distinct differences in roughness. The fracture surface of the unperforated tensile specimen was rough and uneven, whereas the shear fracture surface appeared comparatively flat and smooth. This stark contrast in macroscopic morphology provides visual evidence for the significant differences observed in their macroscopic mechanical properties.
Compared to the tensile specimen (unperforated full sheet), the shear specimen exhibited significant changes in mechanical properties: its maximum load-bearing capacity decreased by approximately 82%, and its initial stiffness was notably reduced. Furthermore, the shear specimen fractured abruptly upon reaching the peak load. These findings collectively demonstrate that the presence of holes or notches leads to a substantial reduction in load-bearing capacity. As shown in Figure 4B,C, distinct differences exist in the force-displacement curves of the Type I and Type II shear specimens. The Type II shear specimen exhibits a pronounced yield plateau at approximately 200 N or 280 N. Furthermore, the Type II specimen sustains a higher load. These differences arise primarily from variations in specimen geometry (notch configuration), leading to differences in the effective loading direction.
The nominal constitutive relation under shear loading, which is known as the engineering constitutive relation, can be represented as:
where
Considering the effects of cross-sectional area changes and cumulative strain during material deformation, Equation 1 cannot represent the actual stress-strain values. Its modification yields the true constitutive relation under shear as Equation 2:
where
Calibration of the Type I and II shear specimens yielded the true constitutive curve (Figure 5). Although subtle differences exist between the RD and TD constitutive curves due to material anisotropy, their overall trends are largely consistent. The primary distinction in shear testing lies in the significant differences between Type I and Type II specimens. Therefore, rolling direction effects are omitted in subsequent analyses.
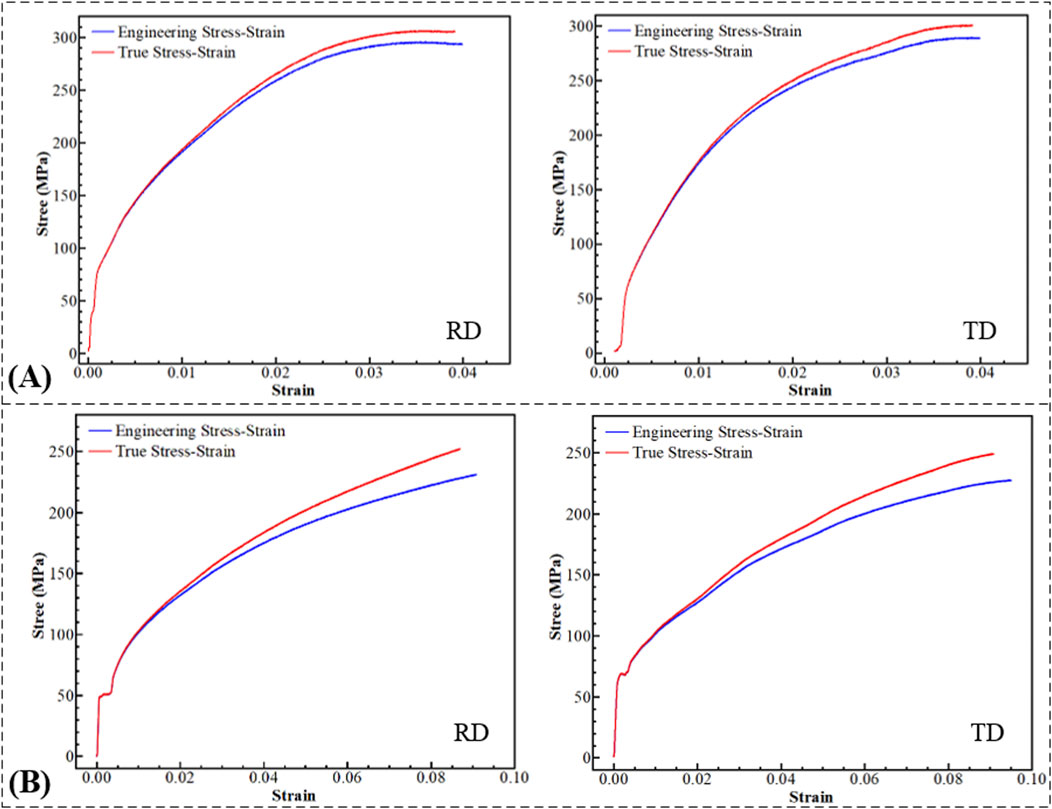
Figure 5. Constitutive curves. (A) Type I shear specimens. (B) Type II shear specimens.
2.3 Microscopic fracture analysis
Fractographic analysis was performed on all specimens using a Phenom XL desktop scanning electron microscope (SEM) to characterize microscopic fracture features. Sectioned fracture regions were preserved for examination. Relatively planar and undamaged areas of the fracture surfaces were identified and designated as observation points. Corresponding observation points on specimen fracture surfaces are presented in Figure 6.
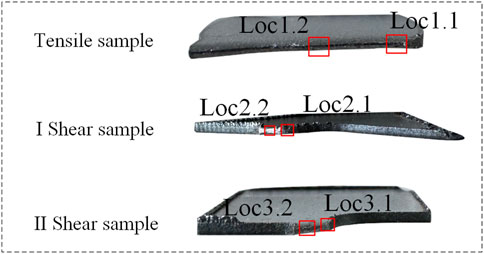
Figure 6. Scanning electron microscope and specimen observation points.
Figure 7A presents observation micrographs at the edge locations (Loc 1.1-3.1) of the tensile specimen fracture surface. Figures 7B,C shows micrographs from the mid-thickness locations (Loc 2.2, Loc 3.2) of the shear specimen fracture surfaces. SEM observations of all three specimen types reveal:
1. The necking phenomenon occurs in the fracture region (Figure 7A) due to specimen elongation under loading. The distinct brightness of the fracture zone indicates significant plastic deformation prior to failure. Non-uniform thickness distribution is observed at the fracture, with damage initiating in the thinner region where microcracks nucleate and propagate rapidly.
2. Abundant slip lines (S1 in Figure 7A) and dimple bands formed by dimple clustering and coalescence (D1, D2 in Figure 7A) develop at the fracture surface. These features ultimately coalesce into macroscopic cracks leading to specimen failure.
3. Slip lines and dimple bands exhibit higher density in the mid-thickness region than near the free surfaces. Their distribution transitions from dense to sparse and from large to small when approaching both plate surfaces. Crack nucleation initiates within the plate interior and propagates toward the surfaces, with this evolution becoming more pronounced at higher tensile strengths.
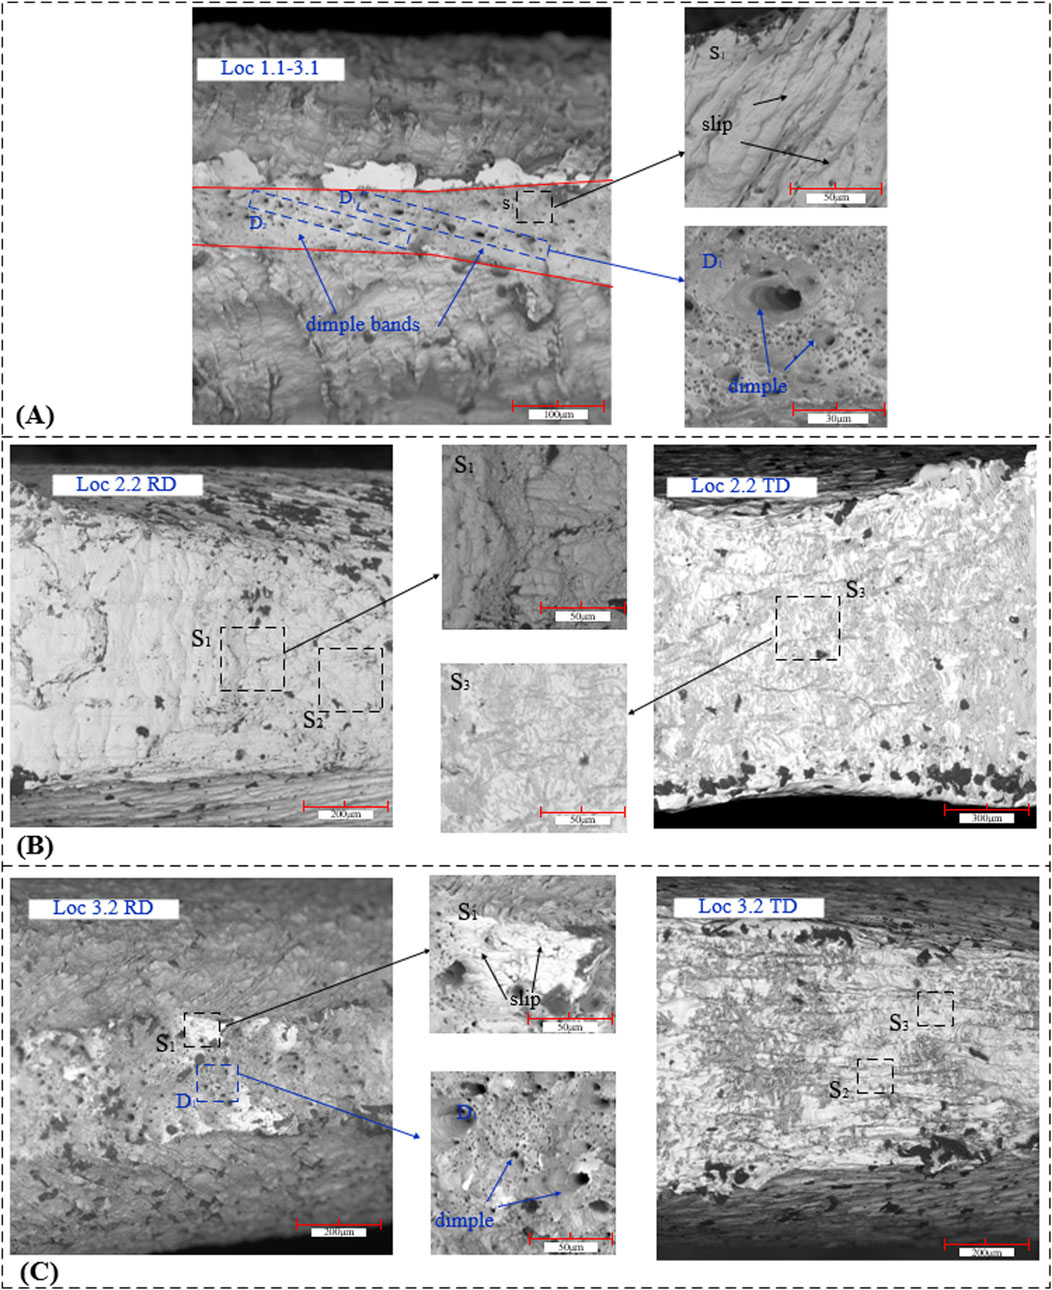
Figure 7. Micro-morphology. (A) Fracture surface edge (Complete tensile specimen shown). (B) Fracture surface morphology of Type I shear specimens. (C) Fracture surface morphology of Type II shear specimen.
The fracture surface of the complete tensile specimen exhibits abundant slip lines and dimples, confirming typical ductile fracture morphology. Compared to other specimens, this configuration demonstrates denser slip lines with more clustered and enlarged dimples - attributable to its superior tensile strength. In Type I shear specimens (Figure 7B, location S1), extensive slip lines develop where RD and TD variants display mutually orthogonal slip orientations due to rolling-induced anisotropy. Type II shear specimens (Figure 7C, location S2) exhibit profuse slip lines accompanied by dimple abundance in the RD orientation (D1 in Figure 7C) but scarcity in TD. This dichotomy stems from texture-governed particle orientation, which constrains TD plastic deformation capacity and suppresses dimple formation, exhibiting quasi-cleavage characteristics. Consequently, load-bearing component design must account for sheet anisotropy, preventing principal stress alignment with the transverse direction.
Combined analysis of force-displacement curves from tensile and shear tests on DC04 thin steel sheet reveals that upon reaching peak load, necking commences immediately, initiating damage at the necking zone. As tension increases, plastic deformation intensifies and internal damage accumulates progressively. Microcrack propagation constitutes the primary mechanism underlying the post-peak force decay in macroscopic force-displacement curves. Concurrently, developing plastic shear bands between major voids accelerates the force decay rate, ultimately triggering complete fracture at the minimum cross-section.
In summary, notches and holes redistribute stress concentration, accelerating fracture through localized concentration around these features. Despite this, perforated sheets offer indispensable advantages in practical applications. Specifically for thin sheet structures, damage initiation typically originates from internal microvoids within the mid-thickness plane. These incipient damage sites nucleate, develop, and interconnect through the thickness direction. Accumulating damage drives crack propagation toward free surfaces, culminating in macroscopic fracture. Sheet thickness, as a critical geometric parameter, significantly influences stress distribution around perforations.
3 Stress concentration analysis around holes
This section investigates stress concentration phenomena surrounding perforations, elucidating relationships between diameter-to-width ratio, sheet thickness, and stress concentration factor (SCF). Finite element models (FEM) were developed in ABAQUS to simulate the tensile testing of steel plates with various hole configurations. The simulations aims to investigate the hole shape effects on stress concentration. Additionally, 60 numerical simulations were conducted for identical hole geometries with varying diameter ratios and sheet thicknesses. This parametric study quantified the influence of these variables on SCF, yielding an empirical formula for stress concentration prediction.
3.1 Stress concentration characteristics of different hole shapes
Four types of perforated DC04 thin steel sheet specimens were designed, Three-dimensional diagram and meshing configurations (exemplified for circular holes) illustrated in Figure 8A. All specimens featured a uniform thickness of 1 mm. Centrally located perforations with distinct geometric characteristics were machined: standard circular holes, oval holes, square holes with straight edges, and diamond holes with sharp corners. The four hole types were designed to have essentially the same open area, approximately 18.84
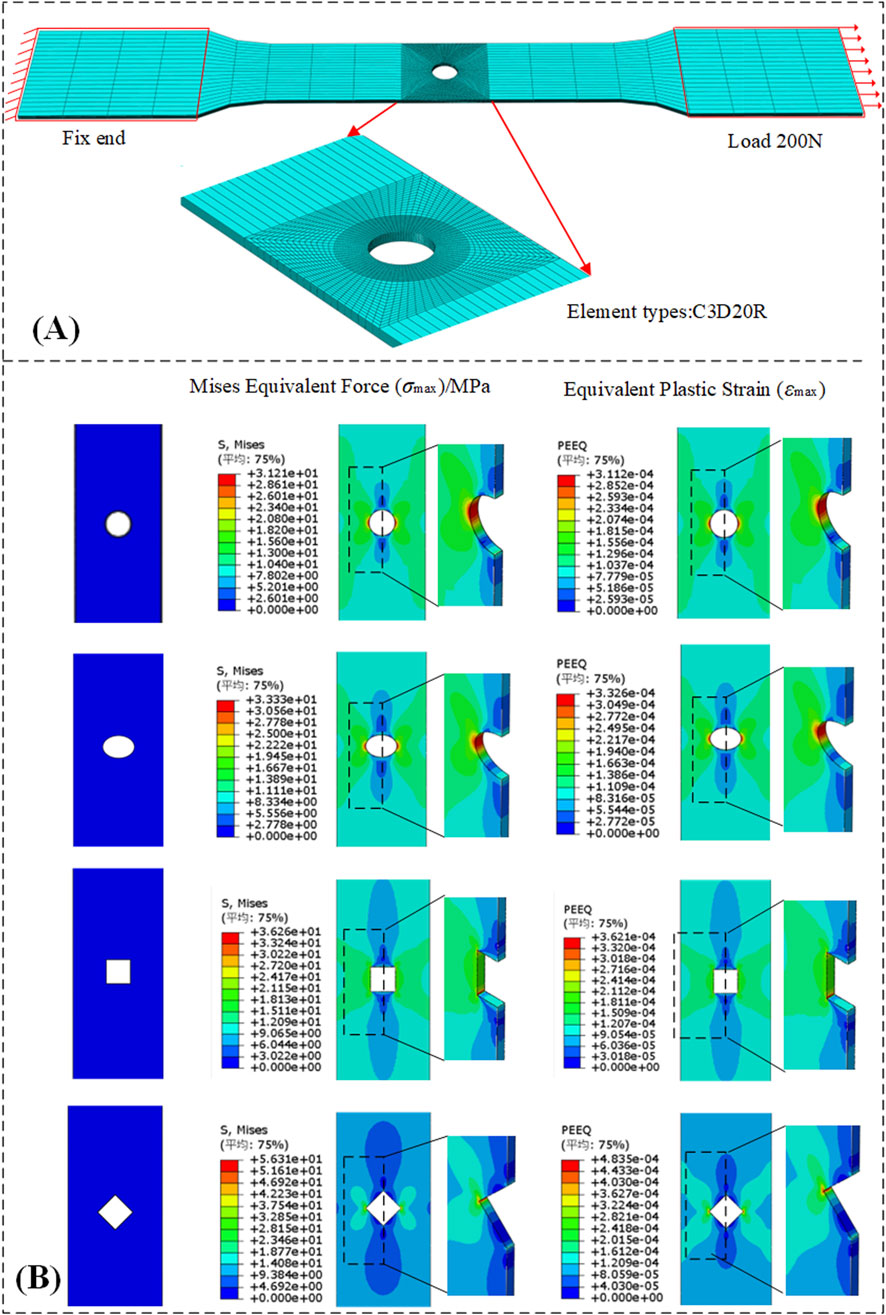
Figure 8. Numerical simulation status. (A) Hole geometry dimensions and mesh refinement. (B) Stress and strain distributions around holes.
A three-dimensional finite element model of a perforated steel plate was developed using the ABAQUS/Standard module to simulate the uniaxial tensile test of the specimen. The elastic-plastic material properties were defined based on experimental data from uniaxial tensile tests of DC04 steel, with an elastic modulus of 205 GPa and a Poisson’s ratio of 0.3. Plastic parameters were incorporated by importing the true stress-strain curve.
To accurately simulate the gripping conditions of the testing machine, a reference point (RP) was created at each end of the plate. Kinematic coupling constraints were applied to couple the degrees of freedom of the nodes at both ends to their respective reference points. The lower reference point was fully fixed, while a tensile force of 200 N was applied to the upper reference point along the tensile direction. This load level was set below the material’s yield strength. To enhance computational accuracy and efficiency, the model was discretized using hexahedral structured elements. The mesh was refined around the hole and through the thickness direction. The maximum stress value around the hole was used as the convergence criterion, and the numerical variation met engineering convergence standards. Figure 8B presents comparative stress and strain contour plots around perforations for all four hole geometries.
Stress and strain contour plots around perforations consistently exhibit an X-shaped distribution pattern. Significantly higher stress values occur in the vicinity of the hole perimeter compared to remote field stresses, with both maximum and minimum stresses concentrated near the perforation boundaries. Simulation results demonstrate that stress perturbations diminish progressively with increasing distance from the hole. The strain nephogram reveals that although a minimal equivalent plastic strain is locally present at the hole edge, its macro-level impact on the stress distribution is negligible.
The stress concentration factor (SCF) for the full cross-section and the net cross-section can be expressed by Equations 3, 4. The stress concentration factors (SCF) for hole plates are calculated and presented in Table 3.
where
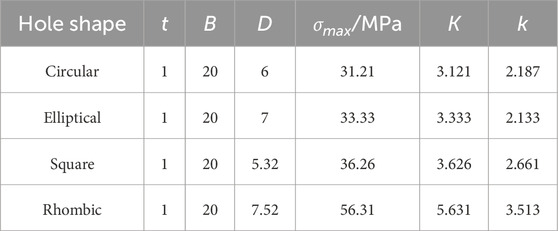
Table 3. Calculated stress concentration factors for plates with different hole geometries.
Perforations disrupt the original geometric continuity of thin sheets, causing redistribution of the initial stress state and distortion of stress trajectories. This results in severe stress concentration around holes. Plates exhibit the most critical stress concentration, reaching a maximum stress of approximately 56.31 MPa at bend regions orthogonal to the tensile direction, with corresponding stress concentration factors
3.2 Stress concentration analysis of thin steel plates with circular holes
To investigate the relationship between the stress concentration factor (SCF) and diameter-to-width ratio versus sheet thickness, finite element models were performed on thin steel sheets with circular perforations. A constant plate width of 20 mm was maintained while systematically varying the central hole diameter (
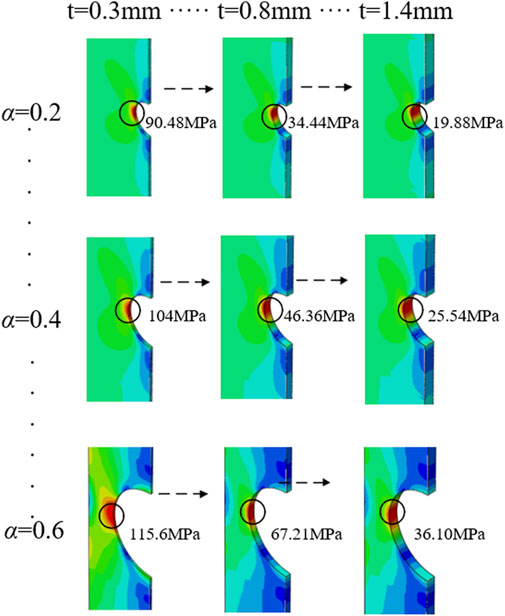
Figure 9. Equivalent Mises stress contour plots for steel sheet with varying diameter-to-width ratios and thicknesses.
Steel sheet with a hole consistently exhibit an X-shaped stress distribution pattern, with maximum stress values consistently occurring at hole boundaries orthogonal to the tensile direction. At constant sheet thickness, increasing diameter-to-width ratio elevates the equivalent maximum stress magnitude and expands its affected zone, intensifying stress concentration and fracture susceptibility. Conversely, for fixed diameter-to-width ratios, greater sheet thickness reduces both the magnitude and spatial extent of equivalent maximum stress, enhancing structural strength. Specifically, when the diameter-to-width ratio remains constant, increasing sheet thickness progressively diminishes equivalent maximum stress—indicating enhanced material strength—thereby effectively mitigating stress concentration effects. Using Equation 3, full cross-section and net cross-section stress concentration factors (SCF) were calculated for all simulation cases, with their relationships to sheet thickness presented in Figure 10.
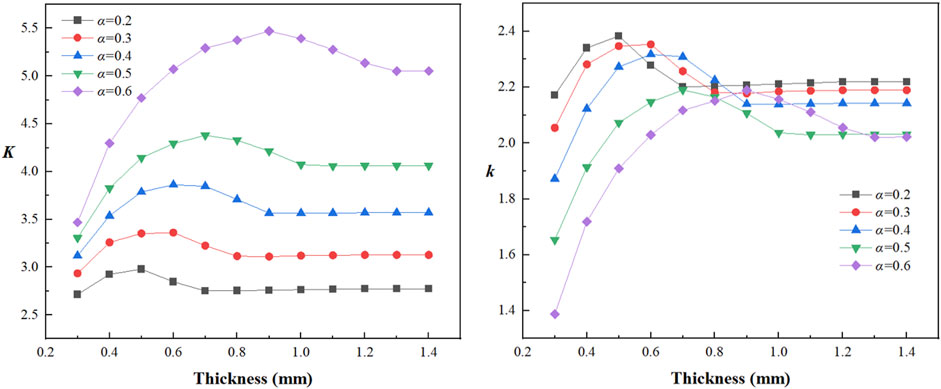
Figure 10. Thickness dependencies of stress concentration factors.
When the aperture size remains constant, the aperture-width ratio is fixed, both the gross section stress concentration factor
3.3 Empirical formula for stress concentration factor in thin steel sheets with circular holes
In prior research, an empirical formula for the net section stress concentration factor of steel plates with central circular holes was derived (Lin X et al., 2025)
In Equation 5,
Defining the stress concentration factor
Formula fitting was performed using MATLAB. Through Gaussian linear regression fitting, a predictive learning model was generated. The applicable ranges are
Using a plate thickness of 0.5 mm and an aperture-width ratio of 0.5, the stress concentration factors calculated via Equations 5, 7 yield
Table 4. Validation and comparison of stress concentration factor equations.
To validate Equations 6, 7 (Table 4) and assess their general applicability, a center-notched model (Figure 11) from the literature (Liu et al., 2023) was employed. The model dimensions were configured as follows: thickness (
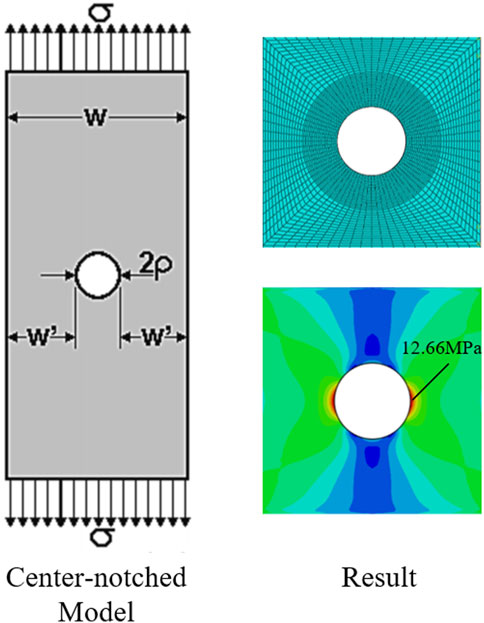
Figure 11. Model and results validating the derived formulas.
To develop an efficient and convenient computational tool, a simplified two-dimensional model was constructed. The aperture-width ratio
Equations 8, 9 enables direct calculation of the stable stress concentration factors
3.4 Empirical formula for optimal thickness of thin steel sheets with circular holes
Transforming the mathematical expressions of Equations 6, 7 into discrete point sets within a three-dimensional coordinate system and processing them via a surface reconstruction algorithm reveals the relationships between the aperture-width ratio (
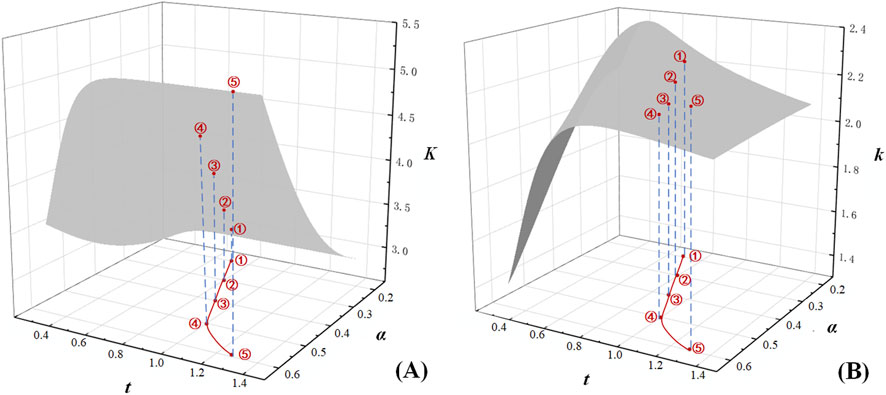
Figure 12. Thickness and diameter-to-width ratio dependencies of stress concentration factors. (A) The relationship of K with thickness and diameter-to-width ratio. (B) The relationship of k with thickness and diameter-to-width ratio.
In practical engineering applications, increasing steel sheet thickness is a common method to enhance component strength. However, this approach elevates material usage and manufacturing costs proportionally with thickness. Consequently, identifying the optimal plate thickness becomes critically important for engineering design. An empirical formula was derived using the Levenberg-Marquardt optimization algorithm, establishing the relationship between aperture-width ratio
This formula enables the prediction of an optimal thickness solution
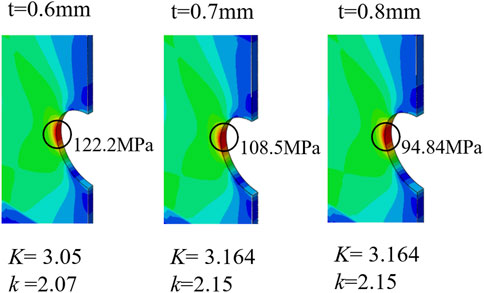
Figure 13. Numerical simulation results for the center-notched model with varying plate thicknesses.
Building upon this foundation, the present study shifts its focus to the mechanical response under geometric discontinuities. The findings align with the classical Kane-Mindlin theory, which concluded that the stress concentration factor tends to stabilize in thin plates. Furthermore, this work reveals the non-monotonic behavior of the factor within the finite thickness range and quantifies the optimal solution under specific geometric boundaries, thereby providing a basis for deepening the understanding of the stress concentration mechanism in plates of finite thickness.
In traditional engineering structural design, meeting safety requirements—including strength, stiffness, and stability—often relies on empirical knowledge or conservative design principles. This approach tends towards excessive thickness increases to provide safety margins. In contrast, the proposed optimization method scientifically quantifies safety boundaries, effectively eliminating the practice of arbitrarily thickening plates based on subjective safety perceptions. This approach can be applied to the design of components with openings, such as automotive body cover panels and aerospace lightweight frames. The intrinsic relationships between geometric parameters and stress concentration revealed in this study, as well as the modeling and optimization methodology employed, also provide valuable guidance for the structural design of other ductile materials such as aluminum alloys and high-strength steels. Applying this optimization method to practical engineering structural design can significantly reduce material consumption, offering a valuable reference for lean and green engineering design practices.
The analysis primarily focused on static loading conditions and did not account for the effects of fatigue loading, temperature, corrosion, or other influencing factors, which warrants further investigation. Future work could investigate stress concentration behaviors under fatigue and impact loading, and examine the coupled effects of environmental conditions such as temperature, humidity, and corrosion with stress concentration, to better simulate the complexity of real-world engineering environments.
4 Conclusion
This study investigates DC04 low-carbon steel sheets—widely used in automotive manufacturing—through experimental testing, microscopic characterization, and numerical simulations. The geometric influences on stress concentration phenomena were systematically analyzed, with focus on thickness and diameter-to-width ratio (
1. Constitutive relationships for DC04 were established through tensile and shear tests. Combined macroscopic fracture analysis with SEM observations confirms that crack propagation initiates internally before extending to free surfaces.
2. Under equivalent opening areas, circular holes minimize stress concentration and represent the optimal geometry. Fillet treatments effectively reduce stress concentration factors in non-circular holes.
3. For fixed hole geometry: Increased
4. A modified analytical model correlating
Data availability statement
The original contributions presented in the study are included in the article/Supplementary Material, further inquiries can be directed to the corresponding author.
Author contributions
HY: Conceptualization, Methodology, Software, Data curation, Writing – original draft. LZ: Resources, Writing – review and editing, Funding acquisition, Project administration, Supervision. XL: Writing – review and editing, Supervision. PT: Writing – review and editing. QD: Writing – review and editing.
Funding
The author(s) declare that financial support was received for the research and/or publication of this article. This study was funded by the National Natural Science Foundation of China (Grant No. 52078005).
Conflict of interest
The authors declare that the research was conducted in the absence of any commercial or financial relationships that could be construed as a potential conflict of interest.
Generative AI statement
The author(s) declare that no Generative AI was used in the creation of this manuscript.
Any alternative text (alt text) provided alongside figures in this article has been generated by Frontiers with the support of artificial intelligence and reasonable efforts have been made to ensure accuracy, including review by the authors wherever possible. If you identify any issues, please contact us.
Publisher’s note
All claims expressed in this article are solely those of the authors and do not necessarily represent those of their affiliated organizations, or those of the publisher, the editors and the reviewers. Any product that may be evaluated in this article, or claim that may be made by its manufacturer, is not guaranteed or endorsed by the publisher.
Supplementary material
The Supplementary Material for this article can be found online at: https://www.frontiersin.org/articles/10.3389/fmats.2025.1692324/full#supplementary-material
References
Arcieri, E. V., Baragetti, S., and Božić, Ž. (2024). Failure analysis of Ti6Al4V titanium alloy under fatigue loading: an experimental and numerical study. Eng. Fail. Anal. 164, 108715. doi:10.1016/j.engfailanal.2024.108715
Chongmin, S., and Guo, W. (2006). Numerical investigations of maximum stress concentration at elliptic holes in finite thickness piezoelectric plates. Int. J. fatigue 28 (4), 438–445. doi:10.1016/j.ijfatigue.2005.06.046
Ding, M., Zhang, Y., Lu, H., and Sun, Y. (2021). Numerical investigation on stress concentration of surface notch on blades. Eng. Fail. Anal. 122 (2021), 105241. doi:10.1016/j.engfailanal.2021.105241
Dveirin, O. Z., Andreev, O. V., Kondrat’ev, А. V., and Haidachuk, V. Y. (2021). Stressed state in the vicinity of a hole in mechanical joint of composite parts. Int. Appl. Mech. 57, 234–247. doi:10.1007/s10778-021-01076-4
Fazlali, B., Lomov, S. V., and Swolfs, Y. (2024). Reducing stress concentrations in static and fatigue tensile tests on unidirectional composite materials: a review. Compos. Part B Eng. 273, 111215. doi:10.1016/j.compositesb.2024.111215
Folias, E. S., and Wang, J. J. (1990). On the three-dimensional stress field around a circular hole in a plate of arbitrary thickness. Comput. Mech. 6, 379–391. doi:10.1007/bf00350419
Kane, T. R., and Mindlin, R. D. (1956). High-frequency extensional vibrations of plates. J. Appl. Mech. 23, 277–283. doi:10.1115/1.4011300
Kirsch, E. G. (1898). Die Theorie der Elastizit t und die Bed rfnisse der Festigkeitslehre. Zeitshrift Des. Vereines Dtsch. Ingenieure 42, 797–807.
Li, Z., Guo, W., and Kuang, Z. (2000). Three-dimensional elastic stress fields near notches in finite thickness plates. Int. J. Solids Struct. 37 (51), 7617–7632. doi:10.1016/S0020-7683(99)00311-X
Lin, X., Zhang, L., and Xie, Y. (2025). Research on the stress concentration effects and fracture mechanisms of DC04 sheet steel with holes. Front. Mater. 12, 1488624. doi:10.3389/fmats.2025.1488624
Liu, B., Xu, W., Lu, X., Tamaddon, M., Chen, M., Dong, J., et al. (2021). The optimization of Ti gradient porous structure involves the finite element simulation analysis. Front. Mater. 8, 642135. doi:10.3389/fmats.2021.642135
Liu, M., de Oliveira Miranda, A. C., Antunes, M. A., Meggiolaro, M. A., and de Castro, J. T. P. (2023). Plastic stress concentration Eff. fatigue strength. Int. J. Fatigue 168, 107394. doi:10.1016/j.ijfatigue.2022.107394
Liu, H., Deng, L., and Wang, W. (2024). 3D stress concentration around circular hole under remote biaxial loading. Int. J. Mech. Sci. 268, 109032. doi:10.1016/j.ijmecsci.2024.109032
Luna, V. M., Kim, I. T., and Jeong, Y. S. (2024). Stress concentration factor estimation for corroded steel plates using the surface gradient method. Eng. Fail. Anal. 163, 108509. doi:10.1016/j.engfailanal.2024.108509
Pany, C. (2021a). Cylindrical shell pressure vessel profile variation footprint in strain comparison of test data with numerical analysis. Liq. Gaseous Energy Resour. 1 (2), 91–101. doi:10.21595/lger.2021.22163
Pany, C. (2021b). Structural analysis of metallic pressure vessels with weld sinkage in the circumferential joint. J. Sci. Technol. Eng. Res. 2 (1), 4–10. doi:10.5281/zenodo.4586360
Qi, W., Zhao, Y., Zhang, T., and Wang, F. (2021). Effect of acidizing process on the stress corrosion cracking of HP-13Cr stainless steel in the ultra-depth well environment. Front. Mater. 8, 732931. doi:10.3389/fmats.2021.732931
Sternberg, E., and Sadowsky, M. A. (1949). Three-dimensional solution for the stress concentration around a circular hole in a plate of arbitrary thickness. ASME. Appl. Mech. 16 (1), 27–38. doi:10.1115/1.4009891
Tadepalli, G., Vineela, M. G., and Reddy, T. J. (2017). Analysis of stress concentration in isotropic and orthotropic plates with hole under uniformly distributed loading conditions. Mater. Today Proc. 4 (2), 740–745. doi:10.1016/j.matpr.2017.01.080
Wang, T., Kang, Q., Zhang, X., Xu, X., Li, W., and Zhang, H. (2022). Study on the influence of hole defects with different shapes on the mechanical behavior and damage law of coal and rock. PloS one 17 (3), e0265753. doi:10.1371/journal.pone.0265753
Xu, W., and Xu, W. (2022). Comparison and understanding of the main revision contents of GB/T 228.1—2021. Phys. Test. Chem. Analysis Part A Phys. Test. 58 (8), 1–4. doi:10.11979/lhjy-wl202208001
Yin, Y., Yang, T., Qin, W., Lu, Y., and Gu, Y. (2024). Calibration of GTN model for fracture analysis of steel plates with holes. J. Constr. Steel Res. 215, 108506. doi:10.1016/j.jcsr.2024.108506
Yuan, K., and Liu, J. (2022). Two-dimensional weight function for the determination of stress intensity factors for semi-elliptical surface cracks in finite-thickness and finite-width plates. Theor. Appl. Fract. Mech. 121, 103495. doi:10.1016/j.tafmec.2022.103495
Zhang, T., Guo, W., and Yang, Z. (2000). Three-dimensional effects of stress concentration around a circular hole in a finite-thickness plate. Proc. Natl. Conf. Fatigue Fract. 2000, 526–530.
Keywords: DC04 steel, finite thickness, stress concentration around holes, stress concentration factor, plate thickness
Citation: You H, Zhang L, Lin X, Tang P and Du Q (2025) Stress concentration characteristics and coefficient modification for DC04 steel with holes of finite thickness. Front. Mater. 12:1692324. doi: 10.3389/fmats.2025.1692324
Received: 25 August 2025; Accepted: 14 October 2025;
Published: 28 October 2025.
Edited by:
Miha Brojan, University Of Ljubljana, SloveniaReviewed by:
Chitaranjan Pany, Vikram Sarabhai Space Centre, IndiaVan Hieu Dang, Phenikaa University, Vietnam
Copyright © 2025 You, Zhang, Lin, Tang and Du. This is an open-access article distributed under the terms of the Creative Commons Attribution License (CC BY). The use, distribution or reproduction in other forums is permitted, provided the original author(s) and the copyright owner(s) are credited and that the original publication in this journal is cited, in accordance with accepted academic practice. No use, distribution or reproduction is permitted which does not comply with these terms.
*Correspondence: Limei Zhang, emhhbmdsaW1laUBidGJ1LmVkdS5jbg==