 Nicole M. Wakida
 Ryan D. Ha
 Edward K. Kim
 Xiangduo Kong
 Kyoko Yokomori
 Michael W. Berns
- 1Beckman Laser Institute and Medical Clinic, University of California, Irvine, CA, United States
- 2Department of Biological Chemistry, School of Medicine, University of California, Irvine, CA, United States
- 3Department of Biomedical Engineering, University of California, Irvine, CA, United States
Astrocytes are known to respond to various perturbations with oscillations of calcium, including to cellular injury. Less is known about astrocytes’ ability to detect DNA/nuclear damage. This study looks at changes in calcium signaling in response to laser-induced nuclear damage using a NIR Ti:Sapphire laser. Primary astrocytes derived from genetically engineered mice expressing G6Campf genetically encoded calcium indicator were imaged in response to laser induced injury. Combining laser nanosurgery with calcium imaging of primary astrocytes allow for spatial and temporal observation of the astrocyte network in response to nuclear damage. Nuclear damage resulted in a significant increase in calcium peak frequency, in nuclear damaged cells and astrocytes directly attached to it. The increase in calcium event frequency observed in response to damage and the transfer to neighboring cells was not observed in cytoplasm damaged cells. Targeted astrocytes and attached neighboring cells treated with Poly (ADP-ribose) polymerase inhibitor have a significantly lower peak frequency following laser damage to the nucleus. These results indicate the increase in calcium peak frequency following nuclear damage is poly (ADP-ribose) polymerase dependent.
Introduction
A major function of astrocytes is to maintain homeostasis; they can sense changes within the surrounding environment and scale their response based on the severity of the sensed insult. Astrocytes respond to axon injury, cell death, and many other forms of brain injury through a process of reactive astrogliosis [1]. In previous studies we have utilized laser irradiation to mimic mild CNS damage and followed the response of astrocytes where laser ablation resulted in cell death of a targeted astrocyte within a network of cells [2, 3].
Earlier reports on astrocytes that focus on induced DNA damage have been caused by ionizing radiation or cytotoxic drugs, where the severity of DNA damage were primarily monitored by comet assays, a gel electrophoresis technique [4–11]. The extent of astrocytes’ ability to respond to DNA damage is largely unknown. One study by Schneider et al. suggests that astrocytes exposed to ionizing radiation lack functional DDR signaling due to the repression of ATM transcription [12]. There is a much better understanding of the DNA damage response (DDR) in other cell types, including observations of non-irradiated cells mimicking the response of laser-irradiated cells. Previous studies have described this phenomenon known as radiation-induced bystander effects (RIBE), where non-irradiated cells behave similarly targeted cells [13]. Our goal in this study is to better understand the ability of astrocytes to respond to induced DNA damage both in laser-damaged cells and non-irradiated cells within the astrocyte network.
Calcium Signaling in Astrocytes
One known mechanism astrocytes use to signal and respond to perturbations of the CNS is through calcium oscillation. Previous studies demonstrate that astrocytes are able to transmit a response to non-stimulated neighboring cells with calcium elevation passing as intercellular calcium waves [14–17]. These waves of calcium are transmitted through cellular networks by direct transmission through gap junctions [17–19] and indirectly through extracellular ligand/gliotransmitter binding of membrane receptors on neighboring cells [20].
Cytosolic calcium concentrations oscillate within cells and are a means of intercellular communication, and span to the molecular level with the binding and activation of proteins in many signaling pathways. Information is held within frequency and amplitude of calcium oscillation [21–23]. Calcium oscillations are complex both temporally and spatially, waves travel through cells, and signal fluctuations within subcellular and intercellular regions [23]. Further complexity derives from calcium crosstalk with other signaling pathways.
The progressive generation of calcium imaging tools has resulted in improvement over conventional indicators like Fluo4 or Fura-2 that nonspecifically label all cells [24, 25]. Recently, Dong, Othy et al. have taken advantage of calcium sensors like calmodulin to generate genetically encoded calcium indicator Salsa6F. Salsa6F genetically engineered mice express a ratiometric protein with calcium sensitive green GCamp6F, and calcium insensitive tdTomato [26].
Parp–Calcium Relationship
In response to single and double strand DNA breaks, poly ADP-ribose polymerase (PARP) activation or hyperactivation causes ADP-ribosylation of DNA repair proteins at the site of damage [27]. This results in poly (ADP-ribose) (PAR) polymer modifications. Bentle et al. describe calcium and PARP as critical regulators in response to ROS-induced DNA damage, resulting in changes to metabolism and the DNA repair processes. Additionally, in vivo induced DNA damage demonstrates that PAR can concentrate calcium ions and extracellular matrix calcification. Muller et al. directly linked DNA damage with calcium signaling and redistribution [28].
Here we quantified the calcium response of the astrocyte network to laser-induced nuclear damage and investigated the relationship of PARP and calcium in response to nuclear damage. In vitro astrocyte model is known for the transmission of calcium elevation in response to cellular injury to network cells [2, 18]. We found that nuclear damage specifically alters the whole cell calcium dynamics not only in the damaged cell, but also in the attached neighboring cells in a PARP-dependent manner. Our results reveal that Ca2+ mediates inter-cellular transmission of PARP signaling, which is dependent on the position of the cell within the network relative to the nuclear damaged cell.
Methods
Primary Astrocyte Cultures
Cortical astrocytes were dissected from mice expressing GFAP-Cre Salsa6f, described in detail by Dong et al [26]. Salsa6F utilizes GCaMP6f genetically encoded ultrafast highly sensitive cytoplasmic calcium indicator [29]. Dissected primary astrocytes were plated onto gelatin coated 35 mm glass bottomed imaging dishes as previously described in Wakida et al. [30]. Cells were stored at 37°C at 5% CO2 prior and during imaging.
This study was carried out in accordance with the principles of the Basel Declaration and recommendations of the University of California, Irvine Institutional Animal Care and Use Committee. The protocol was approved by the University of California, Irvine Institutional Animal Care and Use Committee.
Microscopy
A Zeiss Axiovert 200M Microscope with a 40 × 1.3 NA phase contrast objective and a Hamamatsu Camera Orca-R2 CCD will be used to take time-lapse, phase contrast, and fluorescence images at 2 s imaging intervals. Fluorescence images of GCaMP6f signal were acquired utilizing an Exfo XCite light source combined with a green HQ 525–50 fluorescence filter set (Chroma). Cells were incubated in an Ibidi stage incubation system maintaining cultures at 37°C, 5% CO2, and 70% humidity during imaging. Pre images were acquired approximately 5 s prior to laser irradiation; The post image acquired immediately following laser irradiation was approximately 5 s following laser shutter closure.
Laser Nanosurgery
The Coherent Mira 900 Ti:Sapphire laser emitting 800 nm pulses of 200 fs pulse width at an emission rate of 76 MHz was used to precisely damage cells at desired regions of interest (ROI). A Zeiss 40 × 1.3 NA phase contrast objective was used, resulting in a damage region spanning approximate 0.8 um. Robolase, a custom coded computer software run in LabVIEW software, was used to control both laser and microscope components. Laser power and exposure time was controlled using a Uniblitz shutter controller and Glan Thompson polarizer fixed in a rotary mount, controlled by an ESP 300 motion controller. The Uniblitz shutter was opened allowing laser exposure to the targeted region for a 10 pulse at an average intensity of 3.4 × 10⁸ W/cm2. A schematic diagram of the experimental setup is displayed in Supplementary Figure S1. Further details of this setup were previously published [2, 30].
PAR Immunofluorescence Staining
Primary astrocytes plated on gridded coverslip in 35 mm imaging dish coated with polylysine were targeted within the nucleus with previously discussed laser settings. Cells were fixed with 4% paraformaldehyde within 30 min of laser damage. Cells were then placed in 3% TritonX in PBS blocking buffer with 5% BSA. Astrocytes were stained with anti-PAR polyclonal antibody (rabbit, 4336-BPC-100, Trevigen) and 4′,6-diamidino-2-phenylindole (DAPI) 300 nM DAPI stain solution (Thermo Fisher). Following staining, targeted cells were imaged for PAR (450 nm excitation, 510 nm emission) and DAPI signal (358 nm excitation, 463 nm emission).
Image Analysis
ImageJ was the primary software used for image analysis [31]. ImageJ was utilized to define a region of interest within individual cells to generate calcium fluorescence pixel intensity plots from acquired time-lapse images (see Figure 1). In ImageJ, the Z project function was used to obtain the average intensity for the stack of images for each field of view. Image calculator in ImageJ was then used to subtract the average intensity from individual images within the image stack. Resulting images are presented as “change” and pseudocolored with look up table “fire.”
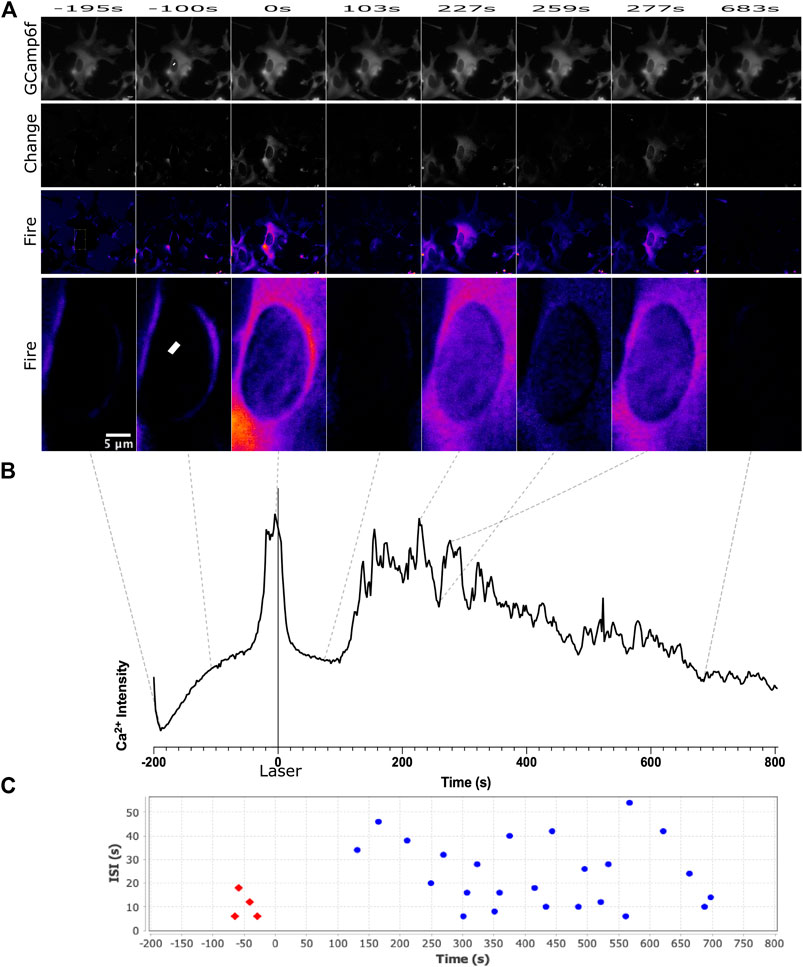
FIGURE 1. Calcium signal was observed for 200 s before the laser was exposed at the region delineated by the white ROI in frame 2, and 800 s following laser damage. We observe an increase in the frequency of calcium transience beginning approximately 150 s following laser damage. This can be observed in both the pseudo colored images in (A) and the calcium signal intensity plot in (B). The scale for LUT fire is with the brightest pixels corresponding to white, and the darkest pixels corresponding to black. Calcium transience correlates with an increases to white/yellow can be observed in the third, fifth, and seventh image. CaSiAn software was used to analyze calcium peaks, displayed as individual dots on graph (C). Red dots correspond to peaks defined before laser damage, blue dots correspond to peaks after laser damage.
Change in Fluorescence Intensity
Changes in GCamp6f signal fluorescence intensity was quantified as a change in fluorescence value dF/F. This was calculated by subtracting the average pixel intensity pre fluorescence value from the post fluorescence value divided by the prefluorescence value. Details on dF/F quantification utilizing these methods were previously published [2].
Calcium Peak Frequency Analysis
CaSiAn is an open source software used to analyze and quantify the calcium signals. Fluorescence intensity data was used to analyze individual cell’s based on two separate time intervals: “pre” and “post” intervals. The pre interval defines the section of time that occurs before the laser cut; The post interval occurs after the laser cut. The peak threshold and spike width were both set to 5% of the max amplitude and spike amplitude respectively to detect calcium peaks. CaSiAn generates plots that illustrate the identified calcium peaks in each interval (Figure 1C) [32]. Peak frequency was calculated by dividing the quantified number of peaks in a given interval divided by the duration in minutes for pre and post time intervals of each cell.
Data Compilation and Statistical Analysis
Data compilation and statistical analysis was accomplished utilizing GraphPad Prism eight software. Frequency and amplitude (dF/F) data sets for control and DNA damaged cells did not pass normality tests with values α > 0.05 (Anderson-Darling and Shapiro-Wilk normality tests). Based on the results of the normality tests, statistical significance was determined by a p-value below 0.05 using Mann-Whitney nonparametric unpaired t test. Violin plots showing the variation in cellular response were generated with the Prism software.
Results
Cytosolic Calcium Response to Laser-Induced Subcellular Damage
Here we use an in vitro astrocyte model expressing a genetically encoded calcium sensor to monitor the kinetics of calcium signaling in response to laser damage. To determine how the position of subcellular injury within the cell affects calcium signaling, the laser was targeted to a submicron region either in the nucleus or in the cytoplasm, of individual astrocytes within an in vitro network demarcated by a yellow ROI (Figures 1A–3–3). GCaMP6f signal was acquired before laser irradiation for 200°s, and for 800°s following irradiation, with the laser fired at time 0 (Figure 1). The femtosecond laser conditions used in the study results in PAR accumulation at damage site in the nucleus (see Supplementary Figure S2), indicative of complex DNA damage leading to efficient PARP activation (see methods for specific laser irradiation parameter information) [33–35].
We observed an increase in calcium transients following laser irradiation targeted at a central position in the nucleus (Figure 1A yellow ROI). GCaMP6f signal is displayed in the top row of Figure 1A. Supplementary Movie S1 demonstrates the dramatic fluctuations of calcium observed in response to nuclear damage of the astrocyte network portrayed in Figure 1A. A small number of spontaneous calcium events are observed prior to laser damage, which is commonly known to occur in astrocytes. We observe an increase in the number of calcium transience following laser damage. To highlight fluctuations in calcium fluorescence, row two labeled as “change” displays changes in calcium signal from the average intensity (see methods for full description). Row three displays “change” images pseudocolored with look up table “fire” where dark pixels correspond to the lowest fluorescence intensity (black, blue) and light pixels (white/yellow) correspond to high fluorescence intensity. Supplementary Movie S2 is a time-lapse movie of the pseudocolored images displayed in row three that dramatically highlights the changes in calcium signal over time. Row four of Figure 1A is a magnified inset of the targeted nucleus, highlighting the changes in calcium fluorescence in the region immediately surrounding the induced nuclear damage (region of row four corresponds to yellow rectangle in first image of row 3). A plot of average pixel intensity from the entire targeted cell (presented in Figure 1A) is displayed in Figure 1B. Dotted lines delineate the position in time each image corresponds to along the plotted pixel intensity. Figure 1C displays the peaks detected from the intensity plot in Figure 1B using CaSiAn software.
To better understand how calcium propagates intracellularly and intercellular pathways between astrocytes, we have plotted calcium fluorescence intensity from multiple regions within a contiguous astrocyte network. Figures 2A,B displays intensity plots for multiple subcellular regions of the targeted cell. Regions were picked adjacent to the nucleus (perinuclear/PN) and in distal regions near the cell periphery (distal/D). We observe a trend of perinuclear regions displaying larger variations in intensity when compared to corresponding distal regions within the same cell. We additionally observe that individual peaks vary greatly between subcellular positions. When comparing subcellular positions (rectangles in Figure 2) to signal acquired from the whole cell (outline of cell corresponding to fluorescence in Figure 2), we find that the whole cell signal includes a majority of peaks from subcellular traces at lower amplitudes. All future analysis discussed is based on calcium signal from the entire cell. Using signal from the whole cell, we compare the signal from the damaged cell to signal to neighboring cells within the astrocyte network. We observe variation in signal between all cells, in both the intensity plots and time lapse movies (Supplementary Movies 3 and 4).
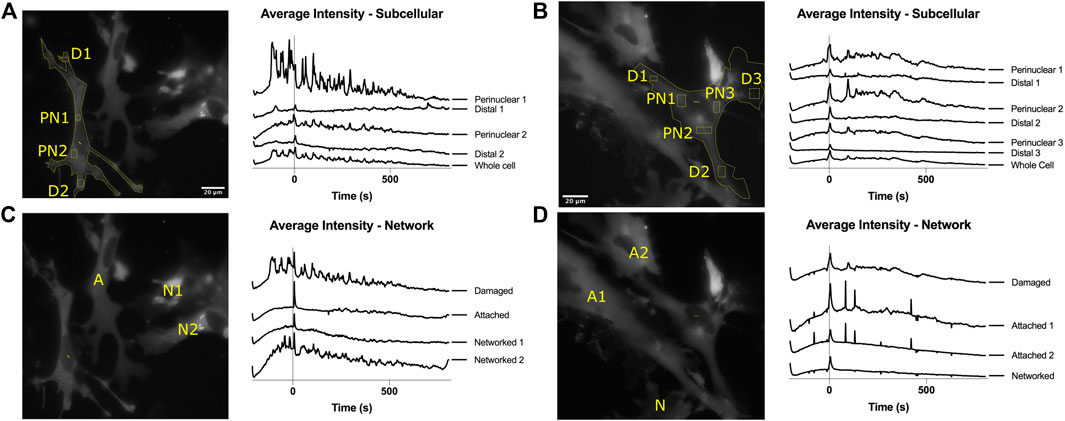
FIGURE 2. Intracellular and intercellular variation in calcium intensity plots. (A,B) Intensity plots from multiple locations in the same cell are displayed for 200 s prior to laser damage (time 0) and 800 s following time 0. Perinuclear (PN) positions demonstrate peaks with higher amplitudes and variation. Distal (D) positions demonstrate peaks with smaller amplitude changes. Whole cell traces include a major peaks observed in subcellular positions. (C,D) Intensity plot comparisons for contiguous astrocytes within the network demonstrate a large variation in position of peaks over time. Peaks are observed to vary both between subcellular positions and throughout the network.
To determine if the subcellular position damaged by the laser can affect calcium signaling, we compare laser damage to nuclear and cytoplasm regions to controls. Control irradiation diagramed in Figure 3A corresponds to the laser being exposed to an extracellular region devoid of cells. Figures 3B,C diagram the position of irradiation for nuclear damage and cytoplasm damage in cells, respectively. Calcium signals can vary greatly between astrocytes, thus we display calcium intensity plots from four representative cells, displayed in the second column of Figure 3. Intensity profiles are displayed for three categories of irradiation: control, nuclear targeted, and cytoplasm targeted. Random calcium transients are depicted as spikes in the calcium intensity plots prior to laser irradiation. There is an increased number of calcium peaks observed after time 0 in nuclear damaged cells, not present in control or cytoplasm damage categories.
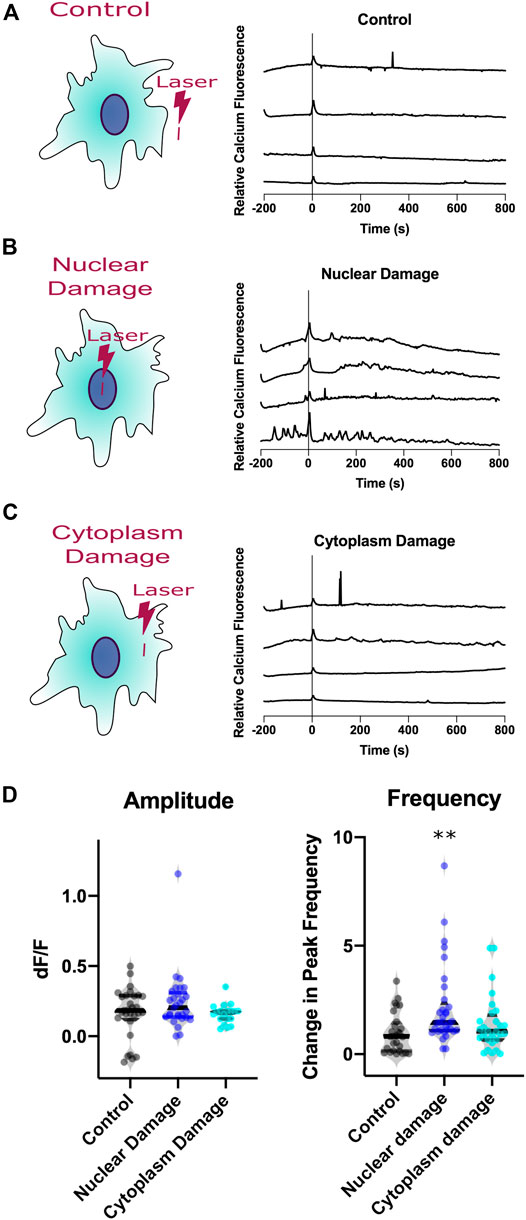
FIGURE 3. Calcium signaling of astrocytes responding to laser injury. Three types of injury induced (A). Control, (B). Nuclear Damage, (C). Cytoplasm Damage. Calcium signal traces from four representative astrocytes from each damage type. All three categories display a small increase in amplitude at time 0, time of laser exposure. (D). Analysis of calcium intensity plots by changes in amplitude and frequency before vs. after laser damage. The amplitude violin plot displays the change in amplitude before vs. after laser damage as dF/F values for individual cells with induced nuclear damage. No statistical difference was observed between the three categories. Violin plot displaying the variation in frequency observed for individual cells before vs. after laser damage. Nuclear damage resulted in a significant increase in peak frequency following laser damage (p = 0.0006), compared to control laser damage, depicted by the asterisks (** defined as p < 0.01). When compared to control, the change in peak frequency did not increase significantly following cytoplasm damage.
To quantitatively compare characteristics from the observed changes in calcium signaling from laser damage, we analyzed the intensity plots for amplitude of the peak at time 0 and frequency of peaks change. Amplitude changes of individual cells are depicted as a dF/F value. This value compares the intensity of calcium signal before laser exposure subtracted from the intensity after laser exposure, then divided by the intensity before laser exposure. Peak frequency data is calculated for individual cells by dividing peaks per minute observed after laser exposure by peaks per minute observed before laser exposure.
Laser exposure results in an immediate calcium transient across all three categories, peak at time 0 corresponding to a majority of dF/F values greater than 0. The average dF/F for control cells 0.18 (n = 29); The average dF/F for nuclear damaged cells is 0.2 (n = 29); The average dF/F for cytoplasm damaged cells 0.17 (n = 19). Because the amplitude and number of spikes vary between astrocytes, we use a violin plot to display the distribution of observed signals. The violin plots for amplitude display a similar median, with the widest region surrounding the median (region with highest probability of observations). The variation of dF/F was not significant when comparing control astrocytes to nuclear damaged (p = 0.62) and cytoplasm damaged (p = 0.29) cells.
To assess if the increase in calcium events was significant, we compared the number of peaks derived by CaSiAn software (Figure 1C) divided by the minutes of observation time for two periods: pre laser exposure and post laser exposure. For nuclear damaged cells, we observed average peak frequency of 26.5 mHz in the period prior to irradiation, and an increase in average peak frequency of 43 mHz following nuclear damage. Because there is variation in calcium activity throughout the population of astrocytes observed, we divided the post irradiation frequency by the pre irradiation frequency for individual cells. The average change in peak frequency for control astrocytes is 0.8204 (n = 28), 1.46 for nuclear damaged cells (n = 33), and 1.12 for cytoplasm damaged cells (n = 17). The violin plot in Figure 3C displays the distribution of the observed changes in peak frequency, with a marked increase in nuclear damaged cells in control and cytoplasm damaged. Nuclear damaged cells displayed a significant increase in peak frequency compared to control (p = 0.0006) and cytoplasm damaged cells (p = 0.026). There was no significant increase in peak frequency for cytoplasm damaged cells when compared to control cells (p = 0.39), thus the increase in frequency was specifically observed in nuclear damaged cells. Astrocytes signal nuclear damage via the rate of cytoplasmic calcium transient events, but not in amplitude of the peak.
Calcium Signaling Through Astrocyte Network
We next investigated whether the increase in calcium transient events are limited to the targeted cell, or if the changes in calcium signaling propagates to surrounding cells that form the astrocyte network. Cells within a given network are classified based on their physical location relative to the damaged cell, as diagrammed in Figure 4A. We categorized the astrocytes within observed networks into three groups: damaged, attached, and networked. Any cell that directly shares membranous junctions with the damaged cell is classified as an attached cell. Any cell that is directly sharing membranous junctions with an attached cell but not directly in contact with the damaged cell is classified as a networked cell. Intensity plots of four representative cells are displayed for each category for nuclear damage in Figure 4B and for cytoplasm damage in Figure 4C. We observed an increase in peak frequency in nuclear damaged astrocytes with an average change in peak frequency of 1.46 (n = 33). In astrocytes attached to nuclear damaged cells, the average change in peak frequency was 1.26 (n = 45). In control cells, the average change in peak frequency was 0.8204 (n = 28). Networked nuclear damaged cells also displayed an increase peak frequency 1.44 (n = 27). Attached cells displayed a significant increase with p = 0.0043, networked cells with p = 0.06 just short of a significant increase. However, the trend of increased peak frequency in nuclear damaged, attached, and networked cells demonstrate that the increased calcium signaling propagates throughout the astrocyte network and is not limited to the nuclear damaged cell (Figure 4D).
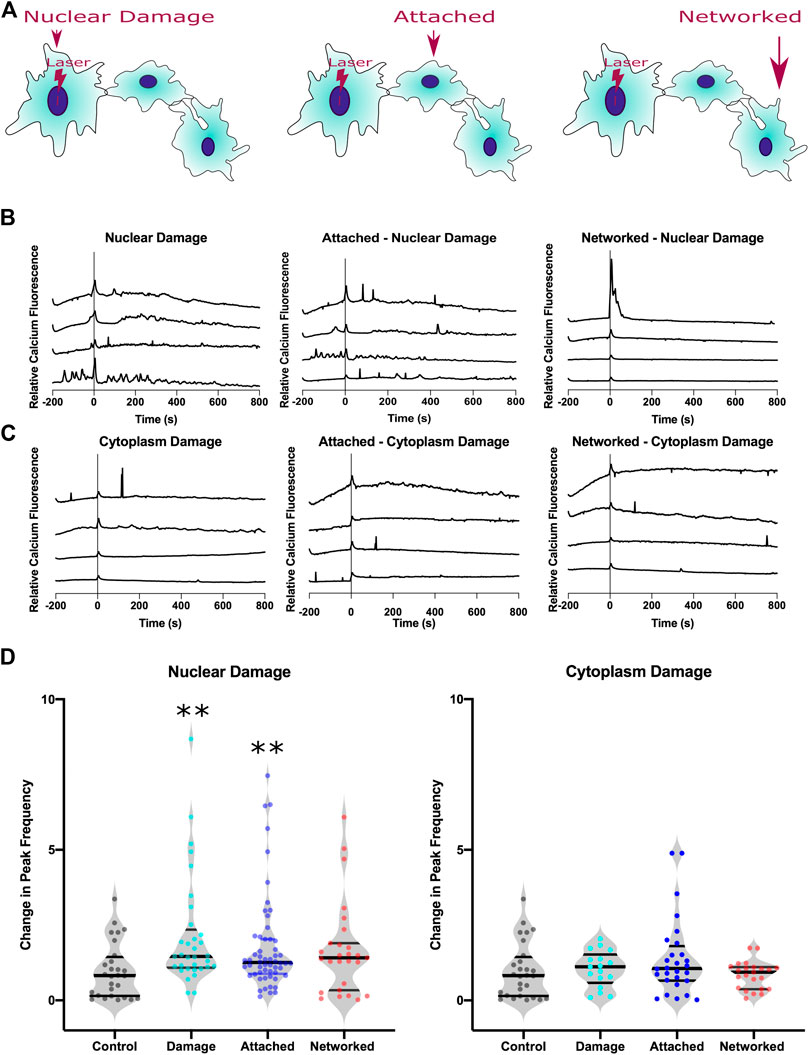
FIGURE 4. Calcium signal transfer through the astrocyte network in response to nuclear damage. (A) Schematic diagram of three categories of cells analyzed within the astrocyte network: nuclear damage, attached, and networked. Attached cells share a physical plasma membrane connection with the nuclear damaged (or cytoplasm) cell. Networked cells are indirectly attached to the nuclear damaged cell, but directly share a membranous connection with attached cells. (B) Representative calcium intensity plots of four cells for each category in response to nuclear damage. (C) Representative calcium intensity plots of four cells for each category in response to cytoplasm damage. (D) Violin plots of changes in peak frequency is plotted where peak frequency for each cell is quantified as a ratio of peak frequency after laser damage divided by peak frequency before laser damage. A significant increase in peak frequency is observed in response to nuclear damage for both the targeted and the attached cells (depicted by asterisk, * defined as p < 0.05). No significant changes were observed in astrocytes in response to cytoplasm damage.
For confirmation that the increased peak frequency observed in the astrocyte network in response to nuclear damage is specific to nuclear damage, we compare the peak frequency of cytoplasm damaged, attached and networked cells. Average values for change in peak frequency were similar to cytoplasm damaged cells at 1.17 (n = 17), with attached-cytoplasm damaged cells at 1.06 (n = 28) and networked-cytoplasm damaged cells 0.94 (n = 23). We observed no significant differences between cytoplasm damaged, attached to cytoplasm damaged, or networked to cytoplasm damage, thus suggesting that nuclear damage and not cytoplasm damage information is passed through the astrocyte network via the frequency of calcium peaks.
Parp-Dependent Calcium Signaling of Nuclear Damage
To understand the signalling mechanism behind the increase in calcium peaks in response to nuclear damage, we examined the role of PARP in this process. Figure 5 compares the calcium response throughout the astrocyte network with and without PARP inhibitor. Treatment with PARP inhibitor (PARPi) decreases peak frequency in nuclear damage and attached cells following laser damage. The change in average peak frequency of nuclear damaged astrocytes treated with PARPi dropped to 0.89 (n = 11) from 1.46 without PARPi (n = 33). Similarly attached astrocytes treated with PARPi had a lower change in peak frequency of 0.53 (n = 22) when compared to 1.25 (n = 56) observed in attached astrocytes not treated with PARPi. These observed decreases in peak frequencies were significant with p = 0.025 for nuclear damaged astrocytes and p = 0.009 for attached astrocytes. PARP dependent changes in peak frequency was observed networked cells, where PARPi treated networked cells displayed an average change in peak frequency of 1.27 (n = 11) vs. 1.41 (n = 27) for untreated networked cells (p = 0.39). The results suggest that nuclear damage and the consequent passage of information to adjacent attached astrocytes via calcium peaks is a PARP-dependent processes.
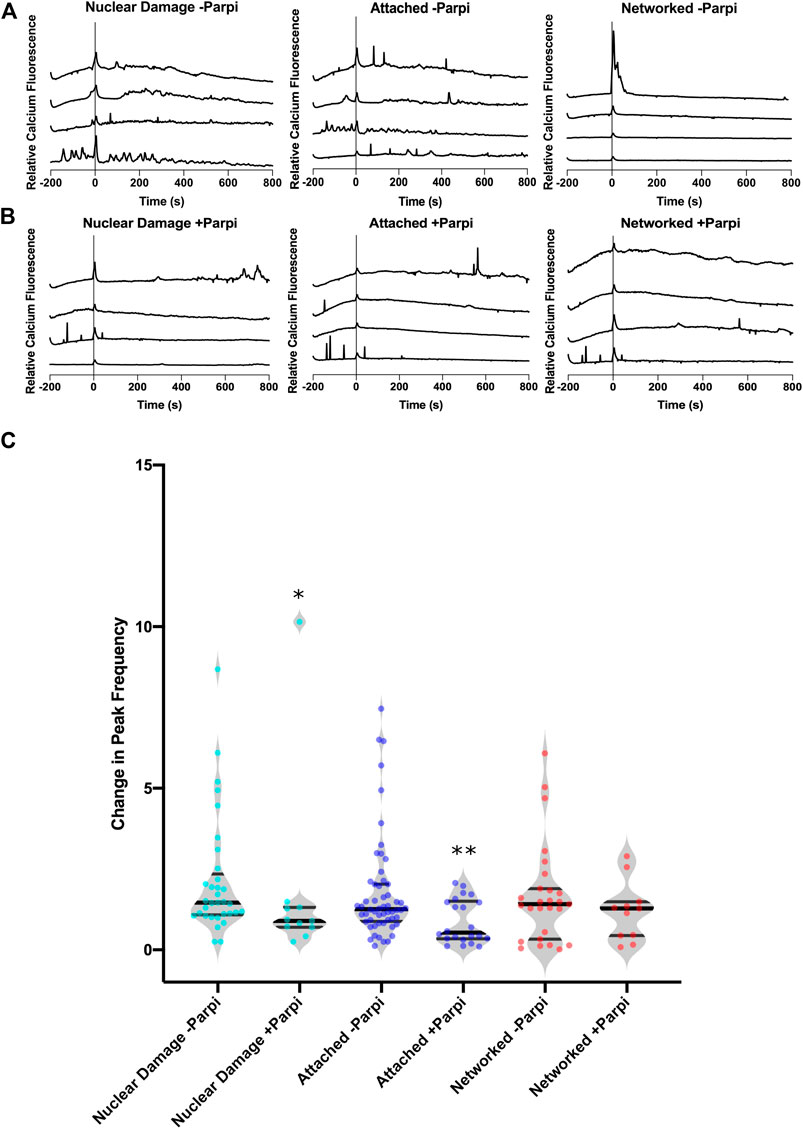
FIGURE 5. Parp control of calcium signaling of nuclear damage through astrocyte network. (A) Calcium signal traces of the astrocyte network with induced nuclear damage without Parp inhibitor showing an increase in calcium peaks following nuclear damage at time 0. (B) Calcium signal traces of the astrocyte network in the presence of Parp inhibitor (+Parpi). (C) A significantly lower change in calcium peak frequency was observed in the presence Parp inhibitor when comparing nuclear damaged cells (p = 0.025). This was not observed in networked cells, where the presence of Parp inhibitor had no effect on the change in peak frequency in response to nuclear damage.
Discussion
We describe the first example of intercellular signaling in response to nuclear damage within astrocyte networks. By pairing laser nanosurgery with in vitro astrocytes expressing a genetically encoded calcium indicator, real-time tracking of calcium dynamins in response to DNA damage is achieved. Previous studies on astrocytes used either ionizing radiation or cytotoxic drugs for DNA damage induction [4–11]. By using laser nanosurgery, temporal control at a millisecond time scale allows observation and comparison of individual cells before and after damage. Previous studies utilizing lasers to stimulate or irradiate astrocytes have not specifically targeted a subcellular region within astrocytes [36–39]. This study provides the first comparison of nuclear damage to cytoplasm damage, and additionally is the first to quantify frequency changes in calcium in response to laser induced astrocyte damage.
Calcium Response to Laser-Induced Subcellular Damage
Astrocytes are known for displaying calcium transients with variable peak frequencies in response to extracellular triggers such as glutamate [14, 16, 17, 19, 40, 41]. In this study we observe an average peak frequency of 26.5 mHz in resting astrocytes, and an increase in average peak frequency to 43 mHz following nuclear damage. This significant increase in calcium peak frequency was specific to nuclear damage and not observed in cytoplasm damaged cells or non-irradiated control cells. The modulation of frequency is a known mechanism of calcium signaling [42]. Future studies can further elucidate how downstream calcium sensitive processes are affected by nuclear (DNA) damage. One potential change is in gene expression or transcription [43] of DNA damage response proteins that could result in minimizing apoptosis and/or the spread of nuclear damage within nervous tissue.
Calcium Signaling Through Astrocyte Network
One of the resulting benefits of specific spatial control of laser damage is the ability to observe both targeted and non-targeted cells in response to laser damage. Previous studies utilizing lasers to stimulate or irradiate astrocytes have not specifically targeted a subcellular region within astrocytes [36–39]. This study provides the first comparison of nuclear damage to cytoplasm damage, and additionally is the first to quantify frequency changes in calcium in response to laser induced astrocyte damage. The intercellular calcium signalling is similar to calcium waves observed during wound healing response [44]. Calcium likely spreads intercellularly through gap junctions, which are likely due to the generation of IP3 and subsequent release of calcium from ER stores [45, 46].
In a previous study, we demonstrated that detection of the death of a single cell propagates through the astrocyte network by means of a large amplitude change in calcium transience immediately following laser-induced photolysis [2]. By precisely controlling laser exposure, we can induce varying levels of cellular damage. We demonstrate two different mechanisms of calcium signaling: 1) amplitude changes in response to cell death and 2) changes in transient calcium peak frequency in response to nuclear damage. Quantification and analysis of calcium signal demonstrates how calcium can be both a universal and complex tool in signaling varying levels of cellular damage.
Damage induced by laser microirradiation is limited to a submicron region, serving as an optimal tool to assess the effect of damage on untargeted cells. Previous studies discuss a bystander effect observed in response to DNA damage induced by ionizing radiation, where unirradiated, neighboring cells respond similarly to targeted cells [47–51]. The use of laser microirradiation in the study of neighboring unirradiated cells would be an improved tool in assessing the potential RIBE in response to complex DNA damage due to the ability to precisely control the position of damage. With calcium as a universal secondary messenger, it differs from the bystander effect by not leading to a deleterious response of surrounding cells, but potentially serving as a warning for neighboring cells of nuclear injury or potentially as a signal to coordinate adjacent cell response to nuclear damage. This is the first example of signal transmission through an astrocyte network potentially for a concerted response to nuclear injury.
Parp Dependent Calcium Signaling of Nuclear Damage
With the known relationship of PARP and calcium to respond to ROS-induced DNA damage [27, 52], we observed a significant drop in peak frequency following nuclear damage to astrocytes in the presence of PARPi. The drop in peak frequency was also observed in cells attached to nuclear damaged astrocytes, which demonstrates PARP’s functional role in signalling nuclear damage in both the targeted cell and in the propagation of this change to surrounding attached cells.
The results presented here provide the first visualization of PARP-dependent calcium dynamics in response to DNA damage, as well as the propagation of signal to adjacent astrocytes. Propagation of signal was not observed in response to cytoplasm damaged astrocytes, potentially due to Parp1 only being activated in nuclear damaged cells. Future studies will focus on the mechanism that allows for calcium propagation through the astrocyte network, and extend the use of pharmacological blockers to inhibit intercellular propagation in response to nuclear damage. We provide evidence of astrocytes’ ability to modify the frequency of calcium dynamics as a detection mechanism of nuclear damage that can quickly spread to adjacent cells within the astrocyte network.
Data Availability Statement
The datasets presented in this study can be found in online repositories. The names of the repository/repositories and accession number(s) can be found below: 10.6084/m9.figshare.12857669.
Ethics Statement
The animal study was reviewed and approved by University of California, Irvine Institutional Animal Care and Use Committee.
Author Contributions
NW designed experiments for this study and wrote the manuscript. NW, RH, EK executed experiments and data analysis. MB, KY, and XK provided critical feedback and direction for the project.
Funding
The work in the Yokomori laboratory is supported in part by NSF MCB-2013798.
Conflict of Interest
The authors declare that the research was conducted in the absence of any commercial or financial relationships that could be construed as a potential conflict of interest.
Acknowledgments
We would like to express our gratitude to Michael Cahalan for providing the Salsa6f mice and Leslie Thompson and Alice Lau for preparing the astrocyte cultures. We would like to thanks William Wright for maintenance of the laser and microscope setup.
Supplementary Material
The Supplementary Material for this article can be found online at: https://www.frontiersin.org/articles/10.3389/fphy.2021.598930/full#supplementary-material.
References
1. Burda JE, Bernstein AM, Sofroniew MV. Astrocyte roles in traumatic brain injury. Exp Neurol (2016) 275(3):305–15. doi:10.1016/j.expneurol.2015.03.020
2. Wakida NM, Gomez-Godinez V, Li H, Nguyen J, Kim EK, Dynes JL, et al. Calcium dynamics in astrocytes during cell injury. Front Bioeng Biotechnol (2020) 8:912. doi:10.3389/FBIOE.2020.00912
3. Wakida NM, Cruz GMS, Ro CC, Moncada EG, Khatibzadeh N, Flanagan LA, et al. Phagocytic response of astrocytes to damaged neighboring cells. PLoS One (2018) 13(4):12. doi:10.1371/journal.pone.0196153
4. Swain U, Subba Rao K. Study of DNA damage via the comet assay and base excision repair activities in rat brain neurons and astrocytes during aging. Mech Ageing Dev (2011) 132(8–9):374–81. doi:10.1016/j.mad.2011.04.012
5. Swarnkar S, Singh S, Goswami P, Mathur R, Patro IK, Nath C. Astrocyte activation: a key step in rotenone induced cytotoxicity and DNA damage. Neurochem Res (2012) 37(10):2178–89. doi:10.1007/s11064-012-0841-y
6. Galvano F, Campisi A, Russo A, Galvano G, Palumbo M, Renis M, et al. DNA damage in astrocytes exposed to fumonisin B1. Neurochem Res (2002) 27(4):345–51. doi:10.1023/A:1014971515377
7. Gupta S, Goswami P, Biswas J, Joshi N, Sharma S, Nath C, et al. 6-Hydroxydopamine and lipopolysaccharides induced DNA damage in astrocytes: involvement of nitric oxide and mitochondria. Mutat Res - Genet Toxicol Environ Mutagen (2015) 778:22–36. doi:10.1016/j.mrgentox.2014.12.007
8. Gürbay A, Gonthier B, Signorini-Allibe N, Barret L, Favier A, Hincal F. Ciprofloxacin-induced DNA damage in primary culture of rat astrocytes and protection by vitamin e. Neurotoxicology (2006) 27(1):6–10. doi:10.1016/j.neuro.2005.05.007
9. Waller R, Murphy M, Garwood CJ, Jennings L, Heath PR, Chambers A, et al. Metallothionein-I/II expression associates with the astrocyte DNA damage response and not Alzheimer-type pathology in the aging brain. Glia (2018) 66(11):2316–23. doi:10.1002/glia.23465
10. Simpson JE, Ince PG, Haynes LJ, Theaker R, Gelsthorpe C, Baxter L, et al. Population variation in oxidative stress and astrocyte DNA damage in relation to Alzheimer-type pathology in the ageing brain. Neuropathol Appl Neurobiol (2010) 36(1):25–40. doi:10.1111/j.1365-2990.2009.01030.x
11. Campisi A, Gulino M, Acquaviva R, Bellia P, Raciti G, Grasso R, et al. Reactive oxygen species levels and DNA fragmentation on astrocytes in primary culture after acute exposure to low intensity microwave electromagnetic field. Neurosci Lett (2010) 473(1):52–5. doi:10.1016/j.neulet.2010.02.018
12. Schneider L, Fumagalli M, d'Adda di Fagagna F. Terminally differentiated astrocytes lack DNA damage response signaling and are radioresistant but retain DNA repair proficiency. Cell Death Differ (2012) 19(4):582–91. doi:10.1038/cdd.2011.129
13. Mladenov E, Li F, Zhang L, Klammer H, Iliakis G. Intercellular communication of DNA damage and oxidative status underpin bystander effects. Int J Radiat Biol (2018) 94(8):719–26. doi:10.1080/09553002.2018.1434323
14. Cornell-Bell AH, Finkbeiner SM, Cooper MS, Smith SJ. Glutamate induces calcium waves in cultured astrocytes: long-range glial signaling. Sci (1990) 247(4941):470–73. doi:10.1126/science.1967852
15. Charles AC, Merrill JE, Dirksen ER, Sandersont MJ. Intercellular signaling in glial cells: calcium waves and oscillations in response to mechanical stimulation and glutamate. Neuron (1991) 6(6):983–92. doi:10.1016/0896-6273(91)90238-U
16. Semyanov A, Henneberger C, Agarwal A. Making sense of astrocytic calcium signals—from acquisition to interpretation. Nat Rev Neurosci (2020) 21(10):551–64. doi:10.1038/s41583-020-0361-8
18. Finkbeiner S. Calcium waves in astrocytes-filling in the gaps. Neuron (1992) 8(6):1101–08. doi:10.1016/0896-6273(92)90131-V
19. Wu YW, Tang X, Arizono M, Bannai H, Shih PY, Dembitskaya Y, et al. Spatiotemporal calcium dynamics in single astrocytes and its modulation by neuronal activity. Cell Calcium (2014) 55(2):119–29. doi:10.1016/j.ceca.2013.12.006
20. Scemes E, Giaume C. Astrocyte calcium waves: what they are and what they do. Glia (2006) 54(203):716–25. doi:10.1002/glia.20374
21. Dupont G, Abou-Lovergne A, Combettes L. Stochastic aspects of oscillatory Ca2+ dynamics in hepatocytes. Biophys J (2008) 95(5):2193–202. doi:10.1529/biophysj.108.133777
22. Smedler E, Uhlén P. Frequency decoding of calcium oscillations. Biochim Biophys Acta - Gen Subj (2014) 1840(3):964–9. doi:10.1016/j.bbagen.2013.11.015
23. Song S, Li J, Zhu L, Cai L, Xu Q, Ling C, et al. Irregular Ca2+ oscillations regulate transcription via cumulative spike duration and spike amplitude. J Biol Chem (2012) 287(48):40246–55. doi:10.1074/jbc.M112.417154
24. Tsien RY, Pozzan T, Rink TJ. Calcium homeostasis in intact lymphocytes: cytoplasmic free calcium monitored with a new, intracellularly trapped fluorescent indicator. J Cel Biol (1982) 94(2):325–34. doi:10.1083/jcb.94.2.325
25. Grynkiewicz G, Poenie M, Tsien RY. A new generation of Ca2+ indicators with greatly improved fluorescence properties. J Biol Chem (1985) 260(6):3440–50. doi:10.1016/s0021-9258(19)83641-4
26. Dong TX, Othy S, Jairaman A, Skupsky J, Zavala A, Parker I, et al. T-cell calcium dynamics visualized in a ratiometric tdTomato-GCaMP6f transgenic reporter mouse. Elife (2017) 6. doi:10.7554/eLife.32417
27. Bentle MS, Reinicke KE, Bey EA, Spitz DR, Boothman DA. Calcium-dependent modulation of poly(ADP-ribose) polymerase-1 alters cellular metabolism and DNA repair. J Biol Chem (2006) 281:33684. doi:10.1074/jbc.M603678200
28. Müller KH, Hayward R, Rajan R, Whitehead M, Cobb AM, Ahmad S. Poly(ADP-ribose) links the DNA damage response and biomineralization. Cel Rep (2019) 27:3124–38. doi:10.1016/j.celrep.2019.05.038
29. Chen TW, Wardill TJ, Sun Y, Pulver SR, Renninger SL, Baohan A, et al. Ultrasensitive fluorescent proteins for imaging neuronal activity. Nature (2013) 499(7458):295–300. doi:10.1038/nature12354
30. Wakida NM, Cruz GMS, Pouladian P, Berns MW, Preece D. Fluid shear stress enhances the phagocytic response of astrocytes. Front Bioeng Biotechnol (2020) 8:1290. doi:10.3389/fbioe.2020.596577
31. Schneider CA, Rasband WS, Eliceiri KW. NIH Image to ImageJ: 25 years of image analysis. Nat Methods (2012) 9(7):671–5. doi:10.1038/nmeth.2089
32. Moein M, Grzyb K, Martins TG, Komoto S, Peri F, Crawford AD, et al. CaSiAn: a calcium signaling analyzer tool. Bioinformatics (2018) 34(17):3052–4. doi:10.1093/bioinformatics/bty281
33. Kim JS, Krasieva TB, LaMorte V, Taylor AMR, Yokomori K, Yokomori K. Specific recruitment of human cohesin to laser-induced DNA damage. J Biol Chem (2002) 277(47):45149–53. doi:10.1074/jbc.M209123200
34. Lan L, Nakajima S, Oohata Y, Takao M, Okano S, Masutani M, et al. In situ analysis of repair processes for oxidative DNA damage in mammalian cells. Proc Natl Acad Sci U S A (2004) 101(38):13738–43. doi:10.1073/pnas.0406048101
35. Saquilabon Cruz GM, Kong X, Silva BA, Khatibzadeh N, Thai R, Berns MW, et al. Femtosecond near-infrared laser microirradiation reveals a crucial role for PARP signaling on factor assemblies at DNA damage sites. Nucleic Acids Res (2015) 44(3):e27. doi:10.1093/nar/gkv976
36. Raos BJ, Graham ES, Unsworth CP. Nanosecond UV lasers stimulate transient Ca2+elevations in human hNT astrocytes. J Neural Eng (2017) 14(3):035001. doi:10.1088/1741-2552/aa5f27
37. Zhao Y, Zhang Y, Liu X, Lv X, Zhou W, Luo Q, et al. Photostimulation of astrocytes with femtosecond laser pulses. Opt Express (2009) 17(3):1291. doi:10.1364/oe.17.001291
38. Borrachero-Conejo AI, Adams WR, Saracino E, Mola MG, Wang M, Posati T, et al. Stimulation of water and calcium dynamics in astrocytes with pulsed infrared light. FASEB J (2020) 34(5):6539–53. doi:10.1096/fj.201903049R
39. Choi M, Yoon J, Ku T, Choi K, Choi C. Label-free optical activation of astrocyte in vivo. J Biomed Opt (2011) 16(7):075003. doi:10.1117/1.3600774
40. De Pittà M, Berry H. A neuron-glial perspective for computational neuroscience. In: : M De Pittà, H Berry, editors Computational glioscience. springer series in computational neuroscience,Cham, Switzerland: Springer International Publishing AG (2019) p. 3–35. doi:10.1007/978-3-030-00817-8_1
41. Timofeeva Y Intracellular calcium dynamics: biophysical and simplified models. In: M De Pittà, H Berry, editors Computational glioscience. springer series in computational neuroscience,Cham, Switzerland: Springer International Publishing AG (2019) p. 69–90. doi:10.1007/978-3-030-00817-8_3
42. Berridge MJ, Lipp P, Bootman MD. The versatility and universality of calcium signalling. Nat Rev Mol Cel Biol (2000) 1(1):11–21. doi:10.1038/35036035
43. Li WH, Llopis J, Whitney M, Zlokarnik G, Tsien RY. Cell-permeant caged InsP3 ester shows that Ca2+ spike frequency can optimize gene expression. Nature (1998) 392(6679):936–941. doi:10.1038/31965
44. Handly LN, Wollman R. Wound-induced Ca2+ wave propagates through a simple release and diffusion mechanism. Mol Biol Cel (2017) 28(11):1457–66. doi:10.1091/mbc.E16-10-0695
45. Berridge MJ. Inositol trisphosphate and calcium signalling. Curr Opin Cell Biol (1993) 361(6410):315–25. doi:10.1038/361315a0
46. Venance L, Stella N, Glowinski J, Giaume C. Mechanism involved in initiation and propagation of receptor-induced intercellular calcium signaling in cultured rat astrocytes. J Neurosci (1997) 17(6):1981–92. doi:10.1523/jneurosci.17-06-01981.1997
47. Nagasawa H, Little JB. Induction of sister chromatid exchanges by extremely low doses of alpha-particles. Cancer Res (1992) 52(22):6394.
48. Morgan WF, Sowa MB. Non-targeted bystander effects induced by ionizing radiation. Mutat Res - Fundam Mol Mech Mutagen (2007) 616(1-2):159–64. doi:10.1016/j.mrfmmm.2006.11.009
49. Subhashree M, Venkateswarlu R, Karthik K, Shangamithra V, Venkatachalam P. DNA damage and the bystander response in tumor and normal cells exposed to x-rays. Mutat Res Genet Toxicol Environ Mutagen (2017) 821:20–7. doi:10.1016/j.mrgentox.2017.06.007
50. Ariyoshi K, Miura T, Kasai K, Fujishima Y, Nakata A, Yoshida M. Radiation-induced bystander effect is mediated by mitochondrial DNA in exosome-like vesicles. Sci Rep (2019) 9(1):114. doi:10.1038/s41598-019-45669-z
51. Wright EG, Coates PJ. Untargeted effects of ionizing radiation: implications for radiation pathology. Mutat Res Fundam Mol Mech Mutagen (2006) 597(1–2):119–132. doi:10.1016/j.mrfmmm.2005.03.035
Keywords: astrocyte, DNA damage, nuclear damage, calcium, laser nanosurgery, laser irradiation, poly ADP ribose polymerase
Citation: Wakida NM, Ha RD, Kim EK, Kong X, Yokomori K and Berns MW (2021) Laser-Induced Nuclear Damage Signaling and Communication in Astrocyte Networks Through Parp-Dependent Calcium Oscillations. Front. Phys. 9:598930. doi: 10.3389/fphy.2021.598930
Received: 14 September 2020; Accepted: 20 January 2021;
Published: 27 April 2021.
Edited by:
Yong Zhang, University of North Carolina at Charlotte, United StatesReviewed by:
Takuya Sasaki, The University of Tokyo, JapanAlfonso Blázquez-Castro, Autonomous University of Madrid, Spain
Copyright © 2021 Wakida, Ha, Kim, Kong, Yokomori and Berns. This is an open-access article distributed under the terms of the Creative Commons Attribution License (CC BY). The use, distribution or reproduction in other forums is permitted, provided the original author(s) and the copyright owner(s) are credited and that the original publication in this journal is cited, in accordance with accepted academic practice. No use, distribution or reproduction is permitted which does not comply with these terms.
*Correspondence: Nicole M. Wakida, bndha2lkYUB1Y2kuZWR1