 Jorge Delgado
 Claudia Ferreiro-Córdova
 Alejandro Gil-Villegas
- 1División de Ciencias e Ingenierías, Universidad de Guanajuato, León, Mexico
- 2Tecnologico de Monterrey, Escuela de Ingeniería y Ciencias, Querétaro, Mexico
The natural variation of temperature at ambient conditions produces spontaneous patterns on the surface of chocolate, which result from fat bloom. These metastable patterns are peculiar because of their shape and cannot be obtained by controlled temperature conditions. The formation of these spontaneous grains on the surface of chocolate is studied on experimental and theoretical grounds.Three different kinds of experiments were conducted: observation of formed patterns in time, atomic force microscopy of the initial events on the grain formation and rheology of the melted chocolate. The patterns observed in our experiments follow the trends described by the Avrami model, which considers a constant value at all spatial scales of the rate of linear growth α that governs the formation of isolated grains, starting from molecular clusters. Through NVT-ensemble computer simulations, using a Mie-segmented coarse-grained model of triacylglycerides molecules, we studied the process of nucleation that starts the pattern growth. From simulation and experiment results it is possible to derive a realistic value of α.
1. Introduction
The study of chocolate is interesting for many reasons. Despite its evident importance in the food industry, this complex mixture is also a good example of some scientific curiosities [1]. For sure, some of these curiosities were found because of its technological importance and this is the case of our research: if a chocolate bar on a lab table had not become aged by chance, the observation of beautiful patterns on its surface had not inspired this ongoing study. Most of us have seen the appearance of patterns on a chocolate bar when left unperturbed for a long enough period of time, allowing it to age, some examples of such patterns are shown in Figure 1. It is easy to see that the contours formed call for the use of fractals to explain them, but shape generalities might not be easy to describe in scientific terms. On a close inspection of patterns in Figure 1, in the same sample, one finds a variety of shapes as different as “mostly circular,” “snowflake-like,” “almost circular,” and “hexagonal-like”.
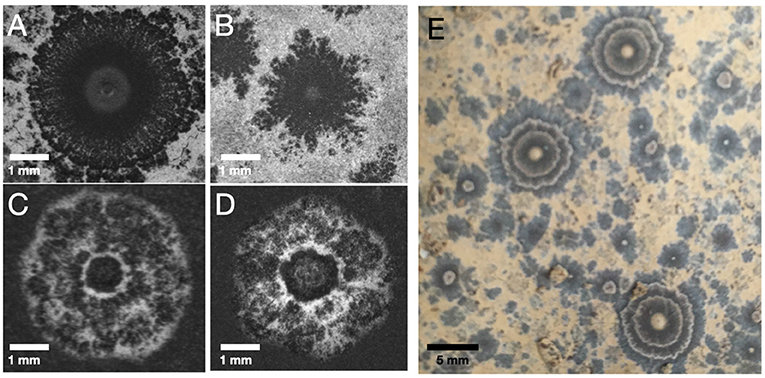
Figure 1. (A–E) Spontaneous patterns on chocolate surfaces obtained at ambient temperature after several days.
The formation of chocolate phases and their properties can be revised extensively in the literature [2]. Figure 2 summarizes the phases observed as function of temperature [3, 4]. In the temperature range of 50–60°, all the history of the sample can be erased. The volume change in the cooling-heating processes presents an important hysteresis. On one side, under cooling it is understood that the polymorphic forms β(V) and β(VI) form low temperature phases without a clear formation of the phases α and β′. In contrast, under heating, volume changes are noticeable when different phases are formed. As depicted in Figure 2, previous works suggest that volume changes are not monotonous [4]. Phase change temperatures are approximate and, in general, temperatures reported differ by several degrees. Moreover, glass transition temperatures are also reported in the same ranges as the ones for phase change temperatures [5]. As a consequence, it is easy to suggest metastable lines that practically span all over the volume temperature diagram due to the proximity between the phase change temperatures [6, 7].
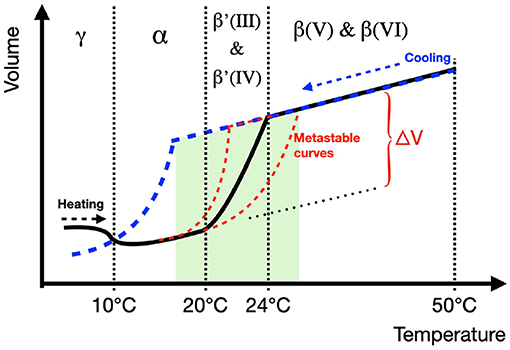
Figure 2. Illustrative diagram of the volume change for the different phases observed under heating (black continuous line) and cooling (blue segmented line) ramps for cocoa butter. The phases more commonly described and named in the literature are annotated at the top of the different sections separated by vertical segmented lines. The intervals marked for each phase are approximated. The green region marks a common range of dispersion data associated to different phase transition and glass transition temperature values reported in literature. Metastable curves and melt expansion volume are suggested accordingly.
The story is a little different for the formation of patterns on the surface of chocolate, the phenomenon is not clearly understood, and few studies analyze the shape of these patterns [8]. In addition, from the collection of patterns previously reported, it is difficult to draw conclusions about the shapes formed, or about the reasons that gave rise to them. However, it is a consensus to consider the onset of the whitish color on the chocolate surface a consequence of the “fat bloom” event: the physical separation between β(V) and β(VI) phases during the aging process of chocolate. In the literature, one can find some “recipes” to produce “fat bloom,” most of them involve the use of temperature cycles [3, 9]. However, in our initial attempts to create such patterns, we had difficulties obtaining them using periodic cycles or constant temperatures as it happens in literature [10]. As a consequence, the patterns observed in Figure 1 were produced using a different procedure to what is usually reported in the literature.
In this paper, we reproduce the common patterns observed during the aging of chocolate at ambient conditions and give a glimpse on the reasons for obtaining them, based on a theoretical description given by the Avrami model for aggregation [11, 12]. For our study we use both experiments and simulations. Definitively, the complex mixture of at least triglycerides, polyphenols, and carbohydrates of high molecular weight, called “chocolate,” represents a challenge for experimental reproducibility [3, 13]. Despite being difficult to conduct an experiment expecting the same pattern twice, it is possible to reproduce some trends of events necessary to obtain patterns that share some common characteristics. Here, it is crucial to identify, as is going to be discussed, that different events play a role in the final shape observed.
2. Experimental and Theoretical Methods
2.1. Sample Preparation
Two types of commercial chocolate were used in this work: a commercial 100% cacao product from the brand Mayordomo without added sugar or soy lecithin (https://chocolatemayordomo.com.mx) and a chocolate from the brand New Art Xocolatl with 85% cacao (www.newartxocolatl.com). The latter has added sugar and soy lechitin. These two extra components are usually the main difference between pure cacao and the mixture called “chocolate.” In these mixtures, soy lechitin allows emulsification of the product with water and milk while sugar provides sweetness, which is completely absent in pure cacao. Despite the differences in composition between the two chocolates used, the experimental results were similar when changing the type of chocolate used.
Three different kinds of experiments were conducted: observation of formed patterns in time on chocolate surfaces at different temperatures, atomic force microscopy of the initial events on the pattern formation and rheology of melted chocolate. Patterns on chocolate surfaces were obtained by heating up samples of chocolate up to 60°C and pouring the viscous liquid in pre-heated petri dishes, which were then subjected to different temperature conditions. Time and temperature were recorded during pattern formation. The images analyzed in this paper were captured from these petri dishes during the evolution of the patterns. The topography Atomic Force Microscopy (AFM) images were also obtained from the petri dishes samples using a Witec alpha-300 microscope in a tapping mode (100 × 100μm and 150 × 150 lines). Rheology was performed in a HR-3 Discovery Hybrid Rheometer (TA Instruments) using a cone-plate geometry of 40 mm diameter and 0.5°. The temperature was controlled in the rheometer using a Peltier plate.
2.2. Computer Simulations
We have developed a two-dimensional (2D) model for the experimental system which allow us to have a glance at the self assembly of the β(V) molecules. Our system consist of rigid bodies, each made with spheres of diameter σ, that have a shape close to one of a β(V) molecule [14–16] (see Figure 3). We have chosen a Mie-type potential to model the short-range attractive behavior between fat molecules. Lennard-Jones interaction potentials have been previously used to model units of fat crystals and its assembly into bigger systems [17]. Here, we chose to impose a shorter attractive range as a first attempt to model the fat crystal formation. In our model, the spherical units in each molecule interact only with the spheres of neighboring molecules via the pair potential,
Where r is the center-of-mass distance between two spheres, ij indicates interaction between the spherical units i and j in two different molecules, σ is the approximated diameter of the repulsive core and ϵ is the strength of the interaction in kBT units. The exponents m and n in Equation (1) define the range of the attractions, and are set to m = 36 and n = 24. The constant C = m(m/n)n/(m−n)/(m−n) ensures that the minimum of the potential is at ϵ = 1. The range of the interaction between molecules is set with the cut-off parameter rcut = 1.9σ. The shift value U0 is chosen accordingly such that Uij(rcut) = 0. For simplicity, we have set ϵ = 1, σ = 1 and the unit time . Our simulation model does not considers the explicit presence of other compounds of the cocoa fat, i.e., these molecules are described as a continuous solvent, like a primitive model of the system, an approach that has been used in computer simulations of asphaltenes [18]. The properties of this effective solvent can be introduced by a dielectric constant, that can be incorporated within the strength of the interaction or the reduced temperature used in the simulation.
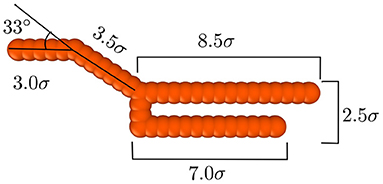
Figure 3. Illustration of the particles used to model β(V) molecules. Each particle is composed of 43 fused spheres of diameter σ that form a chair-shaped molecule. The length of each segment of the molecule is shown in the diagram.
All simulations have been performed with the open-source MD simulation package LAMMPS [19], which has a dynamical integrator for rigid bodies [20, 21]. In our 2D simulations, the spherical units that form our molecules are restricted to a plane and keep the same initial z position. Each molecule segment of length 1σ is composed of two spheres, with a total of Np = 43 spheres per molecule and NM = 1, 020 molecules in our 2D simulation box. To explore the assembly of our molecules, we use the packing fractions ϕ = 0.22, ϕ = 0.36, and ϕ = 0.48. For each case, we start with a 2D box with an initial isotropic configuration, which was created with purely repulsive molecules (rcut = σ). The interaction between the molecules is turned on in a constant number, volume, and temperature (NVT) ensemble using a Nose-Hoover thermostat [22]. We have set the temperature of the systems to kBT/ϵ = 1. The simulation time step was taken as δt = 0.005τsim and the total simulation times used were of to .
3. Results
3.1. Pattern Formation
Figure 4 shows several attempts to obtain the patterns observed in Figure 1 with different cycles of temperature, as explained in the figure caption. As it can be observed, the patterns formed by controlled cycles, or just by maintaining a constant temperature, do form different types of patterns, but they are qualitatively different from those in Figure 1. Examples of these differences can be seen also in literature [3, 10]. Perhaps the main phenomenological differences between patterns in both figures are the occurrence of clear circular centers and more symmetric shapes, see the two patterns presented in Figure 1. What we observe in Figure 1 is the most commonly observed phenomenology and it can only be produced when temperature fluctuates in the range between 20 and 30°C, as observed in the sequence of pictures presented in Figure 5 with the corresponding registry of temperature. These fluctuations are, apparently, necessary to obtain the characteristic morphology of these patterns. The initial steps to obtain this morphology are shown in Figure 5. At the very beginning, a circular center acts as a germ nucleus for a new phase, and in this way the polymorphic forms evolve from β′ to β, as reported in the literature [4]. Some of the pictures suggest correctly that the center is a dome with an associated change in volume. In Fact, during all the formation of patterns, volume changes modify and produce patterns with uneven surfaces. The blooming is dusty, making difficult a measure with AFM, but interestingly, the beginning of the pattern can be measured with this technique as observed in Figure 6. Here, we show the first steps of the pattern formation, where we see a clear circle of a different phase rising up from the surface.
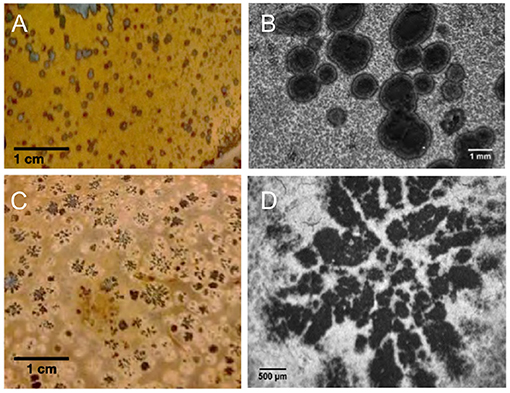
Figure 4. Patterns on chocolate surfaces produced with a cycle or a constant temperature value. (A,B) Patterns obtained with a temperature cycle from 17 to 35°C in 12 h during 4 days. (C,D) Patterns obtained using a constant temperature of 26°C for three days. In both cases, the samples are cooled down from 60°C and poured on petri dishes thermalized at the minimum temperature tested.
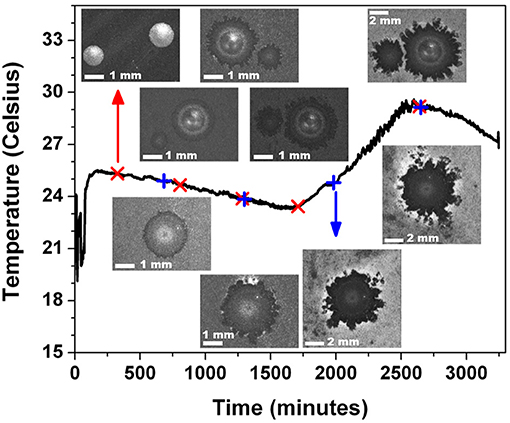
Figure 5. Ambient temperature fluctuation in time and spontaneous patterns obtained in these conditions on a chocolate surface. Upper patterns correspond with red crosses and lower patterns with blue plus signs on the temperature curve. Patterns on the left, before 2,000 min, are 5.15 mm width and the last three patterns on the right are 10.55 mm width.
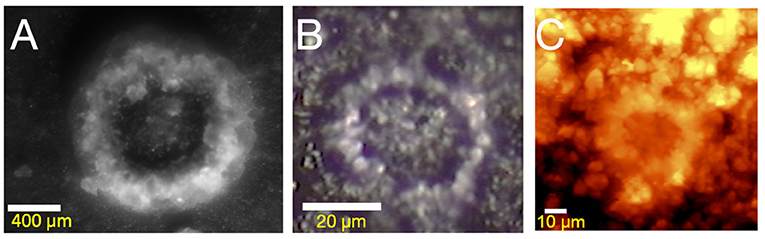
Figure 6. (A,B) Beginning of the pattern formation at different spatial scales. (C) Topographic image of the pattern observed in (B) by AFM microscopy. Brighter zones correspond with upper regions in space.
Using rheology, it is possible to correlate volume changes and reproducibility of the melting process. Figure 7 shows shear apparent viscosity and the first normal stress coefficient of a sample under temperature cycles. For the two chocolate types, the viscosities rise up under cooling clearly because of the formation of the melting phase. The first time that the sample was cooled, the viscosity of the samples raised up at a temperature around 18°C, but the temperature at which the maximum occurs is not the same. Remarkably, because of the pre-history of the samples, this difference exacerbates under heating. Moreover, between two different experiments with the same cooling or heating history, it was impossible to obtain reproducible temperatures where the same viscosity rose up. Interestingly, the temperatures around which we observe the rise of both viscosities (18 and 25°C) have been described as glass-transition temperatures, which is possibly related to traces of unstable polymorphic forms of monounsaturated triacylglycerides [5]. It is important to point out that, in our case, the fact that the first normal stress coefficient, related with the change in volume, could rise up in different moments even for the same conching history, might be one of the reasons for the wide range of pattern shapes observed on the chocolate surfaces.
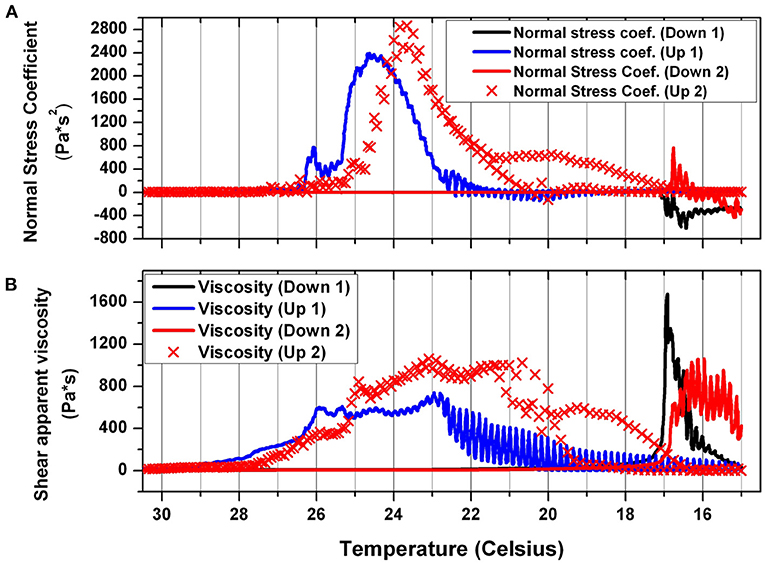
Figure 7. First Normal Stress Coefficient (A) and Shear Apparent Viscosity (B) for chocolate in a temperature cycle using a rate of 0.25°C/min. The sample was first conditioned 5 min at 60°C prior to the beginning of the experiment. Then, the sample was cooled down from 40°C to 15°C (“Down” in the legend) and immediately heated up again until 40°C (“Up” in the legend). The experiment was performed twice with two different samples (“1” and “2” in the legend).
3.2. Simulation Results
An effective packing fraction for a model of pure cocoa butter can be obtained using the unit cell length values in crystalline polymorphic forms of triglycerides and the elongated shape of the molecules. With this, we calculated a packing fraction close to ϕ = 0.30. Thus, we used this value as a reference for our simulation systems and selected the range of packing fraction values 0.22 ≤ ϕ ≤ 0.36. Figure 8 shows snapshots of the typical configurations obtained for the concentrations explored. The colors indicate clusters of molecules with the same local orientation. The clusters were obtained using the criterion for nematic droplets made of hard spherocylinders developed by Cuetos and Dijkstra [23], which uses the local order parameter of each particle. This parameter is obtained for each particle i by setting a surface-to-surface cutoff distance of ρij = 0.5σ to all the j particles in this range. The local orientation order parameter S(i) of each i particle is calculated using all the j particles that follow the restriction imposed by ρij. Two particles, i and j, belong to the same cluster if they obey three conditions: S(i) > 0.4 and S(j) > 0.4, their surface-to-surface distance is ρij < 0.5σ, and the product of their main axis orientation vectors is ∣ui · uj∣> 0.85. The separation restriction ρij < 0.5σ accounts for the fact that the potential imposes a short range attraction between particles; particles in a fat crystal will be at short surface-to-surface separations. With this procedure we identify all the clusters in our simulation box, and assign the same color to all the particles in each cluster.
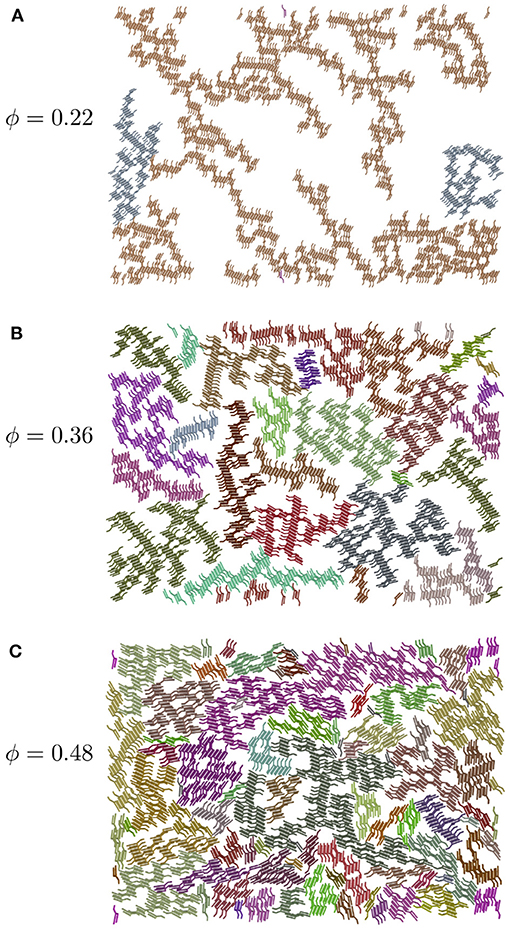
Figure 8. Snapshots of typical final configurations of simulation boxes at packing fractions (A) ϕ = 0.22, (B) ϕ = 0.36, and (C) ϕ = 0.48. Colors indicate different clusters, the preferred orientation of the molecules changes between clusters.
In this work, the analysis of the systems is purely qualitatively, and focuses only on the cluster sizes and connectivity, but relevant information can be extracted from it. In Figure 8A, only two different clusters are found, but when the concentration is increased, the connectivity of the molecules is reduced and several small clusters appear (see Figure 8C). In fact, we have measured the average size of clusters for a bigger simulation box (8,500 particles) in a wider packing fraction range (0.12 ≤ ϕ ≤ 0.48), and found that the clusters have an average size of around 480σ up to concentrations close to ϕ ≈ 0.20. Above this concentration, the average size decreases to about 85σ at ϕ = 0.48. These sizes were calculated by averaging the length of several clusters in more than one direction and can be interpreted as average diameters. Thus, clusters become smaller as the concentration increases. The size of the clusters is relevant because our systems are consistent with the process of aggregation described by the Avrami model, characterized by two stages: a microscopic nucleation of molecules in order to form active germ nuclei, which consequently aggregate to induce growth grains. The simulations give insights into the first stage, where the clustering of particles give rise to the germ nuclei, corresponding to the aggregation nuclei that will induce the formation of grains in chocolate samples. The size of these clusters might also have an effect on the final shape of the patterns formed on chocolate surfaces.
3.3. Pattern Growth
The nucleation process observed in experiments and simulations can be theoretically described using the Avrami model [11, 12], which is based on a statistical description of the formation of grains starting from initial or germ nuclei. The basic assumption behind this model is that the factors that govern the tendency of the growth nuclei are similar to those which govern further growth, i.e., what Avrami described as an isokinetic process. If p(t) describes the probability of formation of growth nuclei per germ nucleus per unit time at temperature T, then
where Q is the energy of activation per gram molecule, A is the work per gram molecule required for a germ nucleus to become a growth nucleus, R is the gas constant and K is a normalization constant. The probability p(t) is used to introduce a characteristic time τ of the growth process, defined as
In a similar way, the size or linear dimension of the grain, denoted by r(t), is given in terms of a rate of growth, G(t), according to the expression
Both equations imply that
where is the speed of linear growth in the characteristic time. By integrating we obtain
In the isokinetical regime, it is assumed that the speed of linear growth is a constant over concentrations and temperatures, denoted by α, i.e., G(t) = αp(t). Consequently,
The volume V and surface area S of a grain are then given as,
and
Where σ3D = 4π/3 and σ2D = π are 3D and 2D shape factors, respectively.
These expressions correspond to isolated growth nuclei. By considering two associating mechanisms for the growth of a grain, via the nucleation around a germ nucleus or the nucleation around an already growth nucleus, and using the expressions obtained for the V and S, as initial values for the grain sizes, Avrami [11] derives rate equations for the number density of nuclei germs N(t) and for the total extended volume of the grain. By coupling these equations and solving them in the general case of a random distribution of initial germ nuclei, a general equation for the actual value of V(t) is obtained, known in the literature as the Avrami equation, given by
Where b is a coefficient that depends on G(t) and p(t) and d is the Avrami exponent. Both quantities depend also on the geometric dimension of the grain. Typical theoretical values obtained for d vary within the range 1 ≤ d ≤ 4, depending on the value of the probability of formation of growth nuclei p(t), which is set by the energy of activation Q and the work required to form a growth grain A [12]. In the case of quasi two-dimensional, plate-like, grains, d ≈ 3 if p(t) is small (i.e., a high total energy E = Q + A per mole required for a germ nucleus to become a growth one) whereas for high values of p(t) (i.e., small values of E), d ≈ 2. Linear-like grains will have 1 ≤ d ≤ 2, although it is important to bear in mind that the key factor that determines d is a complex one since not only depends on E but on G. For fluctuations in temperature, we could expect that Q becomes a determinant factor in the way that the grain growth formation is induced.
The growing area S(t) of the two pattern series observed in Figure 5 was analyzed using the Avrami equation for the corresponding 2D case, written as
where S0 is the saturation area. This 2D version of Avrami model has been used previously to study crystallization by clustering of disk nuclei, using computer simulation [24]. For each time step, the pattern was drawn on a mask and the corresponding area, in pixels, was plotted vs. time. Results of the pattern growth for the two series, observed in the, show a remarkable similarity. For this image analysis, the fitting of the data to the Avrami equation gives an exponent d ≈ 1. Furthermore, we analyzed the fat bloom homogeneous phenomena by performing a binarization that identifies regions of higher fat content, which presumably corresponds to β(V)-β(VI) rich regions and have a lighter typical color. We focused on sections of the images where no patterns grow, to avoid regions with holes on the surface. From these data, we obtained an Avrami exponent d ≈ 4 (see inset in Figure 9). From the Avrami fitted expression in Equation (11), and assuming the formation of effective disk grains, the statistical quantities involved in the Avrami model, described by Equations (2–9), can be given as explicit functions of time and model constants. For example, the effective radius of the grains is given by
where r0 is the grain's radius for the saturation time
On the other hand, the energy formation for a grain can be given by two different terms,
where θ is used in order to split the logarithm into two terms with dimensionless arguments. In this equation, the work per gram molecule required for the formation of the growth nucleus (A) is the time dependent term in the right side of the equation, and the energy of activation per gram molecule (Q) is the constant term, i.e.,
From computer simulations, Q/RT can be obtained from the minimum value of the potential energy required by a pair of clusters in order to associate into a grain disk. This energy E* = E/ϵ is determined from MD simulations. We can estimate ϵ and σ using data from a previous work on modeling biodiesel phase diagrams with a Molecular Thermodynamic approach [25]. Biodiesel molecules and triglyceride molecules have the same fatty acids. The triglyceride molecule in our model, observed in Figure 3, is formed by two units of stearic acid and one unit of oleic acid. The size of the oleic acid residue, linked to one of the three hydroxymethyl residues of the glycerol with a size of 6.5σ, can be compared with the size of the methyl oleate in reference [25], in order to estimate the total size and interaction energy of our triglyceride molecule. In this way, each molecule is formed by Np segments and each segment has an average energy ϵ. The activation energy per molecule is set by the molecules at the border of each cluster, according to the short-ranged Mie potential model used in the simulations. The average energy per molecule is then approximated by E = Npϵf, where ϵf is an average energy term per segment that only has contributions from interactions in the border of the clusters. The molar activation energy Q/RT is here given by E/kT. Together with the constants d and b determined from fitting of experimental data S(t), we obtained the value of the isokinetical parameter α that links the energetic process involved in the growth of grains with the rate of change with time of the radius of the grain,
As described in detail in the Supplementary Material, from this expression we can predict a value for α considering the saturation time θ, and the corresponding typical value of 1 mm for the diameter of a grain. The simulation value obtained for for a packing fraction ϕ = 0.36 is −0.015, and with the Molecular Thermodynamic value of energy for the biodiesel parameter [25], we obtained the results for θ and α reported in Table 1. Furthermore, we calculated a predicted value of the diameter of a grain after 2,000 min, obtained from α, that allows comparisons with the experimental results from Figure 5. We observe that the model can predict accurately the effective diameter of the chocolate grains.
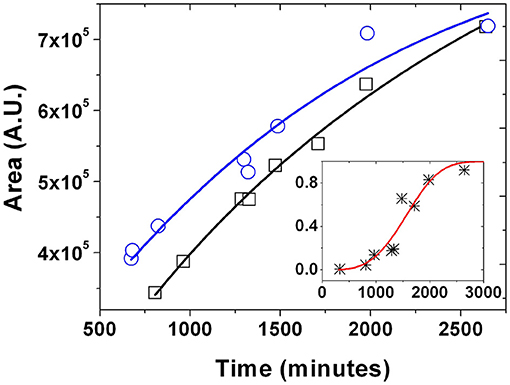
Figure 9. Growing area vs. time for the patterns observed in the two series of Figure 4. The solid line is the fitting of the data to the 2D Avrami equation. The temporal Avrami exponent obtained is d = 0.905 ± 0.14 (open black squares) and d = 1.142 ± 0.28 (open blue circles). The corresponding values for parameter b are 0.00043 ± 0.00020 and 0.00059 ± 0.00028, respectively. The square correlation coefficient is higher than 0.96 in both cases. Inset: Normalized fat bloom growing area from binarized images vs. time of a section of the chocolate surface where no patterns were formed; data were also fitted with the Avrami equation (solid red line) obtaining d = 4.055 ± 1.406 and b = 8.1 × 10⁻¹⁴ ± 8.3 × 10⁻¹³.
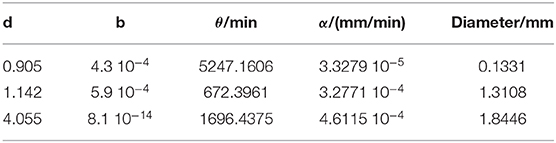
Table 1. Rates of linear size growth for different sets of Avrami parameters d and b. Values are also given for the saturation time and predicted diameters of chocolate grains after 2,000 min.
4. Discussion
We have presented the different aspects required to obtain the most common patterns observed during the aging on the surface of the chocolate. One basic aspect is the necessity of having temperature fluctuations in the range of 20–30°C, as observed in Figure 5. Without them, it is practically impossible to obtain metastable patterns with circular centers and high radial and angular symmetry. Ambient temperature fluctuations apparently allow to reshape constantly the pattern; following metastable paths that produce more frequently and more efficiently patterns with radial symmetry than the symmetry produced in situations where temperature is fixed or cyclic. It is important to point out that the different phases observed with the variation of temperature have differences in volume and crystallinity (orientation). In the literature there are descriptions of typical hysteresis in volume between the cooling and the heating histories, as depicted in Figure 2, which is similar to what it is suggested from hysteresis in the normal stress coefficient vs. temperature (Figure 7). Following Figure 2, we can also suggest that the proximity among the different stable and metastable chocolate phases produces easily different shapes or patterns on its surface, that depend on temperature fluctuations and on the previous history of the sample. However, the patterns are completely reproducible; considering that the first events are always circular patterns that, as time goes on, develop ruffles and small scarce islands. Clearly, more than two phases could be involved to create a pattern, but interestingly the pattern growing can be captured using the Avrami model (Figure 9). An Avrami exponent d in the range of one is obtained and, as previously mentioned, it can be linked, via the probability of formation of growth nuclei p(t), with a low value of energy E of the fat bloom event triggered in a pattern. By contrast, the homogeneous fat bloom formation also analyzed according to the Avrami model (Figure 9, inset), presents an exponent near 4, that corresponds to an energy higher than the one necessary to form a pattern.
Although the time and size scales involved in experiments and simulations are very different, the fact that the spontaneous pattern growth observed on the chocolate surface can be closely described by the Avrami equation suggests that the isokinetical approach intrinsic to this model, i.e., the proportionality between the growth rate G(t) and the probability of formation growth of nuclei, p(t), can be linked to the way the triacylglycerides molecules interact to form active germ nuclei, as observed in simulations, and then the clustering of these nuclei in order to form grains with an increasing radius. In other words, the associating mechanisms that induce the formation of grains can be described using the coarse-grained model of molecules in our NVT simulations scale accordingly to the Avrami model. Within their uncertainty values, the Avrami constants b and d obtained for the experimental system can be used, in combination with the activation energy determined from computer simulations at an equivalent packing fraction of the experiments, in order to determine the isokinetical parameter α (or speed of linear growth of the formation) of chocolate grains. We have found that the predicted sizes for chocolate grains compare accurately with real sizes. In future works we will address the correlation between the parameters of the Mie pair-interaction used in the simulations and the actual value of Q required to form a growth nucleus from germ nuclei. It is important to stress here that a proper modeling of the grain formation, according to the second stage of aggregation described by Avrami, requires the consideration of the surface tension of the system. However, at the level of the scale described by the simulations presented here, our simulations are restricted to the description of the first stage of the aggregation process, that only considers the formation of active germ nuclei. A more detailed analysis will also require to consider the role played by other molecules present in chocolate.
In spite of the complexity of the behavior of real patterns on the chocolate surface, it is interesting that a coarse-grained model of the molecular behavior involved can be accomplished through the Avrami model in order to give information of the associating mechanisms that determine the actual growth process of chocolate grains. Furthermore, the alignment of the nuclei observed in the simulations resembles what is expected in the formation of fat crystals [14, 17, 26]. The difference in the connectivity for different packing fractions might be another crucial factor in fat bloom. Further issues that we would like to answer are how the fluctuation of temperature is correlated to the activation energy for the formation of grains, and the characterization of the rheological behavior of experimental samples in terms of the molecular model used in the simulation and its dependence on the Mie potential parameters, as well as the role played by the solvent molecules.
Data Availability Statement
The raw data supporting the conclusions of this article will be made available by the authors, without undue reservation.
Author Contributions
JD carried out the experiments and data analysis. CF-C carried out simulations and data analysis. AG-V was involved in the theoretical analysis. All authors designed the research and wrote the paper.
Funding
JD and AG-V thank SEP-CONACYT for the funding of the project No. 237425 Materia Blanda Coloidal.
Conflict of Interest
The authors declare that the research was conducted in the absence of any commercial or financial relationships that could be construed as a potential conflict of interest.
Acknowledgments
We thank Jacqueline Chávez for her help with some experiments.
Supplementary Material
The Supplementary Material for this article can be found online at: https://www.frontiersin.org/articles/10.3389/fphy.2021.643355/full#supplementary-material
References
1. Blanco E, Hodgson DJM, Hermes M, Besseling R, Hunter GL, Chaikin PM, et al. Conching chocolate is a prototypical transition from frictionally jammed solid to flowable suspension with maximal solid content. Proc Natl Acad Sci USA. (2019) 116:10303–8. doi: 10.1073/pnas.1901858116
2. Sato K. Crystallization behaviour of fats and lipids—a review. Chem Eng Sci. (2001) 56:2255–65. doi: 10.1016/S0009-2509(00)00458-9
3. Marangoni AG, McGauley SE. Relationship between crystallization behavior and structure in cocoa butter. Cryst Growth Des. (2003) 3:95–108. doi: 10.1021/cg025580l
4. Gouveia JR, De Lira Lixandr ao KC, Tavares LB, Fernando PHL, Garcia GES, Dos Santos DJ. Thermal transitions of cocoa butter: a novel characterization method by temperature modulation. Foods. (2019) 8:1–9. doi: 10.3390/foods8100449
5. Calva-Estrada SJ, Utrilla-Vázquez M, Vallejo-Cardona A, Roblero-Pérez DB, Lugo-Cervantes E. Thermal properties and volatile compounds profile of commercial dark-chocolates from different genotypes of cocoa beans (Theobroma cacao L.) from Latin America. Food Res Int. (2020) 136:109594. doi: 10.1016/j.foodres.2020.109594
7. Simha R, Boyer RF. On a general relation involving the glass temperature and coefficients of expansion of polymers. J Chem Phys. (1962) 37:1003–7. doi: 10.1063/1.1733201
8. Marangoni AG, Ollivon M. Fractal character of triglyceride spherulites is a consequence of nucleation kinetics. Chem Phys Lett. (2007) 442:360–4. doi: 10.1016/j.cplett.2007.05.098
9. Rodriguez Furlán LT, Baracco Y, Lecot J, Zaritzky N, Campderrós ME. Effect of sweetener combination and storage temperature on physicochemical properties of sucrose free white chocolate. Food Chem. (2017) 229:610–20. doi: 10.1016/j.foodchem.2017.03.002
10. Sonwai S, Rousseau D. Controlling fat bloom formation in chocolate—impact of milk fat on microstructure and fat phase crystallisation. Food Chem. (2010) 119:286–97. doi: 10.1016/j.foodchem.2009.06.031
11. Avrami M. Kinetics of phase change. I. General theory. J Chem Phys. (1939) 7:1103–12. doi: 10.1063/1.1750380
12. Avrami M. Kinetics of phase change. II. Transformation-time relations for random distribution of nuclei. J Chem Phys. (1940) 8:212–24. doi: 10.1063/1.1750631
13. Tremeac B, Hayert M, Le-Bail A. Mechanical properties of Tylose gel and chocolate in the freezing range. Int J Refriger. (2008) 31:867–73. doi: 10.1016/j.ijrefrig.2007.10.005
14. van Mechelen JB, Peschar R, Schenk H. Structures of mono-unsaturated triacylglycerols. II. The β2 polymorph. Acta Crystallogr Sect B. (2006) 62:1131–8. doi: 10.1107/S0108768106037086
15. Peschar R, Pop MM, De Ridder DJA, van Mechelen JB, Driessen RAJ, Schenk H. Crystal structures of 1,3-distearoyl-2-oleoylglycerol and cocoa butter in the β(V) phase reveal the driving force behind the occurrence of fat bloom on chocolate. J Phys Chem B. (2004) 108:15450–3. doi: 10.1021/jp046723c
17. Marangoni AG, Acevedo N, Maleky F, Co E, Peyronel F, Mazzanti G, et al. Structure and functionality of edible fats. Soft Matter. (2012) 8:1275–300. doi: 10.1039/C1SM06234D
18. Ortega-Rodríguez A, Cruz SA, Gil-Villegas A, Guevara-Rodríguez F, Lira-Galeana C. Molecular view of the asphaltene aggregation behavior in asphaltene-resin mixtures. Energy Fuels. (2003) 17:1100–8. doi: 10.1021/ef030005s
19. Plimpton S. Fast parallel algorithms for short-range molecular dynamics. J Comput Phys. (1995) 117:1–19. doi: 10.1006/jcph.1995.1039
20. Miller Iii T, Eleftheriou M, Pattnaik P, Ndirango A, Newns D, Martyna G. Symplectic quaternion scheme for biophysical molecular dynamics. J Chem Phys. (2002) 116:8649–59. doi: 10.1063/1.1473654
21. Kamberaj H, Low RJ, Neal MP. Time reversible and symplectic integrators for molecular dynamics simulations of rigid molecules. J Chem Phys. (2005) 122:224114. doi: 10.1063/1.1906216
22. Martyna GJ, Klein ML, Tuckerman M. Nosé-Hoover chains: the canonical ensemble via continuous dynamics. J Chem Phys. (1992) 97:2635–43. doi: 10.1063/1.463940
23. Cuetos A, Dijkstra M. Kinetic pathways for the isotropic-nematic phase transition in a system of colloidal hard rods: a simulation study. Phys Rev Lett. (2007) 98:095701. doi: 10.1103/PhysRevLett.98.095701
24. Weinberg MC. A test of the Johnson-Mehl-Avrami equation. J Cryst Growth. (1987) 2:779–80. doi: 10.1016/S0022-0248(87)80025-8
25. Perdomo FA, Gil-Villegas A. Molecular thermodynamics of biodiesel fuel compounds. Fluid Phase Equil. (2010) 293:182–9. doi: 10.1016/j.fluid.2010.03.011
Keywords: chocolate, cocoa butter, nucleation, fat bloom, Avrami equation
Citation: Delgado J, Ferreiro-Córdova C and Gil-Villegas A (2021) Spontaneous Pattern Growth on Chocolate Surface: Simulations and Experiments. Front. Phys. 9:643355. doi: 10.3389/fphy.2021.643355
Received: 18 December 2020; Accepted: 16 March 2021;
Published: 15 April 2021.
Edited by:
Enrique Hernandez-Lemus, Instituto Nacional de Medicina Genómica (INMEGEN), MexicoReviewed by:
Martin Kröger, ETH Zürich, SwitzerlandVagelis Harmandaris, University of Crete, Greece
Copyright © 2021 Delgado, Ferreiro-Córdova and Gil-Villegas. This is an open-access article distributed under the terms of the Creative Commons Attribution License (CC BY). The use, distribution or reproduction in other forums is permitted, provided the original author(s) and the copyright owner(s) are credited and that the original publication in this journal is cited, in accordance with accepted academic practice. No use, distribution or reproduction is permitted which does not comply with these terms.
*Correspondence: Jorge Delgado, am9yZ2VkZWxAZmlzaWNhLnVndG8ubXg=