 Norihiro Oyama
 Takeshi Kawasaki
 Kuniyasu Saitoh
- 1Graduate School of Arts and Sciences, The University of Tokyo, Tokyo, Japan
- 2Mathematics for Advanced Materials-OIL, National Institute of Advanced Industrial Science and Technology (AIST), Sendai, Japan
- 3Department of Physics, Nagoya University, Nagoya, Japan
- 4Department of Physics, Faculty of Science, Kyoto Sangyo University, Kyoto, Japan
The mechanical responses of dense packings of soft athermal spheres under a finite-rate shear are studied by means of molecular dynamics simulations. We investigate the volume fraction and shear rate dependence of the fluctuations in the shear stress and the interparticle contact number. In particular, we quantify them by defining the susceptibility as the ratio of the global to local fluctuations. The obtained susceptibilities form ridges on the volume fraction-shear rate plane, which are reminiscent of the Widom lines around the critical point in an equilibrium phase transition.
1. Introduction
Soft condensed matters comprising bubbles, emulsions, or powder particles are generally referred to as “soft athermal particle systems." Soft athermal particles are characterized by their (quasi-) elastic interactions, and thermal motion is negligible since they are large in size. When their density increases quasistatically, a transition from the liquid state, where the stress is zero, to the amorphous solid state, where the stress is finite, occurs. This transition is called the jamming transition [1, 2]. In the vicinity of the jamming transition point, various physical quantities, namely, the stress, the interparticle contact number, and the viscosity, behave critically [3–8]. The jamming transition is similar to the glass transition observed in thermal particle systems such as atomic, molecular, and colloidal systems; recently, however, they have been revealed to be distinct [9, 10].
The rheology of athermal particles with shear flow also exhibits critical behaviors caused by the jamming transition. In particular, a scaling function for the flow curve regarding the volume fraction and shear rate has been proposed [11], and the validity of the scaling has been widely discussed to date [5, 12–14]. First, the jamming transition can be strictly defined in the athermal quasistatic limit; thus, under a finite-rate shear, the existence of a jamming transition is not obvious. Most conventional jamming transition studies are concerned with the criticality of macroscopic mean quantities, whereas with the finite-rate shear, physical quantities such as the shear stress continuously increase with increasing volume fraction, and no remarkable singularity is observed [12, 15–18]. In the statistical mechanics of thermal equilibrium systems, a naive phase transition picture is often captured by the fluctuation of physical quantities. In previous studies on the jamming transition, little discussion on the fluctuation has been made, although it is potentially significant. Accordingly, this work focuses on the fluctuation of the physical quantities and clarifies the jamming transition behavior under a finite shear rate.
In this work, we investigate the stress response of soft athermal particles using molecular dynamics simulations with a finite-rate shear flow. We measure the volume fraction dependence of the shear stress under a constant shear rate, and then, near the jamming transition point, which is characterized by the athermal quasistatic (AQS) limit, we find that the fluctuation of the stress exhibits a peak. We also find that the peak height diverges and the peak position converges to the jamming transition point when we decrease the shear rate toward the AQS limit, which is reminiscent of the Widom line near the critical point in an equilibrium phase transition. Despite this similarity, the mechanism of these fluctuations in dense athermal particles is still not apparent due to their strong non-equilibriumness. Hence, to clarify the mechanism, we investigate the time evolution of the stress when the stress fluctuation is enhanced, and we reveal that under a wide range of finite rates, the system transiently acquires rigidity intermittently. We furthermore obtain the Widom line from the contact number fluctuations, which converge to the jamming transition point in the AQS limit, yet its trace is not identical to that of the stress fluctuation. These findings deepen our understanding of the jamming transition under a finite-rate shear and provide us with extensible knowledge for various phase transition phenomena under an external field.
This paper is constructed as follows. First, we introduce the numerical simulation method. Next, we discuss the average shear stress and its fluctuation. Then, we examine the stress-strain curve and contact number fluctuations. Afterward, we draw the Widom lines obtained from the stress and contact number fluctuations. Finally, we summarize the results and give our perspectives.
2. Numerical Methods
We employ molecular dynamics (MD) simulations of soft athermal particles in three dimensions. To avoid crystallization of the system, we prepare a 50:50 binary mixture of N particles, where different kinds of particles have the same mass m and different diameters, d and 1.4d [2]. The force between the particles, i and j, in contact is modeled by a “linear spring-dashpot” [19], i.e., , with the stiffness k and viscosity coefficient η. The force is parallel to the normal unit vector nij = rij/|rij|, where rij ≡ ri − rj, with the particle positions, ri and rj denoting the relative positions. In addition, ξij = Ri + Rj − |rij| > 0 is the overlap between the particles, and is its time derivative, where Ri (Rj) is the radius of particle i (j). The stiffness and viscosity coefficient determine the time scale as t0 ≡ η/k and are adjusted such that the normal restitution coefficient of the particles is exactly zero, i.e., [19].
We randomly distribute the N particles in an L × L × L cubic periodic box and relax the system to a mechanically stable state [20]. Then, we apply simple shear deformations to the system under the Lees-Edwards boundary conditions [21]. In each time step, we apply affine deformation to the system by replacing every particle position (xi, yi, zi) with ri = (xi + Δγyi, yi, zi) (i = 1, …, N) and then numerically integrate the equations of motion, , with a small time increment Δt [22, 23]. Here, Δγ is the strain increment; hence, the shear rate is defined as .
In our MD simulations, we control the volume fraction of the particles φ and the shear rate . To control the shear rate, we change both Δγ and Δt within the constraints Δγ ≤ 10−6 and Δt ≤ 0.1t0. In addition, we measure the mechanical responses of the system to simple shear deformations by the shear stress
Here, is the x-component of the elastic force, and rijy is the y-component of the relative position rij between the particles i and j, which are in contact. For each φ and , we compute the mean value 〈σ〉 and fluctuations of the shear stress in a steady state, where the applied strain is in the range 1 < γ < 5. We also take ensemble averages of 〈σ〉 and χσ (the definitions of which are given in section 3.2) over at least 20 different initial configurations.
3. Results
3.1. Average Shear Stress
We first present the dependence of the average shear stress 〈σ〉 on the volume fraction φ and the shear rate in Figure 1A. Specifically, the values of 〈σ〉 under different combinations of the parameters as functions of φ are shown1.
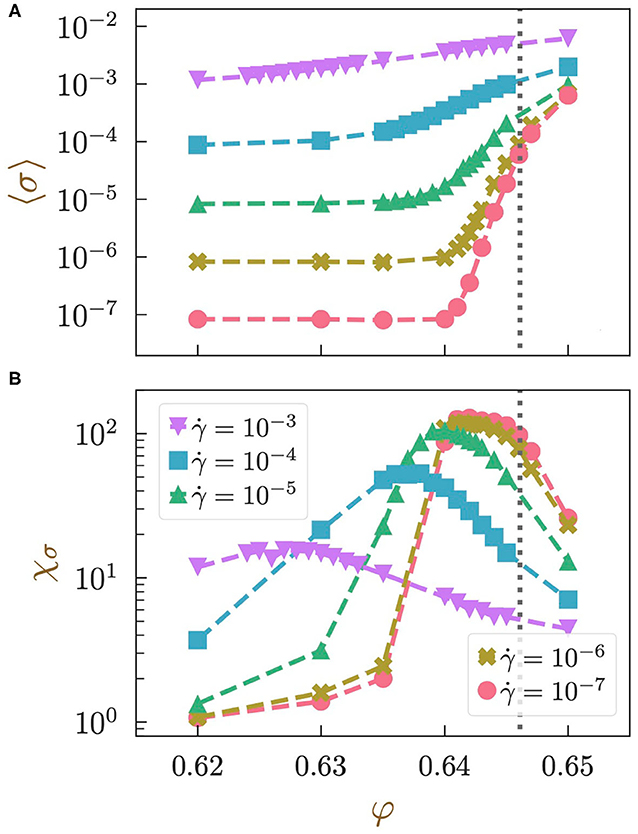
Figure 1. Simulation results of (A) the average stress 〈σ〉 and (B) the susceptibility χσ as functions of the volume fraction φ. Different markers are used to distinguish the different shear rate values, as shown in the legend in (B). The dotted lines depict the location of the jamming point φJ.
In the low φ regime, 〈σ〉 plateaus for all . We can also tell that σlow scales linearly with . This Newtonian-like shear rate dependence is considered the consequence of the effective overdamped dynamics due to the zero restitution coefficient.
In the high φ regime, 〈σ〉 increases with increasing φ. In particular, when φ is high enough and the system exhibits a clear yielding behavior, the dependence of 〈σ〉 follows the famous Herschel-Bulkley law [31]: . We show the flow curve for the system with φ = 0.65 in Supplementary Material SM2 [15, 32–35], where the fitting result of the exponent is n ≈ 0.62. We also mention that the yield stress σY varies with the volume fraction φ in a power-law manner as with α ≈ 1.0 [36, 37]2, where Δφ ≡ φ − φJ is the distance to the critical point.
Between these two qualitatively different volume fraction regimes, we observe a steep growth in 〈σ〉. As intuitively expected, this sharp increase in 〈σ〉 is observed in the vicinity of the jamming point [φJ ≈ 0.6461; see Supplementary Material SM3 for the determination of φJ under shear [5, 37]]. However, the stress growth is most prominent at a volume fraction that is clearly smaller than φJ at finite . Furthermore, as increases, the growth becomes less steep, and the onset volume fraction of the stress growth shifts toward the low φ side.
3.2. Susceptibility of the Shear Stress
We next focus on the fluctuation of the shear stress. In particular, we quantify the enhancement of the collectivity in the fluctuations that accompanies the rapid increase in 〈σ〉 by the susceptibility χσ, defined as:
where 〈σlocal〉 is the time- and particle-averaged value of the particle-based local stress and is the sum over the neighbors ( is the corresponding second-order moment)3. With this definition, the average of σi over the particles is identical to the macroscopic value σ, . This susceptibility χσ quantifies the degree of collectivity in the stress fluctuations: χσ is expected to diverge with increasing system size N when the whole system behaves collectively, as in a system located near a critical point. In Figure 1B, we plot the measurement results of χσ as a function of the volume fraction φ.
In the low φ regime, χσ increases with increasing . However, interestingly, for low rates (), χσ hardly depends on . This behavior is in contrast to that of 〈σ〉, which depends linearly on for all shear rates in the low φ regime. Regarding the volume fraction dependence in this regime, χσ grows weakly with increasing volume fraction.
In the high φ regime, the opposite trend is observed: χσ becomes smaller when either or φ increases. Still, the dependence disappears for low values of (in this case, ), in accordance with the behavior in the low φ regime.
At an intermediate value of φ between these two regimes, χσ exhibits a clear peak. As the shear rate increases, the height of the peak decreases, and the position shifts toward the low φ direction. Note that if we further increase the shear rate to , we no longer observe a peak, at least in the range of the volume fraction that we have investigated, i.e., 0.62 ≤ φ ≤ 0.65. In accordance with the convergence of χσ both in the high and low φ regimes, the height and position of the peak become almost constant for . This total convergence of the susceptibility χσ in the low rate regime over all values of φ suggests that the length scale that governs the stress fluctuation spans the whole system in this regime. We discuss the possible candidates for this length scale in section 4.2, although we leave the precise identification for a future study.
Hereafter, we call the height and position of this peak and , respectively (we omit the explicit notation for the dependence below).
3.3. Stress-Strain Curves
To further obtain an intuitive understanding of the parameter dependence of the susceptibility χσ, we plot typical stress-strain curves for the systems under various combinations of the volume fraction φ and the shear rate (, and 10−4) in Figure 2. For the whole parameter space investigated here, the average stress 〈σ〉 becomes larger with both increasing φ and increasing , as presented in Figure 1A. However, the dependence on changes significantly depending on φ: while the order of 〈σ〉 remains the same regardless of the value of at a high volume fraction (, Figure 2 light gray curves)4, it scales linearly with at a low volume fraction (, Figure 2 black curves). However, the shapes of the stress-strain curves in these different regimes are similar in that the fluctuations are suppressed.
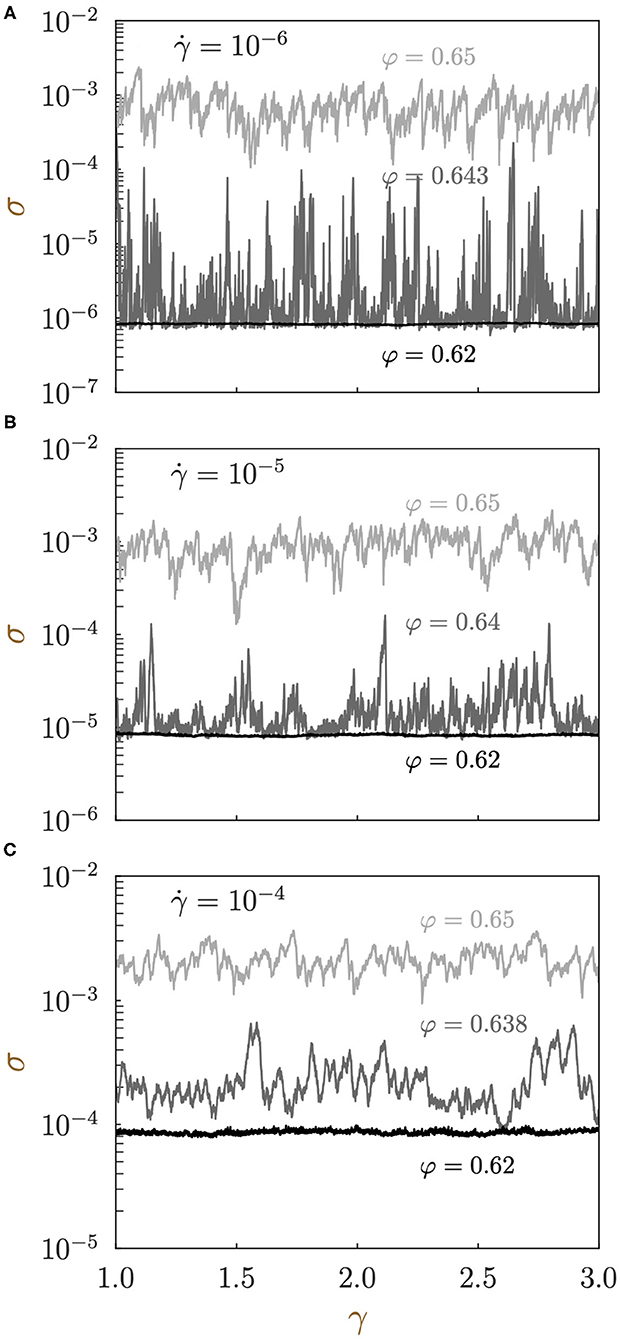
Figure 2. Stress-strain curves for various combinations of the shear rate and the volume fraction φ. The vertical axis follows a log-scale. Results for (A) , (B) , and (C) are shown. In all panels, the results for three volume fractions are compared: φ = 0.62 (black), φ = 0.65 (light gray), and (dark gray).
By contrast, the shape of the stress-strain curves dramatically changes in the vicinity of under a slow shear rate (; Figure 2A dark gray curve): we observe spiky peaks, with the height of the baseline being on the order of the stress at low φ (see Supplementary Material SM4 for normal plots of the stress-strain curves where the spiky shapes are more appreciable). The heights of the spikes are larger than the baseline by at most two orders of magnitude and barely reach the curve for φ = 0.65. Importantly, the probability distribution of σ, P(σ), exhibits a power-law-like shape for and , indicating that this susceptibility peak reflects the criticality expected for [see Supplementary Material SM4]. As the shear rate increases, the spikes become less sharp and less frequent (; Figure 2B dark gray curve), and finally, the whole stress-strain curve becomes almost detached from that for a low φ at (Figure 2C). Since the magnitudes of the stress at the baseline and the peak top are comparable to those for low and high volume fractions respectively, we consider that these spikes are formed because the system goes back and forth between fluid-like low-stress states and solid-like large-stress states. That is, the whole system collectively changes its “state" during the time evolution, as indicated by the susceptibility peak. We mention that similar repetitive transitions between fluid-like and solid-like states have also been observed under the AQS shear () [15]. Notably, under a high shear rate (), P(σ) exhibits a clear unimodal shape without power-law tails at either end (see Supplementary Material SM4 [42, 43]). This observation suggests that the increase in σ becomes more similar to a cross-over rather than a phase transition because of the effect of the strong external field (see section 4.1 for the qualitative similarity between our system and the conventional critical phenomena).
4. Discussion
In this section, we discuss the similarity between our system and the conventional critical phenomenon: the ferromagnetic transition in the Ising model under an external field. Based on this analogy, we can tell that the shear stress σ can be viewed as a natural “conjugate" variable to the strength of the external field (namely, the shear rate ). However, σ changes its value by orders of magnitude depending on even in the “disordered," low-stress phase. In this sense, it is qualitatively different from conventional standard order parameters that are normalized to be between zero and one in most cases. Therefore, we further conduct the same analysis for an alternative candidate for an order parameter, i.e., the interparticle contact number z.
4.1. Correspondence to Conventional Criticality in Equilibrium Systems
To further explore the parameter dependence of the shear stress σ and its fluctuations, we rely on an analogy with a well-understood phase transition. Here, in particular, we discuss an analogy with one of the most famous examples: the Ising model under a magnetic field (see Supplementary Material SM5 for a brief recapitulation of the mean-field solution). As shown in Figures 1A,B, the average and the susceptibility of the stress exhibit qualitative similarities with the magnetization and the susceptibility in the Ising model (SM5): the inverse temperature β, which is the control parameter of the criticality in the Ising model, corresponds to the volume fraction φ in our system. Similarly, the external magnetic field h and the magnetization m correspond to the shear rate and the mean stress 〈σ〉, respectively. Moreover, in both systems, as the external field (h or ) increases, the change in the order parameter (m or 〈σ〉) becomes less steep, and the whole plot shifts toward the less-ordered side. Regarding the susceptibility (χ or χσ), we observe peaks at a value of the control parameter (β or φ) that is shifted from the critical point when an external field is present. The height of these peaks decreases with increasing external field, and the position shifts toward the small-order side. We emphasize that the counterpart of the magnetic field in our system is not the strain γ but the shear rate , which is the conjugate of the stress in effective energy dissipation. Hence, the free energy of the Ising model corresponds to the dissipation function in our system and is consistent with the empirical knowledge that the dissipation system takes precedence over the dynamics of the minimum energy dissipation [44, 45]. In this sense, the shear stress σ can be viewed as a natural conjugate variable to the external field and thus as an order parameter. However, since σ is dependent not only on the existence of contacts but also on the degree of overlapping of each contact, it changes its value by orders of magnitude depending on even in the “disordered," dilute state. In the next section, we instead measure the average and susceptibility of the interparticle contact number, the values of which are expected to exhibit less dependence.
4.2. Contact Number
The interparticle contact number z characterizes the jamming transition most directly in terms of the microscopic structures [4]. For the jamming transition in quiescent systems without external fields, z changes discontinuously from zero to approximately zC at the critical point φJ, above which physical quantities such as the pressure or the shear modulus change in a power-law manner, as in the case of the conventional second-order phase transitions [2]. According to Maxwell's condition, zC = 2d holds for frictionless soft athermal spheres, where d is the spatial dimension of the system. Here, we plot the average and the susceptibility of the interparticle contact number z (we do not exclude rattlers to compute z) under a finite-rate shear as functions of φ in Figure 3. For the definition of the susceptibility χz, we employ a definition similar to Equation (2).
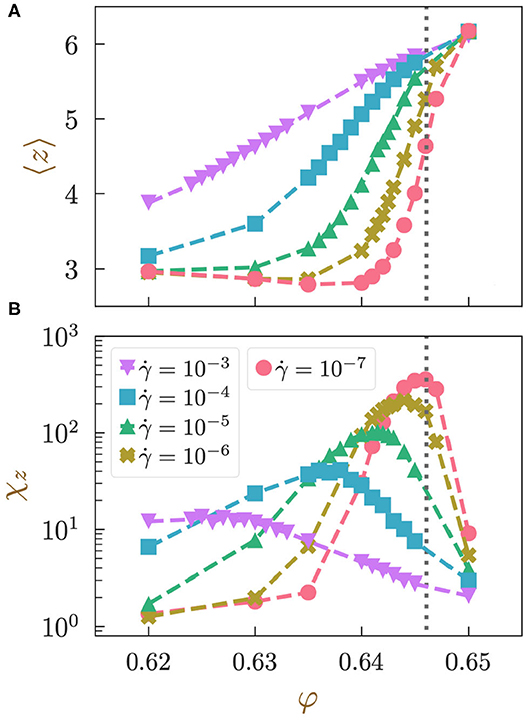
Figure 3. (A) Average 〈z〉 and (B) susceptibility χz of the interparticle contact number as functions of the volume fraction φ. Different markers represent different shear rates, as shown in the legend in Figure 1B. The dotted lines depict the location of the jamming point φJ.
The dependence of the average contact number 〈z〉 on the volume fraction φ is qualitatively very similar to that of the average stress 〈σ〉: it is almost constant in the low φ regime and then shows sudden growth around φJ, after which the growth rate decreases in the high φ regime. However, the dependence on is significantly different from that of 〈σ〉: in the low φ regime, the plateau disappears for high , and the shear rate dependence is not linear. Furthermore, the values of 〈z〉 at the highest φ hardly depend on .
The susceptibility of the contact number χz behaves qualitatively very similarly to that of χσ: it exhibits a clear peak near the jamming point φJ, and the peak height and position change in the same way as χσ when increases. One major difference from χσ is that the peak position and height of χz obviously change even in the low rate limit , where χσ becomes constant.
This qualitative difference intriguingly suggests that the characteristic lengths that govern σ and z (ξσ and ξz, respectively) are different. Let us enumerate several candidates from previous studies. For example, it is known that the correlation length of the deviation from the continuum description diverges at the jamming point [46–49]. This length scale, often referred to as lc, is a candidate for ξz. On the other hand, the isotropic as-quenched state has recently been shown to be qualitatively different from the sheared non-equilibrium steady state in terms of the stability against perturbation, even in the AQS limit () [50, 51]. This knowledge implies that lc and ξz can be different in nature, since lc is measured in the absence of an external field (γ = 0), while ξz should be measured in the steady state γ > (1). As an example of a correlation length measured in a dynamic situation, [14, 22, 52] reported that the correlation length of the non-affine velocities of particles diverges in the limit of φ → φJ and in two-dimensional packings of soft frictionless disks. However, this correlation length has been shown to remain finite even in the same limit in three dimensions [53]. Instead, in [53], the authors introduced the correlation length of the vortex clusters, which diverges in that limit. As another example of a dynamical correlation length, the one associated to the yielding criticality is also known to diverge in the limit of [33, 35]. However, this length scale can be well defined only in the high φ regime, where the Herschel-Bulkley law is valid and cannot describe the total convergence of χσ over the whole φ regime. As discussed here, multiple candidates exist, with the possibility that none of them is the desired one. Although identifying the governing length scale by comparing all these candidates is an important issue, we leave it as a future problem.
Finally, we present the ridges obtained by connecting the peaks of the susceptibilities under different values of in Figure 4. In this plot, we compare the results for χσ and χz. These ridges can be regarded as the dissipative-system counterpart of the Widom lines by definition. Both Widom lines seem to converge to φJ in the limit of , as expected. Moreover, these two lines follow different paths, as is the case for the conventional equilibrium systems, e.g., the Widom lines around the liquid-gas critical point.
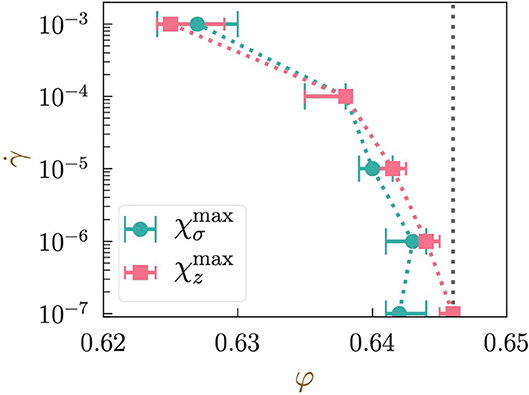
Figure 4. Widom lines, or a plot of the locations of the susceptibility peaks on a plane, where α ∈ {σ, z}. Different symbols represent different definitions of the susceptibility, as shown in the legend. The dotted line shows the location of the jamming point φJ ≈ 0.6461 estimated at (see Supplementary Material SM3). Error bars indicate the range of φ for which the values of χα are greater than 90% of .
5. Summary and Overview
In this work, we conducted MD simulations for dense packings of soft athermal spheres under a finite-rate shear and investigated the dependence of the statistics of the shear stress on the shear rate and the volume fraction. The average stress changes largely in the vicinity of the jamming point; moreover, the onset volume fraction for the stress growth becomes smaller when the shear rate increases. Interestingly, this sudden stress growth is accompanied by the formation of a peak of the susceptibility. To further understand this susceptibility peak, we investigated the time evolution of the stress. We found that the stress-strain curve exhibits spiky peaks at the volume fraction where the susceptibility peak is observed. These peaks are formed since the system can temporally gain solidity with the aid of the external shear, while it is fluidic otherwise. We furthermore measured the average and susceptibility of the interparticle contact number as an example of a normalized order parameter in our system. The results for χz are qualitatively consistent with those for χσ, although the length scales that govern these two fluctuations seem different. We furthermore visualized the Widom lines in our system, or the ridges of the susceptibility peaks for both the stress and contact number. As the equilibrium phase diagram shows, two Widom lines follow different paths, although both seem converge to a critical point in the limit . It is important to mention that to fully confirm whether the peak formation observed here is the consequence of the jamming criticality, we have to conduct the finite size scaling. Especially, it is very important to identify the length scales that governs the diverging behaviors of χσ and χz. We leave this to future works.
As another future direction, an investigation of whether modification of the physical dimension [52–54], the damping coefficient [55–57], or the local dissipation mechanisms [e.g., introduction of the tangential friction [58, 59]] leads to any qualitative changes should be carried out.
Data Availability Statement
The raw data supporting the conclusions of this article will be made available by the authors, without undue reservation.
Author Contributions
NO performed the numerical simulations and analyzed the data. All authors designed the study and wrote this paper.
Funding
This work was financially supported by JSPS KAKENHI Grant Numbers 18H01188, 18K13464, 19K03767, 20H05157, 20H00128, 20H01868, 20J00802, and 20K14436.
Conflict of Interest
The authors declare that the research was conducted in the absence of any commercial or financial relationships that could be construed as a potential conflict of interest.
Acknowledgments
We thank Atsushi Ikeda, Kota Mitsumoto, and Yusuke Hara for the fruitful discussions.
Supplementary Material
The Supplementary Material for this article can be found online at: https://www.frontiersin.org/articles/10.3389/fphy.2021.667103/full#supplementary-material
Footnotes
1. ^In Supplementary Material SM1 [5, 24–30], we show the results for the so-called effective macrocopic friction coeffcient μ ≡ σ/P, where is the pressure.
2. ^Although diverging values of α have been reported in the range of α ∈ [1.0, 1.5] [36–41], the athermal quasistatic simulations, which are expected to provide relaiable values, lead to α ≈ 1.0 [36, 37].
3. ^The only difference between the definitions of 〈σ2〉 and is the order in which the averages are taken over particles and time.
4. ^Note that since 〈σ〉 obeys the Herschel-Bulkley law at this high volume fraction (φ = 0.65), the order of the stress becomes larger if we apply a much faster shear.
References
2. O'Hern CS, Silbert LE, Liu AJ, Nagel SR. Jamming at zero temperature and zero applied stress: the epitome of disorder. Phys Rev E. (2003) 68:011306. doi: 10.1103/PhysRevE.68.011306
3. Durian DJ. Foam mechanics at the bubble scale. Phys Rev Lett. (1995) 75:4780–3. doi: 10.1103/PhysRevLett.75.4780
4. van Hecke M. Jamming of soft particles: geometry, mechanics, scaling and isostaticity. J Phys Condens Matter. (2010) 22:033101. doi: 10.1088/0953-8984/22/3/033101
5. Kawasaki T, Coslovich D, Ikeda A, Berthier L. Diverging viscosity and soft granular rheology in non-Brownian suspensions. Phys Rev E. (2015) 91:012203. doi: 10.1103/PhysRevE.91.012203
6. Olsson P. Dimensionality and viscosity exponent in shear-driven jamming. Phys Rev Lett. (2019) 122:108003. doi: 10.1103/PhysRevLett.122.108003
7. Ikeda A, Kawasaki T, Berthier L, Saitoh K, Hatano T. Universal relaxation dynamics of sphere packings below jamming. Phys Rev Lett. (2020) 124:058001. doi: 10.1103/PhysRevLett.124.058001
8. Saitoh K, Hatano T, Ikeda A, Tighe BP. Stress relaxation above and below the jamming transition. Phys Rev Lett. (2020) 124:118001. doi: 10.1103/PhysRevLett.124.118001
9. Ikeda A, Berthier L, Sollich P. Unified study of glass and jamming rheology in soft particle systems. Phys Rev Lett. (2012) 109:018301. doi: 10.1103/PhysRevLett.109.018301
10. Ikeda A, Berthier L, Sollich P. Disentangling glass and jamming physics in the rheology of soft materials. Soft Matter. (2013) 9:7669–83. doi: 10.1039/C3SM50503K
11. Olsson P, Teitel S. Critical scaling of shear viscosity at the jamming transition. Phys Rev Lett. (2007) 99:178001. doi: 10.1103/PhysRevLett.99.178001
12. Vågberg D, Olsson P, Teitel S. Critical scaling of Bagnold rheology at the jamming transition of frictionless two-dimensional disks. Phys Rev E. (2016) 93:052902.
13. Bonn D, Denn MM, Berthier L, Divoux T, Manneville S. Yield stress materials in soft condensed matter. Rev Mod Phys. (2017) 89:035005. doi: 10.1103/RevModPhys.89.035005
14. Saitoh K, Kawasaki T. Critical scaling of diffusion coefficients and size of rigid clusters of soft athermal particles under shear. Front Phys. (2020) 8:99. doi: 10.3389/fphy.2020.00099
15. Heussinger C, Barrat JL. Jamming transition as probed by quasistatic shear flow. Phys Rev Lett. (2009) 102:218303. doi: 10.1103/PhysRevLett.102.218303
16. Vågberg D, Olsson P, Teitel S. Dissipation and rheology of sheared soft-core frictionless disks below jamming. Phys Rev Lett. (2014) 112:208303. doi: 10.1103/PhysRevLett.112.208303
17. Vescovi D, Luding S. Merging fluid and solid granular behavior. Soft Matter. (2016) 12:8616–28. doi: 10.1039/C6SM01444E
18. Nagasawa K, Miyazaki K, Kawasaki T. Classification of the reversible-irreversible transitions in particle trajectories across the jamming transition point. Soft Matter. (2019) 15:7557–66. doi: 10.1039/C9SM01488H
19. Luding S. Anisotropy in cohesive, frictional granular media. J Phys Condens Matter. (2005) 17:S2623–40. doi: 10.1088/0953-8984/17/24/017
20. Bitzek E, Koskinen P, Gähler F, Moseler M, Gumbsch P. Structural relaxation made simple. Phys Rev Lett. (2006) 97:170201. doi: 10.1103/PhysRevLett.97.170201
21. Lees AW, Edwards SF. The computer study of transport processes under extreme conditions. J Phys C Solid State Phys. (1972) 5:1921–8. doi: 10.1088/0022-3719/5/15/006
22. Saitoh K, Mizuno H. Enstrophy cascades in two-dimensional dense granular flows. Phys Rev E. (2016) 94:022908. doi: 10.1103/PhysRevE.94.022908
23. Saitoh K, Mizuno H. Anisotropic decay of the energy spectrum in two-dimensional dense granular flows. Phys Rev E. (2017) 96:012903. doi: 10.1103/PhysRevE.96.012903
24. Da Cruz F, Emam S, Prochnow M, Roux JN, Chevoir F. Rheophysics of dense granular materials: discrete simulation of plane shear flows. Phys Rev E Stat Nonlinear Soft Matter Phys. (2005) 72:1–17. doi: 10.1103/PhysRevE.72.021309
25. Hatano T. Power-law friction in closely packed granular materials. Phys Rev E. (2007) 75:060301. doi: 10.1103/PhysRevE.75.060301
26. Berzi D, di Prisco CG, Vescovi D. Constitutive relations for steady, dense granular flows. Phys Rev E. (2011) 84:031301. doi: 10.1103/PhysRevE.84.031301
27. Boyer F, Guazzelli É, Pouliquen O. Unifying suspension and granular rheology. Phys Rev Lett. (2011) 107:188301. doi: 10.1103/PhysRevLett.107.188301
28. Lerner E, During G, Wyart M. A unified framework for non-Brownian suspension flows and soft amorphous solids. Proc Natl Acad Sci USA. (2012) 109:4798–803. doi: 10.1073/pnas.1120215109
29. Trulsson M, Andreotti B, Claudin P. Transition from the viscous to inertial regime in dense suspensions. Phys Rev Lett. (2012) 109:118305. doi: 10.1103/PhysRevLett.109.118305
30. Azéma E, Radjaï F. Internal structure of inertial granular flows. Phys Rev Lett. (2014) 112:078001. doi: 10.1103/PhysRevLett.112.078001
31. Herschel WH, Bulkley R. Konsistenzmessungen von Gummi-Benzollösungen. Kolloid Zeitschrift. (1926) 39:291–300. doi: 10.1007/BF01432034
32. Maeda K, Takeuchi S. Computer simulation of deformation in two-dimensional amorphous structures. Phys Status Solidi. (1978) 49:685–96. doi: 10.1002/pssa.2210490233
33. Lin J, Lerner E, Rosso A, Wyart M. Scaling description of the yielding transition in soft amorphous solids at zero temperature. Proc Natl Acad Sci USA. (2014) 111:14382–7. doi: 10.1073/pnas.1406391111
34. Saitoh K, Oyama N, Ogushi F, Luding S. Transition rates for slip-avalanches in soft athermal disks under quasi-static simple shear deformations. Soft Matter. (2019) 15:3487–92. doi: 10.1039/C8SM01966E
35. Oyama N, Mizuno H, Ikeda A. Instantaneous normal modes reveal structural signatures for the herschel-bulkley rheology in sheared glasses. arXiv. arxiv:2011.12568 (2020) 1:1–6.
36. Heussinger C, Chaudhuri P, Barrat JL. Fluctuations and correlations during the shear flow of elastic particles near the jamming transition. Soft Matter. (2010) 6:3050–8. doi: 10.1039/B927228C
37. Kawasaki T, Miyazaki K. Shear jamming and shear melting in mechanically trained frictionless particles. arXiv. arXiv:2003.10716 (2020) 1–10.
38. Otsuki M, Hayakawa H. Rheology of sheared granular particles near jamming transition. Prog Theor Phys Suppl. (2012) 195:129–38.
39. Hatano T. Rheology and dynamical heterogeneity in frictionless beads at jamming density. J Phys Conf Ser. (2011) 319:012011. doi: 10.1088/1742-6596/319/1/012011
40. Vågberg D, Olsson P, Teitel S. Critical scaling of {{Bagnold}} rheology at the jamming transition of frictionless two-dimensional disks. Phys Rev E. (2016) 93:52902. doi: 10.1103/PhysRevE.93.052902
41. Tighe BP, Woldhuis E, Remmers JJC, Van Saarloos W, Van Hecke M. Model for the scaling of stresses and fluctuations in flows near jamming. Phys Rev Lett. (2010) 105:1–4. doi: 10.1103/PhysRevLett.105.088303
42. Majumdar S, Sood AK. Nonequilibrium fluctuation relation for sheared micellar gel in a jammed state. Phys Rev Lett. (2008) 101:1–4. doi: 10.1103/PhysRevLett.101.078301
43. Rahbari SHE, Saberi AA, Park H, Vollmer J. Characterizing rare fluctuations in soft particulate flows. Nat Commun. (2017) 8:6–11. doi: 10.1038/s41467-017-00022-8
44. Unger T, Török J, Kertész J, Wolf DE. Shear band formation in granular media as a variational problem. Phys Rev Lett. (2004) 92:214301. doi: 10.1103/PhysRevLett.92.214301
45. Török J, Unger T, Kertész J, Wolf DE. Shear zones in granular materials: optimization in a self-organized random potential. Phys Rev E. (2007) 75:011305. doi: 10.1103/PhysRevE.75.011305
46. Ellenbroek WG, Somfai E, van Hecke M, van Saarloos W. Critical scaling in linear response of frictionless granular packings near jamming. Phys Rev Lett. (2006) 97:258001. doi: 10.1103/PhysRevLett.97.258001
47. Ellenbroek WG, van Hecke M, van Saarloos W. Jammed frictionless disks: connecting local and global response. Phys Rev E. (2009) 80:061307. doi: 10.1103/PhysRevE.80.061307
48. Lerner E, DeGiuli E, Düring G, Wyart M. Breakdown of continuum elasticity in amorphous solids. Soft Matter. (2014) 10:5085. doi: 10.1039/C4SM00311J
49. Mizuno H, Silbert LE, Sperl M. Spatial distributions of local elastic moduli near the jamming transition. Phys Rev Lett. (2016) 116:068302. doi: 10.1103/PhysRevLett.116.068302
50. Karmakar S, Lerner E, Procaccia I. Statistical physics of the yielding transition in amorphous solids. Phys Rev E. (2010) 82:055103. doi: 10.1103/PhysRevE.82.055103
51. Oyama N, Mizuno H, Ikeda A. Unified View of Avalanche Criticality in Sheared Glasses (2020). Available online at: http://arxiv.org/abs/2009.02635
52. Saitoh K, Mizuno H. Anomalous energy cascades in dense granular materials yielding under simple shear deformations. Soft Matter. (2016) 12:1360–7. doi: 10.1039/C5SM02760H
53. Oyama N, Mizuno H, Saitoh K. Avalanche interpretation of the power-law energy spectrum in three-dimensional dense granular flow. Phys Rev Lett. (2019) 122:188004. doi: 10.1103/PhysRevLett.122.188004
54. Radjai F, Roux S. Turbulentlike fluctuations in quasistatic flow of granular media. Phys Rev Lett. (2002) 89:064302. doi: 10.1103/PhysRevLett.89.064302
55. Andreotti B, Barrat JL, Heussinger C. Shear flow of non-brownian suspensions close to jamming. Phys Rev Lett. (2012) 109:105901. doi: 10.1103/PhysRevLett.109.105901
56. Kawasaki T, Ikeda A, Berthier L. Thinning or thickening? Multiple rheological regimes in dense suspensions of soft particles. Europhys Lett. (2014) 107:28009. doi: 10.1209/0295-5075/107/28009
57. Vågberg D, Olsson P, Teitel S. Shear banding, discontinuous shear thickening, and rheological phase transitions in athermally sheared frictionless disks. Phys Rev E. (2017) 95:052903. doi: 10.1103/PhysRevE.95.052903
58. Otsuki M, Hayakawa H. Critical behaviors of sheared frictionless granular materials near the jamming transition. Phys Rev E. (2009) 80:011308. doi: 10.1103/PhysRevE.80.011308
Keywords: jamming transition, rheology, shearflow, molecular dynamics simualtion, non-equilibirum phase transition
Citation: Oyama N, Kawasaki T and Saitoh K (2021) Dynamic Susceptibilities in Dense Soft Athermal Spheres Under a Finite-Rate Shear. Front. Phys. 9:667103. doi: 10.3389/fphy.2021.667103
Received: 12 February 2021; Accepted: 06 April 2021;
Published: 07 May 2021.
Edited by:
Ran Ni, Nanyang Technological University, SingaporeReviewed by:
Charles Reichhardt, Los Alamos National Laboratory (DOE), United StatesBulbul Chakraborty, Brandeis University, United States
Copyright © 2021 Oyama, Kawasaki and Saitoh. This is an open-access article distributed under the terms of the Creative Commons Attribution License (CC BY). The use, distribution or reproduction in other forums is permitted, provided the original author(s) and the copyright owner(s) are credited and that the original publication in this journal is cited, in accordance with accepted academic practice. No use, distribution or reproduction is permitted which does not comply with these terms.
*Correspondence: Norihiro Oyama, b3lhbWFub3JpaGlyb0BnLmVjYy51LXRva3lvLmFjLmpw; Takeshi Kawasaki, a2F3YXNha2lAci5waHlzLm5hZ295YS11LmFjLmpw; Kuniyasu Saitoh, ay5zYWl0b2hAY2Mua3lvdG8tc3UuYWMuanA=