Abstract
Improving the displacement efficiency of capillary entrapments in porous media by adding high molecular weight polymers to the invading phase has various industrial applications, from enhanced oil recovery to soil remediation. Apart from an increased viscosity contrast compared to regular water flooding, the flow of viscoelastic polymer solutions exhibits unstable flow behavior even at small Reynolds numbers, which can lead to an additional displacement mechanism of the capillary entrapments. In this work, we employ a microfluidic approach to unravel the underlying physics and mechanism of this enhanced pore scale displacement. To this end, we show that the major complex topological flow features in a typical porous medium can be mimicked by a flow geometry consisting of a single capillary entrapment connected to two symmetric serpentine channels. This design excludes the effect of viscous stresses and allows direct focus on displacement processes driven solely by elastic stresses. We show that the unique viscoelastic fluid features, such as the significant storage and release of elastic stresses and first normal stress difference, combined with the flow geometry, lead to purely elastic instability and secondary flow, which in turn provide the stresses necessary to overcome the capillary threshold and displace the capillary entrapment.
1 Introduction
Displacement processes in porous media are ubiquitous in a variety of natural settings and technical applications Pinder and Gray [1]; Blunt [2]; Singh et al. [3]; Bear and Verruijt [4]. At low flow rates, i.e., at sufficiently small capillary numbers (ratio of viscous to capillary forces) the advance of an invading fluid sweeping out an immiscible defending fluid is governed by the wettability of the porous medium Zhao et al. [5]; Jung et al. [6]; Singh et al. [3]. Thus, these displacement processes are mainly controlled by geometrical properties, i.e., the pore-throat size distribution. This typically leads to ramified displacement patterns, where large portions of the defending fluid remain trapped by capillary forces. For an invading wetting fluid these entrapments of the defending fluid are preferentially located at the center of pores or throats, while for intermediate to non-wetting invading fluids the residual defending fluid commonly remains trapped at narrow gaps and dead ends, or spreads as films Zhang et al. [7]; Emami Meybodi et al. [8]. A schematic sketch to illustrate the different types of capillary entrapment is given in Figure 1. Mobilization of these capillary entrapments in porous media is important in soil remediation Zhong et al. [9]; Smith et al. [10]; Cao et al. [11]; Ghosh et al. [12]; Philippe et al. [13], cleaning filtration membranes Li et al. [14]; Salama [15], and enhanced oil recovery Muggeridge et al. [16].
FIGURE 1
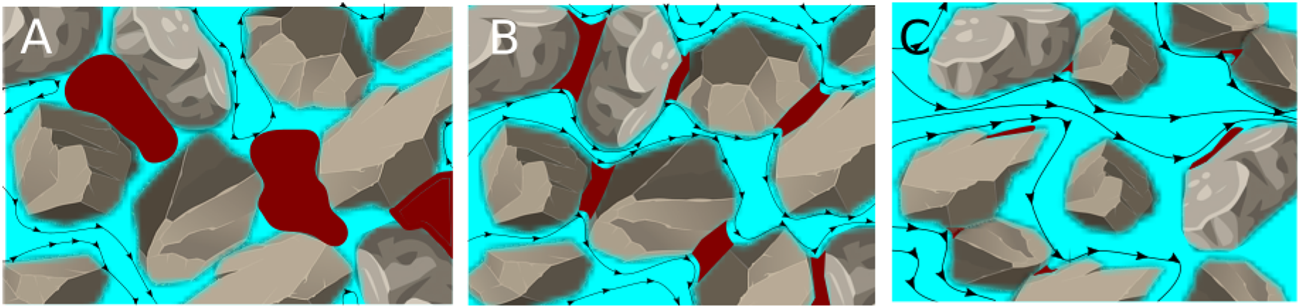
Sketch of potential types of capillary entrapments for water wet grains (A), intermediate wet grains (B), and oil wet grains (C). The invading water phase is colored blue, whereas the defending oil phase is colored red. The arrows indicate the path lines of the invading fluid.
Regardless of the wettability of the porous medium, an increase of the viscosity of the invading fluid, i.e., increasing the capillary number, leads to a suppression of capillary fingers. Therefore, a more homogeneous flow profile and consequently an improved sweep efficiency is achieved when increasing the viscosity of the invading fluid Lenormand et al. [17]. Furthermore, experiments using inelastic fluids as invading phase reveal that an increased capillary number results in breakup of large entrapments of the defending fluid Krummel et al. [18], while entrapments in smaller pores with large capillary pressure threshold are barely affected Lacey et al. [19]. However, theoretical and experimental studies Zhang et al. [7]; Buchgraber et al. [20]; Afsharpoor et al. [21]; Nilsson et al. [22]; Clarke et al. [23]; Mitchell et al. [24]; Parsa et al. [25] show that the remaining saturation of the defending fluid is often distinctly lower than expected after invasion by a viscoelastic polymer solution with high molecular weight compared to inelastic invading fluids even at the same viscosity and capillary number Huifen et al. [26]; Qi et al. [27]; Salmo et al. [28]. This implies that, apart from the increased capillary number, an additional driving mechanism must be active to reduce the residual saturation caused by the invasion of viscoelastic fluids. Although it is meanwhile a consolidated hypothesis that the improvements of the sweep efficiency by viscoelastic polymer flooding can be attributed to the elastic properties of such fluids, the underlying fundamental mechanisms remain obscure Urbissinova et al. [29]; Clarke et al. [30]; Rock et al. [31]. Various displacement mechanisms were proposed in the literature including a strip-off of oil films attached to pore walls caused by an apparent slip length Beaumont et al. [32]; Wei et al. [33], reducing the effective permeability of porous media by polymer retention Ekanem et al. [34]; Zhu et al. [35], mobilization of oil entrapments by an apparent shear-thickening effect as a consequence of purely elastic instability Clarke et al. [23]; Mitchell et al. [24]; Xie et al. [36]; Clarke et al. [30]; Kawale et al. [37]; Browne and Datta [38], as well as breakup, and pulling effects originating from normal stress differences that remove oil from dead ends Zhang et al. [7]; Lima et al. [39]; Wang et al. [40]; Fan et al. [41]. However, displacement processes in natural porous media might be affected by some if not by all the listed mechanisms, yet it remains an open question which mechanism prevails to (re-) mobilize capillary entrapments.
Due to the opacity and inherent complexity of porous media such as soil, rock, or filter membranes, direct observation of the underlying mechanisms of mobilization of capillary entrapments is generally challenging. Therefore, it is necessary to develop simplified model systems that mimic the characteristic features of the rather complex flow of viscoelastic polymer solutions in random porous media. To address these issues, microfluidic model systems raised interest among researchers Galindo-Rosales et al. [42]; Browne et al. [43]; Kumar et al. [44]. Several experimental and numerical studies have been focused on basic designs representing simplified porous media such as straight channels embedded with single cylinders Hemingway et al. [45]; Qin and Arratia [46]; Qin et al. [47], uniform or random post arrays Khomami and Moreno [48]; Ichikawa and Motosuke [49]; Haward et al. [50]; Walkama et al. [51], a single pore formed by four disks De et al. [52]; Gillissen [53], and converging-diverging channels Ekanem et al. [54]; Galindo-Rosales et al. [55]; Kumar et al. [56]; Ekanem et al. [57]. However, even in the simplest designs used so far, description of viscoelastic flow is still very complex due to a wide distribution of flow velocity (and consequently shear rate) caused by the non-constant cross-section of flow pathways in these geometries. Estimating accurate in-situ shear rates is particularly important for viscoelastic polymer solutions with concentrations above their overlap concentration c* because their rheological properties are strongly shear dependent. Therefore, a reliable evaluation of their flow characteristics requires the approximation of an accurate characteristic shear rate. To avoid this issue, alternative designs such as serpentine channels can be employed which are still capable of representing essential features of porous media such as tortuosity. Serpentine channels are particularly advantageous because their constant cross-section allows a single characteristic shear rate to be assigned to the entire geometry, which facilitates the description of viscoelastic flows.
In this work, we used a microfluidic approach to experimentally investigate the displacement mechanism for the mobilization of capillary entrapments by viscoelastic polymer solutions in the semi-dilute regime, where viscosity and relaxation time are shear dependent. To tackle this question effectively, we first performed a series of displacement experiments in a quasi-two-dimensional porous medium with various Newtonian and non-Newtonian fluids to separate the effects of viscosity and elasticity. In order to focus on the influence of elastic stresses and eliminate the influence of viscosity on the displacement process, we employed a single capillary entrapment enclosed by two symmetrical serpentine channels and varied the degree of elasticity by using polymer solutions with different concentration and molecular weight. To exclude inertial effects, all experiments were performed at low Reynolds numbers, i.e., Re < O(100).
2 Materials and methods
2.1 Microfluidic setup
Two different microfluidic geometries were employed in this study and are shown in Figure 2. In order to model a porous medium, we considered a random array of about 1,400 mono-disperse cylinders and a porosity of ϕ = 0.7 [Figure 2A]. The cylinders had a diameter d ≈ 0.032 mm, a height h1 ≈ 0.030 mm and an average center-to-center distance of (0.027 ± 0.013) mm. The field of view had a width and length of 1 mm, respectively 3 mm, resulting in a pore-volume (PV) of 6.3 ⋅ 10−11 m3. To explore the sole impact of elasticity and to rule out the effects of viscous forces on the displacement mechanism, a single-pore geometry was designed which included two identical serpentine channels with a width wmc = 0.125 mm that were connected by a perpendicular side channel with a width wsc = 0.050 mm, as sketched in Figure 2B. The dimensions of the serpentine channels and the side channel were chosen to ensure entrapment of the defending fluid in the side channel by capillary forces. The devices for both designs were made from the UV-curable glue NOA 83H (Norland optical adhesive). They were fabricated using standard soft lithographic methods; details of device fabrication are described elsewhere Jung et al. [6]; Shakeri et al. [58].To conduct the microfluidic experiments, both types of devices were placed on an inverted microscope (MeF3, Reichert-Jung) equipped with ×2 and ×4 magnification to observe the flow in the porous medium and single-pore geometry, respectively. The illumination was done with a LED light source in transmission. Images were captured using a 16 bit sCMOS camera (PCO Panda 4.2) at a maximum frame rate of 40 fps at full resolution of (2048 × 2048) pixels. The corresponding pixel resolution with respect to the applied magnification was 1.5 μm/pixel for the porous medium and 0.7 μm/pixel for the single-pore geometry. All experiments were conducted at room temperature of (20 ± 1)°C. To enable fluid injection at a controlled volumetric flow rate, the inlet of the microfluidic device was connected to a high-precision, pulsation-free syringe pump (neMESYS, Cetoni GmbH). Both microfluidic geometries were first fully saturated with dodecane. Then, the respective invading fluid was injected at a constant flow rate for the displacement experiments with the random post array. In the case of the single-pore geometry, the initial condition was established by slowly injecting the invading fluids, removing all the oil from the serpentine channel and leaving the oil entrapment in the connecting side channel. Once this situation was established, the flow rate was stepwise increased until complete desaturation of the side channel was achieved. The maximum Reynolds number in all experiments was in the order of and thus effects of inertia on the flow could be neglected. Besides, in all experiments, the outlet was connected to a fluid reservoir located at the same level as the microfluidic device to avoid back pressure due to gravity. To measure the hydrodynamic pressure difference along the single-pore geometry, a board-mounted differential pressure sensor (26PC series, Honeywell) was placed between the inlet and outlet as sketched in Figure 2B.
FIGURE 2
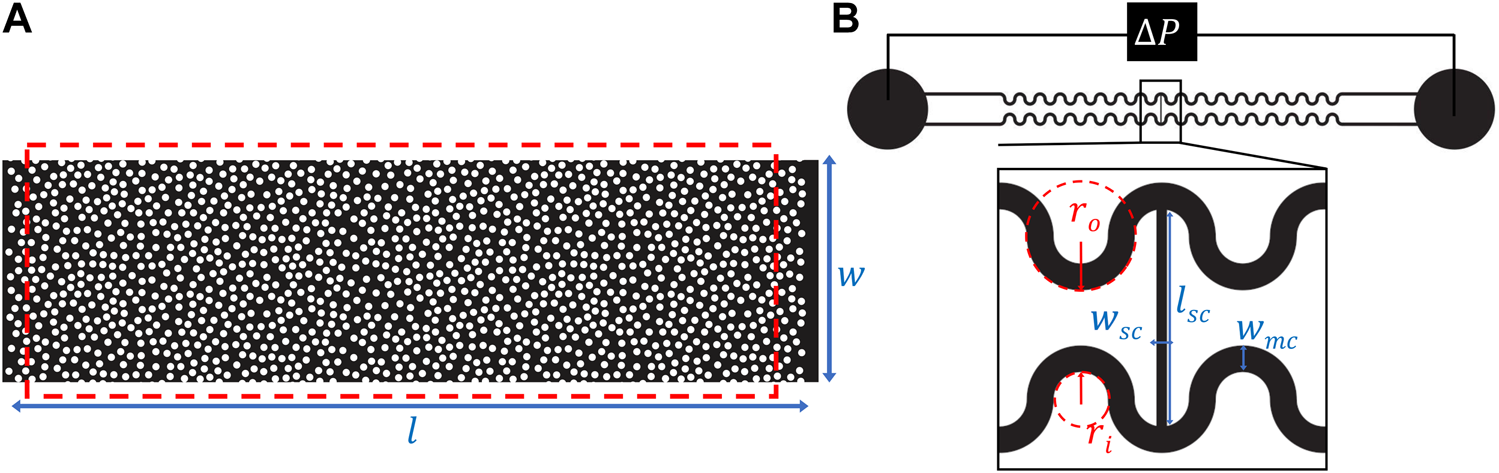
Sketches of the employed microfluidic geometries: (A) Random arrangement of about 1,400 cylinders with a diameter d ≈ 0.032 mm, and a height h1 ≈ 0.030 mm. The array has the lateral dimensions of l = 3.5 mm and w = 1 mm, The red box indicates the field of view; (B) Two symmetric serpentine channels with a width wmc = 0.125 mm that are connected by a perpendicular side channel with a width of wsc = 0.050 mm and a length of lsc = 1 mm. The inner and outer radii of curvature of the serpentine channels were ri = 0.125 mm and ro = 0.250 mm. The height h2 of the microfluidic channels was approximately 0.045 mm.
2.2 Working fluids
As non-Newtonian working fluids, we used aqueous solutions of the polyelectrolytes Flopaam 3630 (Mw,3630 ≈ 18.7 MDa, SNF Floerger), Flopaam 3330 (Mw,3330 ≈ 6.5 MDa, SNF Floerger), and Xanthan gum (Mw,Xanthan ≈ 15 MDa Holzwarth [59], Sigma Aldrich) that are industrially used as viscosifier Sorbie [60]; Mahajan et al. [61]. Polymers of the Flopaam series are synthetic, partially hydrolyzed polyacrylamides (HPAM, 30% hydrolysis) with very flexible polymer chains, while Xanthan gum is a rather stiff polysaccharide produced from simple sugars in a fermentation process by adding Xanthomonas campestris bacteria Sorbie [60]. The sample solutions with different polymer concentrations were diluted from their respective stock solutions using 17 mM NaCl-solution following standard protocols Shakeri et al; [58,62]. The salt concentration was rather in the low-salt limit and not sufficient to screen all charges of the polyelectrolytes Dobrynin et al; [63]. By applying the Huggins—Kraemer method Mezger [64], we determined the overlap concentrations to be ppm, ppm, and ppm, respectively. The prepared concentrations of 1,000 ppm (0.1 w%) and 2,000 ppm (0.2 w%) of Flopaam 3630, 1,300 ppm (0.13 w%) and 2,500 ppm (0.25 w%) of Flopaam 3330, and 2,000 ppm (0.2 w%) of Xanthan gum were at least 10 times larger than the respective overlap concentration c*, to assure that the solutions were in the semi-dilute entangled regime. As Newtonian reference cases, we used purified water, as well as 67 w% and 85 w% aqueous glycerin (Grüssing GmbH) solutions. A full rheological characterization of the utilized solutions including steady shear step measurements to determine the shear viscosity and the first normal stress difference as well as small amplitude frequency sweep tests to determine the storage modulus G′(ω) and the loss modulus G″(ω) were performed using a rotational rheometer (HAAKE MARS 40, Thermo Scientific) and the results are shown in Figure 3.
FIGURE 3
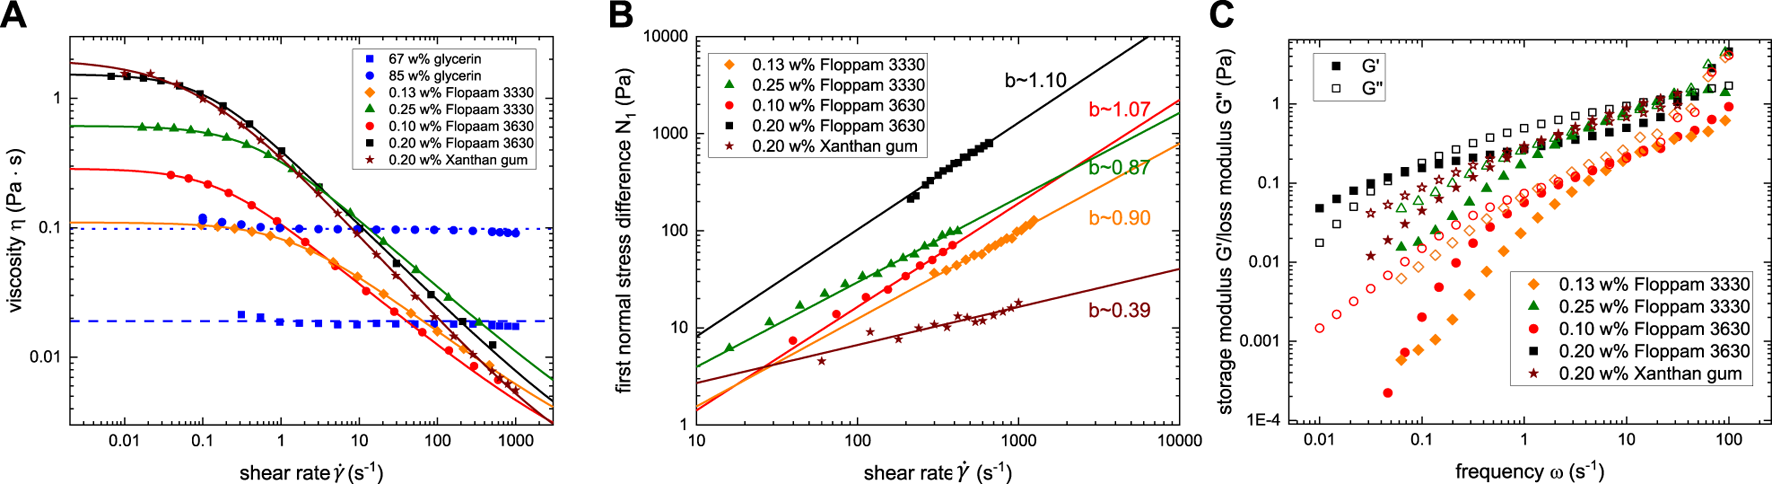
Full rheological characterization of (A) viscosity , (B) first normal stress difference , and (C) storage and loss modulus, G′(ω) and G″(ω) of the utilized solutions. Lines are fits to the Carreau–Yasuda model Eq. 1 in (A) and to a power-law in (B). The fitting parameters of the Carreau–Yasuda model are given in Table 1.
The defending fluid in all experiments, dodecane (Merck), has a constant dynamic viscosity of ηdodecane = 1.4 mPa⋅s at room temperature of (20 ± 1)°C. Dodecane was initially filtered three times in a column of aluminum oxide powder (Al2O3, Sigma Aldrich) to remove any potential surface-active contaminants. To increase the optical contrast of the fluids in the microfluidic device, 0.5 w% of the non-surface-active dye oil-red-o (Sigma Aldrich) was added to the purified dodecane. The properties of the used fluid combinations are summarized in Table 2.
TABLE 1
| Polymer | η0 [Pa⋅s] | Λ [s] | a | n |
|---|---|---|---|---|
| 0.13 w% Flopaam 3330 | 0.109 ± 0.001 | 0.72 ± 0.02 | 0.87 ± 0.01 | 0.54 ± 0.01 |
| 0.25 w% Flopaam 3330 | 0.612 ± 0.003 | 2.37 ± 0.16 | 0.99 ± 0.04 | 0.47 ± 0.01 |
| 0.10 w% Flopaam 3630 | 0.287 ± 0.003 | 6.43 ± 0.25 | 0.99 ± 0.04 | 0.50 ± 0.01 |
| 0.20 w% Flopaam 3630 | 1.535 ± 0.011 | 9.33 ± 0.81 | 1.07 ± 0.05 | 0.41 ± 0.02 |
| 0.20 w% Xanthan gum | 1.863 ± 0.173 | 13.27 ± 1.53 | 0.83 ± 0.10 | 0.38 ± 0.01 |
Fitting parameters of Carreau–Yasuda model for viscosity Eq. 1: η0 is the zero-shear viscosity; Λ is a characteristic time; a is a transition control factor; and n is the power law exponent associated with the degree of shear-thinning. η∞ was fixed to the solvent viscosity 0.001 Pa⋅s for all used polymer solutions.
TABLE 2
| Invading fluid | ϱ [g/cm3] | σ [mN/m] | θadv [°] | θrec [°] |
|---|---|---|---|---|
| purified water | 1.00 ± 0.01 | 50 ± 1 | 125 ± 4 | |
| water with HPAM/XG | 1.00 ± 0.01 | 50 ± 1 | 125 ± 4 | |
| 67 w% glycerin | 1.18 ± 0.01 | 32 ± 1 | 125 ± 4 | |
| 85 w% glycerin | 1.22 ± 0.01 | 29 ± 2 | 125 ± 4 |
Density (ϱ) measured by a pycnometer (Blaubrand, Brand GmbH), as well as interfacial tension (σ) determined by pendant drop method, and advancing (θadv) and receding contact angle (θrec) of the utilized combinations of invading fluids and dodecane determined by sessile drop needle-in method using the contact angle measurement device (OCA 25, DataPhysics). It should be noted that the addition of HPAM, respectively Xanthan gum (XG) to water did neither alter the interfacial tension nor the wettability.
For visualization of flow path lines, 0.01 w% green fluorescent particles (2 μm, FluoroMax, Thermo Fisher) were added to the aqueous phase and imaged via fluorescence microscopy (Axiophot, Zeiss, equipped with a filter cube appropriate for excitation and emission wavelength of 475/40 nm and 530/50 nm, respectively). We have confirmed that the addition of the particles did not affect the physical or rheological properties of the utilized fluids.
2.3 Viscoelastic fluid model and dimensionless numbers
As presented in Figure 3, the studied polymer solutions exhibited strong shear-thinning viscosity and a non-quadratic first normal stress difference . Such fluids can commonly be described by the constitutive White–Metzner (WM) fluid model Bodiguel et al. [65]; Soulies et al; [66]; Casanellas et al; [67]. In this work, we applied the WM-model to describe the rheological properties and consequently to compute the relevant dimensionless numbers. Fundamentals of the WM-model can be found elsewhere Macosko [68]; Barnes et al; [69]; Burghelea and Bertola [70]; White and Metzner [71]; Tseng [72]. The supporting computational fluid dynamics (CFD) simulations in this work were based on an imaginary shear-thinning fluid having the same fitting parameters for the shear-thinning viscosity, but no elasticity component, using a generalized Newtonian fluid model ANSYS [73].
To represent the shear dependent total viscosity of the polymer solutions, we employed the Carreau–Yasuda model:Here η0 and η∞ are the zero-shear viscosity and viscosity at infinite shear rates, respectively, Λ is a characteristic time, n is the power law exponent associated with the degree of shear-thinning, and a is a transition control factor. The shear dependent relaxation time was calculated from the shear viscosity, , and the first normal stress difference, :
The complex shear modulus G(ω) can be computed from the generalized Maxwell model G(ω) = G′(ω) + iG″(ω), where G′(ω) and G″(ω) are given by Eqs 3, 4. The discrete relaxation time spectrum λk and the corresponding shear moduli Gk were obtained by fitting the experimentally measured G′(ω) and G″(ω) data in Figure 3C to these equations with N = 4 elements. In this context, G0 is the largest shear modulus corresponding to the smallest relaxation time Shakeri et al. [62].
To estimate the degree of elasticity during flow of the polymer solutions, several dimensionless numbers can be calculated within the framework of the White–Metzner model. The Deborah number De is defined as the ratio of the polymer relaxation time to a characteristic residence time in the flow:here is the minimum radius of the curved streamlines and U is the average velocity. The Weissenberg number Wi is defined as the ratio of elastic stresses to the shear stress , and thus given byBased on these two dimensionless numbers, the stress ratio M can be calculated by Morozov and van Saarloos [74]; Pakdel and McKinley [75]; McKinley et al. [76]; Shakeri et al. [62].The stress ratio M is of particular interest, since exceeding a critical value Mcrit characterizes the onset of purely elastic instability, i.e., an unstable flow of viscoelastic fluids at low Reynolds numbers. The value of Mcrit depends on the particular geometry, the type, and concentration of the polymer and salt in the solution, as well as on the type of solvent, and is commonly in the range of 1–6 Morozov and van Saarloos [74]; Yao et al. [77].
3 Results and Discussion
3.1 Displacement processes in a random post array
Exploring the impact of viscoelastic fluid properties on displacement processes in porous media requires to disentangle the effects of viscosity and elasticity. To this aim, we conducted a series of experiments employing three Newtonian fluids with different viscosity (water, 67w% and 85w% glycerin solution), a shear-thinning inelastic Xanthan gum solution (0.2w%), and a shear-thinning highly elastic HPAM solution (0.2w% Flopaam 3630) as invading fluids, displacing dodecane at a constant applied volumetric flow rate. The evolving displacement patterns, as well as the configuration of the remaining saturation of the defending fluid after injecting 200 PV and 1,200 PV of the invading fluid, are shown in Figure 4.
FIGURE 4
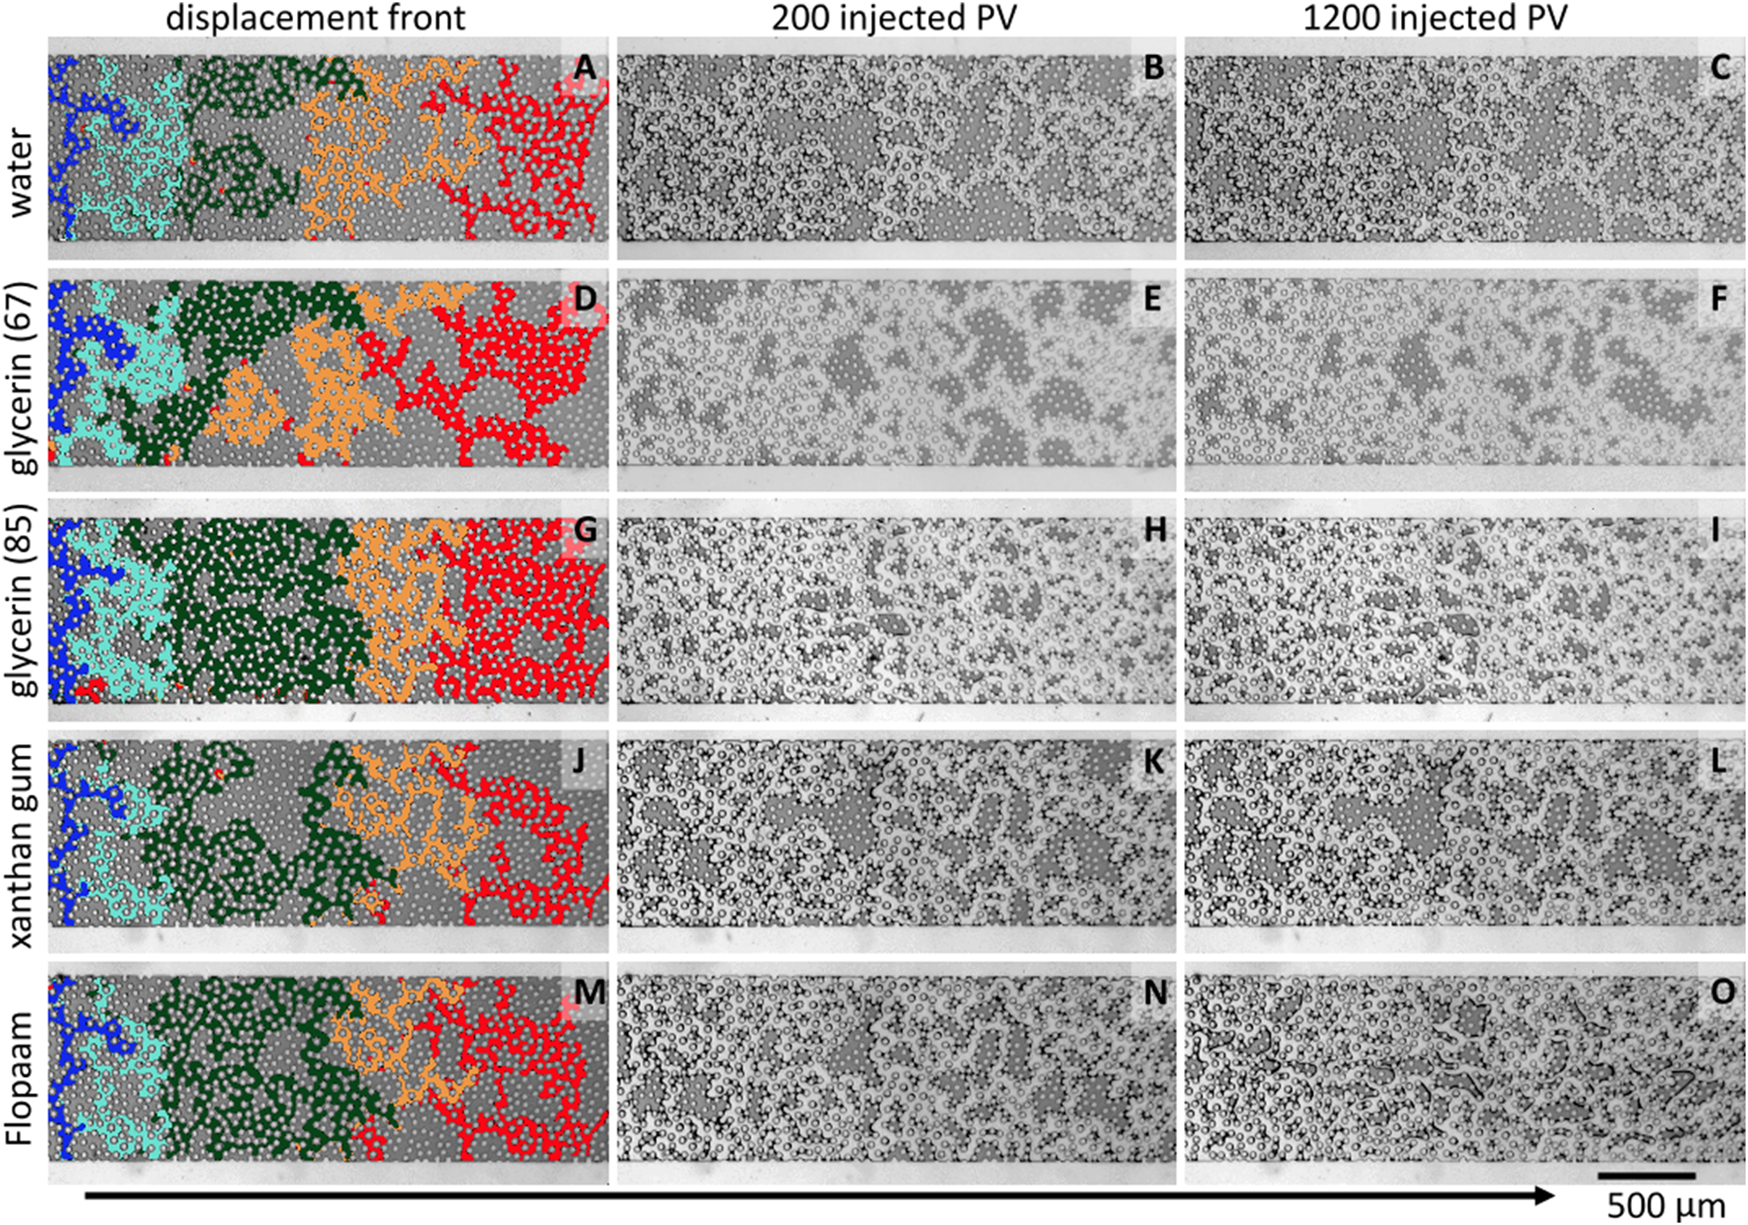
Snapshots of the displacement pattern for (A–C) water (Cawater = 8 ⋅ 10–6), (D–F) 67 w% glycerin , (G–I) 85 w% glycerin , (J–L) 0.20 w% Xanthan gum (CaXanthan = 9 ⋅ 10–5), and (M–O) 0.20 w% Flopaam 3630 (CaHPAM = 8 ⋅ 10–5). The first column shows a compiled image of the displacement patterns for about 0.05 PV (dark blue), 0.15 PV (bright blue), 0.30 PV (green), 0.45 PV (orange), and 0.60 PV (red) of the invading fluid. The second and third column show displacement pattern for 200 PV, and 1,200 PV of the invading fluid. As indicated by the arrow, the main flow direction was from left to right.
Prior to the experiments presented in this section, we experimentally determined a critical capillary number Cacrit ≈ 10–4 as an upper threshold for purely capillary dominated displacement for our specific microfluidic design, and for the advancing contact angle of θadv = (125 ± 4)° for all used invading fluids. The capillary number was approximated by , where is the shear dependent viscosity and U is the average velocity. The shear rate was approximated by Berg and van Wunnik [78]; Browne and Datta [38]. Here, the average velocity was calculated by U = Q/(A ϕ), where Q is the flow rate, A the cross-section of the channel, ϕ the porosity, and k the absolute permeability. The absolute permeability of the microfluidic device k = U ⋅ η/(−dp/dx) ≈ 1.59 ⋅ 10–11 m2 was calculated from Darcy law. The pressure gradient (dp/dx) was computed via CFD simulation of water flooding (here it was assumed that the permeability is constant for a specific porous medium and does not depend on the type of invading fluid De et al. [52]). The applied flow rate was set to Q = 4 μL/min in all experiments, and the capillary number was varied by varying the viscosity of the invading fluid.
Figure 4A shows the evolution of the displacement pattern for water displacing dodecane at a capillary number of Cawater ≈ 8 ⋅ 10–6. The observed displacement fronts appeared to be branched and followed the geometrical most favorable pathways, indicating that the displacement is fully capillary dominated. Further injection of 200 PV and 1,200 PV of water in Figures 4B, C had no impact on configuration of the remaining saturation. Experiments using 67w% glycerin solution as invading fluid and hence increasing the capillary number to , exhibited no significant influence on the initial evolution of the displacement pattern in Figure 4D compared to water. This is expected as the applied capillary number was still below the critical threshold that was determined to Cacrit ≈ 10–4 for this system. However, injection of 200 PV and 1,200 PV of 67w% glycerin solution in Figures 4E, F led to a reduction in the maximum size of the entrapments and hence to a lower remaining saturation of the defending fluid compared to water invasion. This observation is in line with the fact that by increasing the capillary number, the maximum size of the entrapments is controlled by the competition of viscous to capillary forces Krummel et al. [18]. Further increase of the capillary number above Cacrit by invasion of 85w% glycerin solution , viscous forces of the invading fluid gain importance. As visible in Figure 4G, the formation of capillary fingers was suppressed and the front advance was more compact. Injection of 200 PV of 85w% glycerin solution led to a reduction in size of the entrapments in Figure 4H. However, injection of 1,200 PV of 85w% glycerin solution in Figure 4I had no visible impact on the configuration of the remaining saturation since the capillary pressure threshold to mobilize small entrapments is seemingly too large to overcome. After benchmarking the Ca dependent displacement behavior in our porous model geometry for Newtonian fluids, we address now potential deviations of the displacement pattern by invasion of non-Newtonian fluids. Invasion of the shear-thinning inelastic Xanthan gum solution at CaXanthan ≈ 9 ⋅ 10–5 led initially to a branched displacement pattern with large entrapments in Figure 4J. Compared to invasion by the Newtonian invading fluids in Figures 4A, D, no impact of the shear-thinning property on the evolution of the front was detectable for slow invasion processes. Since all experiments involving non-Newtonian fluids as invading fluids were performed at very low capillary numbers, a strong influence of the shear-thinning properties of the polymer solutions on the morphology of the displacement front is not expected De et al; [79]; Mitchell et al; [24]. Similar to the displacement experiment with water, injection of 200 PV and 1,200 PV of Xanthan gum solution in Figures 4K, L had no significant impact on configuration of the remaining saturation. This finding is particularly remarkable because the corresponding capillary number was even slightly larger than in the experiments with 67w% glycerin solution, in which a reduction of entrapments was observed. This could be explained by the fact that the strong shear-thinning viscosity of Xanthan gum solution dampens the impact of viscous forces when the inlet pressure increases during the continuous injection. Employing the viscoelastic HPAM solution as invading fluid at CaHPAM ≈ 8 ⋅ 10–5, we observed again a branched evolution of the displacement pattern in Figure 4M. Analogous to the case of Xanthan gum, invasion of 200 PV HPAM solution did not significantly alter the configuration of the remaining saturation in Figure 4N. In contrast, a substantially different displacement pattern was observed after injecting 1,200 PV of Flopaam 3630 [Figure 4O]. Large entrapments have been broken up and only small ones at the smallest throats remain. A zoomed-in view of the displacement process can be seen in the time series for Xanthan gum and Flopaam 3630 in Figure 5 and the corresponding movies in the Supplementary material Video S1. While the fluid–fluid interfaces of the Xanthan gum/dodecane interfaces were stable throughout the experiment, the Flopaam/dodecane interfaces began to fluctuate after a certain time. These fluctuations seemed to cause the large entrapments to break up and eventually be displaced completely.
FIGURE 5
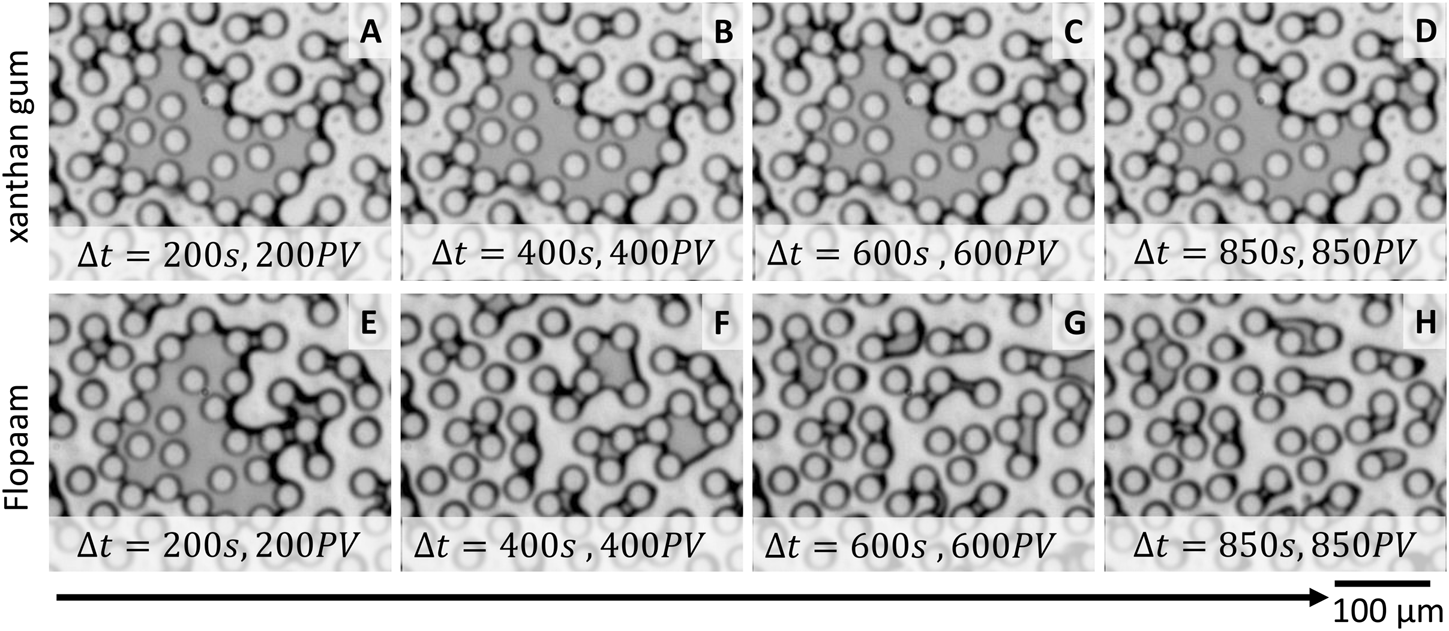
Time series of optical images of a capillary entrapment displaced by 0.20 w% Xanthan gum (A–D), and 0.20 w% Flopaam 3630 (E–H). As indicated by the arrow, the main flow direction was from left to right.
To investigate the causes of the observed fluctuations, we visualized the path lines of the invading fluid by adding fluorescent particles to the aqueous phase. Figure 6 illustrates the path lines of the invading 85 w% glycerin solution, panel (a), respectively of the viscoelastic HPAM solution, panel (b), displacing dodecane [movies in Supplementary material Video S2]. Despite the similar viscosity of the invading fluids for both experiments, the path lines appeared to be distinctly different. Viscoelastic flow in Figure 6B featured crossing path lines, semi three-dimensional effects, and fluctuations of the fluid–fluid interfaces of the entrapped oil, which were absent for the inelastic flow in Figure 6A. A possible explanation for the observed unstable flow can be the occurrence of purely elastic instability. This instability is a unique feature in viscoelastic flow at low Reynolds numbers, and it is linked to the molecular behavior of the polymers in solution Shaqfeh [80]; Groisman and Steinberg [81,82]. Such viscoelastic highly flexible polymers are strongly deformable. Specially at high shear rates, their deformation during the flow is strongly anisotropic. This anisotropic deformation causes anisotropic distribution of elastic stresses in 3D. The difference of the stress components in the observation plane, i.e., in x- and y-direction, causes a first normal stress difference N1 acting in the out-of-plane direction. If the ratio of N1 to the shear stress τ exceeds a critical stress ratio McKinley et al. [76]; Pakdel and McKinley [75]; Morozov and van Saarloos [74]; Shakeri et al. [62], the base flow becomes unstable and strongly fluctuating fluid–fluid interfaces are caused. Since the stress distribution of Newtonian fluids is isotropic and solutions of the rather stiff Xanthan gum do not develop a significant first normal stress difference N1, the base flow and consequently the fluid–fluid interfaces remained stable for inelastic fluids.
FIGURE 6

Path lines obtained by fluorescence microscopy for an invading Newtonian glycerin solution, respectively viscoelastic polymer solution displacing dodecane. In (A) the Newtonian glycerin solution follows symmetrical the tortuous path lines of the porous medium, whereas the viscoelastic HPAM solution exhibits asymmetric and even crossing path lines in (B), which represents an unsteady flow.
However, precise quantification of the contribution of elastic and viscous stresses, e.g., by computing the stress ratio M, Eq. 7, for flow of semi-dilute polymer solutions in porous media, is challenging for two major reasons. First, from a rheological point of view, due to the shear-thinning viscosity and relaxation time of the polymer solution in this concentration regime, and non-uniform distribution of shear rate in the porous media, defining a characteristic viscosity and relaxation time is not straightforward. Second, the complex flow geometry makes it difficult to estimate the radius of curvature of the streamlines , since a single flow path curvature can not be assigned to the entire geometry. Besides, the occurrence of purely elastic instability lead to an increased flow resistance, i.e., increased apparent viscosity Shaqfeh [80]; Groisman and Steinberg [81,83]; Kawale et al. [37]; Shakeri et al. [58]; Browne and Datta [38]; Datta et al. [84]. Therefore, a distinct separation of viscosity- and elasticity-related effects is unfeasible employing a random arrangement of posts as representative for porous media.
3.2 Flow properties of porous media
It is well known that increasing the viscosity of the invading fluids leads to an improved displacement efficiency. By comparing the displacement pattern resulting from an invasion with Xanthan gum, respectively Flopaam in the previous section, we observed, that elasticity driven interfacial fluctuations contribute as well to an increased displacement. However, since the turbulent flow related to the observed fluctuations leads also to an increase of an apparent viscosity, it is per se not possible to differentiate the effects of these increased apparent viscosity and the fluctuations due to their interconnected nature. Hence, to decompose these combined contributions, we needed to design a more simplified model system, which is still capable to mimic the characteristic flow features in porous media, such as the mixed distribution of flow types. Thus, in order to construct such a model system, we must start by identifying the characteristic flow features in porous media. In fact, flow in porous media is composed of an interplay of regions of shear flow in the vicinity of solid walls, as well as of extensional regions of converging–diverging flows away from the walls and at stagnation points at the front and rear poles of obstacles in a flow James [85]; Kawale et al. [37]; De et al. [86]; Poole [87]; Mokhtari et al. [88]. De et al. De et al. [86] performed direct numerical simulations to determine the flow type distribution for invasion of a viscoelastic fluid in a randomized porous medium assembled by bi-disperse disks. In their simulations, the pore structure triggered tortuous flow paths that enforce the polymers to undergo repetitive contraction and expansion. De et al. observed a predominance of shear dominated flow regions for the full range of the considered Deborah numbers, while the extent of extensional regions was further reduced at higher degree of elasticity. Moreover, in this numerical study, it was proven that the largest normal stress differences in a porous medium were generated in a shear dominated flow region rather than in extensional regions. The primary importance of shear flow has also been confirmed in other works, where it has been demonstrated that the normal stress differences responsible for an increased pressure gradient are mainly generated in shear dominated regions De et al. [52]; Ekanem et al. [54], and most of the energy of viscoelastic stresses is dissipated in these regions De et al. [86]; Gillissen [53]. In summary, the elastic nature of the polymer fluid is more pronounced when coupled with the extensional nature of the flow field Kawale et al. [37]; Walkama et al. [51]; Haward et al. [50]; Ichikawa and Motosuke [49], however extensional flow is not essential to observe elasticity-induced flow instabilities. In fact, the most important feature is tortuosity, i.e., curved path lines that cause a sufficiently strong first normal stress difference of viscoelastic fluids. Thus, serpentine channels with constant cross-section are suitable model systems for porous media. Viscoelastic flow in serpentine channels is very well characterized in the literature and are straightforward to be described Soulies et al. [66]; Zilz et al. [89]; Shakeri et al. [90]; Poole et al. [91]; Ducloué et al. [92].
3.3 Displacement of single capillary entrapment
As previously discussed, serpentine channels are well suited to mimic tortuous flow in porous media, while the perpendicular side channel connecting the two serpentine channels of our microfluidic geometry represents the location for capillary entrapment of the defending fluid [Figure 2B]. The symmetry of the serpentine channels, in conjunction with a shared inlet and outlet, ensures equal viscous pressure at both ends of the side channel. Hence, our microfluidic model system corresponds to a single capillary entrapment in a porous medium, where the effect of elastic stresses at the fluid interfaces can be isolated from the effects of viscous stresses. In the following experiments, we studied the impact of the degree of elasticity of the invading fluid on the displacement mechanism of the capillary entrapment. To this aim, we used as invading fluids four different viscoelastic HPAM solutions (i.e., for two different molecular weights and two concentrations each), an inelastic shear-thinning Xanthan gum solution, and a high viscous Newtonian glycerin solution. We initially saturated the single-pore geometry with dodecane, and subsequently stepwise increased the flow rate of the invading fluid. The experiments were stopped either when a complete removal of the oil phase from the perpendicular side channel was observed, or a maximum Reynolds number in the order of 100 was reached to avoid any contribution from inertia. To study the interactions between the flow in the serpentine channel and the entrapment at the side channel, we captured time series of the area shown in the inset of Figure 7A at each applied flow rate. To ensure that a fully developed steady-state flow was established while recording fluid–fluid interface fluctuations, we used the simultaneously measured pressure signal as a reference and started recording at each flow rate after the pressure reached a stable plateau. The saturation S of the oil in the side channel and the fluctuating motion of the fluid–fluid interface could be extracted from the recorded time series. The corresponding results are plotted in Figure 7 as a function of shear rate, which was approximated by with the equivalent radius of Son [93]. Even though this approach neglects the slightly non-parabolic flow profile of shear-thinning fluids and does not account for a possible apparent wall-slip effect of non-Newtonian fluids, we have previously shown that this approximation is sufficiently accurate for the employed serpentine channels Shakeri et al; [62]. The saturation S in Figure 7A was defined as the area of the oil column at the end of each recording step, normalized by the area of the oil column in the first step. Desaturation was initiated once the fluid—fluid interface was depinned from the edges of the side channel and S < 1. It should be mentioned that for increasing shear rates, the menisci of the trapped oil column get more bulged towards the serpentine channel. This effect led to saturation values which are slightly larger than one. Interfacial motion was described quantitatively based on the motion of the center of mass, δY, of the entrapped oil column. To quantify the strength of the interfacial motion, we calculated the root-mean-square δYrms for each shear rate and plotted the results in Figure 7B. For δYrms > 0.015 μm (i.e., for δYrms values exceeding the noise level of the experimental setup), optically visible motion of the fluid–fluid interface was clearly detectable and increased with the shear rate. At the lowest applied shear rate of , the fluid–fluid interface was stationary for all utilized invading fluids. When solutions of glycerin or Xanthan gum were employed as the invading phase, the fluid–fluid interface remained stationary across the full range of applied shear rates. Accordingly, no oil displacement was observed from the side channel despite the rather high viscosity of these solutions [Figure 7A]. However, when a viscoelastic polymer solution was injected, the fluid–fluid interface began to wobble above a certain shear rate. The intensity of this wobbling motion increased monotonically as the shear rate was further increased. The corresponding shear rates at which wobbling was initially detected were significantly lower for polymers with higher molecular weight, while they were rather independent of concentration, cf. Table 3. Eventually, displacement of the entrapped oil phase from the side channel was initiated for all utilized HPAM solutions when the fluid–fluid interface fluctuations were sufficiently intense at δYrms ≈ 3 μm [dashed horizontal line in the inset of Figure 7B].
FIGURE 7
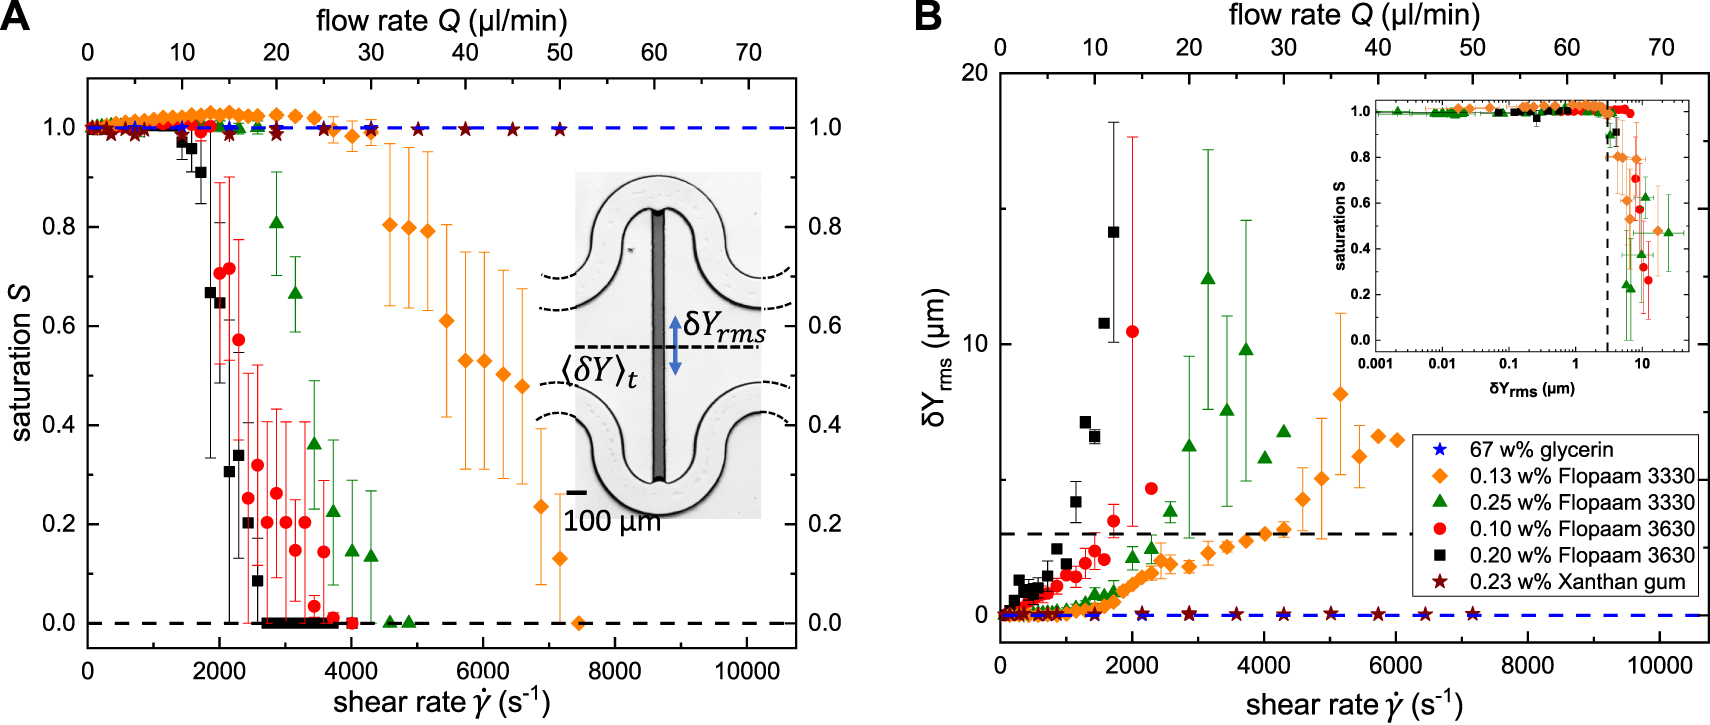
(A) Remaining oil saturation S in the side channel, and (B) root-mean-square (rms) of δYrms as function of the applied flow rate (top) and corresponding shear rate (bottom). The insets display an optical image of microfluidic geometry in (A), and the remaining oil saturation S as a function of δYrms in (B). The dashed line in (B) indicates the strength of fluctuation of δYrms ≈ 3 μm required to trigger the mobilization of the entrapped oil. The symbols in (A) and (B) represent experimental data for 67 w% glycerin (blue star), 0.13 w% Flopaam 3330 (orange diamond), 0.25 w% Flopaam 3330 (green triangle), 0.10 w% Flopaam 3630 (red circle), 0.20 w% Flopaam 3630 (black square), and 0.20 w% Xanthan gum (brown star).
TABLE 3
| Polymer | c/c* | Qcrit [μl/min] | [s−1] | Mcrit |
|---|---|---|---|---|
| 0.13 w% Flopaam 3330 | 14.0 ± 0.2 | 2006 ± 28 | 5.32 ± 0.27 | |
| 0.25 w% Flopaam 3330 | 12.0 ± 0.2 | 1719 ± 28 | 4.24 ± 0.21 | |
| 0.10 w% Flopaam 3630 | 2.5 ± 0.2 | 358 ± 28 | 4.06 ± 0.20 | |
| 0.20 w% Flopaam 3630 | 2.0 ± 0.2 | 286 ± 28 | 3.99 ± 020 |
Simultaneously with the optical recordings, we measured the corresponding pressure drop ΔP(t) = ⟨P⟩t + ΔP′(t) across the serpentine channels, where is the time averaged steady-state mean value, and ΔP′(t) is a fluctuating component of the pressure. For the viscoelastic HPAM solutions, the strength of fluctuations of the fluid–fluid interface δYrms raised monotonic with the measured pressure [Figure 8A]. Interestingly, the required strength of fluctuations δYrms ≈ 3 μm to overcome the capillary pressure that keeps the entrapment in place was achieved at a similar pressure kPa for all HPAM solutions, independent of polymer type and concentration. However, since there was no displacement in case of the inelastic invasion of glycerin and Xanthan gum solutions, during the entire range of the experiments, it is evident that the magnitude of the pressure, , cannot drive the displacement. Instead, the displacement mechanism can be explained with respect to the fluctuating component of the pressure, ΔP′(t), in the serpentine channels Shakeri et al. [58].
FIGURE 8
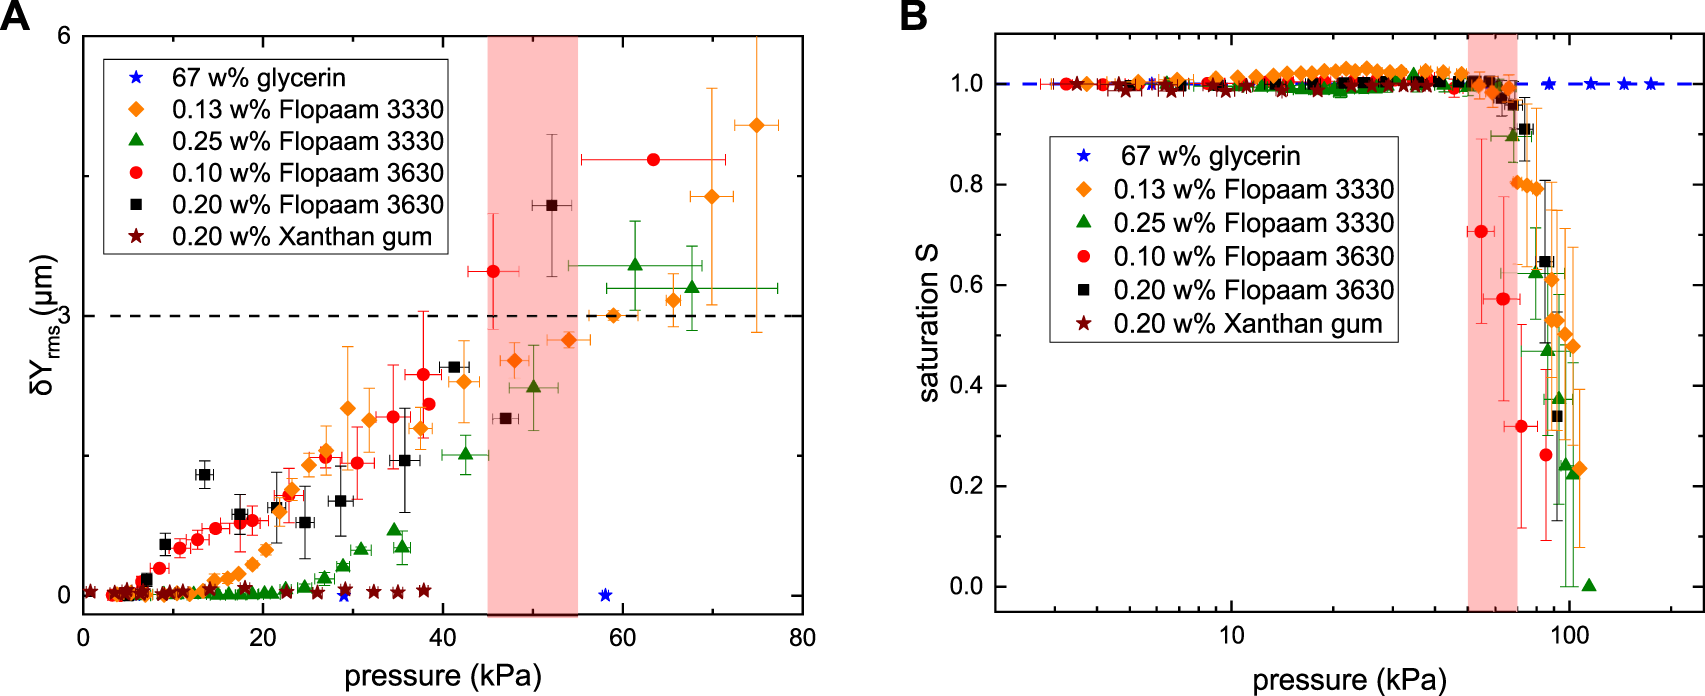
(A) The fluctuation intensity δYrms and (B) remaining oil saturation S as functions of the measured pressure difference . The horizontal dashed line in (A) indicates δYrms ≈ 3 μm, where we observe the onset of displacement in Figure 7B. The red areas in (A) and (B) refer to the pressure ranges associated with the onset of displacement. The symbols in (A) and (B) represent experimental data for 67 w% glycerin (blue star), 0.13 w% Flopaam 3330 (orange diamond), 0.25 w% Flopaam 3330 (green triangle), 0.10 w% Flopaam 3630 (red circle), 0.20 w% Flopaam 3630 (black square), and 0.20 w% Xanthan gum (brown star).
To examine the underlying mechanism that caused the fluctuations, we converted to an apparent viscosity , where the shear stress in a serpentine channel was approximated by τ = (ΔP H W)/(2L(W + H)) Machado et al. [94]. Comparison of the apparent viscosity with the extrapolated bulk viscosity values from Figure 3 revealed that, above a critical shear rate , the apparent viscosity deviated from . Figure 9A shows the reduced viscosity as function of the shear rate for all studied polymer solutions. We identified the critical shear rate at the onset of instability when the reduced viscosity exceeds 1.15 cf. Table 3. The value of 1.15 was chosen to ensure that the reduced viscosity ηr clearly exceeds our experimental accuracy. In general, a reduced viscosity significantly larger than one is a signature of turbulent flow. Since the maximum Reynolds number in our experiments was on the order of , potential inertial contributions to the observed increase in flow resistance could be safely neglected. This is confirmed by the fact that no increased reduced viscosity was detected for the inelastic Xanthan gum and glycerin solutions. Hence, the increase of the reduced viscosity ηr for the four HPAM-solutions was associated with purely elastic instability at low Reynolds numbers Browne and Datta [38]; Groisman and Steinberg [81]. Moreover, the occurrence of purely elastic instability is also reflected by the stress ratio M. In the utilized serpentine channels, we detected the onset of instability for M ≳ 4, cf. Figure 9B, in line with reported values in literature for similar geometries Pakdel and McKinley [75]; McKinley et al. [76]; Shakeri et al. [62]. However, in case of the two Flopaam 3330 solutions, the wobbling motion started already at shear rates well below [Figure 7B]. This suggests that the unstable base flow due to purely elastic instability is not the only explanation for the observed fluctuating interfaces.
FIGURE 9
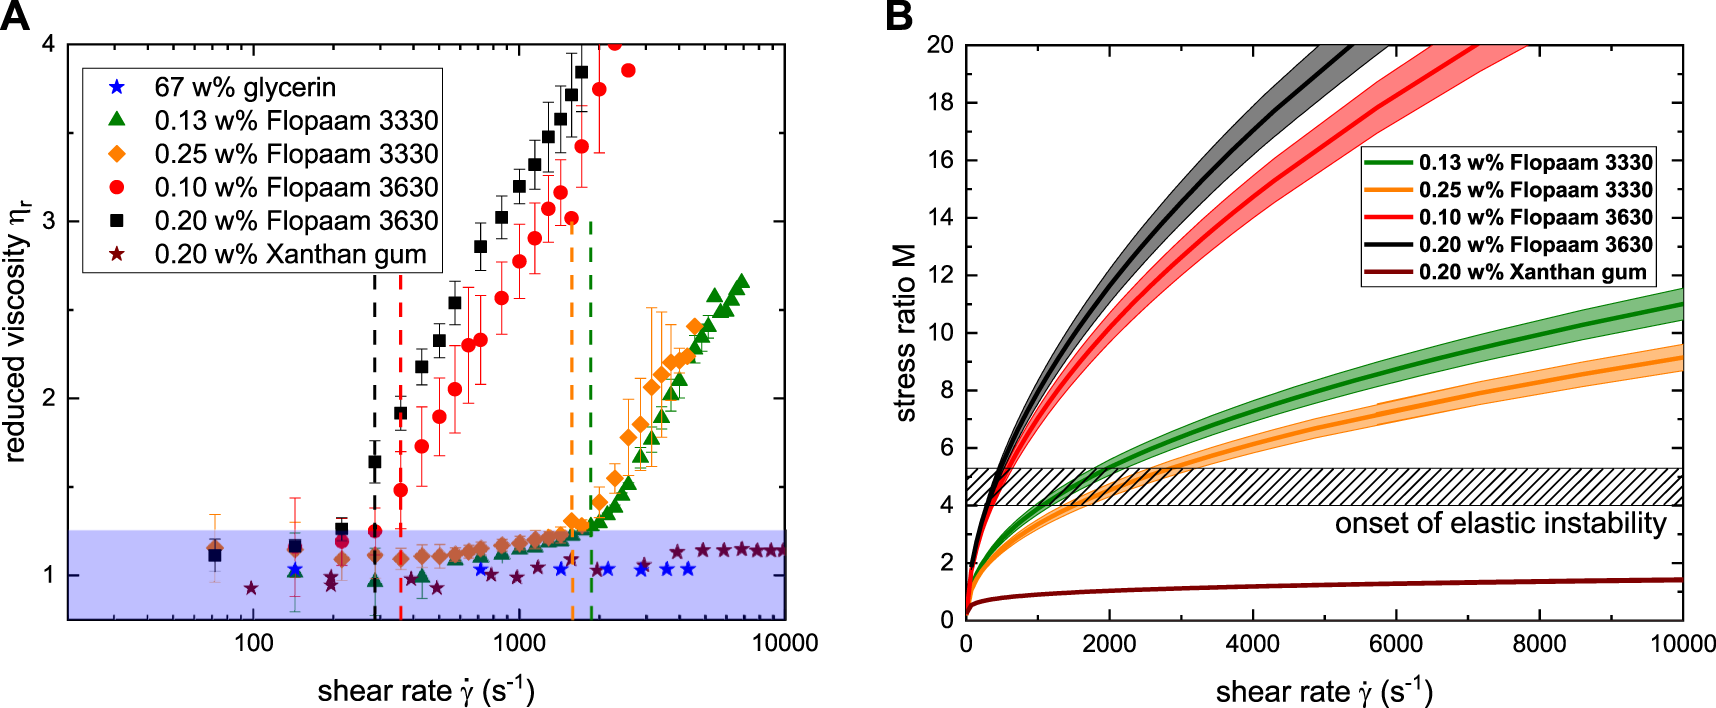
(A) Reduced viscosity ηr and (B) stress ratio M as function of shear rate . The symbols in (A) represent data for 67 w% glycerin (blue star), 0.13 w% Flopaam 3330 (orange diamond), 0.25 w% Flopaam 3330 (green triangle), 0.10 w% Flopaam 3630 (red circle), 0.20 w% Flopaam 3630 (black square), and 0.20 w% Xanthan gum (brown star). The blue area in (A) indicates a laminar base flow where ηr < 1.15. The dashed vertical lines in (A) as well the shaded area in (B) indicate the onset of purely elastic instability.
In fact, the observed interfacial fluctuations prior to the onset of purely elastic instability were also affected by elastic secondary flows, i.e., flows in the cross-stream direction that are much weaker than the flow in the main flow direction Ducloué et al. [92]; Yao et al. [77]; Poole et al. [91]. In this particular geometry, these types of secondary flows result from the difference between the curvatures of the inner and outer bends of the serpentine channel, where the gradient of the first normal stress difference N1 arises Shakeri et al. [58]. Consequently, a so–called “Hoop stress” emerges and drives the viscoelastic fluid towards the inner bends at the top and bottom of the serpentine channel, where N1 is the largest. The fluid is then pushed back to the outer part of the serpentine channel at the center plane to complete formation of counter-rotating vortices in the out-of-plane cross-section of the channel. Such elastic secondary flows are present for all applied shear rates in the case of viscoelastic flow, and their strength is expected to increase almost linearly with the applied shear rate for a laminar base flow Zilz et al. [89]. Even though secondary flows occur in the cross-sectional plane perpendicular to the plane of observation and therefore cannot be directly observed with conventional planar microscopy, secondary flow structures can be indirectly sensed by their influence on the flow paths as previously done by, e.g., Groisman and Steinberg [83]; Zilz et al. [89]; Machado et al. [94]; Shakeri et al. [58]. To visualize these secondary flow structures, we added fluorescent particles to the 0.10 w% Flopaam 3630 solution, as well as to the 0.25 w% Flopaam 3330 solution and captured the path lines by fluorescence microscopy at shear rates below and above the critical shear rates s−1 and s−1, cf. Figure 10. At s−1 in Figure 10A and Figure 10C, we observed a fully laminar flow, in which the path lines follow the curvature of the serpentine channels. At s−1 in Figure 10D, still below the critical shear rate for this solution but corresponding to experiments where we detected already mild interfacial fluctuations, we observe a slight shift of the path lines towards the inner bend of the serpentine channel. At and above the onset of purely elastic instability, at s−1 in Figure 10B and s−1 in Figure 10E, we observed crossing path lines, and semi three-dimensional effects that were very similar to the observed path lines for highly viscoelastic flow in porous media in Figure 6B.
FIGURE 10
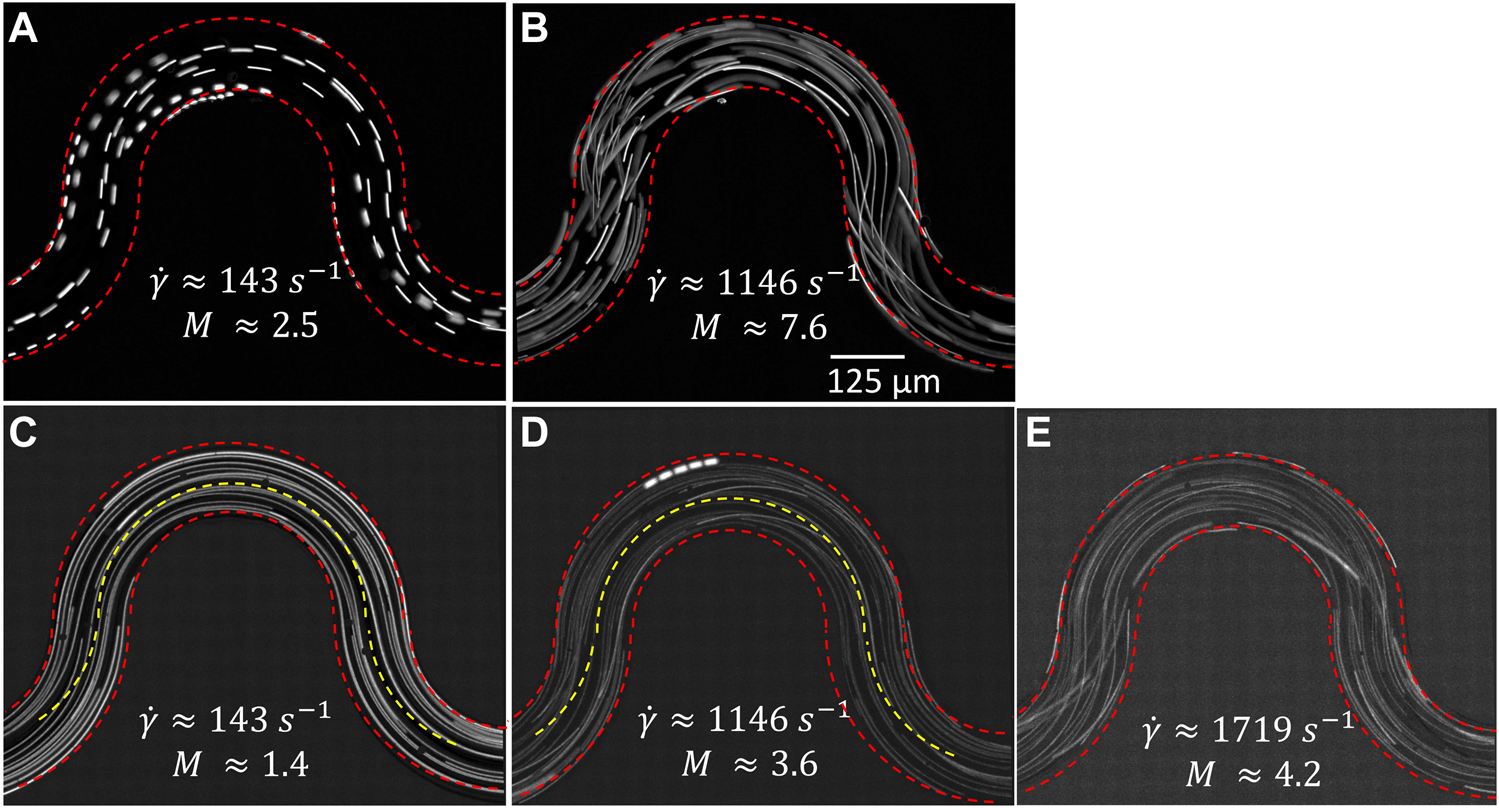
Path lines obtained by fluorescence microscopy for 0.10 w% Flopaam 3630 at (A)s−1 and (B) s−1, and 0.25 w% Flopaam 3330 at (C)s−1, (D)s−1 and (E)s−1. The red dashed lines indicate the boundary of the serpentine channels. The yellow dashed lines in (C) and (D) indicate the center line of the channel as a guide to the eye rates to highlight the evolution from laminar to turbulent flow.
The contribution of secondary flows to the fluctuations of the fluid–fluid interface in Figure 7B can be further investigated by subjecting the recorded position data δY to power spectral density (PSD) analysis. Figure 11A displays the PSD analysis of δY extracted from the optical images of 0.25 w% Flopaam 3330. At the lowest shear rate , we observed a plateau, indicating that the fluid–fluid interface remained stationary. At , i.e., below , the PSD curve exhibited still a plateau-like shape although interfacial fluctuations were already optically sensed at this shear rate [Figure 7B]. At further increased shear rates, close to and above, a power-law decay ∼ f−β was observed with two distinct exponents, βL and βH, at lower and higher ranges of frequencies. At higher frequencies from 2 Hz to 20 Hz, an exponent βH in the range of 3–4 is valid. This exponent observed over at least one decade in the frequency domain is commonly reported for turbulent flows originated from the purely elastic instability of dilute polymer solutions Groisman and Steinberg [83], and theoretically derived by Fouxon et al. Fouxon and Lebedev [95] and later Steinberg et al. Steinberg [96] for an Oldyod-B fluid. At lower frequencies from 0.2 Hz to 2 Hz, a smaller exponent βL in the range of 1–2 exist.While this exponent is in a similar range to the Kolmogorov scale 5/3 for inertia-induced turbulence Kolmogorov et al. [97], we can rule this out since the experiments were conducted at small Reynolds numbers. Similar observations were reported for the PSD analysis of the center-of-mass fluctuations of entrapped oil droplets, and pressure fluctuations in viscoelastic flow in porous media, but remained so far unexplained Mitchell et al. [24]; Kawale et al. [37]. We believe that the two distinct exponents can be explained in view of the flow structure underlying the turbulent flow, namely the short-range elastic instability and the elastic secondary flow. In fact, the high range of frequencies from 2 Hz to 20 Hz, correspond to relatively small-scaled fluctuations, originating from purely elastic instability. On the other hand, the lower range of frequencies, from 0.2 Hz to 2 Hz, is associated with relatively large flow structure of the secondary flow. This explanation is supported by our previously published work, which provided a structural analysis of viscoelastic turbulent flow in serpentine channels Shakeri et al. [90]. Applying the proper orthogonal decomposition method on velocity fluctuations obtained by particle image velocimetry of viscoelastic flow in a serpentine channel, we demonstrated that in fact, secondary flows are the dominant feature that contribute to the kinetic energy in viscoelastic flows at high shear rates, but still low Re numbers. When the flow of viscoelastic fluids becomes turbulent, it is reasonable to assume that the stretching of polymers intensifies and hence the evolution of normal stress differences gets amplified. Therefore, the purely elastic instability has an amplifying effect on the secondary flow structures. Thus, the combination of these two elasticity driven phenomena has a synergistic effect on providing the force required to destabilize the interfaces and mobilize the capillary entrapments.
FIGURE 11
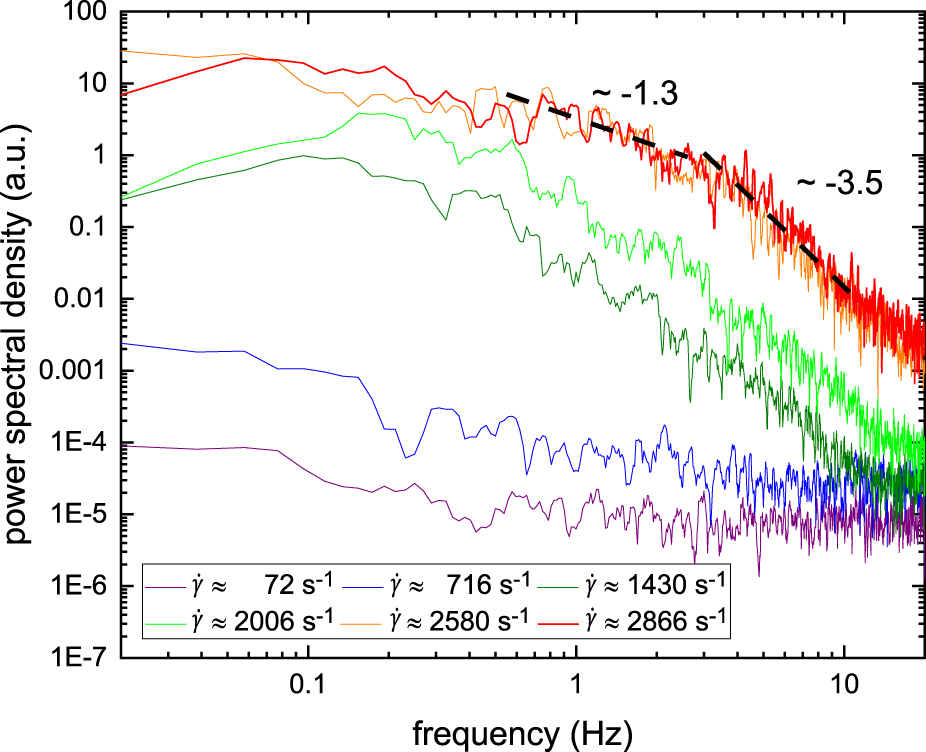
PSD analysis of vertical fluctuation of the center position δY of 0.25 w% Flopaam 3330 for various shear rates above and below the critical shear rate s−1 for this solution.
4 Conclusion
In this work, we investigated the underlying mechanism that leads to an improved mobilization of capillary entrapments in porous media by invasion of viscoelastic polymer solutions. To this aim, we conducted a series of displacement experiments employing various Newtonian and non-Newtonian fluids to separate the effects of viscosity and elasticity on the displacement process. While entrapments in large pores were mainly affected by an increased viscosity ratio between the invading and defending fluids, entrapments at small throats with high capillary pressure remained unaffected as long only the capillary number was varied. A distinct behavior was observed during the invasion of viscoelastic polymer solutions, where the fluid–fluid interfaces began to fluctuate. Moreover, small entrapments were affected and were eventually displaced by viscoelastic polymer flooding. However, due to the complexity of flow in porous media, a clear separation of viscosity and elasticity related effects is not straightforward. To tackle this problem, we focused on a single entrapment enclosed by two symmetric serpentine channels that allowed us to study elasticity driven fluctuations while eliminating the influence of viscous forces. We have found out that these fluctuations are caused by a synergetic effect of secondary flows and purely elastic instability generated by a first normal stress difference N1. The randomness of these fluctuations lead to a symmetry-breaking of the flow paths and is consequently the ultimate cause for the observed mobilization of capillary entrapments in our single-pore geometry. Since in flow in porous media, curved path lines are as well a dominant feature, a similar mechanism is responsible for an enhanced displacement process. However, to address how other features present in the flow in porous media such as elongational flow contribute to the displacement process is an interesting task for future research.
Statements
Data availability statement
The raw data supporting the conclusions of this article will be made available by the authors, without undue reservation.
Author contributions
MJ designed the experiments, performed research, and analyzed the experiments. PS designed the experiments, performed research, analyzed the experiments, and conducted simulations. RS acquired funding and directed the research. All authors (MJ, PS, and RS) discussed the results and wrote the manuscript.
Funding
We acknowledge support by the Deutsche Forschungsgemeinschaft (DFG, German Research Foundation) and Saarland University within the Open Access Publication Funding program. MJ and RS acknowledge financial support by German Research Foundation (DFG) via grant no. 495227335.
Acknowledgments
We acknowledge the generous support of BP plc’s ExploRe program. We would like to thank SNF Floerger, France for providing us the Flopaam polymers as well as Martin Brinkmann for stimulating discussions.
Conflict of interest
The authors declare that the research was conducted in the absence of any commercial or financial relationships that could be construed as a potential conflict of interest.
Publisher’s note
All claims expressed in this article are solely those of the authors and do not necessarily represent those of their affiliated organizations, or those of the publisher, the editors and the reviewers. Any product that may be evaluated in this article, or claim that may be made by its manufacturer, is not guaranteed or endorsed by the publisher.
Supplementary material
The Supplementary Material for this article can be found online at: https://www.frontiersin.org/articles/10.3389/fphy.2023.1099073/full#supplementary-material
References
1.
PinderGFGrayWG. Essentials of multiphase flow and transport in porous media. Hoboken, NJ: John Wiley & Sons (2008). 10.1002/9780470380802
2.
BluntMJ. Multiphase flow in permeable media: A pore-scale perspective. Cambridge: Cambridge University Press (2017). 10.1017/9781316145098
3.
SinghKJungMBrinkmannMSeemannR. Capillary-dominated fluid displacement in porous media. Annu Rev Fluid Mech (2019) 51:429–49. 10.1146/annurev-fluid-010518-040342
4.
BearJVerruijtA. Modeling groundwater flow and pollution, 2. Dordrecht, Holland: Springer Science & Business Media (1987). 10.1007/978-94-009-3379-8
5.
ZhaoBMacMinnCWJuanesR. Wettability control on multiphase flow in patterned microfluidics. Proc Natl Acad Sci (2016) 113:10251–6. 10.1073/pnas.1603387113
6.
JungMBrinkmannMSeemannRHillerTSanchez de La LamaMHerminghausS. Wettability controls slow immiscible displacement through local interfacial instabilities. Phys Rev Fluids (2016) 1:074202. 10.1103/PhysRevFluids.1.074202
7.
ZhangLYueXGuoF. Micro-mechanisms of residual oil mobilization by viscoelastic fluids. Pet Sci (2008) 5:56–61. 10.1007/s12182-008-0009-1
8.
Emami MeybodiHKharratRWangX. Study of microscopic and macroscopic displacement behaviors of polymer solution in water-wet and oil-wet media. Transport in porous media (2011) 89:97–120. 10.1007/s11242-011-9754-5
9.
ZhongLOostromMWietsmaTCovertM. Enhanced remedial amendment delivery through fluid viscosity modifications: Experiments and numerical simulations. J Contaminant Hydrol (2008) 101:29–41. 10.1016/j.jconhyd.2008.07.007
10.
SmithMMSilvaJAKMunakata-MarrJMcCrayJE. Compatibility of polymers and chemical oxidants for enhanced groundwater remediation. Environ Sci Techn (2008) 42:9296–301. 10.1021/es800757g
11.
CaoSBateBHuJJungJ. Engineering behavior and characteristics of water-soluble polymers: Implication on soil remediation and enhanced oil recovery. Sustainability (2016) 8:205. 10.3390/su8030205
12.
GhoshJTickGRAkyolNHZhangY. A pore-scale investigation of heavy crude oil trapping and removal during surfactant-enhanced remediation. J Contaminant Hydrol (2019) 223:103471. 10.1016/j.jconhyd.2019.03.003
13.
PhilippeNDavarzaniHColombanoSDierickMKleinP-YMarcouxM. Experimental study of the temperature effect on two-phase flow properties in highly permeable porous media: Application to the remediation of dense non-aqueous phase liquids (dnapls) in polluted soil. Adv Water Resour (2020) 146:103783. 10.1016/j.advwatres.2020.103783
14.
LiLXuGYuH. Dynamic membrane filtration: Formation, filtration, cleaning, and applications. Chem Eng Techn (2018) 41:7–18. 10.1002/ceat.201700095
15.
SalamaA. On the dynamics of a meniscus inside capillaries during imbibition and drainage processes: A generalized model, effect of inertia, and a numerical algorithm. Phys Fluids (2021) 33:082104. 10.1063/5.0061415
16.
MuggeridgeACockinAWebbKFramptonHCollinsIMouldsTet alRecovery rates, enhanced oil recovery and technological limits. Phil Trans R Soc A: Math Phys Eng Sci (2013) 372:20120320. 10.1098/rsta.2012.0320
17.
LenormandRTouboulEZarconeC. Numerical models and experiments on immiscible displacements in porous media. J Fluid Mech (1988) 189:165–87. 10.1017/S0022112088000953
18.
KrummelATDattaSSMünsterSWeitzDA. Visualizing multiphase flow and trapped fluid configurations in a model three-dimensional porous medium. AIChE J (2013) 59:1022–9. 10.1002/aic.14005
19.
LaceyMHollisCOostromMShokriN. Effects of pore and grain size on water and polymer flooding in micromodels. Energy & Fuels (2017) 31:9026–34. 10.1021/acs.energyfuels.7b01254
20.
BuchgraberMClemensTCastanierLMKovscekA. A microvisual study of the displacement of viscous oil by polymer solutions. SPE Reservoir Eval Eng (2011) 14:269–80. 10.2118/122400-PA
21.
AfsharpoorABalhoffMTBonnecazeRHuhC. Cfd modeling of the effect of polymer elasticity on residual oil saturation at the pore-scale. J Pet Sci Eng (2012) 94(95):79–88. 10.1016/j.petrol.2012.06.027
22.
NilssonMAKulkarniRGerberichLHammondRSinghRBaumhoffEet alEffect of fluid rheology on enhanced oil recovery in a microfluidic sandstone device. J Non-Newtonian Fluid Mech (2013) 202:112–9. 10.1016/j.jnnfm.2013.09.011
23.
ClarkeAHoweAMMitchellJStanilandJHawkesLLeeperK. Mechanism of anomalously increased oil displacement with aqueous viscoelastic polymer solutions. Soft matter (2015) 11:3536–41. 10.1039/c5sm00064e
24.
MitchellJLyonsKHoweAMClarkeA. Viscoelastic polymer flows and elastic turbulence in three-dimensional porous structures. Soft Matter (2016) 12:460–8. 10.1039/C5SM01749A
25.
ParsaSSantanach-CarrerasEXiaoLWeitzDA. Origin of anomalous polymer-induced fluid displacement in porous media. Phys Rev Fluids (2020) 5:022001. 10.1103/PhysRevFluids.5.022001
26.
HuifenXDeminWJunzhengWFanshunK. Elasticity of hpam solutions increases displacement efficiency under mixed wettability conditions. In: SPE Asia Pacific Oil and Gas Conference and Exhibition. APOGCE (2004). p. 103–10. 10.2523/88456-ms
27.
QiPEhrenfriedDHKohHBalhoffMT. Reduction of residual oil saturation in sandstone cores by use of viscoelastic polymers. SPE J (2017) 22:447–58. 10.2118/179689-PA
28.
SalmoICSorbieKSSkaugeA. The impact of rheology on viscous oil displacement by polymers analyzed by pore-scale network modelling. Polymers (2021) 13:1259. 10.3390/polym13081259
29.
UrbissinovaTSTrivediJJKuruE. Effect of elasticity during viscoelastic polymer flooding: A possible mechanism of increasing the sweep efficiency. J Can Pet Techn (2010) 49:49–56. 10.2118/133471-PA
30.
ClarkeAHoweAMMitchellJStanilandJHawkesLA. How viscoelastic-polymer flooding enhances displacement efficiency. SPE J (2016) 21:0675–87. 10.2118/174654-PA
31.
RockAHincapieRETahirMLangankeNGanzerL. On the role of polymer viscoelasticity in enhanced oil recovery: Extensive laboratory data and review. Polymers (2020) 12:2276–43. 10.3390/polym12102276
32.
BeaumontJBodiguelHColinA. Drainage in two-dimensional porous media with polymer solutions. Soft Matter (2013) 9:10174–85. 10.1039/c3sm51480c
33.
WeiBRomero-ZerónLRodrigueD. Oil displacement mechanisms of viscoelastic polymers in enhanced oil recovery (eor): A review. J Pet Exploration Prod Techn (2014) 4:113–21. 10.1007/s13202-013-0087-5
34.
EkanemEMRückerMYesufu-RufaiSSpurinCOoiNGeorgiadisAet alNovel adsorption mechanisms identified for polymer retention in carbonate rocks. JCIS Open (2021) 4:100026. 10.1016/j.jciso.2021.100026
35.
ZhuSZhangSXueXZhangJXuJLiuZ. Influencing factors for effective establishment of residual resistance factor of polymer solution in porous media. J Polym Res (2022) 29:210–0. 10.1007/s10965-022-03066-7
36.
XieCXuKMohantyKWangMBalhoffMT. Nonwetting droplet oscillation and displacement by viscoelastic fluids. Phys Rev Fluids (2020) 5:063301. 10.1103/PhysRevFluids.5.063301
37.
KawaleDMarquesEZithaPLKreutzerMTRossenWRBoukanyPE. Elastic instabilities during the flow of hydrolyzed polyacrylamide solution in porous media: Effect of pore-shape and salt. Soft Matter (2017) 13:765–75. 10.1039/c6sm02199a
38.
BrowneCADattaSS. Elastic turbulence generates anomalous flow resistance in porous media. Sci Adv (2021) 7:eabj2619. 10.1126/sciadv.abj2619
39.
LimaNMAvendañoJCarvalhoMS. Effect of viscoelasticity on oil displacement in a microfluidic porous medium. J Braz Soc Mech Sci Eng (2022) 44:144–10. 10.1007/s40430-022-03435-9
40.
WangDWangGWuWXiaHYinH. The influence of viscoelasticity on displacement efficiency–from micro to macro scale. In: SPE annual technical conference and exhibition. Anaheim, California: Society of Petroleum Engineers (2007). 10.2118/109016-MS
41.
FanJCWangFCChenJZhuYBLuDTLiuHet alMolecular mechanism of viscoelastic polymer enhanced oil recovery in nanopores. R Soc Open Sci (2018) 5:180076. 10.1098/rsos.180076
42.
Galindo-RosalesFJCampo-DeañoLSousaPCRibeiroVMOliveiraMSAlvesMAet alViscoelastic instabilities in micro-scale flows. Exp Therm Fluid Sci (2014) 59:128–39. 10.1016/j.expthermflusci.2014.03.004
43.
BrowneCAShihADattaSS. Pore-scale flow characterization of polymer solutions in microfluidic porous media. Small (2020) 16:1903944. 10.1002/smll.201903944
44.
KumarMGuastoJSArdekaniAM. Transport of complex and active fluids in porous media. J Rheology (2022) 66:375–97. 10.1122/8.0000389
45.
HemingwayEClarkeAPearsonJFieldingS. Thickening of viscoelastic flow in a model porous medium. J Non-Newtonian Fluid Mech (2018) 251:56–68. 10.1016/j.jnnfm.2017.11.002
46.
QinBArratiaPE. Characterizing elastic turbulence in channel flows at low Reynolds number. Phys Rev Fluids (2017) 2:083302–14. 10.1103/PhysRevFluids.2.083302
47.
QinBSalipantePFHudsonSDArratiaPE. Flow resistance and structures in viscoelastic channel flows at low re. Phys Rev Lett (2019) 123:194501. 10.1103/PhysRevLett.123.194501
48.
KhomamiBMorenoLD. Stability of viscoelastic flow around periodic arrays of cylinders. Rheologica Acta (1997) 36:367–83. 10.1007/BF00396324
49.
IchikawaYMotosukeM. Viscoelastic flow behavior and formation of dead zone around triangle-shaped pillar array in microchannel. Microfluidics and Nanofluidics (2022) 26:44–12. 10.1007/s10404-022-02549-9
50.
HawardSJHopkinsCCShenAQ. Stagnation points control chaotic fluctuations in viscoelastic porous media flow. Proc Natl Acad Sci (2021) 118:e2111651118. 10.1073/pnas.2111651118
51.
WalkamaDMWaisbordNGuastoJS. Disorder suppresses chaos in viscoelastic flows. Phys Rev Lett (2020) 124:164501. 10.1103/PhysRevLett.124.164501
52.
DeSKuipersJAPetersEAPaddingJT. Viscoelastic flow past mono- and bidisperse random arrays of cylinders: Flow resistance, topology and normal stress distribution. Soft Matter (2017) 13:9138–46. 10.1039/c7sm01818e
53.
GillissenJJJ. Viscoelastic flow simulations through an array of cylinders. Phys Rev E (2013) 87:023003. 10.1103/PhysRevE.87.023003
54.
EkanemEMBergSDeSFadiliABultreysTRückerMet alSignature of elastic turbulence of viscoelastic fluid flow in a single pore throat. Phys Rev E (2020) 101:042605. 10.1103/PhysRevE.101.042605
55.
Galindo-RosalesFJCampo-DeañoLPinhoFTVan BokhorstEHamersmaPJOliveiraMSet alMicrofluidic systems for the analysis of viscoelastic fluid flow phenomena in porous media. Microfluidics and Nanofluidics (2012) 12:485–98. 10.1007/s10404-011-0890-6
56.
KumarMAramidehSBrowneCADattaSSArdekaniAM. Numerical investigation of multistability in the unstable flow of a polymer solution through porous media. Phys Rev Fluids (2021) 6:033304–39. 10.1103/PhysRevFluids.6.033304
57.
EkanemEMBergSDeSFadiliALuckhamP. Towards predicting the onset of elastic turbulence in complex geometries. Transport in Porous Media (2022) 1–18. 10.1007/s11242-022-01790-8
58.
ShakeriPJungMSeemannR. Effect of elastic instability on mobilization of capillary entrapments. Phys Fluids (2021) 33:113102. 10.1063/5.0071556
59.
HolzwarthG. Molecular weight of xanthan polysaccharide. Carbohydr Res (1978) 66:173–86. 10.1016/S0008-6215(00)83250-4
60.
SorbieK. Polymer-improved oil recovery. Dordrecht, Netherlands: Springer Netherlands (2013). 10.1007/978-94-011-3044-8
61.
MahajanSYadavHRellegadlaSAgrawalA. Polymers for enhanced oil recovery: Fundamentals and selection criteria revisited. Appl Microbiol Biotechnol (2021) 105:8073–90. 10.1007/s00253-021-11618-y
62.
ShakeriPJungMSeemannR. Scaling purely elastic instability of strongly shear thinning polymer solutions. Phys Rev E (2022) 105:L052501. 10.1103/PhysRevE.105.L052501
63.
DobryninAVColbyRHRubinsteinM. Scaling theory of polyelectrolyte solutions. Macromolecules (1995) 28:1859–71. 10.1021/ma00110a021
64.
MezgerT. The rheology handbook: For users of rotational and oscillatory rheometers. Hannover, Germany: Vincentz Network (2020). 10.1515/9783748603702
65.
BodiguelHBeaumontJMachadoAMartinieLKellayHColinA. Flow enhancement due to elastic turbulence in channel flows of shear thinning fluids. Phys Rev Lett (2015) 114:028302–5. 10.1103/PhysRevLett.114.028302
66.
SouliesAAubrilJCastelainCBurgheleaT. Characterisation of elastic turbulence in a serpentine micro-channel. Phys Fluids (2017) 29:083102. 10.1063/1.4996356
67.
CasanellasLAlvesMAPooleRJLerougeSLindnerA. The stabilizing effect of shear thinning on the onset of purely elastic instabilities in serpentine microflows. Soft Matter (2016) 12:6167–75. 10.1039/c6sm00326e
68.
MacoskoCW. Rheology principles, measurements, and applications, 86. New York, NY: Wiley VCH (1994).
69.
BarnesHAHuttonJFWaltersK. An introduction to rheology, 3. Amsterdam, Netherlands:: Elsevier (1989).
70.
BurgheleaTBertolaV. Transport phenomena in complex fluids, 598. Cham, Switzerland: Springer (2020). 10.1007/978-3-030-35558-6
71.
WhiteJLMetznerAB. Development of constitutive equations for polymeric melts and solutions. J Appl Polym Sci (1963) 7:1867–89. 10.1002/app.1963.070070524
72.
TsengH-C. A revisitation of white-metzner viscoelastic fluids. Phys Fluids (2021) 33:057115. 10.1063/5.0049132
73.
ANSYS. Ansys polyflow user’ s guide. Canonsburg, PA: ANSYS inc. (2020). ANSYS Polyflow User’ s guide 2020 R1.
74.
MorozovANvan SaarloosW. An introductory essay on subcritical instabilities and the transition to turbulence in visco-elastic parallel shear flows. Phys Rep (2007) 447:112–43. 10.1016/j.physrep.2007.03.004
75.
PakdelPMcKinleyGH. Elastic instability and curved streamlines. Phys Rev Lett (1996) 77:2459–62. 10.1103/PhysRevLett.77.2459
76.
McKinleyGHPakdelPÖztekinA. Rheological and geometric scaling of purely elastic flow instabilities. J Non-Newtonian Fluid Mech (1996) 67:19–47. 10.1016/S0377-0257(96)01453-X
77.
YaoGZhaoJYangHHarunaMAWenD. Effects of salinity on the onset of elastic turbulence in swirling flow and curvilinear microchannels. Phys Fluids (2019) 31:123106. 10.1063/1.5120459
78.
BergSvan WunnikJ. Shear rate determination from pore-scale flow fields. Transport in Porous Media (2017) 117:229–46. 10.1007/s11242-017-0830-3
79.
DeSKrishnanPvan der SchaafJKuipersJPetersEPaddingJ. Viscoelastic effects on residual oil distribution in flows through pillared microchannels. J Colloid Interf Sci (2018) 510:262–71. 10.1016/j.jcis.2017.09.069
80.
ShaqfehES. Purely elastic instabilities in viscometric flows. Annu Rev Fluid Mech (1996) 28:129–85. 10.1146/annurev.fl.28.010196.001021
81.
GroismanASteinbergV. Elastic turbulence in a polymer solution flow. Nature (2000) 405:53–5. 10.1038/35011019
82.
GroismanASteinbergV. Stretching of polymers in a random three-dimensional flow. Phys Rev Lett (2001) 86:934–7. 10.1103/PhysRevLett.86.934
83.
GroismanASteinbergV. Elastic turbulence in curvilinear flows of polymer solutions. New J Phys (2004) 6:29. 10.1088/1367-2630/6/1/029
84.
DattaSSArdekaniAMArratiaPEBerisANBischofbergerIMcKinleyGHet alPerspectives on viscoelastic flow instabilities and elastic turbulence. Phys Rev Fluids (2022) 7:080701. 10.1103/PhysRevFluids.7.080701
85.
JamesDF. N1 stresses in extensional flows. J Non-Newtonian Fluid Mech (2016) 232:33–42. 10.1016/j.jnnfm.2016.01.012
86.
DeSKuipersJAPetersEAPaddingJT. Viscoelastic flow simulations in model porous media. Phys Rev Fluids (2017) 2:053303–21. 10.1103/PhysRevFluids.2.053303
87.
PooleRJ. Three-dimensional viscoelastic instabilities in microchannels. J Fluid Mech (2019) 870:1–4. 10.1017/jfm.2019.260
88.
MokhtariOLatchéJ-CQuintardMDavitY. Birefringent strands drive the flow of viscoelastic fluids past obstacles. J Fluid Mech (2022) 948:A2. A2. 10.1017/jfm.2022.565
89.
ZilzJPooleRJAlvesMABartoloDLevachéBLindnerA. Geometric scaling of a purely elastic flow instability in serpentine channels. J Fluid Mech (2012) 712:203–18. 10.1017/jfm.2012.411
90.
ShakeriPJungMSeemannR. Characterizing purely elastic turbulent flow of a semi-dilute entangled polymer solution in a serpentine channel. Phys Fluids (2022) 34:073112. 10.1063/5.0100419
91.
PooleRLindnerAAlvesM. Viscoelastic secondary flows in serpentine channels. J Non-Newtonian Fluid Mech (2013) 201:10–6. 10.1016/j.jnnfm.2013.07.001
92.
DuclouéLCasanellasLHawardSJPooleRJAlvesMALerougeSet alSecondary flows of viscoelastic fluids in serpentine microchannels. Microfluidics and Nanofluidics (2019) 23:33. 10.1007/s10404-019-2195-0
93.
SonY. Determination of shear viscosity and shear rate from pressure drop and flow rate relationship in a rectangular channel. Polymer (2007) 48:632–7. 10.1016/j.polymer.2006.11.048
94.
MachadoABodiguelHBeaumontJClissonGColinA. Extra dissipation and flow uniformization due to elastic instabilities of shear-thinning polymer solutions in model porous media. Biomicrofluidics (2016) 10:043507. 10.1063/1.4954813
95.
FouxonALebedevV. Spectra of turbulence in dilute polymer solutions. Phys Fluids (2003) 15:2060–72. 10.1063/1.1577563
96.
SteinbergV. Scaling relations in elastic turbulence. Phys Rev Lett (2019) 123:234501. 10.1103/PhysRevLett.123.234501
97.
KolmogorovANLevinVHuntJCRPhillipsOMWilliamsD. Dissipation of energy in the locally isotropic turbulence. Proceed R Soci. Lond Ser. A: Math. Phy. Sci. (1991) 434:15–7. 10.1098/rspa.1991.0076
Summary
Keywords
porous media, viscoelastic flow, purley elastic instability, elastic secondary flow, capillary entrapment, microfluidic
Citation
Jung M, Shakeri P and Seemann R (2023) Effect of viscoelasticity on displacement processes in porous media. Front. Phys. 11:1099073. doi: 10.3389/fphy.2023.1099073
Received
15 November 2022
Accepted
10 January 2023
Published
24 January 2023
Volume
11 - 2023
Edited by
Marcel Moura, University of Oslo, Norway
Reviewed by
Senyou An, Imperial College London, United Kingdom
Laurent Talon, Automatique et Systèmes Thermiques (FAST), France
Updates
Copyright
© 2023 Jung, Shakeri and Seemann.
This is an open-access article distributed under the terms of the Creative Commons Attribution License (CC BY). The use, distribution or reproduction in other forums is permitted, provided the original author(s) and the copyright owner(s) are credited and that the original publication in this journal is cited, in accordance with accepted academic practice. No use, distribution or reproduction is permitted which does not comply with these terms.
*Correspondence: Michael Jung, michael.jung@physik.uni-saarland.de
†These authors have contributed equally to this work
This article was submitted to Interdisciplinary Physics, a section of the journal Frontiers in Physics
Disclaimer
All claims expressed in this article are solely those of the authors and do not necessarily represent those of their affiliated organizations, or those of the publisher, the editors and the reviewers. Any product that may be evaluated in this article or claim that may be made by its manufacturer is not guaranteed or endorsed by the publisher.