 Xu Han
 Qizi Huangpeng1
 Qiannan Gao
- 1College of Science, National University of Defense Technology, Changsha, China
- 2Informatization Construction and Management Center, Inner Mongolia University of Finance and Economics, Hohhot, China
Data center, as the core infrastructure of data storage and processing, calls for network security protection. Information security has been addressed in a number of specific ways. However, there are few studies that employ network topology features to prevent the transmission of viruses. When a virus spreads, different topologies display various properties. In this paper, we study three types of data center network topologies, i.e., Fat-tree, Leaf-spine, and Bcube, and quantify the propagation characteristics in every topology through the IC propagation model. The probability of the device being infected, the count of propagation sources, the access of propagation sources, and the topological parameters are all considered. Given that network security defenders can only change the topology and topological parameters, we propose a computational framework that combines factor analysis, which provides us with the selection of network topological parameters with a low virus propagation rate in the candidate parameter set. Through experiments, we find that Leaf-spine has a good inhibitory effect on viruses with high propagation probability. Meanwhile, each offers unique advantages. We hope that more data center network topologies will be studied to improve the security of all data centers using these network topologies.
1 Introduction
The academic and professional worlds have always been concerned about cybersecurity. Network penetration and theft of high-value data are the principal aims of modern network intrusion [1, 2]. The data center, the core of data storage and processing, is a primary target for cyber attackers, who can penetrate networks, plant Trojans, and lurk to obtain information. Critical network devices are transit points for passwords and essential information, and the prying into data center networks can lead to access to high-value confidential information. Passwords and other vital information travel through critical network devices, and hacking into data center networks can provide access to precious secret information. International cyber security firm Symantec published a study on the “Stuxnet” virus in June 2010 which was thought to have attacked Iran’s industrial complexes’ control systems. The virus was developed to exploit system vulnerabilities, including flaws in the Siemens industrial control system and two previously unknown Windows system flaws via a USB stick; once the malware was introduced into the control system’s intranet, it spread quickly and infected devices in the network, and then modified program commands, leading to an abnormal acceleration of the centrifuges producing enriched uranium to a level beyond their design limits and causing 1/5 of the centrifuges to be scrapped, which shows that the security of the data center network directly impacts the security of data in the data center.
1.1 Related work
Here, we will first briefly introduce the development of data center networks and present two kinds of representative topologies. Secondly, we will introduce the propagation models associated with computer viruses, including the information propagation model and the infectious disease model.
The data center is the main information infrastructure for cloud computing, according to the data center network and topology [3, 4]. A data center typically comprises one or more computer clusters supporting network, storage, security, power, administration, and software systems. The data center offers important cloud services like GPS, Bigtable, Dryad, MapReduce, etc.
The performance of the data center network directly determines that of cloud computing, which further affects the computing power of the entire process. Nowadays, The center networks need to function better on the network. The data center network must support numerous huge servers while handling numerous massive distributed computing jobs. As the core component of the data center, the data center network connects a large number of servers and switching devices through high-speed links and provides efficient and reliable services of communication and data transmission between servers; on the other hand, under the context of cloud computing, the data center network operates in a different mode from the traditional interconnected networks of Ethernet, grid and distributed computing systems, which has higher requirements in terms of scalability, reliability, and cost.
The data center network topology has its structural design. According to whether the server has the forwarding function, it can be classified into two categories: switch-centric and server-centric. In a switch-centric network, the routing of lines is done by the switch. This type of topology can be improved by the interconnection of more switching devices or the introduction of optical links in the data center.
According to the literature review [5–7], the existing network topologies are classified into the two categories mentioned above, and the representatives of each category are selected. Network topologies are selected in light of their use in engineering practices. In particular, switch-centric network topologies mainly include Fat-tree [8], Spine-leaf [9], etc., while server-centric network topologies mainly include Bcube [10], Dcell [12], etc [13–20]. Consequently, in our analysis, we concentrate on these three categories of topologies. Fat-tree is a tree-like network topology composed of root nodes, core nodes, edge nodes, and leaf nodes. It has evenly distributed connections between nodes, offering high connectivity, low latency, and high throughput [6]. Thus, it is an ideal choice for constructing data center networks due to its capability for large-scale network deployment. Particularly, we observe that many institutions of higher learning and businesses have chosen the conventional network topology, Fat-tree. Depending on the size of the institution, the data center network’s device count is modified. Our survey also reveals that many data center network solution suppliers are pushing Spine-leaf since it can be converted from Fat-tree and offers the best east-west traffic throughput. We also brought Bcube into a comprehensive comparison. Dcell is a two-dimensional network topology with a direct connection between the hosts and switches, and provides high scalability and low latency. Bcube is a three-dimensional topology with a cube-like structure. Dcell is highly scalable and has low latency, but has a limited number of connections. Bcube is highly scalable and has high throughput, but is complex and has higher latency [11]. The literature review includes server-centric network topologies like Dcell and Bcube as well. LaScaDa is a two-dimensional topology that combines the advantages of both Dcell and Bcube and provides high scalability, low latency, and high throughput [13]. Because of its similarities to Dcell but later suggested date, Bcube is chosen for a detailed comparison.
In sum, the literature on computer virus propagation models mainly focuses on updating the propagation dynamics to make it more relevant to the actual situations. The literature quantifies the propagation scale in a steady state through models [21]. For example, the final equilibrium infection scale can be derived from the updated propagation model.
Scale-free and small-world networks are mainly model networks used in the literature [22] It is still challenging for small-world networks and scale-free networks to accurately reflect the internal intricacies of real networks, even though they can fit some real networks; especially with the development and popularization of mobile communication technology, the connectivity of communication networks has changed dramatically. It is unsuitable for fitting data center networks with small-world and scale-free networks. A large number of realistic computer propagation models are studied in the literature, making important contributions to information security. In practice, data center networks have inherent network topologies, which have different variations that may not be easily abstracted through scale-free and small-world networks.
1.2 Main contribution
The innovations and contributions of this paper are demonstrated in the following aspects.
To study the structural security of networks, a model of information transmission over complex networks is introduced in the study of data center network topologies. The computer virus propagation scale can be used to assess the capability of the network topology itself to inhibit the spread of viruses. According to our literature review, this is a new attempt to apply the propagation model to data center network topologies. We simulate and compare the performance of three network topologies on different parameters with different counts of propagation sources, different propagation source accesses, different probabilities of being infected, and different network sizes. The results guide network topology planning and development, particularly for institutional organizations when communication needs outweigh security requirements. We expect that data center networks’ structural security will be taken seriously.
A proposed computational method uses a factor analysis approach to choose the secure network topological parameters. This framework enables us to calculate and select a secure structural parameter set, i.e., to obtain a more secure network structure. The network topology under the optimized parameter set can inhibit virus propagation. In this paper, we use factor analysis to reduce the data dimensionality, taking the data of propagation scale in multiple scenarios as variables. Factors with higher contribution to variance in the variables are extracted, the combination of which can be used to score a structural parameter set, as it contains information on multiple variables.
This computational approach is intended to assist network security maintenance teams in choosing parameter sets that effectively suppress virus spread when maintaining their networks. Additionally, we hope that more research will be given to examining the characteristics of various network topologies in order to safeguard existing networks.
2 Methods
In this paper, we need to simulate the propagation of computer viruses on data center networks through propagation models to obtain data on the propagation scale. While most of the current work on the simulation of computer virus propagation has focused on communication networks, this paper provides a separate and detailed study of emerging data center networks. In the previous literature, homogeneous networks, small-world networks, and scale-free networks have been used to fit communication networks because communication networks do not have a fixed topology, and real networks have the properties of scale-free and small-world networks. In contrast, data center networks have their topologies without a need for the fitting process. The propagation performance of data center networks can be calculated directly, which is closer to the real situation.
In the first step, the propagation data in different scenarios are solved and used as a variable set. The IC model (Independent Cascade Model) is used for calculation and simulation. The data center network topology exhibits different performances in different scenarios, which are considered variables for that network topology [19]. And all variable groups have been resolved. In the second step, factor analysis is done on numerous variables. The primary factor combinations are used to evaluate the capacity of candidate groups of network topological parameters to propagate. This step involves calculating the loading matrix, the primary factors, the rotations of the factors, and ultimately the scores for each candidate group.
2.1 Step 1: construction of variable sets using IC model
In this paper, we solve the IC model (Independent Cascade Model) through the Monte Carlo method to obtain the propagation scale in different cases. The solution for the IC model is an NP-hard problem; using the Monte Carlo method makes the solution easier. The number of nodes in the network ranges from 3,000 to 10,000. This interval is the size of a common data center network. A 10,000-node network is computed in seconds.
The IC model is among the more classical influence propagation models in influence maximization tasks. The reason for choosing this model is that the nodes can only be activated once during the propagation, and the way the computer virus interacts with the infected device can be described accurately. Patches are not yet published when faced with a 0day virus. The computer device is either infected or permanently free from infection, and there is no need to consider the recovery rate. The IC model can accurately portray this property. Also, the IC model is more suitable for this situation than SIR. In short-term virus propagation, computer viruses spread through the network in seconds, leaving insufficient time to consider the “cure” process by patching; Whether a computer device can be infected depends on various factors such as virus type, device port conditions, anti-virus hardware, and software, etc. The IC model can control the propagation probability parameters and is suitable for describing the above scenarios.
The IC model is described as follows: for a specific propagating entity, each node in the network has two possible states: inactive and active. The inactive state means that the point has not yet received the corresponding entity, while the active state means the opposite. A node changing from an inactive state to an active state indicates that the node has accepted the corresponding entity, or put in another way, has been activated. The steps of propagation are described as follows. If there is an edge
Our improvement to the IC model is mainly made by modifying the calculation method of transmission probability. In the traditional IC model, the probability of a node being activated is calculated according to the in-degree of the node to be activated. In our scenarios, the probability of the device being infected is only related to the properties of nodes and edges, so the probability of the node being activated is calculated according to the probability of the device being infected. Therefore, the propagation probability in the modified IC model is calculated according to the reception probability of the node.
2.2 Step2: extraction of the common factors of variables and scoring
After we get the virus propagation scale in different scenarios, we need to perform aggregation and dimensionality reduction on the data and score the network topological parameter sets, as in Figure 1. Based on the characteristics of the data, factor analysis is used to reduce the dimensionality of data and score the topological parameter sets. Factor analysis is based on the idea of dimensionality reduction, in which numerous variables are aggregated into a few independent common factors with as little loss of original data information as possible. The common factors can reflect the main information of the original variables, showing the intrinsic connection between variables with a reduced number of variables. Through the factor analysis process, we can calculate the common factors after dimensionality reduction, the factor weights, and the composite score of the parameter group.
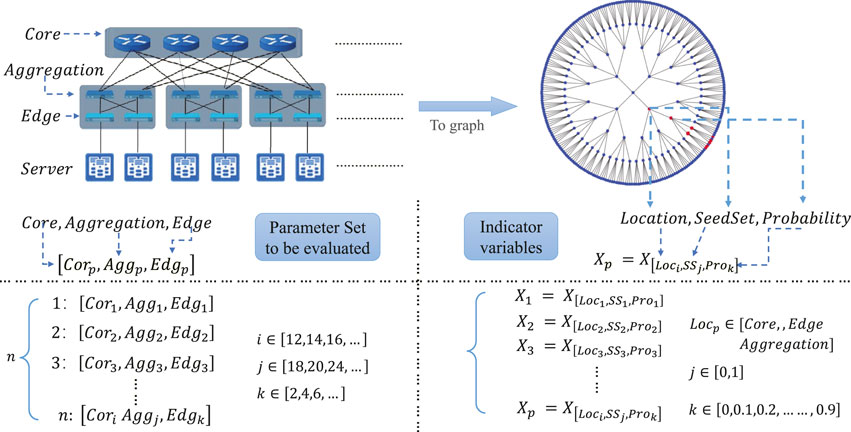
FIGURE 1. We first transform the real network into a network object. The propagation model is used in the network. But the propagation starting position, the number of propagation sources, and the propagation probability will affect the propagation scale. Therefore the propagation scale with different variables (situations) will be obtained, i.e., the indicator variables are obtained. The inputs to the general factor analysis are indicator variables and evaluation objects. The indicator variable is the propagation scale in different cases. Our aim is to reduce the dimensionality of the multidimensional. For example, if represents, i.e., it represents the propagation range at probability = 0.1, Seedset = 1, and Access = Edge.
The main steps of applying factor analysis are as follows. Standardize the given data samples, calculate the correlation matrix R of the samples, obtain the eigenvalues and eigenvectors of the matrix R, determine the number of main factors according to the cumulative contribution degree required by the system, calculate the factor loading matrix A, and finally determine the factor model.
The above steps aim to obtain the factor model, the score for each factor, and finally, the combined score of factors. Specifically, the topological parameter group is the input for the model, and a set of network topological variables constitute the parameter group. The virus propagation scale obtained from calculating different parameters is the value corresponding to each variable group. Through the factor analysis, the correlation between the factor and each variable value is obtained. The composite score of each candidate is obtained from the factor model. It should be noted that the data of the virus propagation scale can pass the correlation check. Calculated in the same network topology to obtain the propagation scale, the variable values are naturally correlated.
Specifically, set
Here,
Through the factor analysis, the common characteristics of the data on the propagation scale are concluded. The data is obtained under different sets of parameters. The special factors are independent of each other and of all the common factors. Each common factor is an independent normal random variable with a mean of 0 and a variance of 1, and its covariance matrix is a unit matrix
The larger the absolute value of the factor loading matrix, the higher the closeness of the correlation, and the contribution is statistically significant. If
3 Experiment: main factors affecting the propagation scale
Different viruses use different techniques and thus have different probabilities of propagation. Our simulation will mainly focus on the characteristics of 0day vulnerability viruses, that is, the high probability of infecting a computer. Viruses that use traditional techniques are less likely to infect a computer than the former because they are easily detected by anti-virus means.
This section will discuss the relationship between each variable and the virus propagation scale. The following paragraphs are organized according to different network topologies. There are five variables that have different contributions to the influence on the virus propagation scale, including the probability of the device being infected in the data center network, the access of the propagation source, the number of propagation sources, the data center network topological parameter, and the data center network topology architecture. The range of values of each variable and the reasons for their selection are shown in the table. It should be noted that each virus propagation scale is obtained by averaging 500 simulations with the IC model.
Ranges for each variable in Leaf-spine, Fat-tree, and Bcube network were summarized in the table. These tables are placed in the Supplemental Material S1. You can quickly check the variables with these tables.
3.1 Experiments in Leaf-spine network
Introduction of Leaf-spine in this architecture: at the upper layer are the core switches, and at the lower layer is the access-layer switches, with up to 24 or 48 ports.
The selection of ranges for each variable is explained as follows.
⁃ Regarding the probability of the device being infected, we have considered calculating it according to the propagation probability of the source in a point-to-point relationship. But this does not correspond to the realistic situation, where whether the virus will infect the device depends on many factors, such as the opening of the device port, the installation of the device patch, the use of a 0-day vulnerability in the virus, etc. So the probability of a device being infected is used to describe the situations mentioned above. This modification is already mentioned in the method section.
⁃ Regarding the access of propagation sources, the number of devices at the spine layer, leaf layer, and server layer is taken as variables of the propagation source access. In the experiments, these accesses are used as sources for the simulated propagation. Specifically, the server layer is added as a scenario in the experimental simulation. As it is a common scenario that a virus invades a personal PC via email, the server layer as a propagation source access is used in the simulation to describe this scenario, even though the server layer is not part of the network in the data center network.
⁃ Regarding the count of propagation sources, we demonstrate the cases where the count is 1,3,5. We mainly show the three values that have differences. And we also experiment for the cases where the count is 1–10.
⁃ Regarding the Spine-leaf network topological parameters, we mainly adjusted the number of devices at the Leaf layer. The Leaf layer is the central layer of the network, with the number of devices at the upper and lower layers set according to the number of ports of the switches at the middle layer. Specifically, the devices at the Leaf layer generally switch with medium processing power, with fewer ports linked to the upper layer than those linked to the lower layer. The number of ports linked to the lower layer is generally 24 or 48. To keep the number of network nodes roughly the same, we set the number of devices at the server layer as 48 and 24.
There are separate characteristics of propagation when the access is the server layer. The count of propagation sources is also basically linearly and positively correlated with the propagation scale. With low launching costs, this kind of phishing email can be executed with multiple propagation sources. Experiments show that the propagation scale caused by attacks against the server layer of the network is cumulative. Figure 2 focuses on the effect of the count of propagation sources on the propagation scale.
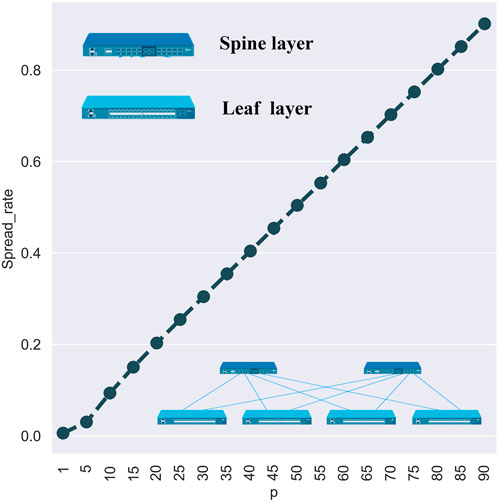
FIGURE 2. Basically, there is a positive linear correlation between and spread rate. Some abnormal outliers are caused by the differences between other variables, e.g., different counts of propagation sources. When the propagation source access is the server layer, there will be a separate propagation characteristic, which means that the count of propagation sources is linearly and positively correlated with the propagation scale. As the Server layer serves as the base layer, new propagation sources may be distributed in various network branches. When the access is Leaf or Spine layer, the growth of the count tends to speed up first and then slow down. Both the Leaf and the Spine layers are the core switch layer of the data center network with high interconnectivity, leading to the virus's widespread in the early stage. And the increased count of propagation sources in the later stage may cause repeated propagation in the specific network branch.
In summary, in the Leaf-spine architecture, the probability of the device being infected (
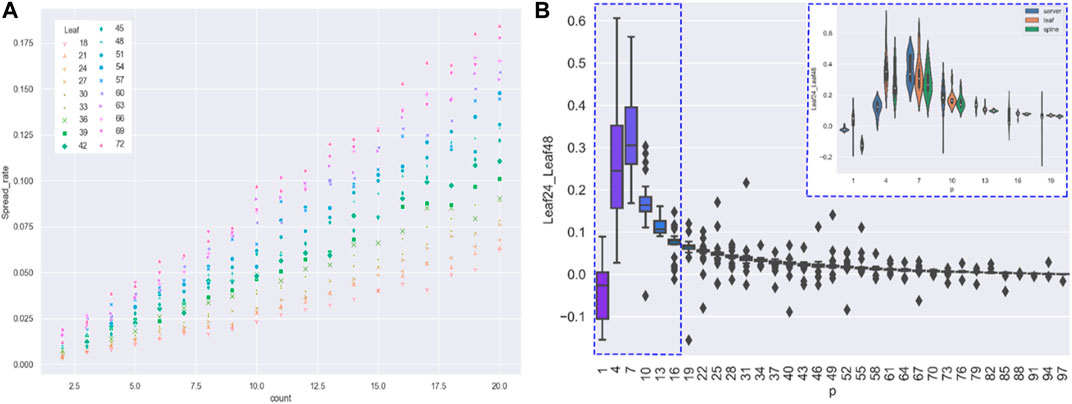
FIGURE 3. (A) This figure focuses on the effect of the change in the number of devices in the Leaf layer on the propagation size. On the horizontal axis is the probability of a device being propagated ; the scatters are divided into three categories according to the number of devices at the Leaf layer; on the vertical axis is the spread rate; and the label shows the number of nodes in the leaf layer. The experiment shows that for the same network size, the fewer the number of devices in the leaf layer, the smaller the propagation scale. Exceptionally, the above conclusion is made only when the propagation source access is the server layer. The conclusion also holds for the scenario of email-borne worms. (B) This figure is a separate discussion on the case of the propagation source access being the server layer because of the special nature of propagation for that source access. The experiment shows that the network topology with a small number of devices at the Leaf layer has an advantage when the number of propagation sources varies. The count of propagation sources and the probability of a device being infected jointly affect the virus spread rate when the server layer is the access. Parameter setting: Spine = 18.
3.2 Experiments in fat-tree networks
Fat-tree is a traditional topology commonly used today. It generally consists of three layers, i.e., the core layer, aggregation layer and access layer. The core layer is carried by a core switch with high throughput performance. The aggregation layer carries the data traffic in the east-west direction.
⁃ The reasons for the range of values of the probability of the device being infected are described in the section of Leaf-spine topology. For the count of propagation sources, we choose a relatively small value. In the experiment, we assume that basic border security measures are taken in the data center network. And in light of the realistic situation of network penetration and intrusion by viruses, the set of values from 1 to 5 is considered.
⁃ For the network topological parameters, the total number of nodes needs to approximate that of other network topologies for subsequent comparison with other topologies, so we use the set of parameters 10–15 to form a network with a total of 1k-2k nodes.
According to the experimental results, there is a correlation between the probability of the device being infected p and the spread rate, as shown in Figures 4, 5. When
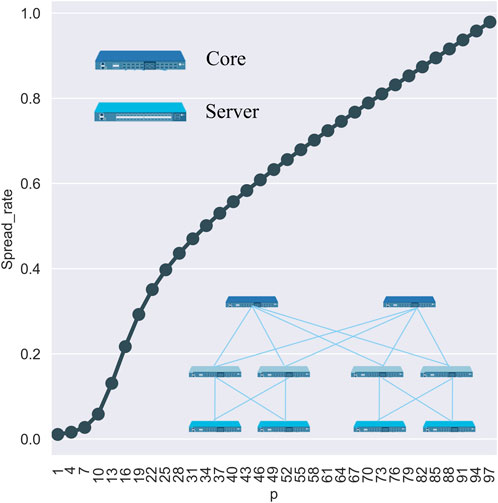
FIGURE 4. This figure is a general overview of the main factors influencing the infection scale of devices in the Fat-tree network topology. On the horizontal axis is the different propagation probabilities p, and on the vertical axis is the spread-rate, namely, the virus propagation scale; Access is the starting point of the propagation source; the lines in different colors represent the count of propagation sources, and N_Fat_tree represents the topological parameters of the Fat-tree topology.
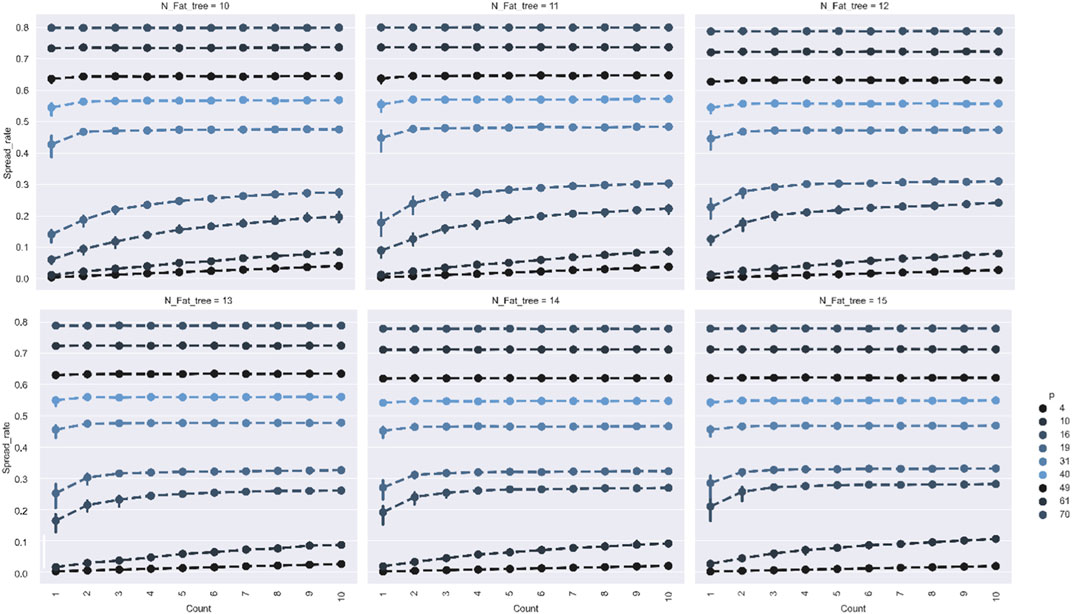
FIGURE 5. This figure explores the relationship between the propagation source Count and the scale of infection. is the probability of the device being infected; spread_rate is the infection rate, and lines in different colors represent different Counts of propagation source. Vertically, it indicates the propagation effect under different network sizes. A single row indicates the change in propagation scale when the count of propagation sources varies. The impact of changing the source access on the final propagation scale decreases when the count of sources increases. When the source access is the server layer, the count of sources has a greater impact on the virus propagation scale. That is, in terms of the capability of a single propagation source, the propagation scale is lower when the propagation source access is the server layer than in other layers.
In summary, some generalized conclusion are verified through experiments, including the following: Under the same conditions, the source access with the greatest propagation effect is the core layer.
⁃ Under the same conditions, the source access with the greatest propagation effect is the core layer.
⁃ The probability of the device being infected
For Fat-tree, there are some special findings, including the following, as shown in Figure 6.
⁃ Under the condition where other variables are the same, the probability of a device being infected has a greater influence on the final propagation scale than the other two factors.
⁃ When the access of the propagation source is the server layer, the virus propagation scale is mainly influenced by both the count of propagation sources and the probability of a device being infected.
⁃ Leaf-spine has an advantage over Fat-tree in inhibiting virus propagation for highly penetrative viruses and Trojans. Fat-tree and Spine-leaf are the data center network topologies commonly used today. Both are switch-centric networks apt to common applications. In practical scenarios, one can make adaptations to obtain better network structure security.
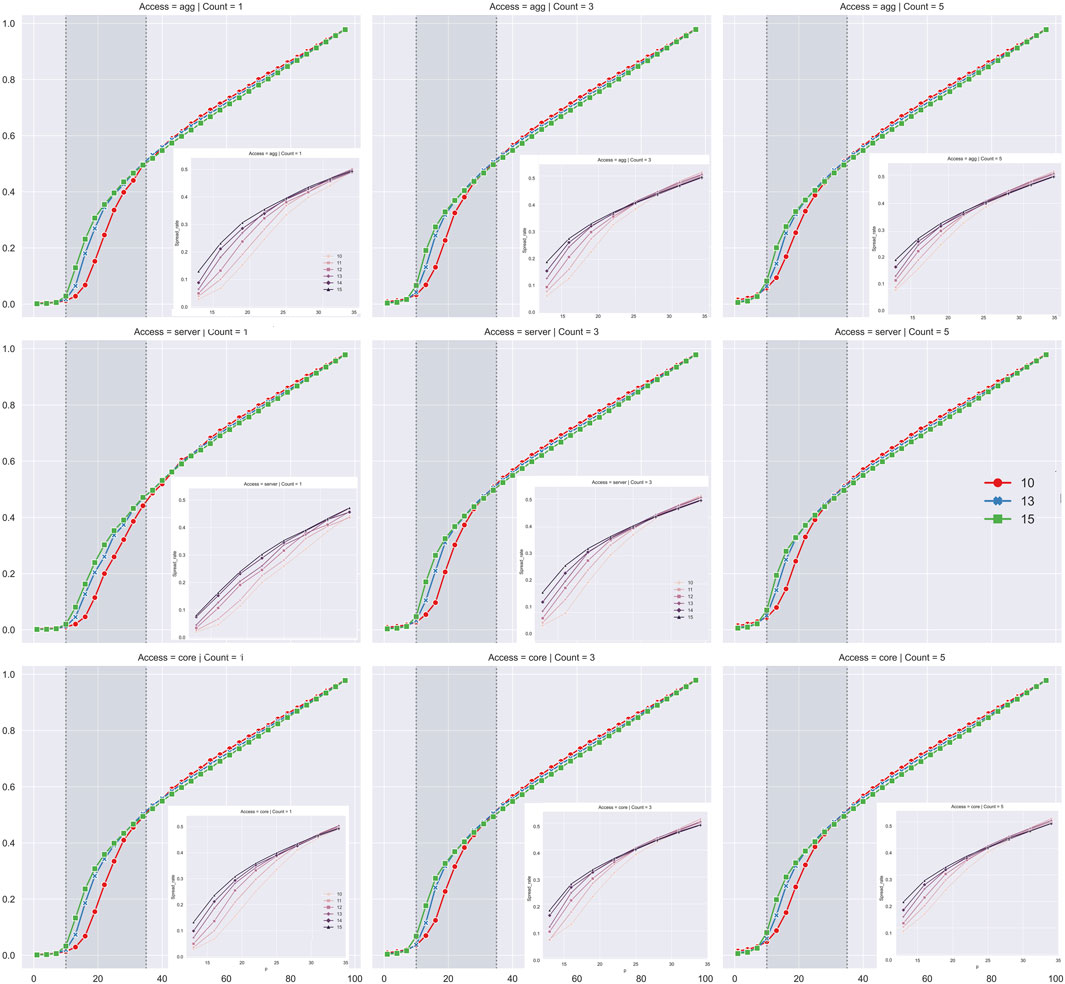
FIGURE 6. This figure discusses the relationship between topological parameters and virus spread rate in Fat-tree. On the horizontal axis is the probability of the device being infected and on the vertical axis is the virus spread rate. The row represents the cases with the same propagation source access and the column represents the cases with the same count of propagation sources. As shown in experiments with the medium-sized data center network, the capability of the networks for suppressing the propagation tends to be consistent in the face of viruses with high propagation capacity. The average propagation scale of small-sized Fat-tree networks is smaller than that of large-scale networks when faced with viruses with low propagation capacity.
3.3 Experiments in Bcube networks
BCube is similar to DCell. It uses additional server ports for direct connectivity, which are designed for modular network deployments. Microsoft recommends BCube and established the BCube source routing protocol to manage the data center network topology. Generally, this topology requires multiple NIC’s in each server.
There is an epidemic threshold between
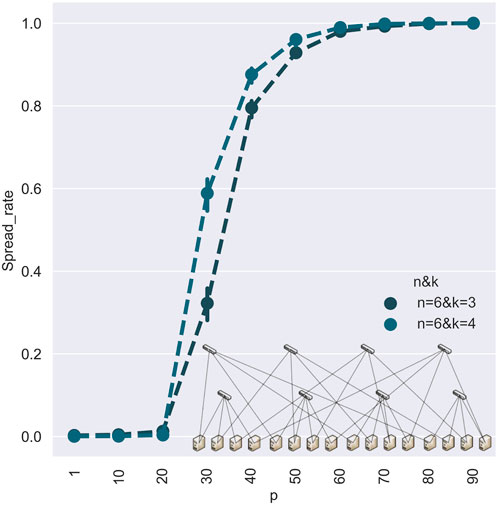
FIGURE 7. This figure discusses the relationship between the variables and the propagation scale in Bcube. On the horizontal axis is the probability of the device being infected () and on the vertical axis is the virus spread rate. The figure shows various scenarios on different topological parameters. The lines with different colors and markings represent the count of different propagation sources. The band in lighter color indicates the difference resulting from different propagation source access, i.e., layer layer vs. server layer.
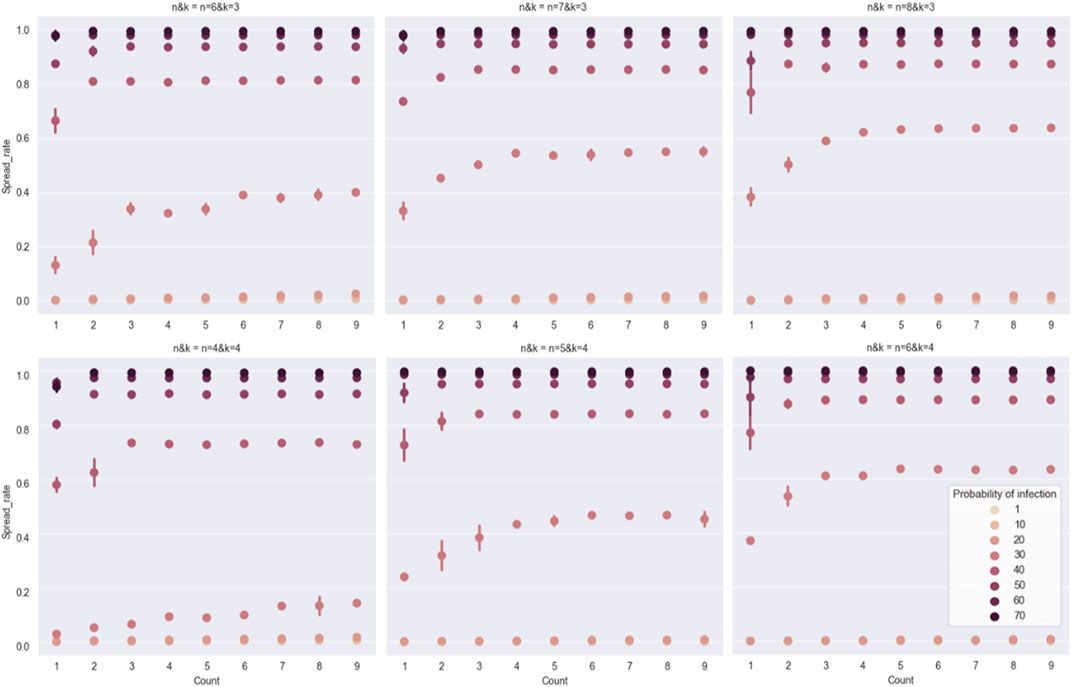
FIGURE 8. This figure discusses the relationship between the count of propagation sources and the virus spread rate. The points with different colors and markings represent different probabilities of the device being infected (). The upper and lower intervals of the points represent the differences caused by various propagation source accesses. The experiment shows that in a medium-sized network, the virus propagation scale is stable at a certain value when count>5. The initial propagation scale of a single propagation source differs significantly with different topological parameters. The medium-sized network here refers to the medium-sized data center network with 3,000–10,000 device nodes.
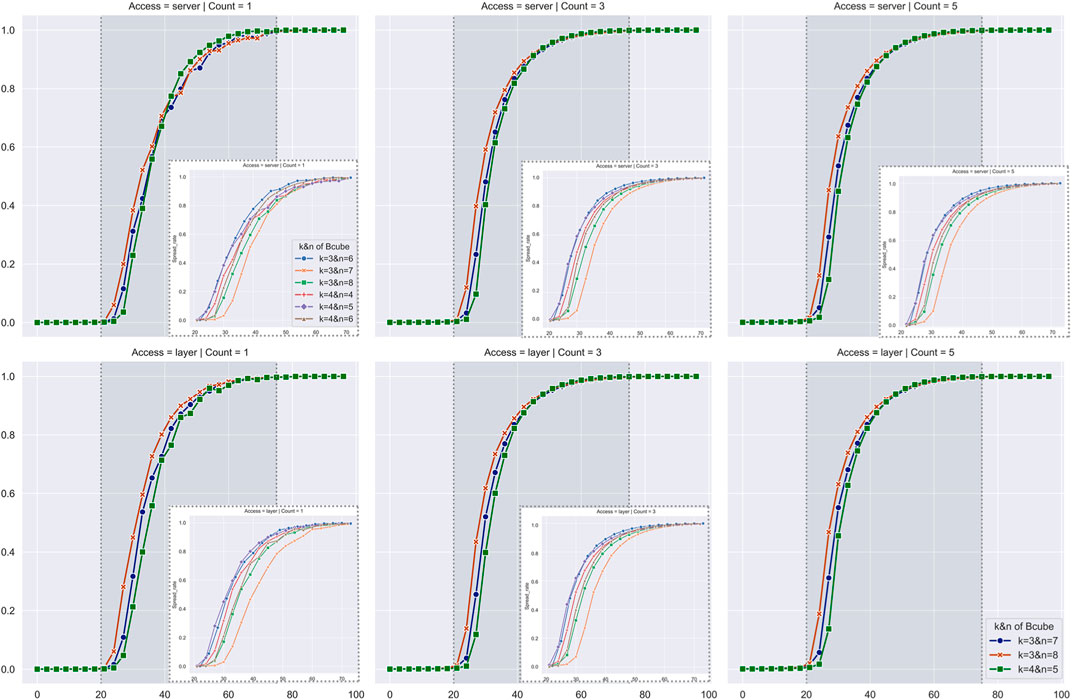
FIGURE 9. This figure discusses the virus spread rate for different parameter groups in Bcube. On the horizontal axis is the probability of the device being infected, on the vertical axis is the virus spread rate, and the lines in different colors represent the performance of each parameter group. In the Bcube network topology, for the same number of layers , the virus propagation scale in the network decreases with the number of network cubes . That is, the smaller the Bcube network size, the lower the virus spread rate in the network. Correspondingly, the experiment shows that for the same , the smaller , the lower the virus spread rate. Speculatively, when is lower than 20%, the virus still spreads in a single cube in Bcube; when is more than 20%, the virus starts to transit through devices at the layer and reach other cubes, resulting in a chain effect.
4 Comparison of the average performance of DCN topological parameter sets and topologies
Network topology and topological parameters are the variables over which the network security defender has control [23]. Therefore, the relationship that the network topology and topological parameters have with the virus spread rate in the network is discussed separately in this section. Specifically, in the actual scenario, the properties of the virus, the propagation source access, and the count of propagation sources cannot be controlled. We, as network maintainers, can only take security measures and strategies. As for the structural security of the network, the network topology and topological parameters are under our control. Organizations that prioritize network security face the need to select the data center network topology at the early stage of data center network construction. In the maintenance period, organizations have the need to adjust the number of data center network devices. The above two needs correspond to the network topology and topological parameters respectively.
4.1 Comparison of network topological parameters
In order to obtain the topological parameter sets with low virus spread rates for the same topology, different parameter sets in each network topology are experimented with. To control the variables, we experiment with the count of propagation sources from 1 to 5. The comparison experiment will be implemented as follows. Comparing the spread of viruses in a network with the parameter sets calculated by our framework with general values. In order to compare the difference in the effectiveness of different parameter groups, we demonstrate the difference between parameter groups by propagation scale.
The value
Through the method described in the section of Method, the values are obtained in Table of this paper. The values are the contributions of the factors to the variance and the composite scores of the topological parameter sets, respectively. A negative score means that the spread rate is below the mean.
4.1.1 Relationship between topological parameters and virus spread rate in Fat-tree
The conclusion changes if the propagation source access and the count of propagation sources are taken into account. Through the method described in the section of Method, the values in Tables 1, 2 can be obtained. The values are the contributions of the factors to the variance and the composite scores of the topological parameter sets, respectively. A negative score means that the spread rate is below the mean. From the factor analysis, it can be concluded that for

TABLE 1. Accumulated Variance Contribution Rate for factors.

TABLE 2. Score for each N_Fat_tree.
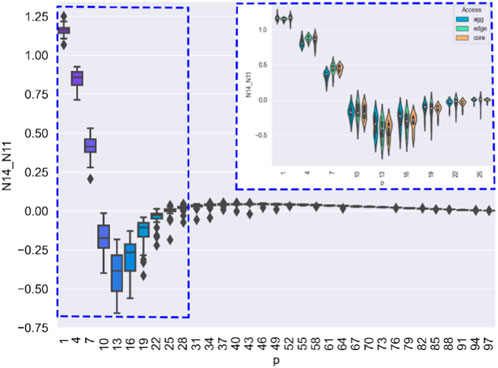
FIGURE 10. Through the calculation method described in this paper, we can conclude that the virus suppression capability of the network is stronger than on other parameters when N = 14. For example, at = 13%, the average virus spread rate reduces by 32%. The blue frame represents the case when <31%. From the experiment, it is clear that the parameter is not significantly related to the virus spread rate. This is because the variance of the spread rates is large at <31%.
4.1.2 Relationship between topological parameters and virus spread rate in Leaf-spine
In the following experiments, we discuss the impact of changing the topological parameters on the spread rate at the Leaf layer. Virus prevention in data center networks is mainly for the server layer and the leaf layer in the network. The server layer is directly connected to user PC’s, which are vulnerable to email virus attacks, etc. The devices at the leaf layer assume the function of network access, which are vulnerable to virus attacks resulting from system vulnerabilities. The following paragraphs will focus on these two scenarios.
As for the specific parameter and scenario settings, firstly, the simulated scenario is a computer virus breaking through the border via email, and the virus is a non-directionally placed worm. Secondly, we change the number of devices at the leaf layer in the network topology to simulate spine-leaf expansion, while calculating the virus propagation range. Different topologies are simulated corresponding to the way of abstracting the number of device nodes at the Leaf layer, and the number of devices at the spine layer is set as 18. The approach of increasing the number of nodes in the spine layer or the leaf layer is usually taken for the expansion of Spine-leaf. Finally, the total number of nodes in the network is kept consistent for a fair comparison. When the number of nodes at the leaf layer increases, the number of server nodes linked to each leaf reduces. The numbers of nodes at the leaf layer are 24, 36 48, respectively and the corresponding numbers of ports on the switch are 48, 32, and 24, respectively. These three types of Leaf lead to the same network size.
Through the method described in the section of Method, the values in Tables 3, 4 are obtained. The values are the contributions of the factors to the variance and the composite scores of the topological parameter sets, respectively. A negative score means that the spread rate is below the mean.

TABLE 3. Accumulated Variance Contribution Rate in leaf-spine.

TABLE 4. Score for each value of Leaf.
Through the calculation method described in this paper, we can conclude that the virus suppression capability of the network is stronger than on other parameters when Leaf = 14. For example, at
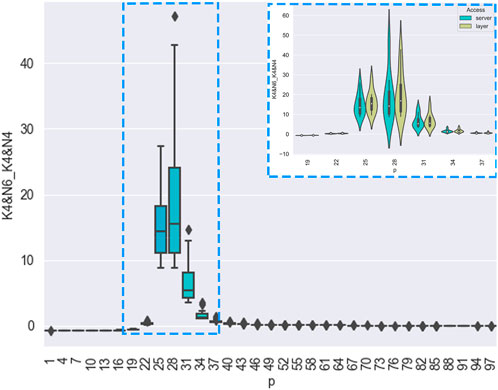
FIGURE 11. Through the calculation method described in this paper, we can conclude that the virus suppression capability of the network is stronger when = 4 and = 4. For example, at = 28%, the average virus spread rate reduces by 16%. The blue frame represents the case when 19%< <37%. As shown in the figure, the parameters selected with the Method have passed the verification. The propagation suppression capability of the network corresponding to the parameters is stronger.
According to the experiment, firstly, the propagation scale grows linearly by increasing the count of propagation sources when the probability of the device being infected is determined; secondly, the smaller the number of nodes at the leaf, the lower the propagation scale. This indicates that the overall suppression of virus propagation can be achieved by reducing the number of devices at the middle layer during network maintenance.
4.1.3 Relationship between topological parameters and virus spread rate in Bcube
Through the method described in the section of Method, the values in Tables 5, 6 are obtained. The values are the contributions of the factors to the variance and the composite scores of the topological parameter sets, respectively.

TABLE 5. Accumulated variance contribution rate in Bcube.

TABLE 6. Score for each value of Bcube.
4.2 Comparison of different topologies
If we act as the defender of network security, the characteristics of computer viruses are not under our control. Different network topologies have different influences on the spread of computer viruses. A specific network topology helps to reduce the final propagation scale [24, 25]. In this regard, we have done experiments to investigate two main issues. Firstly, we study the main factors affecting the network propagation scale. Secondly, we study the changes in the propagation scale under different topologies, while figuring out which network topology has an inhibitive effect on virus propagation.
In this part, we compare the three topologies mentioned in this paper through experiments and analyze the performance of these three topologies under different scenarios. We also compare the impact of different topological parameters on the virus spread rate. At the same time, we introduce this method of analysis to the domain of data center network, hoping that more network security practitioners will study and analyze other topologies.
When constructing a data center network, we often face the choice of network topologies. Our experiments compare the propagation characteristics of Spine-leaf, Fat-tree and Bcube, as shown in Figure 12. We choose the 3 topologies because they are the most common options in the market today. Fat-tree is a traditional architecture, which is used by most data centers with less than 10,000 devices, while Spine-leaf is an increasingly popular topology, which is applied in Facebook’s data center and expected to prevail in the future. Organizations with needs for information security should try to choose a network topology that works against the spread of computer viruses. In data center maintenance, the network topological parameters are also adjusted to inhibit virus propagation.
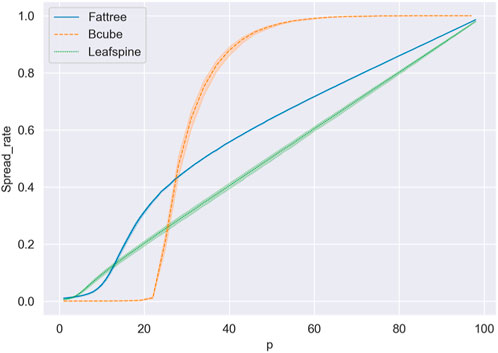
FIGURE 12. This experiment investigates the effect of the probability of the device being infected and the count of propagation sources on the propagation scale in three DCN topologies. On the horizontal axis is the probability of the device being infected; different colors represent different network topologies. The bands in lighter colors indicate the differences caused by different propagation source accesses. According to the experiments, we can conclude that in the same topology, the virus spread rate is lower in a network with less number of nodes between layers (Other things being equal). Furthermore, Spine-leaf is better than Fat-tree and Bcube at inhibiting virus propagation.
5 Conclusion
In this work, the propagation model was first introduced to simulate virus propagation in the related work to data center networks. Our experiments focused on the relationship between network topological parameters and virus spread rates. The scalability of data center networks or the use of propagation models in network modeling has been the focus of prior studies, and the relationship between the architecture of the data center network and the size of viral transmission has seldom been discussed.
To find the set of parameters with the best viral suppression effect, we proposed a computational framework using factor analysis. By using this framework, we were able to rank each parameter group according to a composite score, which resolved the issue of parameter group performance rankings that varied among 3,000 simulated situations. In the meanwhile, using the factor analysis approach, which can characterize the variable data, the common factors were identified.
In this paper, we studied the relationship between changes in network topological parameters and virus spread rate by using the framework described above. One security step that networks security administrators may take to stop viruses from spreading throughout the network is to change the topology of the network. Experiments have shown that Leaf-spine and Bcube with fewer switches at the switch layer have a higher impact on virus suppression in medium-sized data center networks. For example, for Leaf-spine, when Leaf = 24 and
To demonstrate a method for topology selection early in the development of a data center network, we completed the experiments for the advantages of three different network topologies. It is necessary to choose a proper network topology for organizations with stringent security requirements. According to the experiments. Leaf-spine has a better propagation suppression effect when faced with viruses with high penetration and propagation capability than the other two types of network topologies.
As demonstrated in other experiments, to decrease the rate at which a virus spreads within an existing network topology, it is first necessary to lower the likelihood that the network will become infected; next, it is essential to stop the virus from accessing critical areas; and finally, it is necessary to lower the number of invading viruses. For Fat-tree, the protection priority rankings are core > agg > edge layer; for Spine-leaf, the rankings are spine > leaf > server layer; for Bcube, the rankings are Layer = server.
Based on our research into the three popular network topologies, we anticipate that future literature will explore the effects of alternative topologies. Various devices have different security levels, which will result in different possibilities of being infected, and the relevant experiments will be completed in the next work.
Data availability statement
The raw data supporting the conclusion of this article will be made available by the authors, without undue reservation.
Author contributions
XH Contributed conceptualization, methodology, original draft; QH Contributed Funding acquisition, Formal analysis; QG Contributed data. Participated in the conceptual design; YF Participated in the conceptual design, write.
Funding
National Natural Science Foundation of China, Grant No. 62103422. Natural Science Foundation of Hunan Province of China, Grant No. 2021JJ40680.
Conflict of interest
The authors declare that the research was conducted in the absence of any commercial or financial relationships that could be construed as a potential conflict of interest.
Publisher’s note
All claims expressed in this article are solely those of the authors and do not necessarily represent those of their affiliated organizations, or those of the publisher, the editors and the reviewers. Any product that may be evaluated in this article, or claim that may be made by its manufacturer, is not guaranteed or endorsed by the publisher.
Supplementary material
The Supplementary Material for this article can be found online at: https://www.frontiersin.org/articles/10.3389/fphy.2023.1174099/full#supplementary-material
References
1. Jog M, Madiajagan M. Cloud computing: Exploring security design approaches in infrastructure as a service. In: Proceeding of the 2012 International Conference on Cloud Computing Technologies, Applications and Management (ICCCTAM); December 2012; Dubai, United Arab Emirates. IEEE (2012). p. 156–9.
2. Liu K, Zhou Y, Wang Q, Zhu X. Vulnerability severity prediction with deep neural network. In: Proceeding of the 2019 5th International Conference on Big Data and Information Analytics (BigDIA); July 2019; Kunming, China. IEEE (2019). p. 114–9.
3. Bari MF, Boutaba R, Esteves R, Granville LZ, Podlesny M, Rabbani MG, et al. Data center network virtualization: A survey. Commun Surv tutorials (2013) 15(2):909–28. doi:10.1109/surv.2012.090512.00043
4. He X, He M, Han Z. A survey of network topology of data center. In: Proceeding of the 2018 IEEE 4th International Conference on Big Data Security on Cloud (BigDataSecurity), IEEE International Conference on High Performance and Smart Comput; May 2018; Omaha, NE, USA. IEEE (2018). p. 39–41.
5. Xia W, Zhao P, Wen Y, Xie H. A survey on data center networking (DCN): Infrastructure and operations. IEEE Commun Surv Tutorials (2017) 19(1):640–56. doi:10.1109/comst.2016.2626784
6. Savchenko V, Haidur H, Dzyuba T, Marchenko V, Matsko O. Providing of data center information security on the basis of performance balance. In: Proceeding of the 2021 IEEE 3rd International Conference on Advanced Trends in Information Theory (ATIT); December 2021; Kyiv, Ukraine. IEEE (2021). p. 121–5.
7. Namyar P, Supittayapornpong S, Zhang M, Yu M, Govindan R. A throughput-centric view of the performance of datacenter topologies. In: Proceedings of the 2021 ACM SIGCOMM 2021 Conference; August 2021 (2021). p. 349–69.
8. Leiserson CE. Fat-trees: Universal networks for hardware-efficient supercomputing. IEEE Trans Comput (1985) 34(10):892–901. doi:10.1109/tc.1985.6312192
9. Alizadeh M, Edsall T. On the data path performance of leaf-spine datacenter fabrics. In: Proceedings of the 2013 IEEE 21st Annual Symposium on High-Performance Interconnects; San Jose. IEEE (2013). p. 71–4.
10. Guo C, Lu G, Li D, Wu H, Zhang X, Shi Y, et al. BCube: A high performance, server-centric network architecture for modular data centers. In: Proceedings of the Conference on Applications, Technologies, Architectures, and Protocols for Computer Communication; August 2009; Barcelona, Spain (2009). p. 63–74.
11. Han Z, Yu L. A survey of the BCube data center network topology. In: Proceedings of the 2018 IEEE 4th International Conference on Big Data Security on Cloud (BigDataSecurity); May 2018; Omaha, NE, USA. IEEE (2018). p. 229–31.
12. Guo C, Wu H, Tan K, Shi L, Zhang Y, Lu S Y. Dcell: A scalable and fault-tolerant network structure for data centers. ACM SIGCOMM Comp Commun Rev (2008) 38:4–19. doi:10.1145/1402958.1402968
13. Chkirbene Z, Hadjidj R, Foufou S, Hamila R. LaScaDa: A novel scalable topology for data center network. IEEE/ACM Trans Networking (2020) 28(5):2051–64. doi:10.1109/tnet.2020.3008512
14. Sara N, Faghani F, Farzanegan MD. Doughnutie: An efficient and low-latency cloud data center network architecture. Concurrency Comput Pract Experience (2021) 33:20–32.
15. Chkirbene Z, Foufou S, Hamila R. VacoNet: Variable and connected architecture for data center networks. In: Proceedings of the 2016 IEEE Wireless Communications and Networking Conference; April 2016. IEEE (2016). p. 1–6.
16. Dong H, Munir A, Tout H, Ganjali Y. Next-generation data center network enabled by machine learning: Review, challenges, and opportunities. IEEE Access (2021) 9:136459–75. doi:10.1109/access.2021.3117763
17. Luo L, Guo D, Wu J, Qu T, Chen T, Luo X. VLCcube: A vlc enabled hybrid network structure for data centers. IEEE Trans Parallel Distributed Syst (2017) 28(7):2088–102. doi:10.1109/tpds.2016.2646366
18. Mysore RN, Pamboris A, Farrington N, Huang N, Miri P, Radhakrishnan S, et al. PortLand: A scalable fault-tolerant layer 2 data center network fabric. ACM SIGCOMM Comp Commun Rev (2009) 39:39–50. doi:10.1145/1594977.1592575
19. Ballani H, Costa P, Behrendt R, Daniel C, Haller I, Jozwik K, et al. Sirius: A flat datacenter network with nanosecond optical switching. In: Proceedings of the Annual conference of the ACM Special Interest Group on Data Communication on the applications, technologies, architectures, and protocols for computer communication; August 2020. New York, NY: Association for Computing Machinery (2020). p. 782–97.
20. Zerwas J, Györgyi C, Blenk A, Schmid S, Avin C. Duo: A high-throughput reconfigurable datacenter network using local routing and control. Proc ACM Meas Anal Comput Syst (2023) 7:1–25. doi:10.1145/3579449
21. Bellingeri M, Bevacqua D, Massimiliano T, Scotognella F, Roberto A, Nguyen N, et al. Network structure indexes to forecast epidemic spreading in real-world complex networks. Soc Phys (2022) 10:1017015. doi:10.3389/fphy.2022.1017015
22. Gan C, Feng Q, Zhu Q, Zhang Z, Zhang Y, Xiang Y. Analysis of computer virus propagation behaviors over complex networks: A case study of Oregon routing network. Nonlinear Dyn (2020) 100(14):1725–40. doi:10.1007/s11071-020-05562-1
23. Solé-Ribalta A, Granell C, Gómez S, Arenas A. Information transfer in community structured multiplex networks. Interdiscip Phys (2015) 3:00061. doi:10.3389/fphy.2015.00061
24. Huang H, Li J. Research on network communication model and network security technology through big data. In: Proceedings of the 2021 IEEE International Conference on Data Science and Computer Application (ICDSCA); October 2021; Dalian, China. IEEE (2021). p. 138–41.
Keywords: network security, data center network, propagation model, computer virus, network topology
Citation: Han X, Huangpeng Q, Gao Q, Fu Y and Duan X (2023) Study of data center communication network topologies using complex network propagation model. Front. Phys. 11:1174099. doi: 10.3389/fphy.2023.1174099
Received: 25 February 2023; Accepted: 17 April 2023;
Published: 09 May 2023.
Edited by:
Jiang Zhu, Netskope Inc., United StatesReviewed by:
Ning Liu, China Telecom Research Institute, ChinaFei Xiong, Beijing Jiaotong University, China
Zhenjiang Zhang, Beijing Jiaotong University, China
Copyright © 2023 Han, Huangpeng, Gao, Fu and Duan. This is an open-access article distributed under the terms of the Creative Commons Attribution License (CC BY). The use, distribution or reproduction in other forums is permitted, provided the original author(s) and the copyright owner(s) are credited and that the original publication in this journal is cited, in accordance with accepted academic practice. No use, distribution or reproduction is permitted which does not comply with these terms.
*Correspondence: Xiaojun Duan, eGpkdWFuQG51ZHQuZWR1LmNu