 Shuolin Wang
 Weiwei Wang2
 Youyou Hu
- 1College of Science, Jiangsu University of Science and Technology, Zhenjiang, China
- 2Department of Mathematics and Physics, Shijiazhuang Tiedao University, Shijiazhuang, China
- 3MOE Key Laboratory of Weak-Light Nonlinear Photonics, TEDA Institute of Applied Physics and School of Physics, Nankai University, Tianjin, China
In this study, bismuth (Bi) and magnesium (Mg) co-doped lithium niobate crystals (LN:Bi,Mg6.0) with a rapid photorefractive (PR) response were subjected to annealing treatments in oxygen and various argon atmospheres to modulate their oxidation-reduction states. The PR properties of LN:Bi,Mg6.0 crystals with different redox states, including saturation diffraction efficiency, response time, and sensitivity, were systematically characterized at laser wavelengths of 532 nm, 488 nm, and 442 nm. The results demonstrate that reduction treatment effectively shortens the response time and enhances the PR sensitivity of LN:Bi,Mg6.0 crystals. In particular, the crystal reduced in Ar atmosphere for 24 h exhibited a response time of 5.4 m at 442 nm, representing a 58% reduction compared to the as-grown crystal. O 1s X-ray photoelectron spectroscopy (XPS) revealed that changes in the redox state directly affect the concentration of oxygen vacancies (VO) in the crystal, thereby influencing its PR performance. As the VO increases, the PR response time initially decreases and then increases. In addition, based on the results of ultraviolet-visible (UV-Vis) absorption spectra and XPS, the defect structures of LN:Bi,Mg6.0 crystal with varying redox states were discussed.
Introduction
In recent years, the commercialization of advanced three-dimensional (3D) display technologies, including holographic glasses and automotive augmented reality head-up displays (AR-HUDs), has ushered in a new era of immersive interaction by seamlessly merging virtual and real-world elements. Among these innovations, holographic 3D display stands out as the most promising next-generation visual technology, primarily due to its inherent advantage of enabling naked-eye viewing without the need for additional eyewear [1–5]. Optical holographic display based on photorefractive (PR) materials is one of the most effective approaches to achieving real-time dynamic 3D visualization [6]. The PR effect involves two fundamental physical processes: first, the photoconductive process, in which photoexcited charge carriers are generated and redistributed to form a spatial space-charge field; and second, the electro-optic process, where this field induces a refractive index modulation through the Pockels effect [7]. This light-induced refractive index change provides a direct mechanism for dynamic holographic recording. Owing to its reversibility and real-time tunability, the PR effect enables continuous writing and erasing of holographic gratings, thereby making PR materials highly promising for real-time dynamic holographic 3D displays [8]. Although organic polymers [9] and liquid crystals [10, 11] are widely adopted in current display systems, they encounter critical challenges including material degradation and the requirement for high operational voltages. In contrast, inorganic PR crystals have emerged as ideal candidates for dynamic holographic displays due to their stable physicochemical properties and the ability to achieve high diffraction efficiency without the need for external voltage.
Lithium niobate (LiNbO3, LN) crystal, called “silicon of photonics”, is one of multi-functional artificial crystal that combines excellent physical properties such as electro-optic, acousto-optic, piezoelectric, nonlinear optical properties, and PR effects [12–18]. Based on these attractive properties, LN has played a prominent role in many recent technological achievements, such as modulators [19–22], permanent holographic recording equipment [23], nonlinear resonators [24, 25], and integrated optics on-chip [26–28]. However, as a classic inorganic PR material, the slow response time of LN crystals has long limited their use in holographic displays [29–31]. Recent studies have revealed that co-doping LN crystals with Mg2+ and lone-pair electron cations (e.g., Bi3+, Sb3+) significantly enhances the PR response speed [32–34]. Specifically, for a Bi and Mg co-doped LN crystal (LN:Bi1.0,Mg6.0), the response time was reduced to 13 m at 442 nm [35]. Although increasing the Bi3+ doping concentration further shortened the response time to 7.2 m in LN:Bi2.0,Mg6.0 crystals, enabling real-time dynamic holographic display at a 60 Hz refresh rate [36], this improvement came at the expense of significantly degraded crystal quality. Therefore, it is crucial to investigate whether the response time can be shortened while maintaining crystal quality to achieve high refresh rates.
In this work, a 1.0 mol% Bi and 6.0 mol% Mg co-doped LN crystal (LN:Bi,Mg6.0) was grown via the Czochralski (CZ) method, and subsequently, the redox states of LN:Bi,Mg6.0 samples were modulated through annealing under O2 and Ar atmospheres, respectively. The PR properties of as-grown and redox-treated samples were systematically evaluated. Ultraviolet-visible (UV-Vis) spectroscopy and X-ray photoelectron spectroscopy (XPS) analyses were performed to investigate defect structures. The results demonstrate that optimizing the concentration ratio between oxygen vacancies (VO) and lattice oxygen can reduce the PR response time of LN:Bi,Mg6.0 crystals by 58% at 442 nm.
Materials and methods
Sample preparation
A congruent LN (CLN) crystal with a composition of [Li]/[Nb] = 48.6/51.4, co-doped with 1.0 mol% of Bi and 6.0 mol% Mg, was grown along the z-axis using the CZ method and labeled as LN:Bi,Mg6.0. The specific steps and detailed parameters involved in crystal growth are provided in the Supplementary Material. The crystal was maintained at 1,210 °C for 24 h for annealing, followed by 1-h polarization with a 50 mA current at the same temperature, and then controllably cooled to room temperature to complete the annealing and polarization process, thereby eliminating internal thermal stresses and ensuring single-domain formation. Subsequently, five y-oriented wafers with identical dimensions of 10*8*1 mm (length*width*thicknesses) were prepared for redox treatment. Among the five samples, one was left untreated, while the other four underwent distinct thermal treatments under controlled atmospheres:
1. Three samples were individually subjected to reduction treatments in an argon atmosphere (flow rate: 1.4 L/min). The temperature was raised to 500 °C in 5 h, held isothermally for either 12 h, 24 h, or 36 h, and then cooled to room temperature in 5 h.
2. The remaining sample was treated in an oxygen atmosphere (flow rate: 1.4 L/min), during which the temperature was increased to 800 °C in 5 h, held for 12 h, and then cooled to room temperature in 5 h.
The samples are labeled according to their treatment conditions: the untreated sample is labeled “As-grown”; three argon-reduced samples with 12, 24, and 36 h isothermal holds are labeled “Ar-12 h”, “Ar-24 h”, and “Ar-36 h”, respectively; and the oxygen-oxidized sample with 12 h isothermal hold is labeled “O2-12 h”.
Experimental methods
The two-wave coupling method [32] was employed to characterize the PR properties of LN:Bi,Mg crystals subjected to different treatment conditions. According to the coupled-wave theory, two coherent beams with identical frequency and polarization interfere inside the crystal and generate a spatially modulated space-charge field. Based on the PR theory, this space-charge field induces a refractive-index modulation that follows the interference pattern, thereby forming a volume phase grating within the crystal. Under these conditions, a cosine-type intensity modulation is established in the crystal, and the light-intensity coupling can be described by Equation 1:
Here,
Three laser wavelengths were selected for the measurements: 532 nm from a continuous-wave frequency-doubled solid-state laser, 488 nm from an Ar+ laser, and 442 nm from a He-Cd laser. Figure 1 presented the schematic drawing of the experimental set-up used for PR properties measurement. The laser beam was split into two beams of equal intensity Is and IR (400 mW/cm2 for each beam) by splitter mirror and the sample was irradiated at an angle of 30° (@532 nm), 27° (@488 nm), and 24.5° (@442 nm), respectively. The vector of the grating was parallel to the c-axis for obtaining the maximum electro-optical constant γ33. The 633 nm beam emitted from the He-Ne laser was used as the monitoring light, which is incident from a strict Bragg angle. A weak 633 nm He-Ne probe beam (3 mW/cm2) incident at the exact Bragg angle monitored grating formation without affecting photorefraction. PD3 and PD4 were used to record the diffraction efficiency data in real time by controlling the shutter switch. The diffraction efficiency (η) of the crystals is defined as Equation 3:
where “Id” is the diffracted beam intensity, “It” is the transmitted beam intensity. The temporal evolution of diffraction efficiency (η) can be expressed as Equation 4:
where ηt is the diffraction efficiency at time t, ηs is the saturated diffraction efficiency, and τr is the response time of the crystal, which are determined by fitting the experimental curve of η versus t. Further, the sensitivity (S) of the crystal is defined as Equation 5:
where “d” is the thickness of the crystal, “I” represents the light intensity.
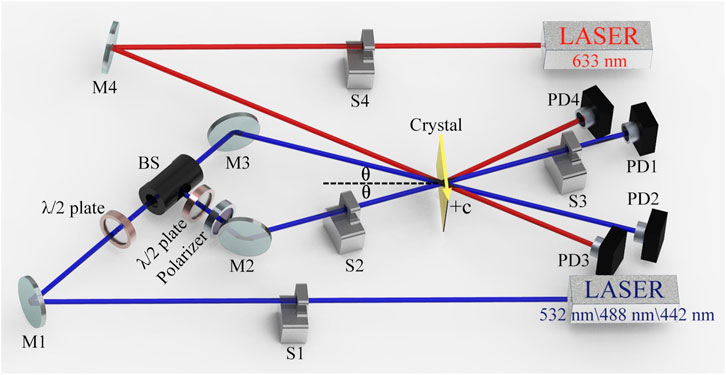
Figure 1. Schematic diagram of the two-wave coupling experimental setup.
Computational details
All the calculations in this work are done using the Vienna Ab initio Simulation Package (VASP) [37, 38] which performs an iterative solution of the Kohn–Sham equations with a plane-wave basis set. The energy cutoff for plane waves was 400 eV. The projector augmented wave (PAW) method was used to describe the electron-ion interactions. The Perdew-Burke-Ernzerh (PBE) function was adopted to treat the electron exchange and correlation energy [39, 40]. A 2 × 2 × 2 supercell of 240 atoms is used in the calculations. The K-mesh is chosen as 2 × 2 × 2, which is fine enough to give a reasonable result. For all the calculations, the structure is optimized with a force convergence criterion of 0.01 eV/Å.
Results and discussions
Figure 2a presents the saturated diffraction efficiency (ηs) of “As-grown”, “Ar-12 h”, “Ar-24 h”, “Ar-36 h”, and “O2-12 h” LN:Bi,Mg6.0 samples. Compared to the ηs of “As-grown” and “O2-12 h” samples, the ηs of the three samples subjected to Ar-reduction treatments decreased at all three laser wavelengths of 532, 488, and 442 nm. The response time (τᵣ) of these five samples is shown in Figure 2b. For clarity, the τᵣ is displayed on a logarithmic scale owing to its large variation over several orders of magnitude at the three measured wavelengths. After Ar-reduction treatments, the τᵣ of “Ar-12 h”, “Ar-24 h”, and “Ar-36 h” samples was significantly shortened at all three wavelengths. As the duration of the reduction treatment increased, the response time initially decreased and then slightly increased. Notably, the τᵣ of “Ar-24 h” sample reached a minimum of 250 m, 92 m, and 5.4 m at 532 nm, 488 nm, and 442 nm, respectively. Similarly, in Figure 2c, a logarithmic y-axis is also employed to display the sensitivities (S) of all five samples measured at 532 nm, 488 nm, and 442 nm. It’s not difficult to find that Ar-reduction treatment effectively enhances the S of LN:Bi,Mg6.0 crystal. Especially, the S of “Ar-24 h” sample reached maximum values of 7.79 cm/J, 35.89 cm/J, and 713.89 cm/J at 532 nm, 488 nm, and 442 nm, respectively.
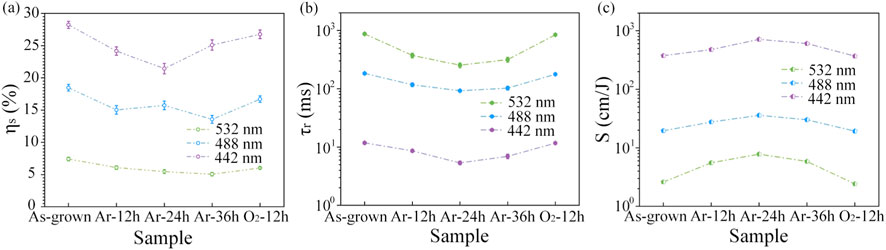
Figure 2. Saturated Diffraction Efficiency ηs (a), Response time τᵣ (b), and Sensitivity S (c) of “As-grown”, “Ar-12 h”, “Ar-24 h”, “Ar-36 h”, and “O2-12 h” LN:Bi,Mg6.0 samples, measured at 532 nm, 488 nm, and 442 nm, respectively. Detailed measurement data are provided in the Supplementary Material.
The above results demonstrate that Ar-reduction treatments can effectively reduce the response time and enhance the PR sensitivity of LN:Bi,Mg6.0. Notably, for “Ar-24 h” sample, the response time was significantly shortened by 71%, 46%, and 58% at the three measured wavelengths compared to that of “As-grown” sample. Specifically, at 442 nm, the response time of “Ar-24 h” sample decreased by nearly 2 m, while the PR sensitivity increased by 10% relative to the LN:Bi2.0,Mg6.0 crystal [36].
The UV-Visible absorption spectra of LN crystals exhibit high sensitivity to their composition and defect energy levels [41, 42]. The fundamental optical absorption edge is primarily determined by the charge transfer transition energy from oxygen (O) 2p orbitals to niobium (Nb) 4d orbitals. Redox treatments can significantly influence the electron cloud distribution around O atoms in the lattice, thereby modifying the bonding strength of Nb-O bonds. These changes directly affect the bandgap. By monitoring shifts in the absorption edge and spectral variations in UV-Vis spectra, the impact of redox treatments on the defect structure of LN:Bi,Mg6.0 crystal can be investigated. Figure 3a presents the UV-Vis absorption spectra (300–800 nm) of “As-grown”, “Ar-12 h”, “Ar-24 h”, “Ar-36 h”, and “O2-12 h” 1-mm-thick LN:Bi,Mg6.0 samples. The absorption edge of LN crystals is typically defined at the wavelength corresponding to an absorption coefficient of 15 or 20 cm-1; in this study, 20 cm-1 was selected as the reference point. Notably, “O2-12 h” sample exhibits a distinct red shift, whereas Ar atmosphere reduction results in negligible shift compared to the as-grown crystal.
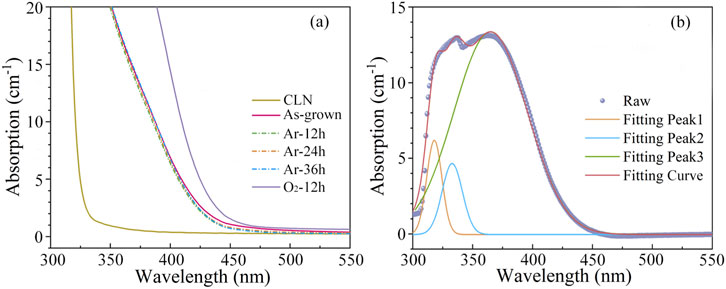
Figure 3. (a) UV-Vis Absorption spectra of CLN and “As-grown”, “Ar-12 h”, “Ar-24 h”, “Ar-36 h”, and “O2-12 h” LN:Bi,Mg6.0 samples. (b) Absorption difference between “O2-12 h” and “As-grown” LN:Bi,Mg6.0 samples.
According to the Li vacancy model, the dominant intrinsic defects in CLN are VLi− and NbLi4+. However, in LN:Bi,Mg crystals with Mg concentrations above the threshold, the intrinsic NbLi4+ defects disappear, leaving VLi−, MgLi+, MgNb3-, BiNb2-, and BiLi2+ as the predominant defects. Previous studies report that the absorption edge of LN crystals is intrinsically correlated with the concentration of VLi− [43]. Typically, an increase in VLi− concentration leads to bandgap narrowing, consequently resulting in a red shift of the absorption edge [44]. Upon oxidation treatment, part of BiLi2+ and BiNb2- oxidize to form BiLi4+ and BiNb0. To maintain charge neutrality, this process requires additional VLi− for charge compensation. The increased valence state of Bi ions during oxidation necessarily leads to an elevation in VLi− concentration, which in turn causes the observed red shift of the absorption edge. Meanwhile, theoretical calculations of the band structure of LN containing BiLi2+/4+ and BiNb2-/0 point defects indicate that both BiLi4+ and BiNb0 can narrow the band gap of LN. For specific details regarding the band structure, please refer to the Supplementary Material. To further analyze the defect states in “O2-12 h” LN:Bi,Mg6.0 sample, differential absorption spectrum was obtained by subtracting the absorption spectrum of “As-grown” LN:Bi,Mg6.0 sample from that of “O2-12 h” LN:Bi,Mg6.0 sample, as shown in Figure 3b. Gaussian fitting analysis revealed that three-peak fitting provided more accurate and physically reasonable results compared to two- or four-peak models, and the detailed peak fitting results are shown in Table 1. The absorption peak centered near 318 nm is primarily attributed to the O2--VLi- defect cluster. Furthermore, theoretical calculations confirm that the energy level of BiLi4+ point defects lies deeper than that of BiNb0. Consequently, the absorption peaks at 330 nm and 365 nm are assigned to O2--BiLi4+ and O2--BiNb0, respectively.
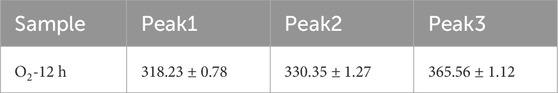
Table 1. Fitting results of “O2-12 h” LN:Bi,Mg6.0 sample absorption difference spectrum.
X-ray photoelectron spectroscopy (XPS) was employed to characterize the elemental composition, chemical states, and valence states of the crystalline samples [45]. To further investigate the defects and charge-state changes induced by redox treatments, O 1s XPS characterization was performed on the CLN, “As-grown”, “Ar-12 h”, “Ar-24 h”, “Ar-36 h”, and “O2-12 h” samples. Figure 4 shows the O 1s XPS spectra and their fitted components for these six samples. Since the raw XPS data already include instrument-generated baseline curves, these baselines were directly subtracted prior to peak analysis. A three-peak Gaussian fitting model was adopted, corresponding to lattice oxygen, oxygen vacancies (VO), and surface-adsorbed H2O/OH− [46, 47]. The fitted results display that the O 1s spectra of all samples are well described by three Gaussian components: OI peak at 530.16–530.73, OII peak at 531.76–532.83, and OIII peak at 532.48–534.43 eV. The OI peak with lower binding energy is attributed to O2- in lattice sites, while the OII peak corresponds to VO, and the higher-binding-energy OIII peak likely originates from surface-adsorbed H2O/OH− [46, 47]. Additional details of the peak-fitting procedure are provided in the Supplementary Material. The ratio of OII to OI peak areas provides a semi-quantitative measure of the relative concentrations between VO and lattice oxygen in the crystals. Our calculations yield the following OII/OI ratios: 0.32 for CLN, 0.59 for “As-grown” LN:Bi,Mg6.0 sample, 1.16 for “Ar-12 h” sample, 1.68 for “Ar-24 h” sample, and 4.88 for “Ar-36 h” sample, while “O2-12 h” sample exhibits a ratio of 0.28.
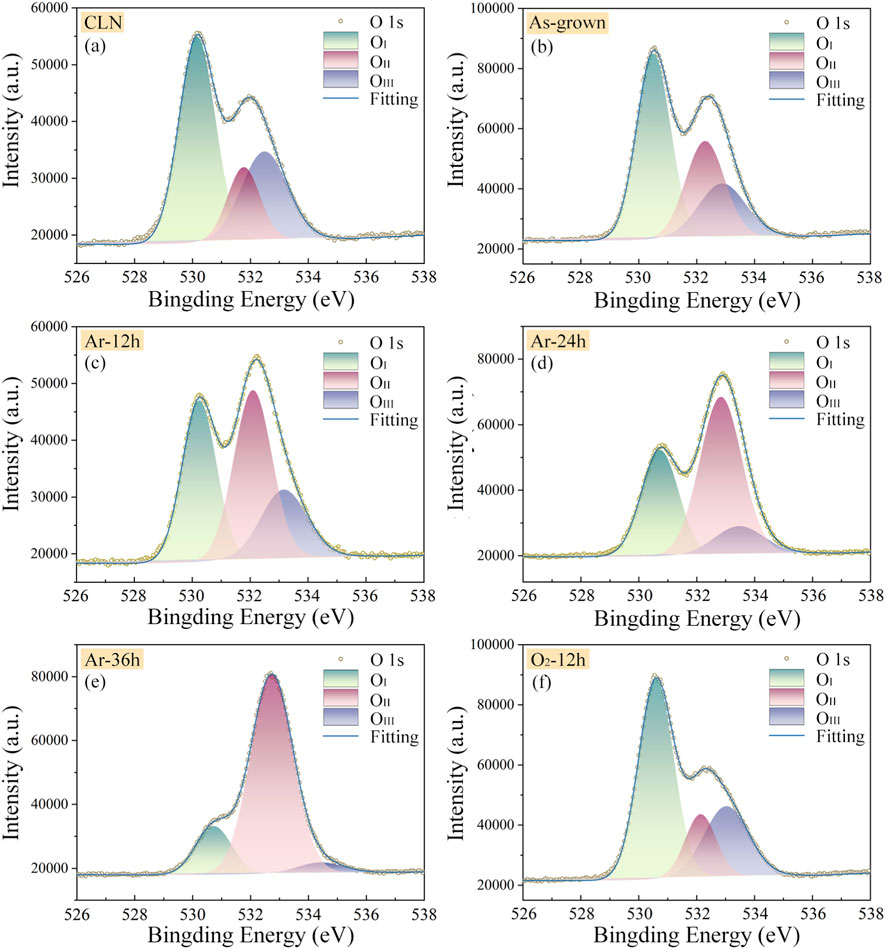
Figure 4. O1s XPS and peak-fitting spectra of CLN (a), “As-grown” (b), “Ar-12 h” (c), “Ar-24 h” (d), “Ar-36 h” (e), and “O2-12 h” (f) samples.
Compared to CLN, the increased OII/OI ratio in “As-grown” sample indicates higher VO concentration. This phenomenon originates from a charge compensation mechanism: when Mg2+ doping concentration exceeds the threshold level, both Bi3+ and Mg2+ ions occupy regular Nb5+ sites, thereby generating VO to maintain local charge balance within the crystal lattice. Furthermore, redox treatments can substantially modulate the relative concentrations of lattice oxygen and VO. Specifically, oxidation decreases the VO concentration, whereas reduction significantly increases VO density in the crystals.
Two-wave coupling experiments clearly demonstrate that Ar-reduction treatment effectively enhances the PR response speed in LN:Bi,Mg6.0 crystals. As reduction duration increases, the PR response time first decreases and then increases, exhibiting a non-monotonic trend at all three measured wavelengths. This behavior indicates that VO concentration significantly influences the PR response of LN:Bi,Mg6.0 crystals. In LN:Bi,Mg6.0 crystals, the PR process is dominated by the diffusion mechanism, the diffusion coefficient (D) is given by (μkBT)/e, where μ represents electron mobility, kB is Boltzmann’s constant, T denotes temperature, and e is electron charge [36]. This establishes the direct proportionality between D and μ. During Ar-atmosphere reduction, VO tends to combine with point defects in LN:Bi,Mg6.0 crystals, forming new defect complexes. Since the crystal must maintain overall charge neutrality and the VO is positively charged, it preferentially associates with negatively charged centers such as BiNb2- and MgNb3-, leading to the formation of BiNb-VO and MgNb-VO. Therefore, the Ar-reduction treatment modifies the VO concentration in LN:Bi,Mg6.0 crystals, which leads to the formation of new defect clusters. These complexes influence electron mobility and, consequently, affect the PR response of the crystals. In fact, binding energy calculations provide a basis for understanding this process. Binding energy Eb as a criterion for judging the stability of a defect pair X1X2, usually be defined in terms of the formation energies Ef (see Equation 6) [48, 49]
where
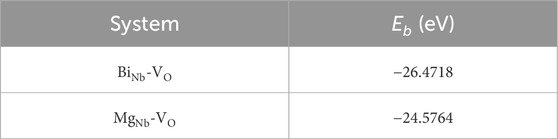
Table 2. Binding energy of the defect pairs BiNb-VO and MgNb-VO of LN:Bi,Mg6.0 crystal.
In addition, the O 1s peak-fitting results revealed by XPS further support this interpretation. The OII/OI peak-area ratio exhibits a monotonic increase with extended Ar reduction, reflecting the progressive rise in the relative VO concentration across the samples. It should be noted that this ratio does not provide the absolute VO concentration but can indicate the trend of VO evolution under different redox treatments. When these XPS results are considered together with the calculated binding energies of defect clusters, a consistent explanation can be obtained. Since the BiNb-VO has a lower binding energy than MgNb-VO, VO preferentially forms complexes with BiNb2- during moderate reduction, forming stable BiNb-VO that enhance carrier mobility and accelerate space-charge-field buildup, leading to the fastest response in the “Ar-24 h” sample. However, for the “Ar-36 h” sample under excessive reduction, the sharply increased relative VO content promotes additional MgNb-VO and stronger lattice distortion, which hinder charge transport and result in a slightly slower response.
Conclusion
In summary, oxidation and reduction treatments were applied to the rapid response LN:Bi,Mg6.0 crystals. The results demonstrate that reduction treatments effectively shorten the PR response time and enhance the PR sensitivity of the crystals. In particular, the crystal reduced in Ar atmosphere for 24 h achieved a response time of 5.4 m at 442 nm, representing a 58% reduction compared to the as-grown crystal. Furthermore, XPS analysis reveals that changes in the redox state directly affect the concentration of VO in the crystal, thereby influencing its PR performance. For 24 h Ar-reduced LN:Bi,Mg6.0 crystal, the ratio of VO to lattice oxygen peak areas reached 1.68, corresponding to the fastest PR response observed at all three measured wavelengths. This work provides a basis for optimizing the PR properties of Nb-site-doped LN crystals by tailoring their redox states through thermal treatment.
Data availability statement
The original contributions presented in the study are included in the article/Supplementary Material, further inquiries can be directed to the corresponding authors.
Author contributions
SW: Data curation, Formal Analysis, Writing – original draft, Writing – review and editing. WW: Methodology, Resources, Writing – review and editing. YZ: Data curation, Writing – review and editing. YH: Funding acquisition, Resources, Software, Writing – review and editing. DZ: Resources, Writing – review and editing, Methodology. HL: Conceptualization, Resources, Writing – review and editing. YK: Conceptualization, Resources, Supervision, Writing – review and editing.
Funding
The authors declare that financial support was received for the research and/or publication of this article. This work was supported by Jiangsu Provincial Key Research and Development Program (Grant No. BE2022143), Science Research Project of Hebei Education Department QN2025121, National Key Research and Development Program of China (Grant No. 2019YFA0705000), National Natural Science Foundation of China (Nos 12034010, 12134007).
Conflict of interest
The authors declare that the research was conducted in the absence of any commercial or financial relationships that could be construed as a potential conflict of interest.
Generative AI statement
The authors declare that no Generative AI was used in the creation of this manuscript.
Any alternative text (alt text) provided alongside figures in this article has been generated by Frontiers with the support of artificial intelligence and reasonable efforts have been made to ensure accuracy, including review by the authors wherever possible. If you identify any issues, please contact us.
Publisher’s note
All claims expressed in this article are solely those of the authors and do not necessarily represent those of their affiliated organizations, or those of the publisher, the editors and the reviewers. Any product that may be evaluated in this article, or claim that may be made by its manufacturer, is not guaranteed or endorsed by the publisher.
Supplementary material
The Supplementary Material for this article can be found online at: https://www.frontiersin.org/articles/10.3389/fphy.2025.1689932/full#supplementary-material
References
1. Gopakumar M, Lee GY, Choi S, Chao B, Peng Y, Kim J, et al. Full-colour 3D holographic augmented-reality displays with metasurface waveguides. Nature (2024) 629:791–7. doi:10.1038/s41586-024-07386-0
2. Zhang Y, Cheng D, Wang Y, Wang Y, Shan Y, Yang T, et al. Real-time multi-depth holographic display using complex-valued neural network. Opt Express (2025) 33(4):7380–95. doi:10.1364/oe.551943
3. Yin Y, Jiang Q, Wang H, Huang L. Color holographic display based on complex-amplitude metasurface. Laser and Photon Rev (2025) 19(1):2400884. doi:10.1002/lpor.202400884
4. Park J, Lee KR, Park YK. Ultrathin wide-angle large-area digital 3D holographic display using a non-periodic photon sieve. Nat Commun (2019) 10(1):1304. doi:10.1038/s41467-019-09126-9
5. Zhang C, Zhang D, Bian Z. Dynamic full-color digital holographic 3D display on single DMD. Opto-electron Adv (2021) 4(3):200049–7. doi:10.29026/oea.2021.200049
6. Tay S, Blanche PA, Voorakaranam R, Tunç AV, Lin W, Rokutanda S, et al. An updatable holographic three-dimensional display. Nature (2008) 451(7179):694–8. doi:10.1038/nature06596
7. Cornish WD. The photorefractive effect in lithium niobate [dissertation]. Vancouver: University of British Columbia (1976).
8. Tsutsumi N. Recent advances in photorefractive and photoactive polymers for holographic applications. Polym Int (2017) 66(2):167–74. doi:10.1002/pi.5096
9. Blanche PA, Bablumian A, Voorakaranam R, Christenson C, Lin W, Gu T, et al. Holographic three-dimensional telepresence using large-area photorefractive polymer. Nature (2010) 468(7320):80–3. doi:10.1038/nature09521
10. Li X, Li Y, Xiang Y, Rong N, Zhou P, Liu S, et al. Highly photorefractive hybrid liquid crystal device for a video-rate holographic display. Opt Express (2016) 24(8):8824–31. doi:10.1364/oe.24.008824
11. Kozanecka-Szmigiel A, Rutkowska KA, Nieborek M, Kwasny M, Karpierz MA, Schab-Balcerzak E, et al. Photopatterned azo poly (amide imide) layers as aligning substrates of holographic liquid crystal diffraction gratings for beam steering applications. J Mater Chem C (2020) 8(3):968–76. doi:10.1039/c9tc04296b
12. Kong Y, Bo F, Wang W, Zheng D, Liu H, Zhang G, et al. Recent progress in lithium niobate: optical damage, defect simulation, and on-chip devices. Adv Mater (2020) 32(3):1806452. doi:10.1002/adma.201806452
13. Kong Y, Liu S, Xu J. Recent advances in the photorefraction of doped lithium niobate crystals. Materials (2012) 5(10):1954–71. doi:10.3390/ma5101954
14. Boes A, Chang L, Langrock C, Yu M, Zhang M, Lin Q, et al. Lithium niobate photonics: unlocking the electromagnetic spectrum. Science (2023) 379(6627):eabj4396. doi:10.1126/science.abj4396
15. Weigand H, Vogler-Neuling VV, Escalé MR, Pohl D, Richter FU, Karvounis A, et al. Enhanced electro-optic modulation in resonant metasurfaces of lithium niobate. ACS Photon (2021) 8(10):3004–9. doi:10.1021/acsphotonics.1c00935
16. Feng H, Zhang K, Sun W, Ren Y, Zhang Y, Zhang W, et al. Ultra-high-linearity integrated lithium niobate electro-optic modulators. Photon Res (2022) 10(10):2366–73. doi:10.1364/prj.464650
17. Qu L, Wu W, Cai W, Ren M, Xu J. Second harmonic generation in lithium niobate on insulator. Laser and Photon Rev (2025) 19:2401928. doi:10.1002/lpor.202401928
18. Zhang X, Mugisha ER, Mi Y, Liu X, Wang M, Gao Z, et al. Photovoltaic cycling to-and-fro actuation of a water-microdroplet for automatic repeatable solute acquisition on oil-infused hydrophobic LN: fe surface. ACS Photon (2021) 8(2):639–47. doi:10.1021/acsphotonics.0c01781
19. Wang C, Zhang M, Chen X, Bertrand M, Shams-Ansari A, Chandrasekhar S, et al. Integrated lithium niobate electro-optic modulators operating at CMOS-Compatible voltages. Nature (2018) 562(7725):101–4. doi:10.1038/s41586-018-0551-y
20. Tan Y, Niu S, Billet M, Singh N, Niels M, Vanackere T, et al. Micro-transfer printed thin film lithium niobate (TFLN)-on-silicon ring modulator. ACS Photon (2024) 11(5):1920–7. doi:10.1021/acsphotonics.3c01869
21. He M, Xu M, Ren Y, Jian J, Ruan Z, Xu Y, et al. High-performance hybrid silicon and lithium niobate mach–zehnder modulators for 100 gbit s-1 and beyond. Nat Photon. (2019) 13(5):359–64. doi:10.1038/s41566-019-0378-6
22. Hou S, Hu H, Liu Z, Xing W, Zhang J, Hao Y. High-speed electro-optic modulators based on thin-film lithium niobate. Nanomaterials (2024) 14(10):867. doi:10.3390/nano14100867
23. Smalley DE, Smithwick QYJ, Bove VM, Barabas J, Jolly S. Anisotropic leaky-mode modulator for holographic video displays. Nature (2013) 498(7454):313–7. doi:10.1038/nature12217
24. Gao R, Zhang H, Bo F, Fang W, Hao Z, Yao N, et al. Broadband highly efficient nonlinear optical processes in on-chip integrated lithium niobate microdisk resonators of Q-factor above 108. New J Phys (2021) 23(12):123027. doi:10.1088/1367-2630/ac3d52
25. Xu Y, Shen M, Lu J, Surya JB, Sayem AA, Tang HX. Mitigating photorefractive effect in thin-film lithium niobate microring resonators. Opt Express (2021) 29(4):5497–504. doi:10.1364/oe.418877
26. Zhang Y, Luo Q, Zheng D, Wang S, Liu S, Liu H, et al. Highly efficient on-chip erbium–ytterbium co-doped lithium niobate waveguide amplifiers. Photon Res (2023) 11(10):1733–7. doi:10.1364/prj.497947
27. Luo R, Jiang H, Rogers S, Liang H, He Y, Lin Q. On-chip second-harmonic generation and broadband parametric down-conversion in a lithium niobate microresonator. Opt Express (2017) 25(20):24531–9. doi:10.1364/oe.25.024531
28. Xie Z, Bo F, Lin J, Hu H, Cai X, Tian XH, et al. Recent development in integrated lithium niobate photonics. Adv Phys X (2024) 9(1):2322739. doi:10.1080/23746149.2024.2322739
29. Kong Y, Wu S, Liu S, Chen S, Xu J. Fast photorefractive response and high sensitivity of Zr and Fe codoped LiNbO3 crystals. Appl Phys Lett (2008) 92:251107. doi:10.1063/1.2952275
30. Dong Y, Liu S, Li W, Kong Y, Chen S, Xu J. Improved ultraviolet photorefractive properties of vanadium-doped lithium niobate crystals. Opt Lett (2011) 36(10):1779–81. doi:10.1364/ol.36.001779
31. Tian T, Kong Y, Liu S, Li W, Wu L, Chen S, et al. Photorefraction of molybdenum-doped lithium niobate crystals. Opt Lett (2012) 37(13):2679–81. doi:10.1364/ol.37.002679
32. Zheng D, Kong Y, Liu S, Chen M, Chen S, Zhang L, et al. The simultaneous enhancement of photorefraction and optical damage resistance in MgO and Bi2O3 co-doped LiNbO3 crystals. Sci Rep (2016) 6:20308. doi:10.1038/srep20308
33. Wang S, Shan Y, Wang W, Zheng D, Liu H, Liu S, et al. Lone-pair electron effect induced a rapid photorefractive response in site-controlled LiNbO3:Bi,M (M = Zn, In, zr) crystals. Appl Phys Lett (2021) 118:191902. doi:10.1063/5.0048638
34. Wang S, Shan Y, Wu Z, Zheng D, Liu S, Liu H, et al. Enhanced red-light photorefractive response speed of LiNbO3 crystals for full color holographic display. Appl Phys Lett (2025) 126:011904. doi:10.1063/5.0233431
35. Zheng D, Wang W, Wang S, Liu H, Kong Y. Real-time dynamic holographic display realized by bismuth and magnesium co-doped lithium niobate. Appl Phys Lett (2019) 114:241903. doi:10.1063/1.5107460
36. Wang S, Shan Y, Zheng D, Liu S, Bo F, Liu H, et al. The real-time dynamic holographic display of LN:Bi,Mg crystals and defect-related electron mobility. Opto-electron Adv (2022) 5:210135. doi:10.29026/oea.2022.210135
37. Kresse G, Furthmüller J. Efficiency of ab-initio total energy calculations for metals and semiconductors using a plane-wave basis set. Comput Mater Sci (1996) 6:15–50. doi:10.1016/0927-0256(96)00008-0
38. Kresse G, Furthmüller J. Efficient iterative schemes for ab initio total-energy calculations using a plane-wave basis set. Phys Rev B (1996) 54:11169–86. doi:10.1103/physrevb.54.11169
39. Kresse G, Joubert D. From ultrasoft pseudopotentials to the projector augmented-wave method. Phys Rev B (1999) 59:1758–75. doi:10.1103/physrevb.59.1758
40. Perdew JP, Burke K, Ernzerhof M. Generalized gradient approximation made simple. Phys Rev Lett (1996) 77:3865–8. doi:10.1103/physrevlett.77.3865
41. Földvári I, Polgár K, Voszka R, Balasanyan RN. A simple method to determine the real composition of LiNbO3 crystals. Cryst Res Technol (1984) 19:1659–61. doi:10.1002/crat.2170191231
42. Polgár K, Kovács L, Földvári I, Cravero I. Spectroscopic and electrical conductivity investigation of Mg doped LiNbO3 single crystals. Solid State Commun (1986) 59:375–9. doi:10.1016/0038-1098(86)90566-1
43. Li X, Kong Y, Liu H, Sun L, Xu J, Chen S, et al. Origin of the generally defined absorption edge of non-stoichiometric lithium niobate crystals. Solid State Commun (2007) 141(3):113–6. doi:10.1016/j.ssc.2006.10.021
44. Chen K, Li Y, Peng C, Lu Z, Luo X, Xue D. Microstructure and defect characteristics of lithium niobate with different li concentrations. Inorg Chem Front (2021) 8(17):4006–13. doi:10.1039/d1qi00562f
45. Kim JS, Ho PKH, Thomas DS, Friend R, Cacialli F, Bao GW, et al. X-ray photoelectron spectroscopy of surface-treated indium-tin oxide thin films. Chem Phys Lett (1999) 315(5-6):307–12. doi:10.1016/s0009-2614(99)01233-6
46. Yan S, Ge S, Zuo Y, Qiao W, Zhang L. Effects of carbothermal annealing on structure defects, electrical and magnetic properties in Fe-doped In2O3. Scripta Mater (2009) 61(4):387–90. doi:10.1016/j.scriptamat.2009.04.022
47. Bu D, Fu Y, Sun N, Li Y, An Y, Liu J. Effect of Cu doping on room temperature ferromagnetic behavior of Mn doped LiNbO3 films. J Cryst Growth (2016) 453:198–202. doi:10.1016/j.jcrysgro.2016.06.054
48. Fan Y, Li L, Li Y, Sun X, Zhao X. Hybrid density functional theory study of vanadium doping in stoichiometric and congruent LiNbO3. Phys Rev B (2019) 99:035147. doi:10.1103/physrevb.99.035147
Keywords: LiNbO3 crystal, photorefraction, rapid response, redox annealing, oxygen-vacancy
Citation: Wang S, Wang W, Zhang Y, Hu Y, Zheng D, Liu H and Kong Y (2025) Improvement of the photorefractive response in bismuth and magnesium co-doped lithium niobate crystals via oxygen-vacancy modulation through controlled redox annealing. Front. Phys. 13:1689932. doi: 10.3389/fphy.2025.1689932
Received: 21 August 2025; Accepted: 19 November 2025;
Published: 02 December 2025.
Edited by:
Venugopal Rao Soma, University of Hyderabad, IndiaCopyright © 2025 Wang, Wang, Zhang, Hu, Zheng, Liu and Kong. This is an open-access article distributed under the terms of the Creative Commons Attribution License (CC BY). The use, distribution or reproduction in other forums is permitted, provided the original author(s) and the copyright owner(s) are credited and that the original publication in this journal is cited, in accordance with accepted academic practice. No use, distribution or reproduction is permitted which does not comply with these terms.
*Correspondence: Youyou Hu, eXlodUBqdXN0LmVkdS5jbg==; Dahuai Zheng, ZGh6aGVuZ0BuYW5rYWkuZWR1LmNu; Yongfa Kong, a29uZ3lmQG5hbmthaS5lZHUuY24=