 Karthika Pradeep
 Richard W. Bell
 Wendy Vance
- Land Management Group, Agriculture Discipline, College of Science, Health, Engineering and Education, Murdoch University, Murdoch, WA, Australia
After aluminum, manganese toxicity is the most limiting factor for crops grown in acidic soils worldwide. But overall, research on Mn toxicity is still limited. The poor acid tolerance of chickpea may be related to Mn toxicity, but there has been no previous screening of chickpea germplasm (nor in its wild Cicer relatives, Cicer reticulatum and Cicer echinospermum) for tolerance to Mn toxicity. A screening technique was developed for tolerance to Mn toxicity using three released cultivars of chickpea (Cicer arietinum L), Ambar, PBA HatTrick, and PBA Striker; one accession each of C. reticulatum and C. echinospermum; and lupin (Lupinus angustifolius) as a Mn-tolerant check, with eight Mn concentrations of 2, 25, 50, 100, 150, 200, 250, and 500 μM Mn as MnSO4 in a low-ionic-strength nutrient solution. The plants were harvested at 14 and 28 days after Mn treatments. The nutrient uptake in shoots (young, old leaves, and the rest of the shoot) and roots was investigated. The best discrimination between tolerant and intolerant Cicer genotypes based on relative shoot dry weight, root dry weight, total root length, and scoring of toxicity symptoms was achieved at 150 μM Mn after 14 days of growth in Mn solution. Among the chickpea cultivars, the greater relative plant growth (both shoot and root) of Ambar and PBA Striker at 100–200 μM Mn contrasted with that of PBA HatTrick, while the C. echinospermum accession was more tolerant to Mn toxicity than C. reticulatum. Manganese tolerance in both domestic cultivars and wild accessions was associated with internal tolerance to excess Mn following greater uptake of Mn and translocation of Mn from roots to shoots.
Introduction
Manganese (Mn) toxicity is one of the important constraints limiting crop growth in acid soils worldwide. Manganese toxicity occurs because of increased Mn2+ concentration with increased acidity even through increased H+ in the root zone decreases the rate of Mn uptake by roots (Edwards and Asher, 1982). While aluminum (Al) toxicity is most common in severely acid soils, Mn is a likely growth-limiting factor in moderately–strongly acid soils, and the problem further worsens under waterlogged conditions and with environmental factors such as high soil temperature, which increases the concentration of Mn2+ (Foy et al., 1988; Khabaz-Saberi et al., 2010). Manganese toxicity generally occurs only at pH levels of 4.7 (CaCl2)/5.5 (H2O suspension) or below in well-drained soils, but in flooded and compacted soils, Mn can be toxic at a pH of 6 and higher if the soil parent material contains sufficient total Mn (Foy et al., 1988; Fernando and Lynch, 2015).
High concentrations of Mn in plant tissues alter enzymatic activity as well as uptake, redistribution, and use of other nutrients like Ca, Fe, Mg, N, and P (Santos et al., 2017; Li et al., 2019). Manganese toxicity reduced leaf CO2 assimilation rate, stomatal conductance, and leaf pigments (chlorophylls a and b) in different plant species in various studies (Stoyanova et al., 2009; Santos et al., 2017). Excess Mn enhanced production of reactive oxygen species (ROS) (Santos et al., 2017), triggering oxidative stress in plant cells (Demirevska-Kepova et al., 2004), and was associated with elevated peroxidase activity and lower activities of catalase, ascorbic acid oxidase, glutathione oxidase, and cytochrome C oxidase (Hannam and Ohki, 1988).
Differential Mn tolerances among plant genotypes within a species have been reported for soybean (Glycine max), wheat (Triticum aestivum), subclover (Trifolium subterraneum), bean (Phaseolus vulgaris), rice (Oryza sativa), cotton (Gossypium hirsutum), and cowpea (Vigna unguiculata) (Foy et al., 1988). The regulation of Mn uptake, translocation, and distribution are the main mechanisms of Mn toxicity tolerance. Transporters responsible for Mn acquisition and translocation and genes responsible for Mn detoxification have been identified in plant species such as Arabidopsis and rice (Tsunemitsu et al., 2018; Li et al., 2019). The ability of plant species to deal with high Mn may be by (1) limiting Mn absorption by the roots, (2) retaining Mn in the roots, or (3) tolerating high Mn in the shoots (Edwards and Asher, 1982; El-Jaoual and Cox, 1998; Blamey et al., 2015). In general, Mn-tolerant germplasms have tolerance to high internal tissue Mn, but in some species, low rates of Mn uptake and Mn retention in the root were important (Foy et al., 1988). For example, sunflower (Helianthus annuus) had high Mn uptake and internal tolerance but low root retention, whereas cassava (Manihot esculenta) had high root retention of Mn. In cowpea, Mn tolerance was associated with rapid uptake and translocation to tops (Foy et al., 1988).
Chickpea (Cicer arietinum L.) is an important pulse crop with an annual production of 11.5 million tonnes worldwide (Maesen et al., 2007; Merga and Haji, 2019). However, the yield of chickpea tends to be low and unstable, with a world average yield of 850 kg/ha (Merga and Haji, 2019), well below the estimated yield potential of 4,000 kg/ha (Singh et al., 1993; Singh and Ocampo, 1997). Part of the yield gap may be due to soil acidity constraints since the current pH (CaCl2) recommendation for chickpea cultivation is >5.5, and a surface pH of 5.0 is suitable only if subsurface pH is higher than 5.5 (Harries et al., 2005). Domestic chickpea cultivars are limited in their diversity, and traditional breeding methods have not produced cultivars with a large impact on chickpea production (Singh and Ocampo, 1997). Hence, wild Cicer can be exploited to develop resistant cultivars against stressors including low pH (Singh and Ocampo, 1997; Berger et al., 2003). Identifying acid tolerance in existing chickpea cultivars or in wild Cicer accessions, to develop more acid-tolerant cultivars, could increase the productivity and expand chickpea cultivation worldwide on acid soils.
Overall, screening for tolerance to acidic soils has focused on Al toxicity (Hayes et al., 2012). However, screening only for Al toxicity would be incomplete for improving chickpea tolerance to acid soils without ensuring that the germplasm also expressed tolerance to Mn toxicity. Interspecific and intraspecific differences in tolerance to Mn toxicity have been previously identified among crop plants providing potential to develop cultivars adapted to Mn stress in acid soils (Foy et al., 1988; Moroni et al., 2003). Chickpeas are considered very sensitive to Mn toxicity (GRDC, 2016), but research on response of chickpeas to Mn toxicity is very limited. Moreover, there are no previous screening studies reported on chickpea germplasm for Mn toxicity tolerance. The aim of this research was to develop a protocol for screening chickpeas in solution culture for Mn toxicity, so that wild Cicer accessions and chickpea germplasm can be ranked for Mn toxicity tolerance. Our main objectives were to (a) to determine the critical solution Mn level and duration of the experiment that differentiates tolerant and sensitive Cicer germplasm, (b) to identify suitable plant parameters that can identify Mn toxicity and can easily be used to rank a wide range of Cicer germplasm, and (c) to investigate how excess Mn2+ interacts with Ca2+ and Fe2+ in Cicer and the likely mechanism of tolerance to Mn excess.
Materials and Methods
Plant Material and Growth Conditions
A solution culture experiment was conducted in a growth cabinet set at 22°C and 12-h-day length. The light intensity at canopy height during the experiment as photosynthetically active radiation was around 500 μmol m–2 s–1. A split-plot experiment was designed with Mn treatments as main plots and cultivars as subplots. The experiment had five chickpea genotypes, including three released chickpea cultivars (Ambar, PBA HatTrick, and PBA Striker) and two wild Cicer species [Cicer reticulatum (AGG accession number 499361) and Cicer echinospermum (accession number 501662)]. C. reticulatum and C. echinospermum will be referred to as C.retic and C.echino throughout the manuscript. The rationale for inclusion of wild Cicer species in screening for abiotic stress tolerance traits and their collection environment were previously published (von Wettberg et al., 2018). Lupin (Lupinus angustifolius; variety Mandelup lupin) was included as a Mn-tolerant check (Blamey et al., 2015, 2017).
Solution Composition
The ionic concentration of the solution, activity of Mn2+, and free activity of the ions were computed using a chemical speciation software, Geochem-EZ (Shaff et al., 2010). The basal nutrient solution used for this study had the following concentrations: Ca(NO3)2⋅4H2O, 400 μM; K2SO4, 350 μM; MgSO4⋅7H2O, 200 μM; NH4NO3, 100 μM; NH4H2PO4, 60 μM; H3BO3 10 μM; ZnSO4⋅7H2O, 0.6 μM; CuSO4⋅H2O, 0.2 μM; and Na2MoO4⋅2H2O, 0.1 μM. Iron was added as 20 μM Fe-EDTA prepared from equimolar amounts of FeCl3⋅6H2O and Na2EDTA. The experiment had eight Mn treatments (in μM Mn): 2 (as control), 25, 50, 100, 150, 200, 250, and 500. Manganese was added as MnSO4⋅H2O. The pH of the initial nutrient solution was adjusted to 5.2 and maintained at 5.2 throughout the experiment with daily adjustments of 0.5 M HCl or NaOH. The experiment container had a capacity of 30 L, and the solution was renewed weekly.
Seed Preparation and Experimental Setup
The seeds were initially scarified and then sterilized in 3% sodium hypochlorite for 5 min and thoroughly rinsed with deionized (DI) water. Seeds were germinated in wet paper towel in sealed plastic containers. Tap water was used to moisten the paper towel, and the containers were kept in dark conditions for 4 days at 22°C. The seeds were checked on alternate days for moisture and supplemented with water if needed. The germinated uniform seedlings were transferred into the lids of the experimental containers. The lids were made of 15-mm rigid white PVC foam, and strips of polyurethane foam held the seedlings into the lids of the experimental container. Six seedlings were transplanted for a genotype for a treatment, and the experiment was replicated thrice. The nutrient solution in the containers was aerated continuously. The plants were grown initially for 12 days in basal nutrient solution with 2 μM Mn (control) before adding Mn treatments. There were two harvests, 14 and 28 days after Mn treatment additions, and three plants per genotype at each harvest.
Plant and Solution Measurements
The plants were scored for Mn toxicity symptoms weekly (at 7, 14, and 22 days) after Mn treatment additions to study the Mn effect over the experiment period, using a score card developed for chickpeas ranging from 0 (no symptoms) to 5 (very severe). Chlorophyll fluorescence measurements, Fv/Fm (variable fluorescence/maximum fluorescence) values, and the performance index (PI) were recorded for chickpea plants 3 weeks after Mn treatment additions using a Hansatech Handy PEA chlorophyll fluorometer. The measurements were made using leaf clips of 4-mm diameter on fully emerged leaves that had been dark adapted for 8 min. Dark adaptation was done using lightweight leaf clips which cover a section of the leaf.
Three plants per genotype were harvested at 14 and 28 days after Mn treatments and divided into shoot and root samples. The shoot was partitioned into old leaves (bottom two to three leaves from each branch), young leaves (top two to three leaves), and the rest of the shoot, and the remnant seeds were removed when weighing the samples. Roots from one of the plants were rinsed in DI water and stored in a refrigerator (4°C) before total root length, root volume, surface area, and root diameter measurements using the WinRHIZO root scanner. The shoot and root samples were dried in an oven for 3 days at 60°C to record shoot and root dry weight. Only the plant samples from Mn treatments of 2 μM (as control) and 100 to 200 μM (as they showed greater discrimination among genotypes for toxicity symptoms and plant growth) were acid digested using 70% conc. HNO3 in the digestion block for inductively coupled plasma (ICP) spectrometer analysis of Mn, Fe, and Ca. The following plant growth indices were calculated: relative shoot weight percentage, relative root weight percentage, relative root length, and root/shoot ratios.
Solution samples were collected during initial solution preparation and weekly at each renewal. The samples were filtered (using 0.45-μm filters) and acidified for ICP analysis of nutrients.
Statistical Analysis
Statistics was performed using the GenStat Version 18 (VSN International, United Kingdom) analytical software. Analysis of variance (ANOVA) was computed using a split-plot model to assess the effect of Mn treatments and its interaction with genotypes. Manganese treatments were the main-plot factor, and genotypes were the subplot factor. Lupin data were included in computing the ANOVA. The data were log-transformed for parameters if they were not normally distributed. In such cases, log-transformed means along with back-transformed means in brackets were presented. The least significant difference, LSD (at P ≤ 0.05), was used to test for differences among the means of Mn treatments, genotypes, and their interactions. The level of significance (P values) and LSD0.05 values within and between Mn treatments were included only when the interactions (Mn treatments × genotypes) were significant.
Results
Nutrient Composition of the Solution
The nutrient solutions used in 15 previous Mn screening studies for various plant species were reviewed (data presented as Supplementary File, Table A). Solutions used in Mn screening studies varied in composition of basal nutrients, Mn concentrations, and pH levels, even among studies with the same plant species. For example, the solution used by Rout et al. (2001) to study Mn toxicity in rice was fourfold more concentrated than the nutrient solutions used by Shrestha et al. (2018). In order to mimic soil solution composition, the concentrations of macronutrients used in the current experiment were diluted when compared to other Mn screening studies in rice (Shrestha et al., 2018), triticale (Quartin et al., 1998), wheat (Khabaz-Saberi et al., 2010), and cotton (Foy et al., 1995) to name a few, and the pH of 5.2 was the average of 15 other Mn screening studies reviewed.
According to Geochem-EZ analysis, the ionic strength of nutrient solutions increased with Mn treatments from 3,287 μM (basal + 2 μM Mn) to 5,000 μM (basal + 500 μM Mn) (Table 1). About 90–94% of added Mn was present as free Mn2+ depending on Mn treatments. At solution renewal (weekly), Mn concentrations analyzed in the solution ranged between 70 and 92% of the nominated Mn concentrations in treatments of 50–500 μM Mn.
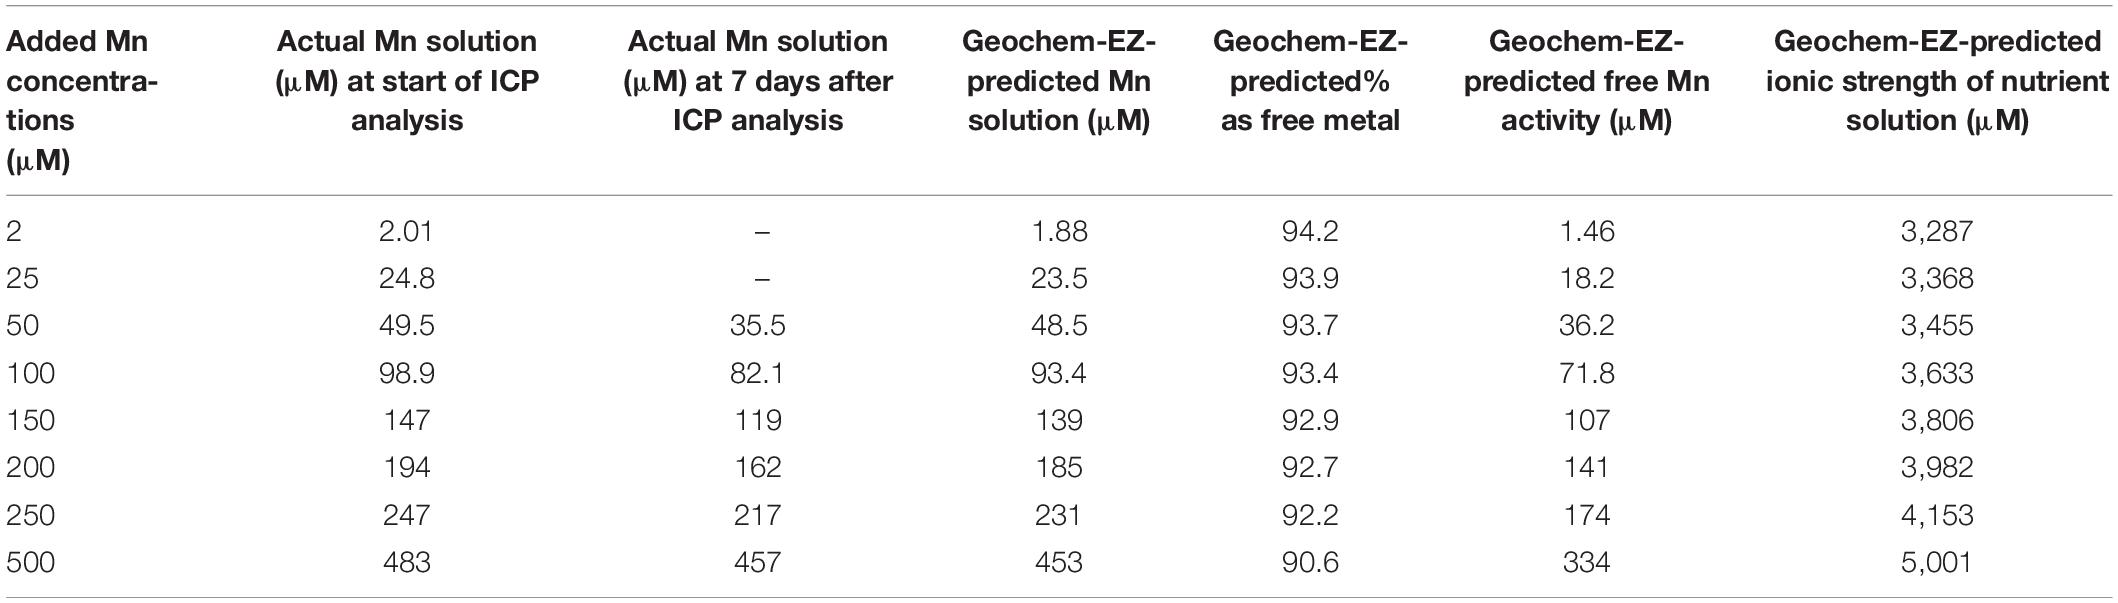
Table 1. Mn concentrations analyzed in nutrient solutions compared with Geochem-EZ Mn concentrations and activity and ionic strength.
Scoring of Plants for Mn Toxicity Symptoms
To rate Mn toxicity symptoms in Cicer, the plants were scored on a 0 to 5 scale (0: no symptoms, 1: very mild, 2: mild, 3: moderate, 4: severe, and 5: very severe). The detailed scoring system and pictorial descriptions are presented in the Supplementary File, Table B. In general, there was chlorosis in young leaves, and as the Mn toxicity increased, the chlorotic areas extended inwards toward the midrib, and there were brown necrotic spots in older leaves. With Mn > 150 μM, older leaves turned brown and had rusty-colored spots, and necrotic areas enlarged and covered most of the Cicer leaves except for an area around the base and midrib of leaflets. At high Mn toxicity levels, the young leaves were shriveled and curled, their size was significantly reduced, and leaflets dropped from the plants. Figure 1 shows the leaf symptoms of Cicer plants for Mn toxicity and the relevant scores.

Figure 1. Scoring of Cicer sp. for Mn toxicity symptoms.
The Cicer plants grown in 2 and 25 μM Mn treatments showed no symptoms at 7, 14, and 22 days after Mn treatments (Figure 2). There was a significant increase in Mn toxicity scores with the increase in Mn levels from 50 to 500 μM (P < 0.0001) (Figure 2). The plants showed very mild symptoms with 50 μM Mn in all of the Cicer genotypes. With 100 μM Mn addition, there was differentiation among genotypes especially after 7 days of Mn addition, with PBA Striker scoring less compared to wild accessions. Similarly, with 150 μM Mn, the genotypes Ambar and PBA Striker showed mild Mn toxicity symptoms, whereas other genotypes showed moderate symptoms at 7 days after Mn treatment addition. The symptoms with 200 μM Mn were mostly moderate when scored at 7 days and increased to mostly severe symptoms at 22 days of Mn treatment. The symptoms on 7, 14, and 22 days after Mn were mostly severe and very severe at 250 and 500 μM Mn, respectively. The differentiation among genotypes was not obvious at 14 and 22 days after Mn scoring.
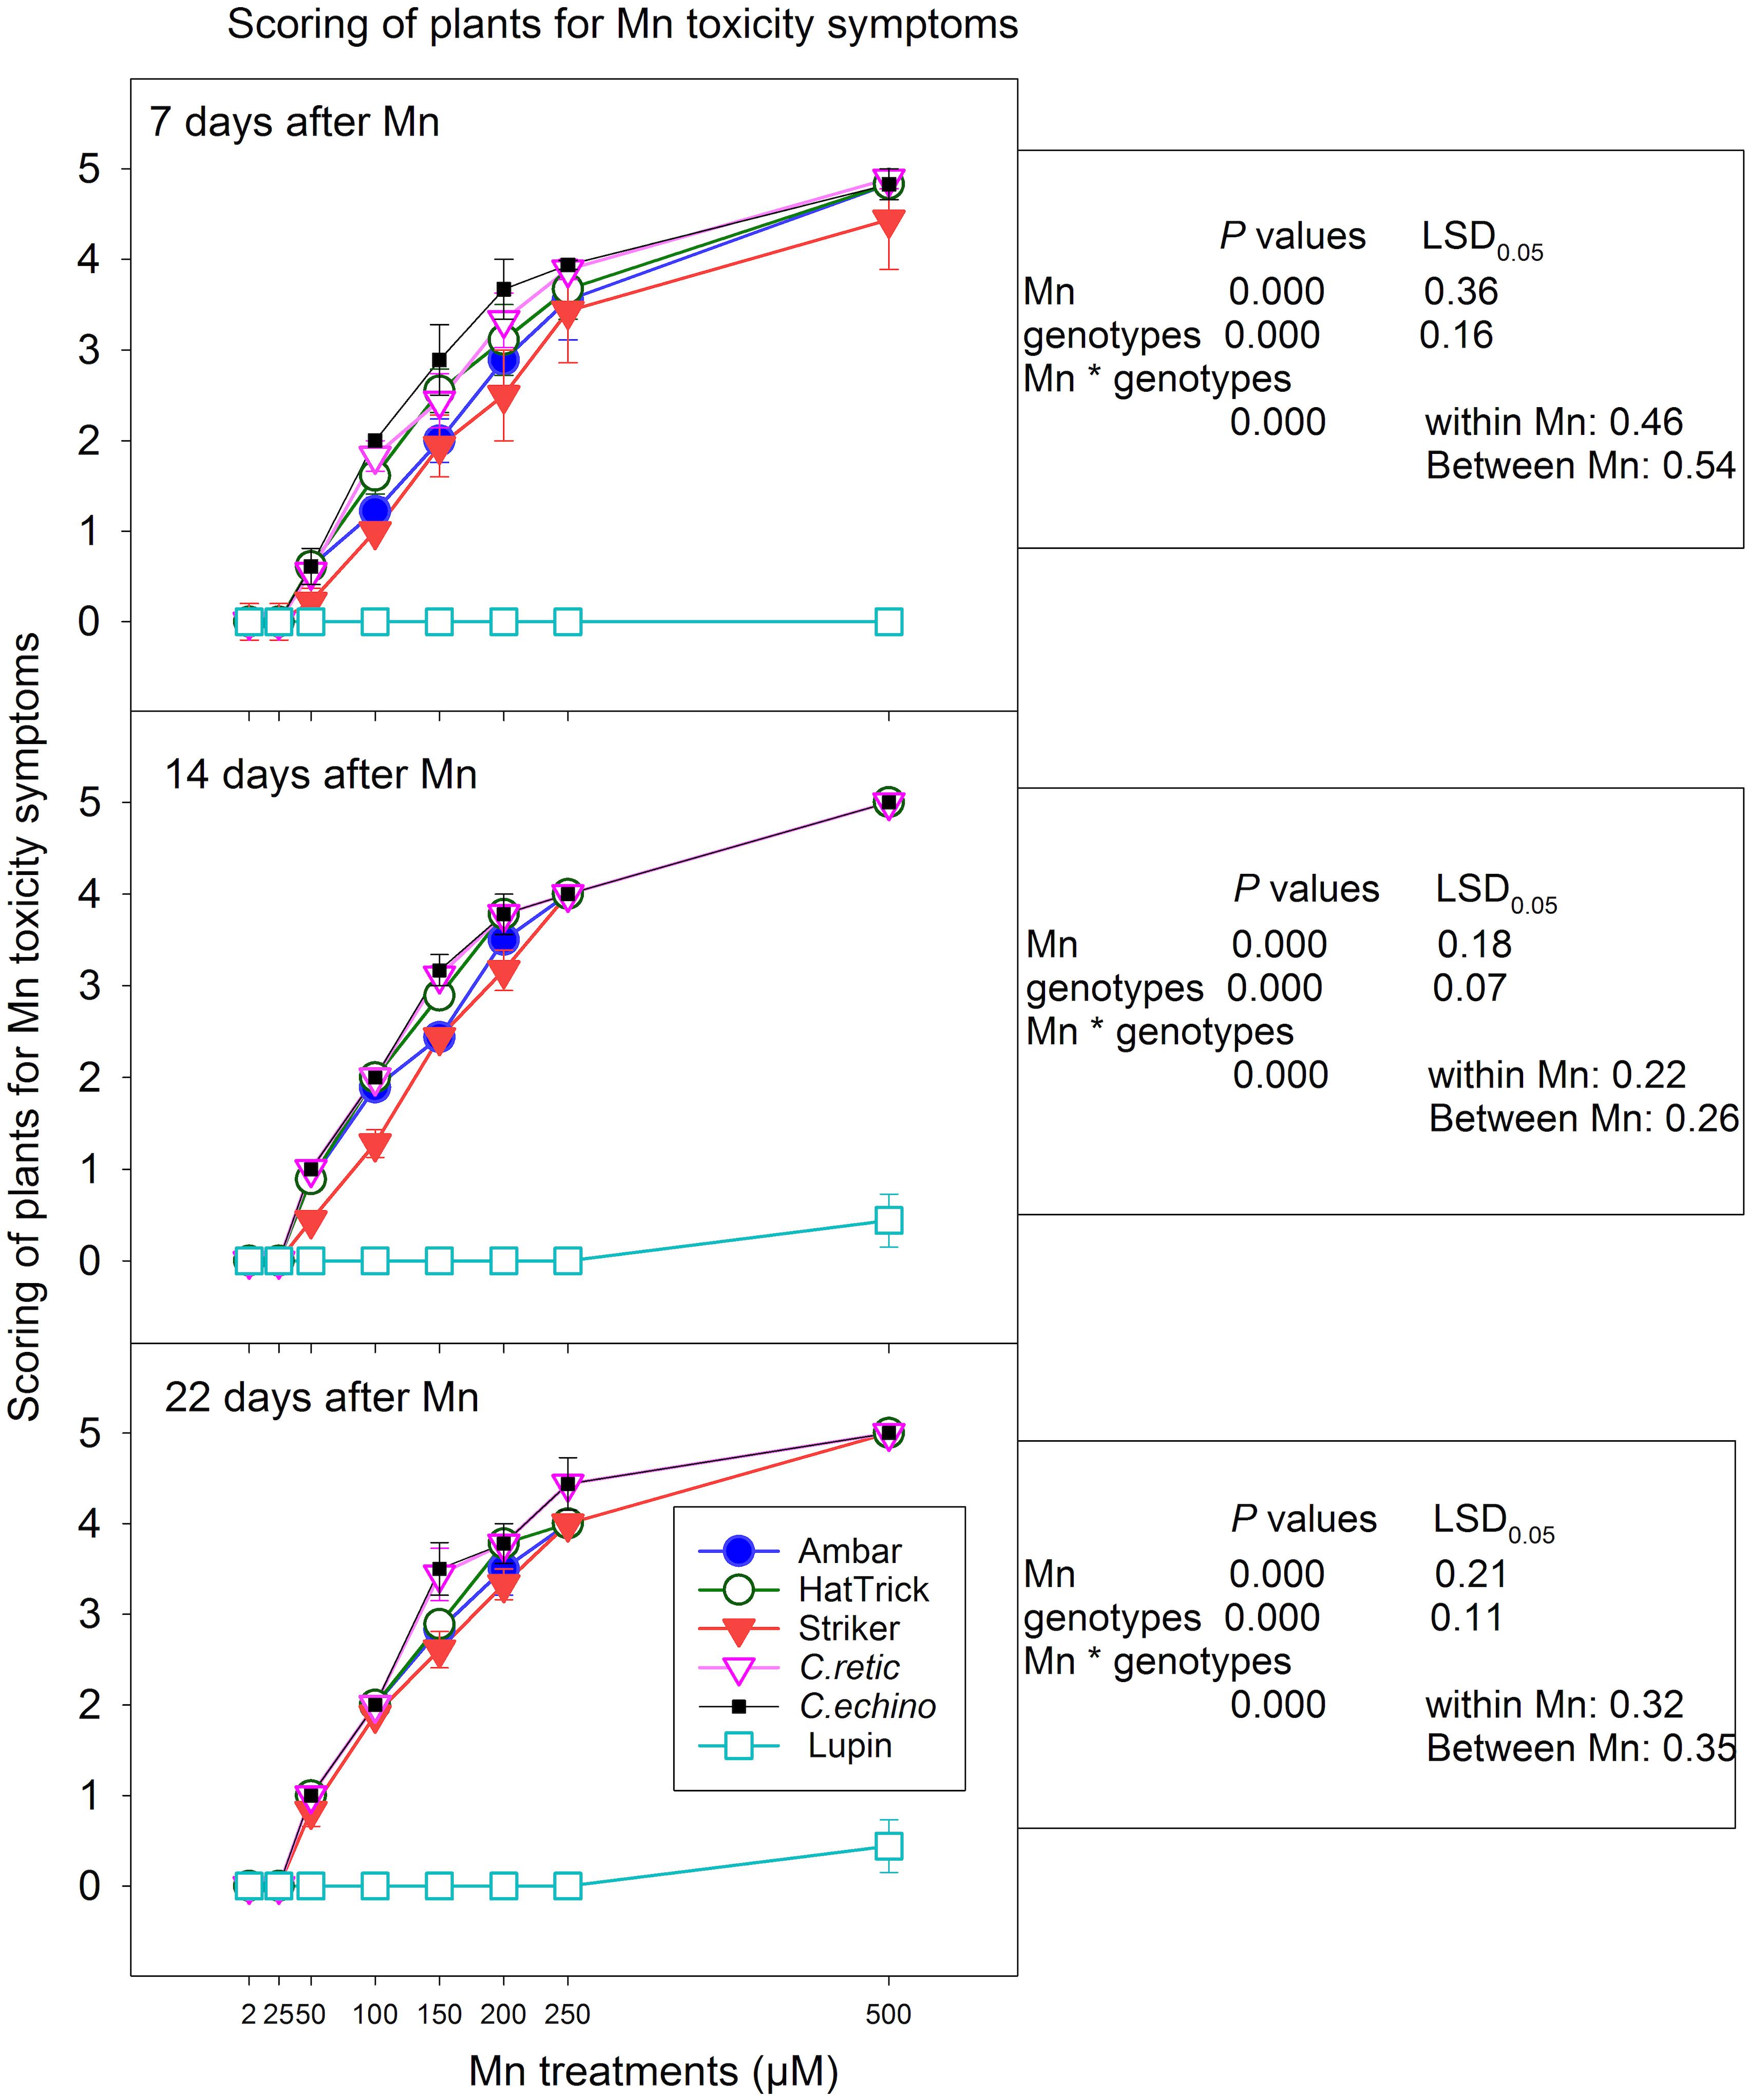
Figure 2. Scoring of Cicer genotypes and lupin for Mn toxicity symptoms at 7, 14, and 22 days after Mn additions. Vertical bars where visible represent the standard error of the mean. See Figure 1 for images of the symptoms for scores 0–5.
In general, mean scoring of genotypes across eight Mn treatments showed fewer symptoms in the PBA Striker, and the wild accessions showed more intense symptoms for Mn toxicity, and the severity increased with the increase in number of days of Mn exposure in all the genotypes. However, there was a significant correlation between scoring at 7 days and 14 days (r = 0.979) and 22 days (r = 0.972), as well as symptoms between 14 and 22 days (r = 0.993). Among the domestic cultivars, the PBA HatTrick showed more intense Mn toxicity symptoms compared with the PBA Striker. The scoring of Mn toxicity symptoms at 7 and 14 days after Mn treatments had a similar level of significant negative correlations with relative shoot dry weights (r = −0.92) and root dry weights (r = −0.84) at first harvest. Also, the scoring at 22 days was significantly correlated with relative shoot dry weight (r = −0.88) and root dry weight (r = −0.89) at the second harvest. Lupin showed no Mn toxicity symptoms at all Mn treatments except a very mild yellowing in two plants with 500 μM Mn treatment scored at 14 and 22 days after Mn.
Plant Growth
Shoot Dry Weight
At 14 days after Mn addition, there was a significant decrease in shoot dry weight (P < 0.001), and the interaction between treatment and genotypes was significant (P = 0.03). In general, among the Cicer genotypes, the PBA Striker had higher mean shoot dry weight while both wild Cicer accessions had the least shoot dry weight across all Mn treatment levels (Figure 3). The shoot dry weight at both harvests was not significantly different at 25 and 50 μM Mn compared to the control. The relative reduction in shoot dry weight in Cicer ranged between 21 and 42% with 100–500 μM Mn. The Mn concentrations, 100–200 μM Mn, showed better discrimination in relative shoot dry weight among the Cicer genotypes (Figure 3). At 100 μM Mn, the PBA HatTrick showed the highest relative reduction of 30%. However, at 150 μM Mn, C.retic showed greater shoot dry weight reduction (39%) compared to C.echino (27%); cultivars PBA HatTrick, Ambar, and PBA Striker showed 36, 25, and 23% reductions, respectively. The reduction in shoot dry weight at the highest Mn, 500 μM, was 38% or more in Cicer genotypes. In general, lupin did not show consistent change in shoot dry weight with Mn additions.
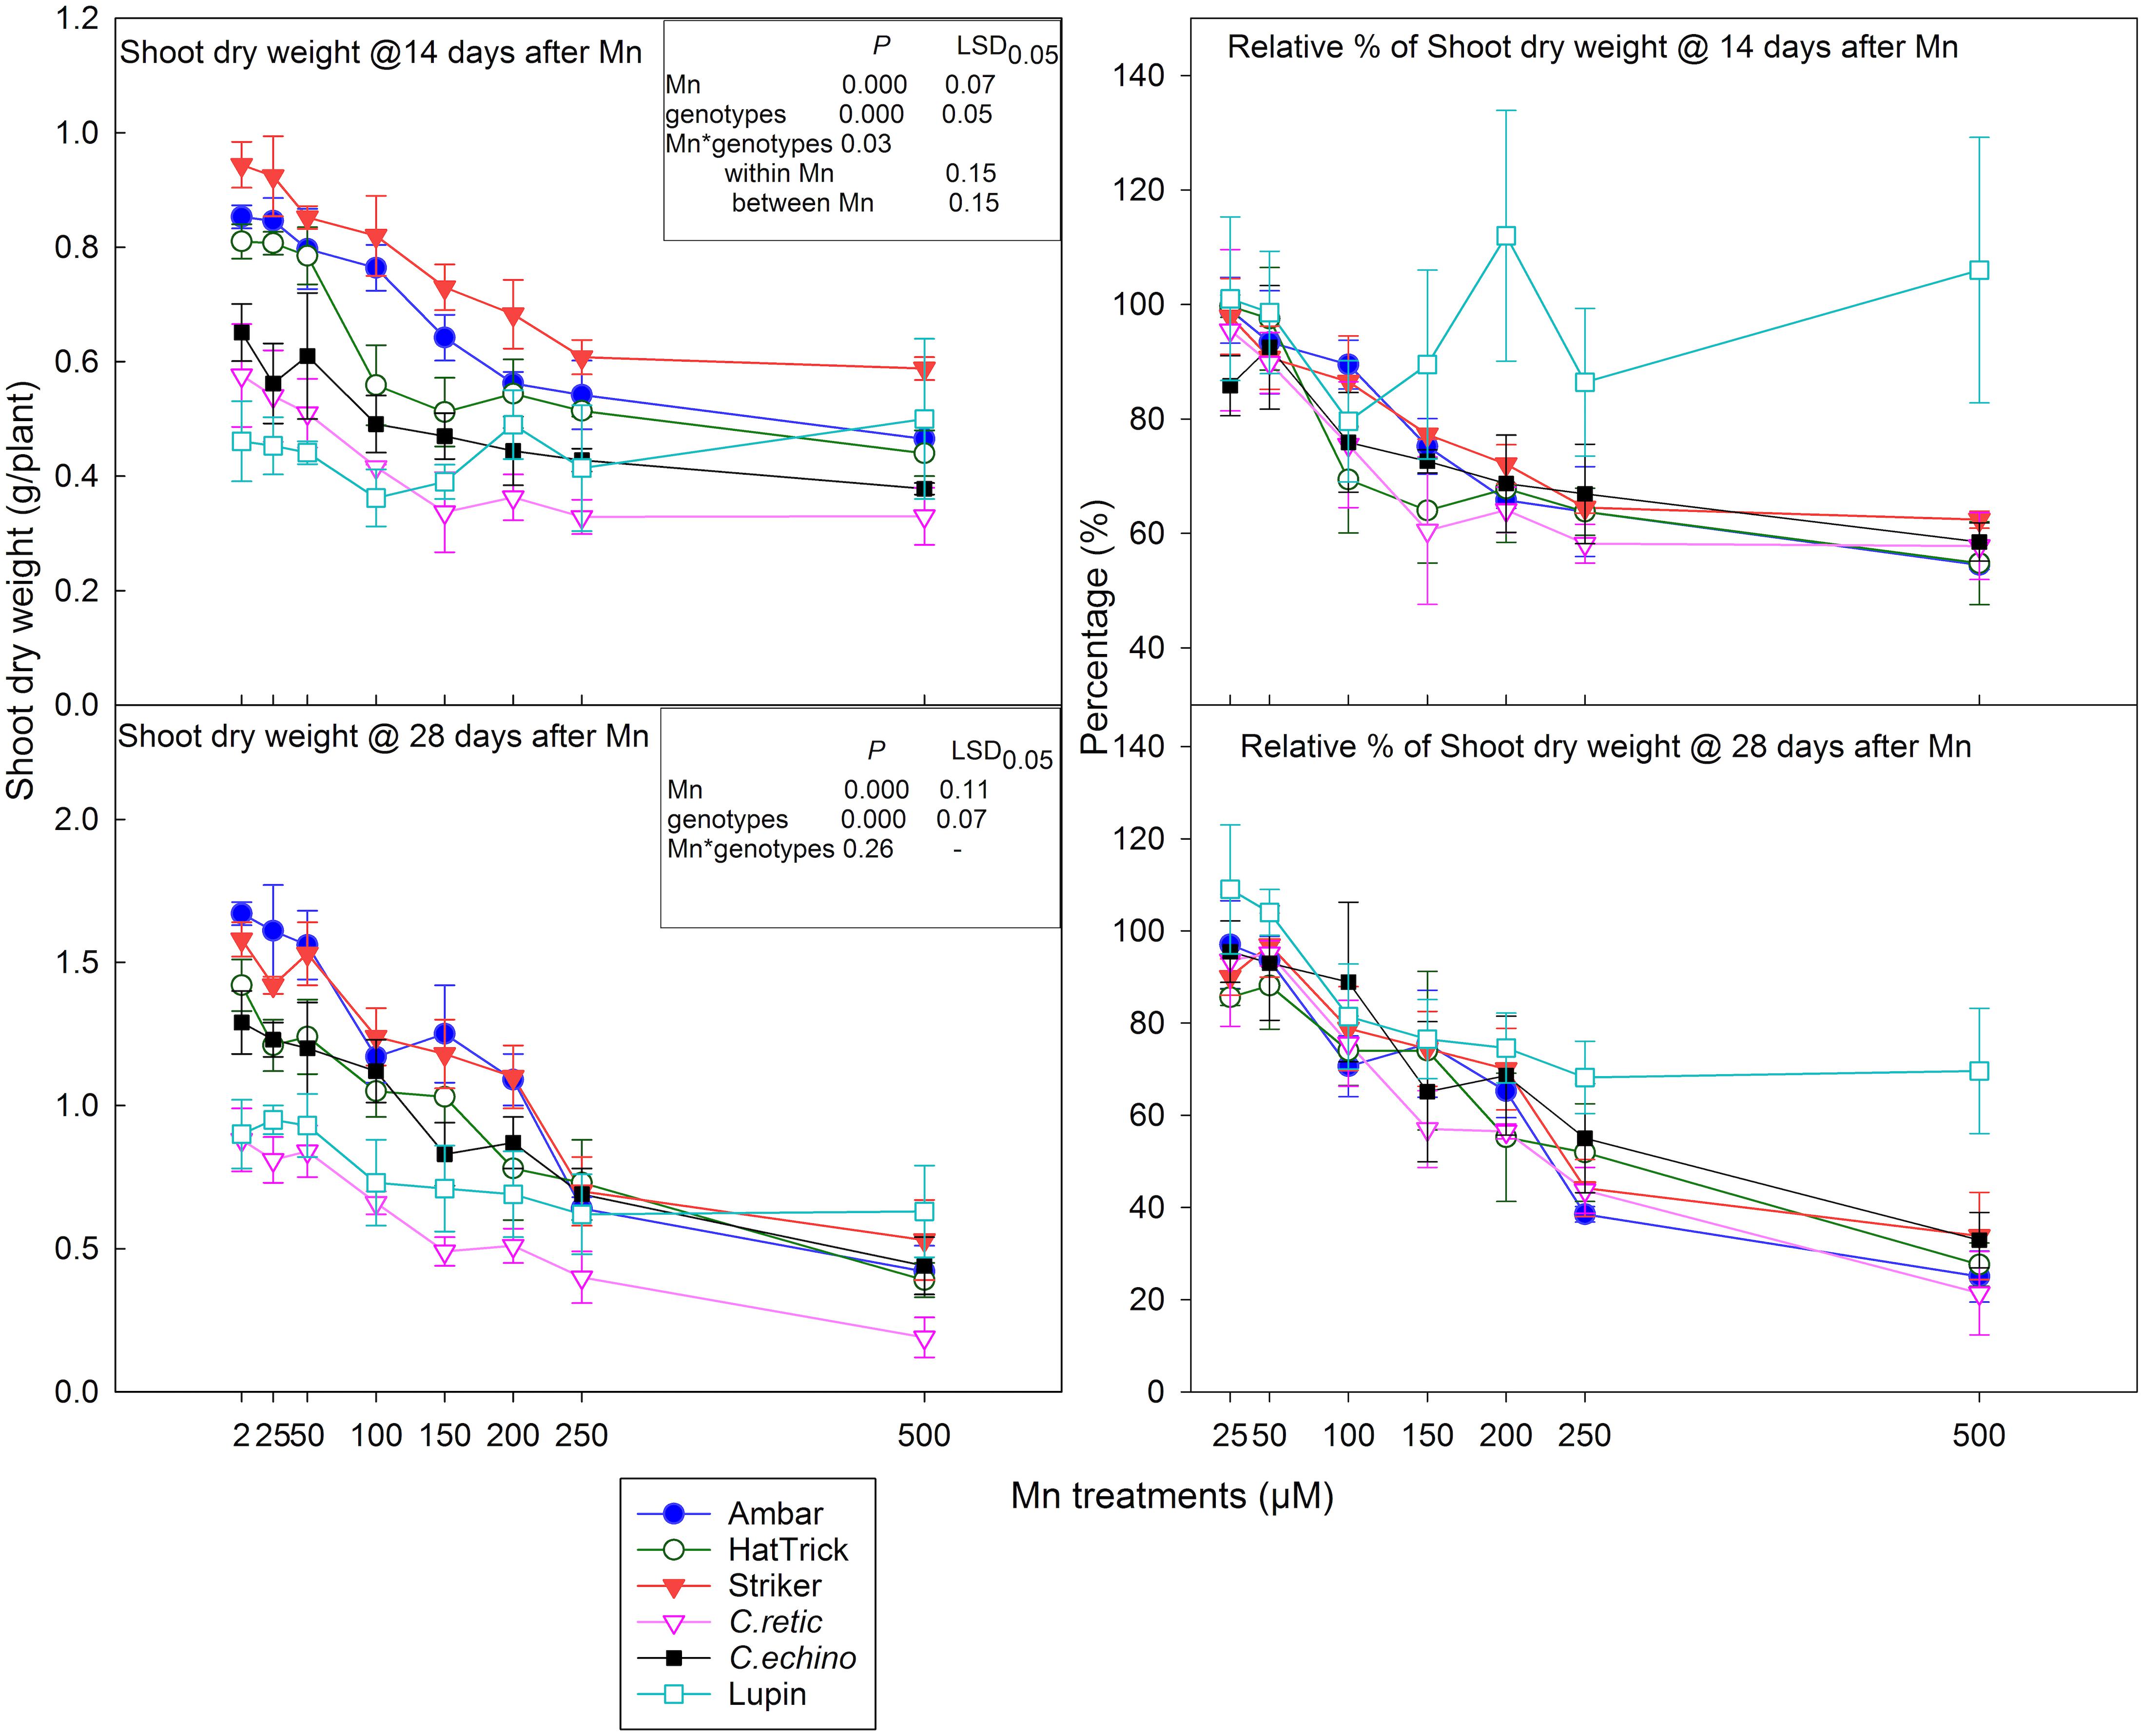
Figure 3. Shoot dry weight at 14 and 28 days after Mn treatments and their relative shoot dry weight percentage (in relation to 2 μM) of five Cicer genotypes and lupin. Vertical bars where visible represent the standard error of the mean.
In general, shoot dry weight at 28 days after Mn treatment additions followed a similar trend as that at 14 days; however, the interaction between Mn treatments and genotypes was not significant (P = 0.127). The reduction in dry weight due to Mn toxicity intensified at the second harvest, especially at high Mn treatment levels (Figure 3). The mean relative reduction in shoot dry weight at 100 μM was 22%, and at 500 μM, it increased to 72%. Mean shoot dry weight measured across eight Mn treatments for the PBA HatTrick was significantly less than that for Ambar and PBA Striker. Lupin showed 18–30% relative reduction in shoot dry weight when Mn concentrations in the solution increased from 100 to 500 μM.
Root Dry Weight
The interaction of root dry weight measured at 14 days after Mn additions was significant between Mn treatment and genotypes (P = 0.01), and the relative reduction in root dry weight due to Mn toxicity was greater than shoot dry weight in Cicer genotypes (Figures 3, 4). The mean reduction in root dry weights at 250 and 500 μM Mn was 20% higher than that in shoot dry weight. However, there was a strong positive correlation between shoot and root dry weight measured at 14 days after Mn treatments (r = 0.829). Relative shoot dry weight and root dry weight of wild C.retic accession and the domestic cultivar PBA HatTrick were less than that for other genotypes, especially at 150 μM and above. At 100 μM Mn, the reduction in root dry weight ranged between 13% in C.echino and 33% in PBA HatTrick, whereas at 200 μM Mn, PBA Striker showed comparatively low root weight reduction of 26% compared with other genotypes. The reduction in root dry weight was high in C.retic, ranging between 58 and 68%, in Mn concentrations of 150 μM and above. Among the domestic cultivars, PBA HatTrick was affected more by Mn toxicity than were Ambar and PBA Striker at levels of 100 and 200 μM with 10–20% more root dry weight reduction. However, at high Mn levels, 250 and 500 μM, there was less differentiation among the Cicer genotypes. The mean root dry weight of eight Mn levels for PBA HatTrick was significantly lower than that for other domestic cultivars, while wild accession C.retic had the lowest mean root weight among the Cicer genotypes. Lupin showed inconsistent responses to Mn additions (Figure 4).
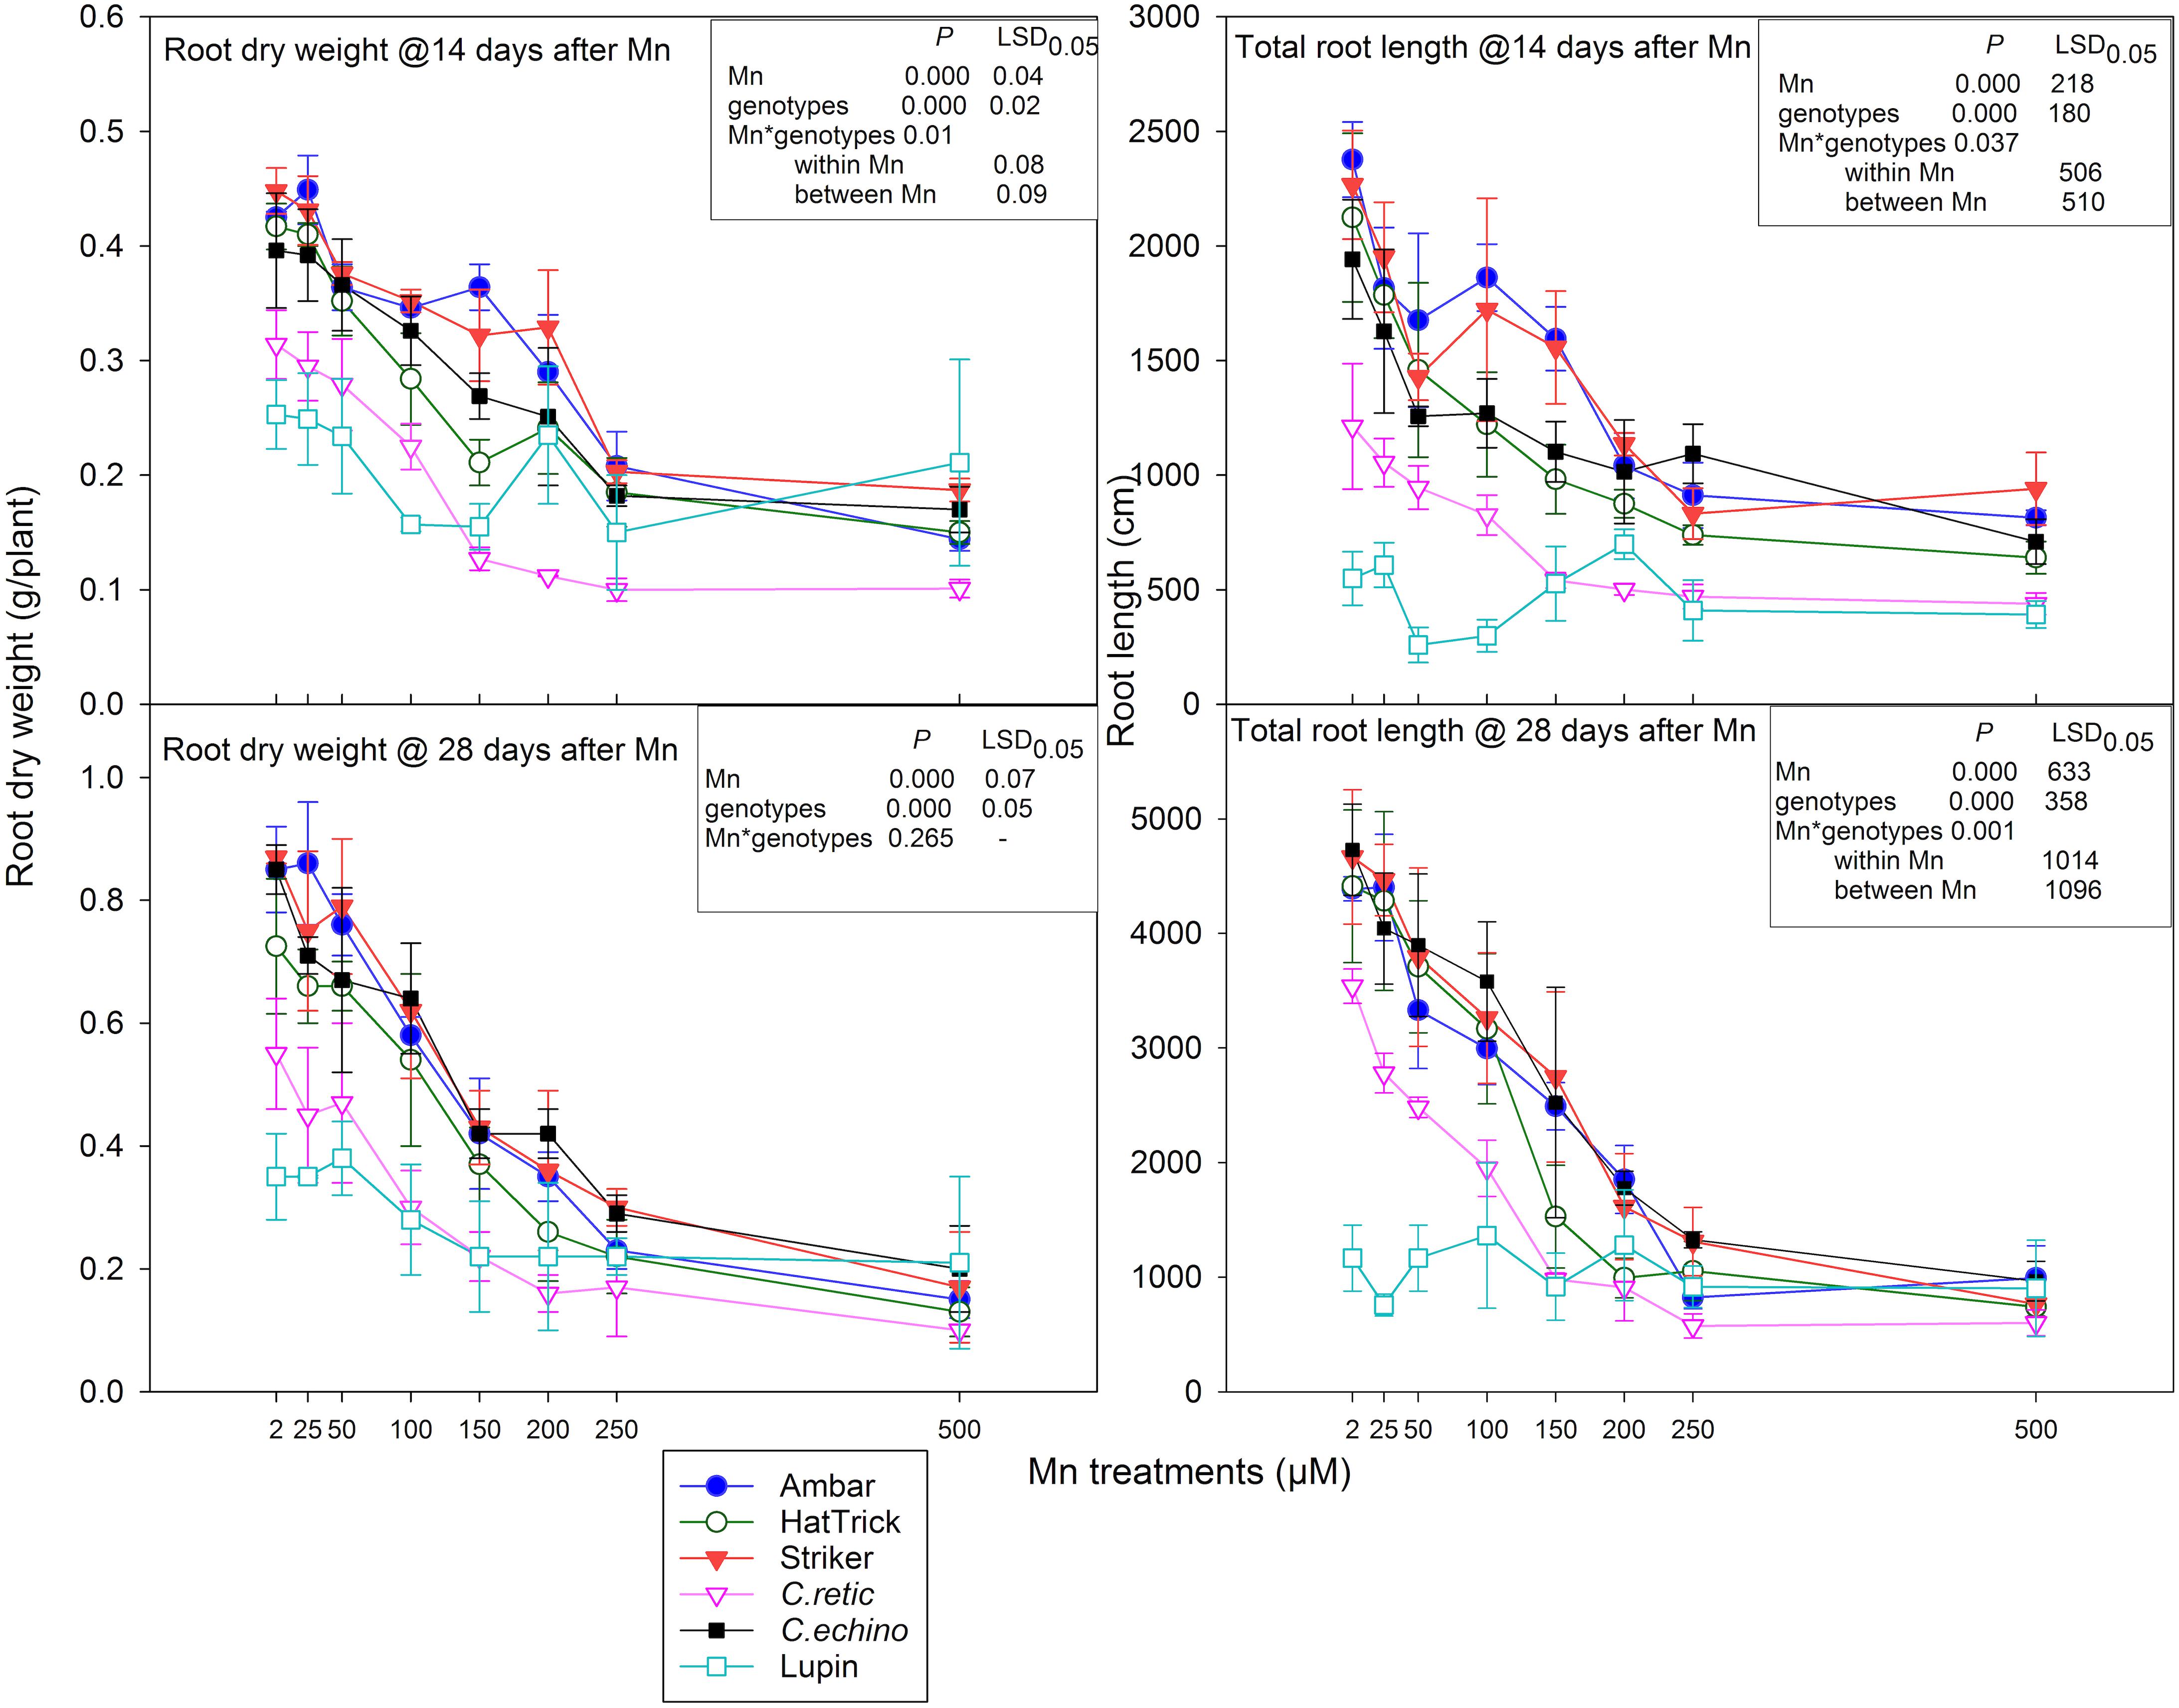
Figure 4. Root dry weight (g/plant) and total root length (cm/plant) at 14 and 28 days after Mn treatments of Cicer genotypes and lupin. Vertical bars where visible represent the standard error of the mean.
At the second harvest, there was a 15% greater reduction in relative root dry weight of Cicer genotypes than at 14 days at 150 μM Mn and above. However, there was no significant interaction between Mn treatments and genotypes (P = 0.265). Similar to shoot dry weight, at 25 and 50 μM, the mean root dry weight was not significantly different from control at both harvests. With the increase in Mn concentrations from 100 to 500 μM, the mean reduction in root dry weight increased from 29 to 80% (Figure 4). Lupin showed around 50% root dry weight reduction at 500 μM Mn. There was a significant correlation between root dry weight at the first and second harvests (r = 0.82) and also between shoot and root dry weight at the second harvest (r = 0.88). At both harvests, C.echino had higher root/shoot ratio than other Cicer genotypes (data not presented).
Total Root Length
The total root length measured after 14 days of Mn treatments responded to the interaction between Mn and genotypes (P = 0.04). The mean root length across Mn treatments for genotypes Ambar and PBA Striker was significantly greater than that of other genotypes, and wild C.retic accession had the least root length. With Mn increase from 2 to 500 μM in solutions, the decline in total root length ranged between 10 and 64% in Cicer genotypes (Figure 4). At 100 μM Mn, PBA HatTrick showed higher reduction in total root length, and at 150 μM Mn, the decline was greater in PBA HatTrick (51%) and C.retic (54%) than in other genotypes. The relative reduction in root length was less in C.echino at 150–250 μM Mn than in C.retic (Figure 4).
Similar to root weight, the reduction in total root length was greater at the second harvest than at the first harvest, especially at 150 μM Mn and above (Figure 4). The interaction between Mn treatments and genotypes was significant (P = 0.000) for total root length at the second harvest. At 100 and 150 μM Mn, C.retic showed significant root length reduction compared with other Cicer genotypes; at 150 μM Mn, C.retic had 32, 28, and 23% greater relative root length reduction than genotypes PBA Striker, Ambar, and C.echino, respectively. At 250 and 500 μM Mn, the relative reduction in root length was more than 70 and 75%, respectively, in all the Cicer genotypes, while lupin showed only 25% reduction in root length at 500 μM Mn.
Chlorophyll Fluorescence Measurements
The mean variable fluorescence/maximum fluorescence (Fv/Fm) values of Cicer genotypes for 150 μM Mn and above were significantly lower than that of the control (Figure 5). However, the interaction between Mn treatments and Cicer genotypes for Fv/Fm measured at 3 weeks after Mn treatments was not significant (P = 0.242). The highest Mn treatment, 500 μM, reduced Fv/Fm measurements in Cicer genotypes by only 22%. The chlorophyll fluorescence measurements as Fv/Fm were negatively correlated with Mn toxicity scores at 7 days (r = −0.79), 14 days (r = −0.72), and 22 days (r = −0.72).
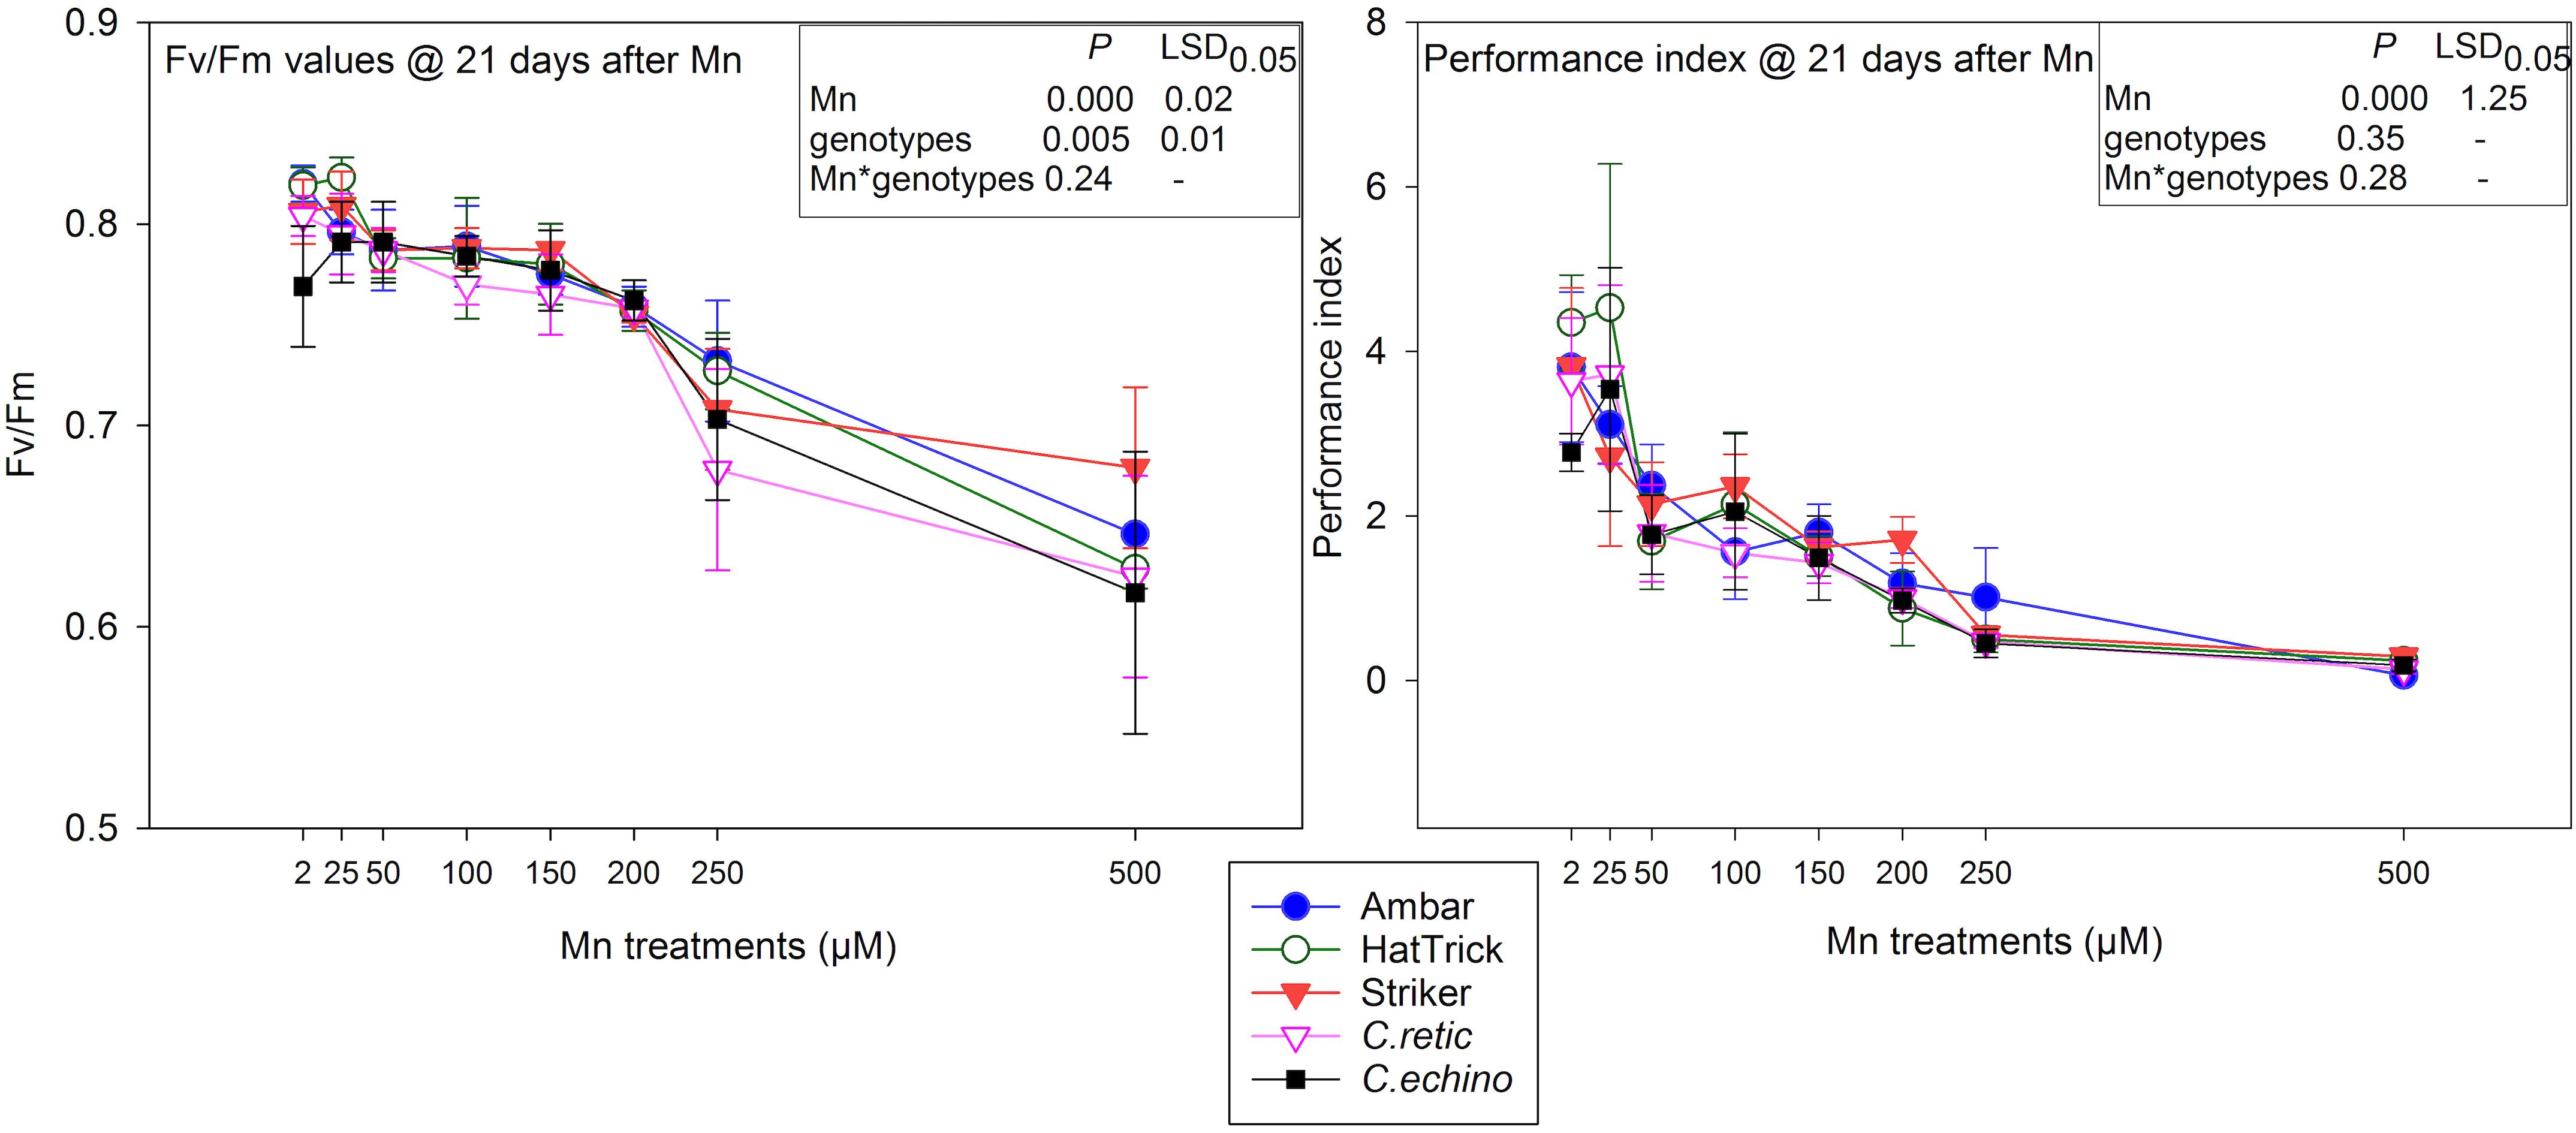
Figure 5. Fv/Fm values and performance index (PI) of five Cicer genotypes in eight Mn treatment levels measured at 21 days after Mn additions. Vertical bars where visible represent the standard error of the mean.
PI measurements were more sensitive to Mn toxicity than were Fv/Fm values in Cicer genotypes with a significant reduction in mean values of PI for Mn treatments 50 μM and above (Figure 5). There was 45% reduction in PI at 50 μM Mn and up to 94% at 500 μM Mn. However, there was no significant interaction between Mn treatments and genotypes (P = 0.2819). Similar to Fv/Fm, there were significant negative correlations between PI values and plant scores at 7 days after Mn (-0.73), 14 days (r = −0.75), and 22 days (r = −0.750).
Ion Concentrations in Leaves and Roots
Mn Concentrations and Uptake
Manganese concentrations in young leaves increased with an increase in Mn solution concentrations (Table 2); among the genotypes, the Mn increase in wild Cicer accessions and PBA Striker was higher than that in Ambar and PBA HatTrick at both harvests when compared to the control. Among the genotypes, PBA Striker and C.echino had significantly higher mean Mn concentration in young leaves at the first harvest compared with other Cicer genotypes (P ≤ 0.05); however, there was no significant difference in young leaf Mn concentrations among the Cicer genotypes at the second harvest.
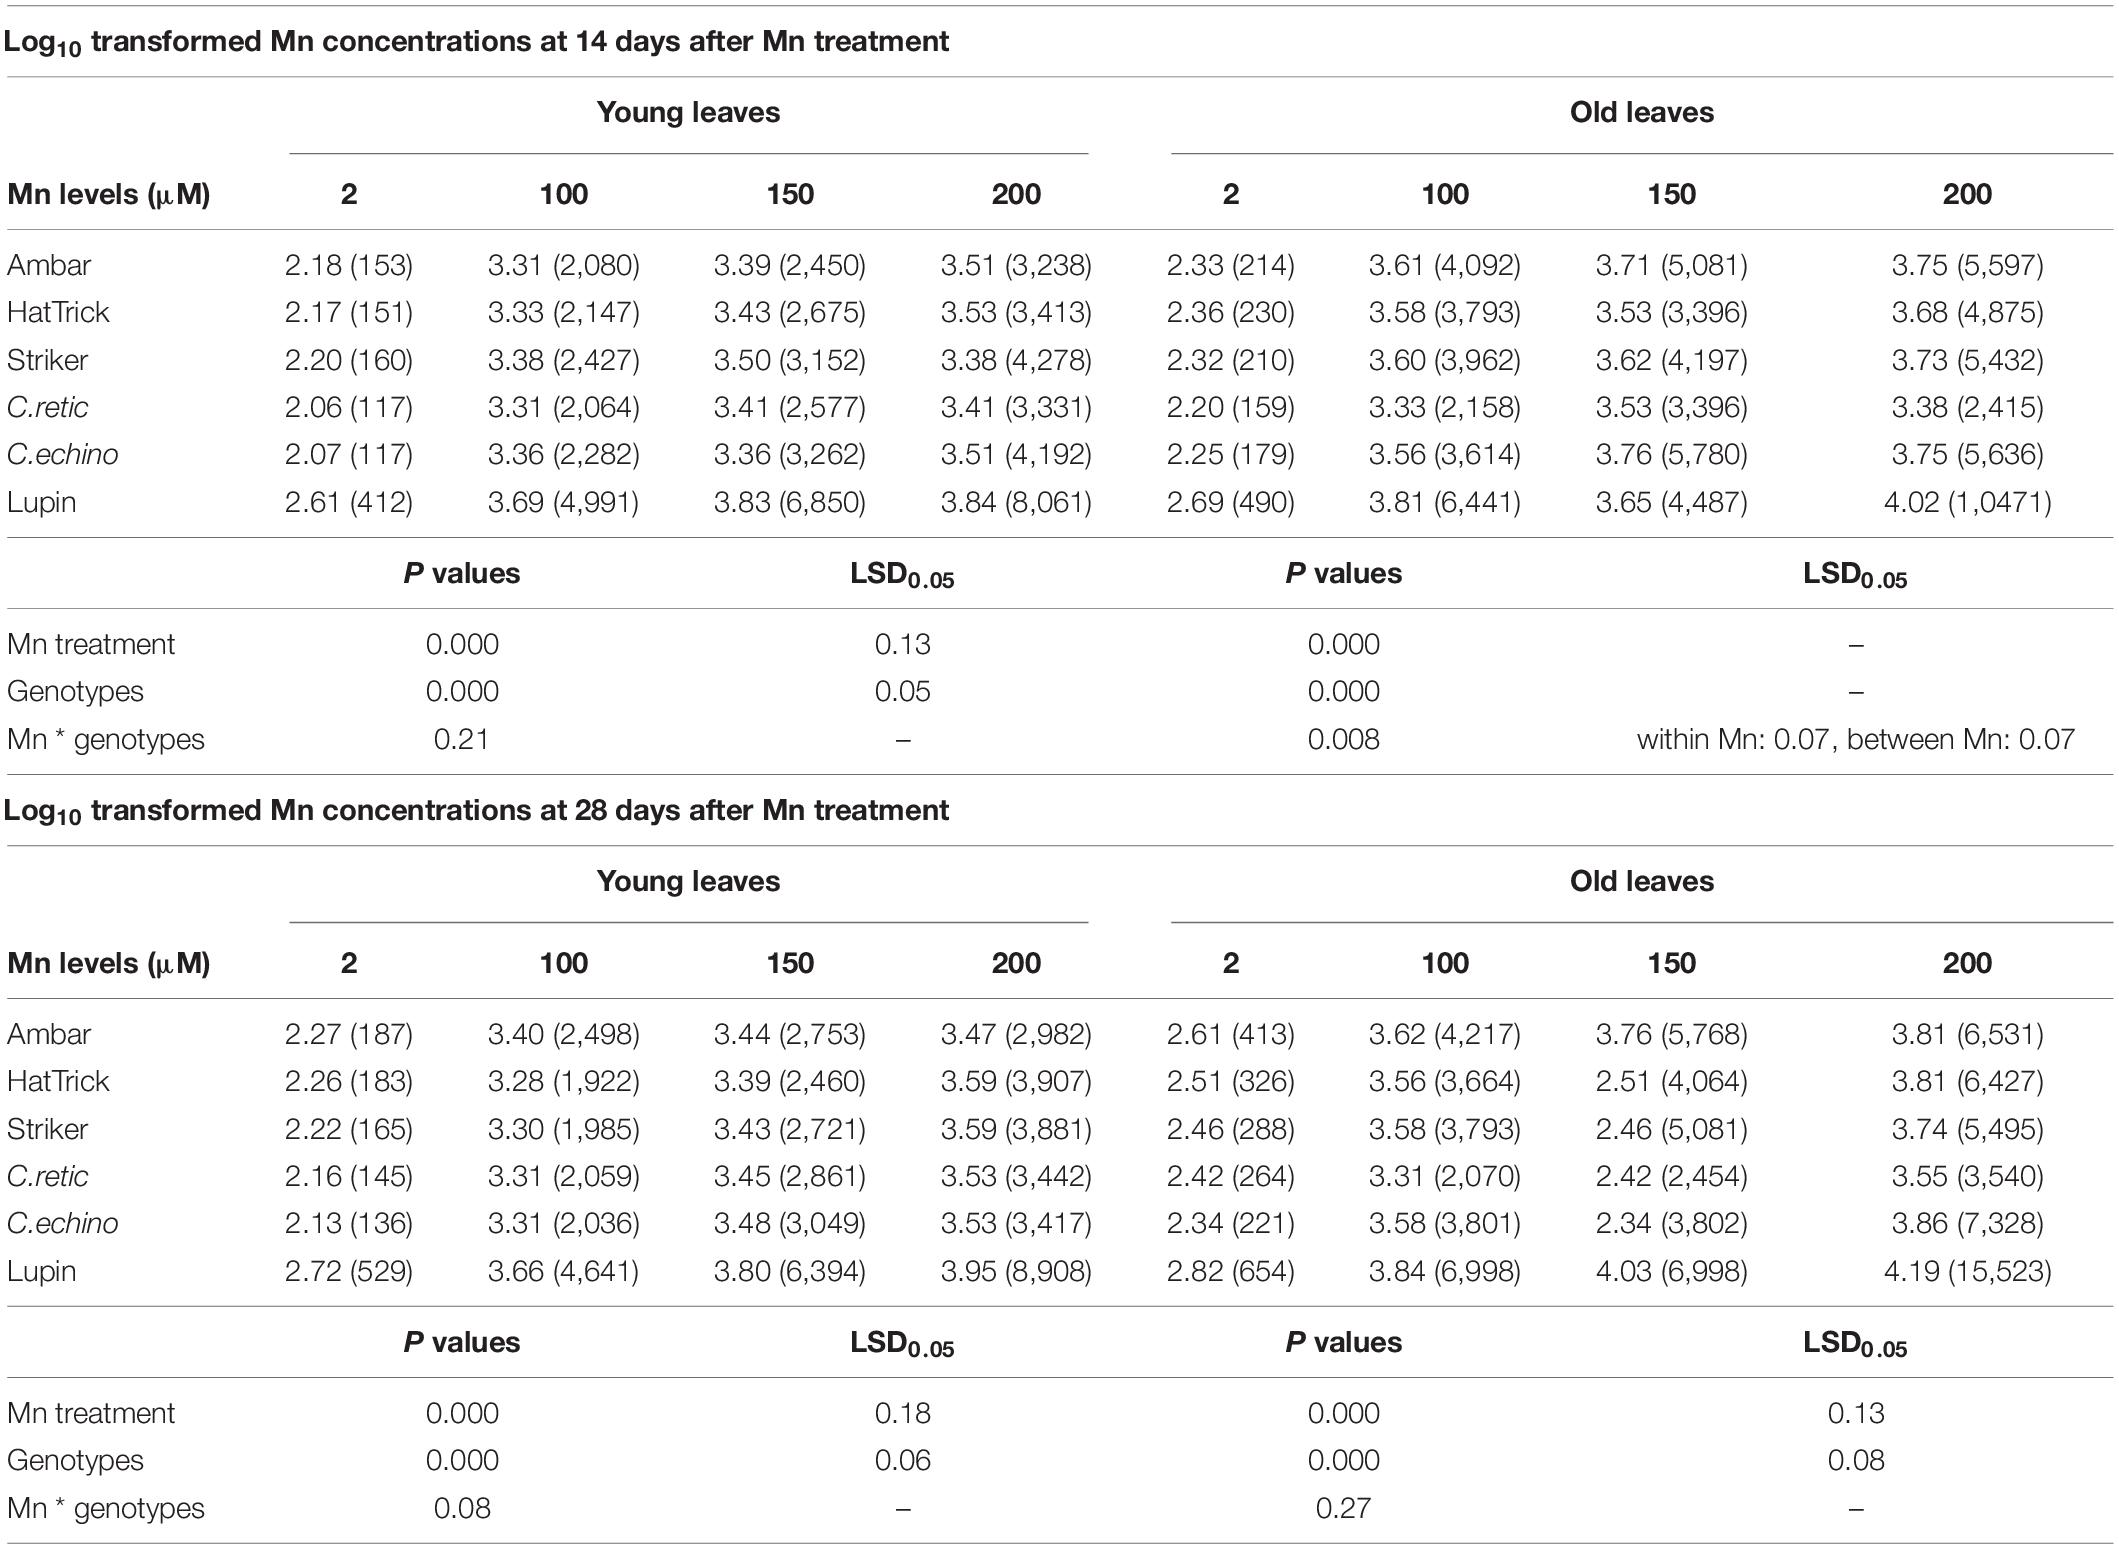
Table 2. Log-transformed Mn concentrations in young and old leaves of Cicer genotypes and lupin grown in 2, 100, 150, and 200 μM Mn at 14 and 28 days after Mn treatments [back-transformed means (mg/kg) presented in brackets].
The old leaves had higher Mn concentrations than had the young leaves, and Mn concentrations increased significantly with an increase in Mn treatment levels (P ≤ 0.05; Table 2). Among the Cicer genotypes, C.retic had significantly lower mean Mn concentration in the old leaves at both harvests compared with the others. The mean increase in Mn concentrations with treatments of 100–200 μM Mn when compared to the control was lower in PBA HatTrick and C.retic than in others. The old/young leaves ratios of Mn concentrations were lower in C.retic at both harvests (data not shown). Lupin had significantly higher mean Mn concentrations in leaf tissues compared with Cicer genotypes.
Manganese concentrations in roots increased with an increase in Mn treatment levels (P ≤ 0.05), and there was a significant cultivar effect. In contrast to Mn concentrations in shoot and leaf tissues, C.echino accession had a lower mean root Mn concentration than C.retic at both harvests, and PBA Striker had lower Mn concentrations in roots than Ambar (Table 3).
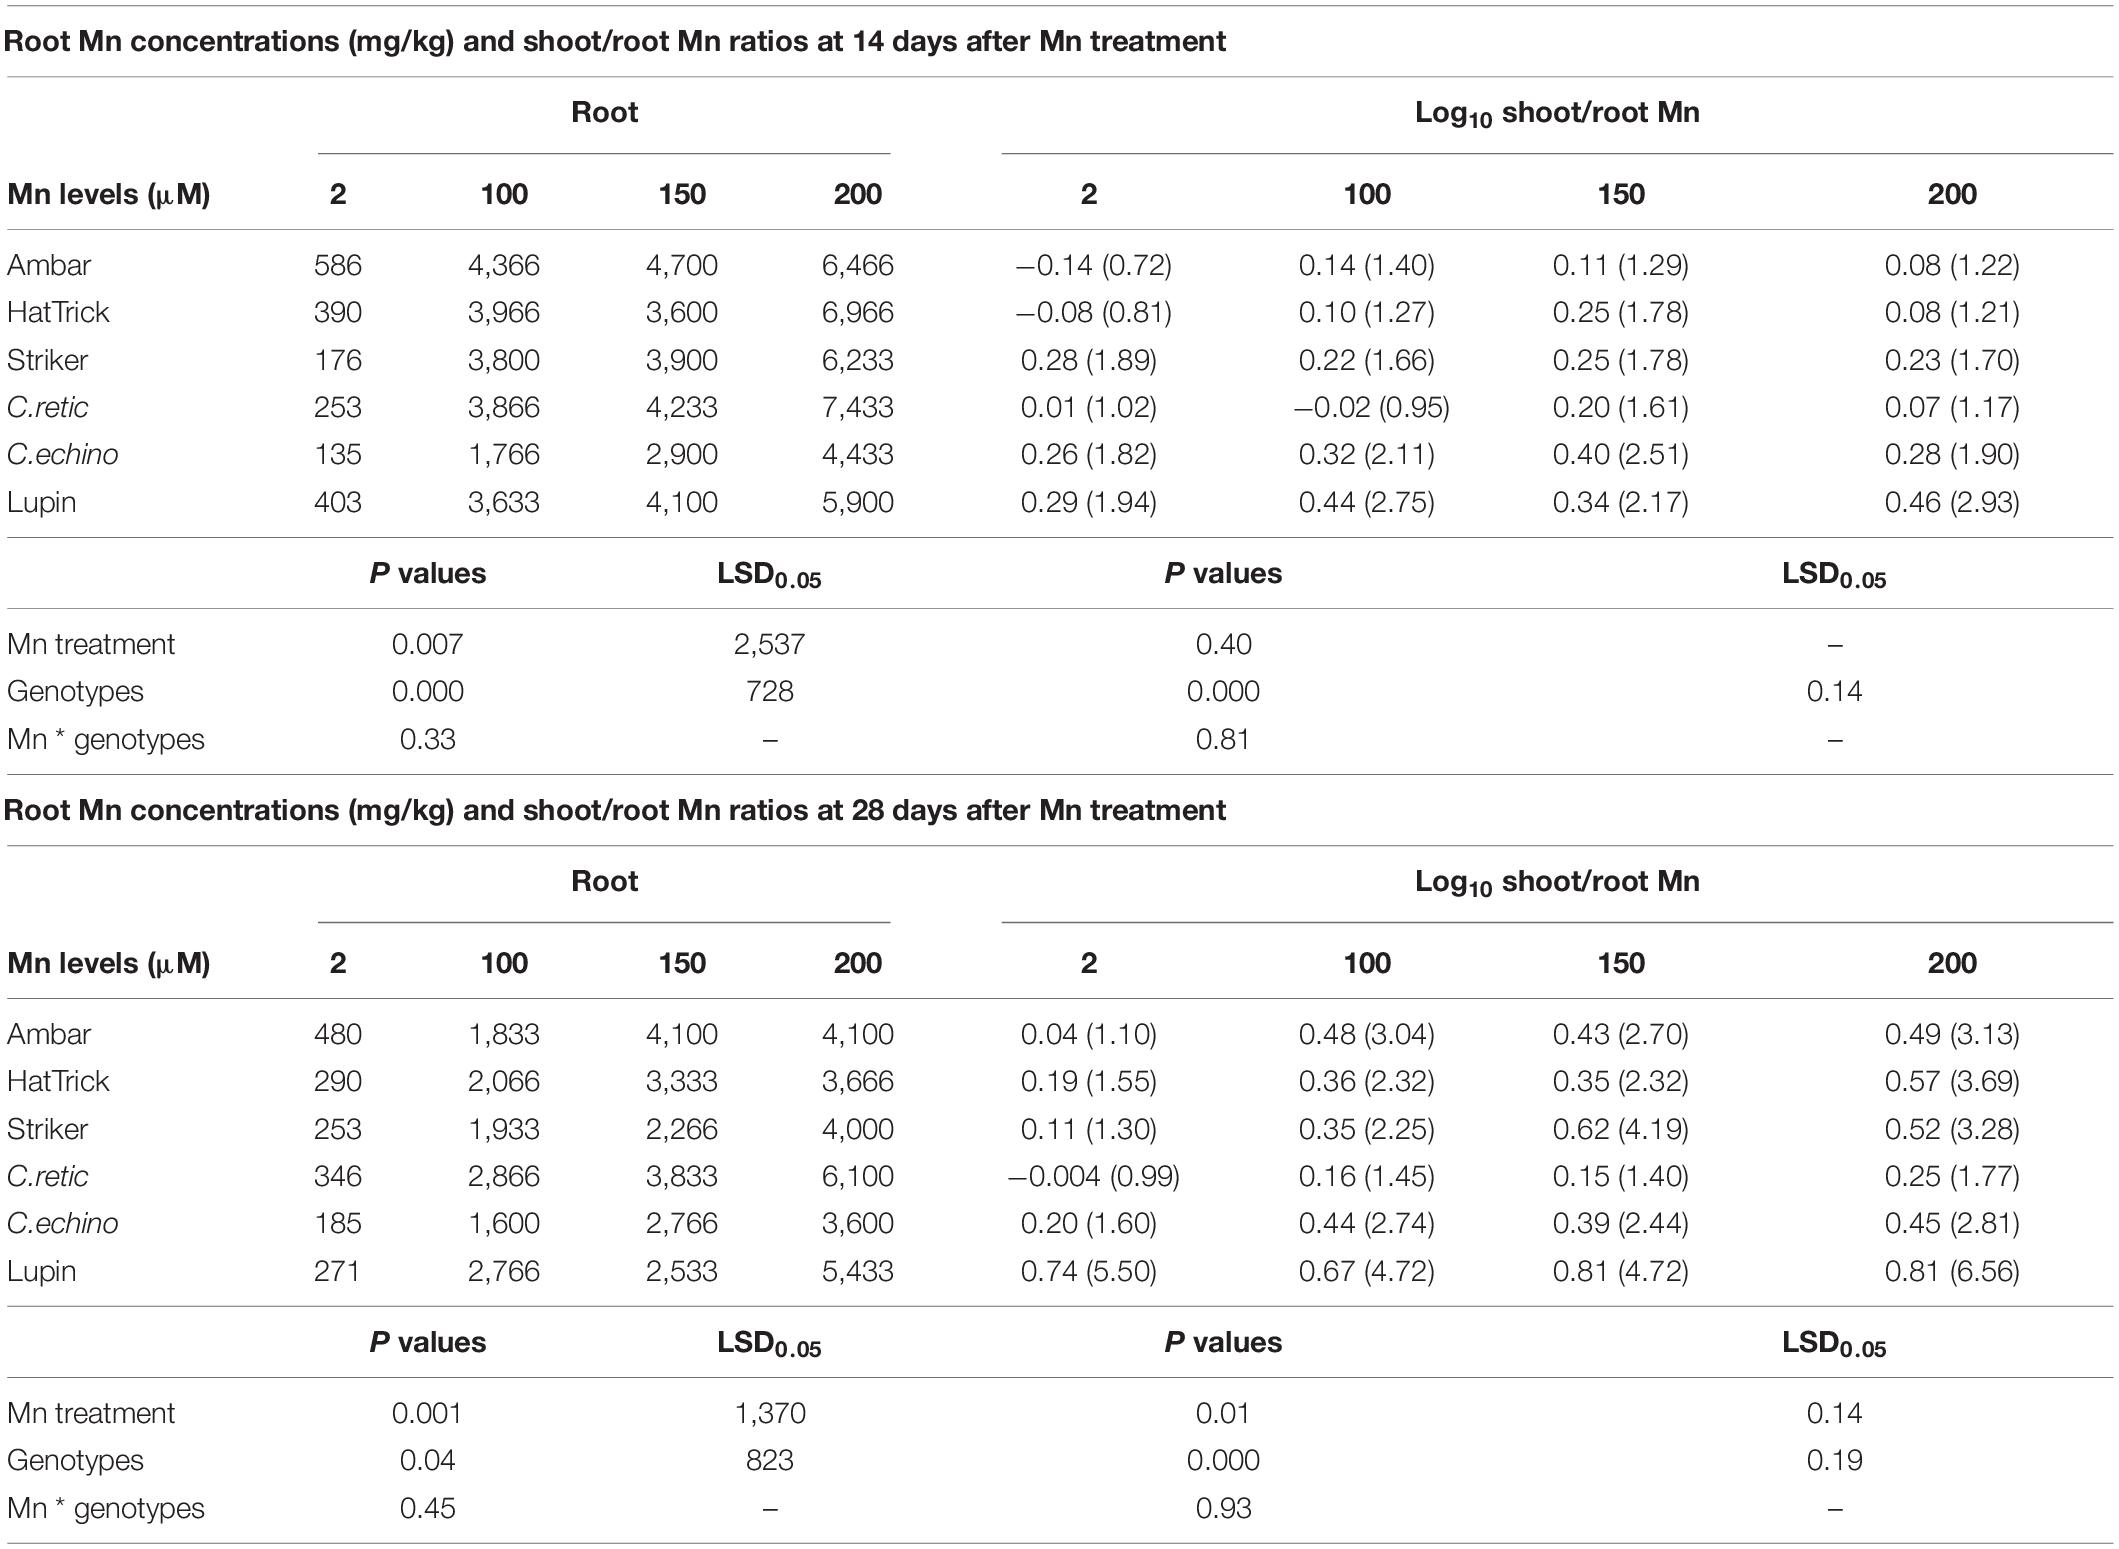
Table 3. Manganese concentrations in roots (mg/kg) and log-transformed shoot/root Mn ratios of Cicer genotypes and lupin grown in 2, 100, 150, and 200 μM Mn at 14 and 28 days after Mn treatments (back-transformed means for shoot/root ratios presented in brackets).
The mean shoot Mn content of C.retic was significantly lower than that of other genotypes; however, the root Mn uptake of C.retic was not different from others. At 100–200 μM, the relative increase in Mn uptake (both shoot and root) due to Mn treatments was higher in PBA Striker and C.echino than in others (Supplementary File, Table C). The mean shoot/root Mn ratios at 14 days after Mn treatments of genotypes PBA Striker and C.echino accession were higher than those of other Cicer genotypes. However, at 28 days, shoot/root Mn ratios of C.retic was lower than that of other genotypes (Table 3).
Ca Concentrations and Uptake
Calcium concentrations in young leaves at both harvests decreased with the increase in Mn solution concentrations (P ≤ 0.05); however, the interaction between treatment and cultivar was not significant (Table 4). Among the Cicer genotypes, C.echino accession and PBA HatTrick had high and low mean Ca concentrations in young leaves, respectively. The mean percentage reduction of Ca concentrations across the five Cicer genotypes measured in young leaves at the first harvest in Mn treatments 100, 150, and 200 μM Mn were 29, 38, and 40%, respectively, when compared to control. At the second harvest, the mean reduction in Ca concentrations was 8% more than that at the first harvest.
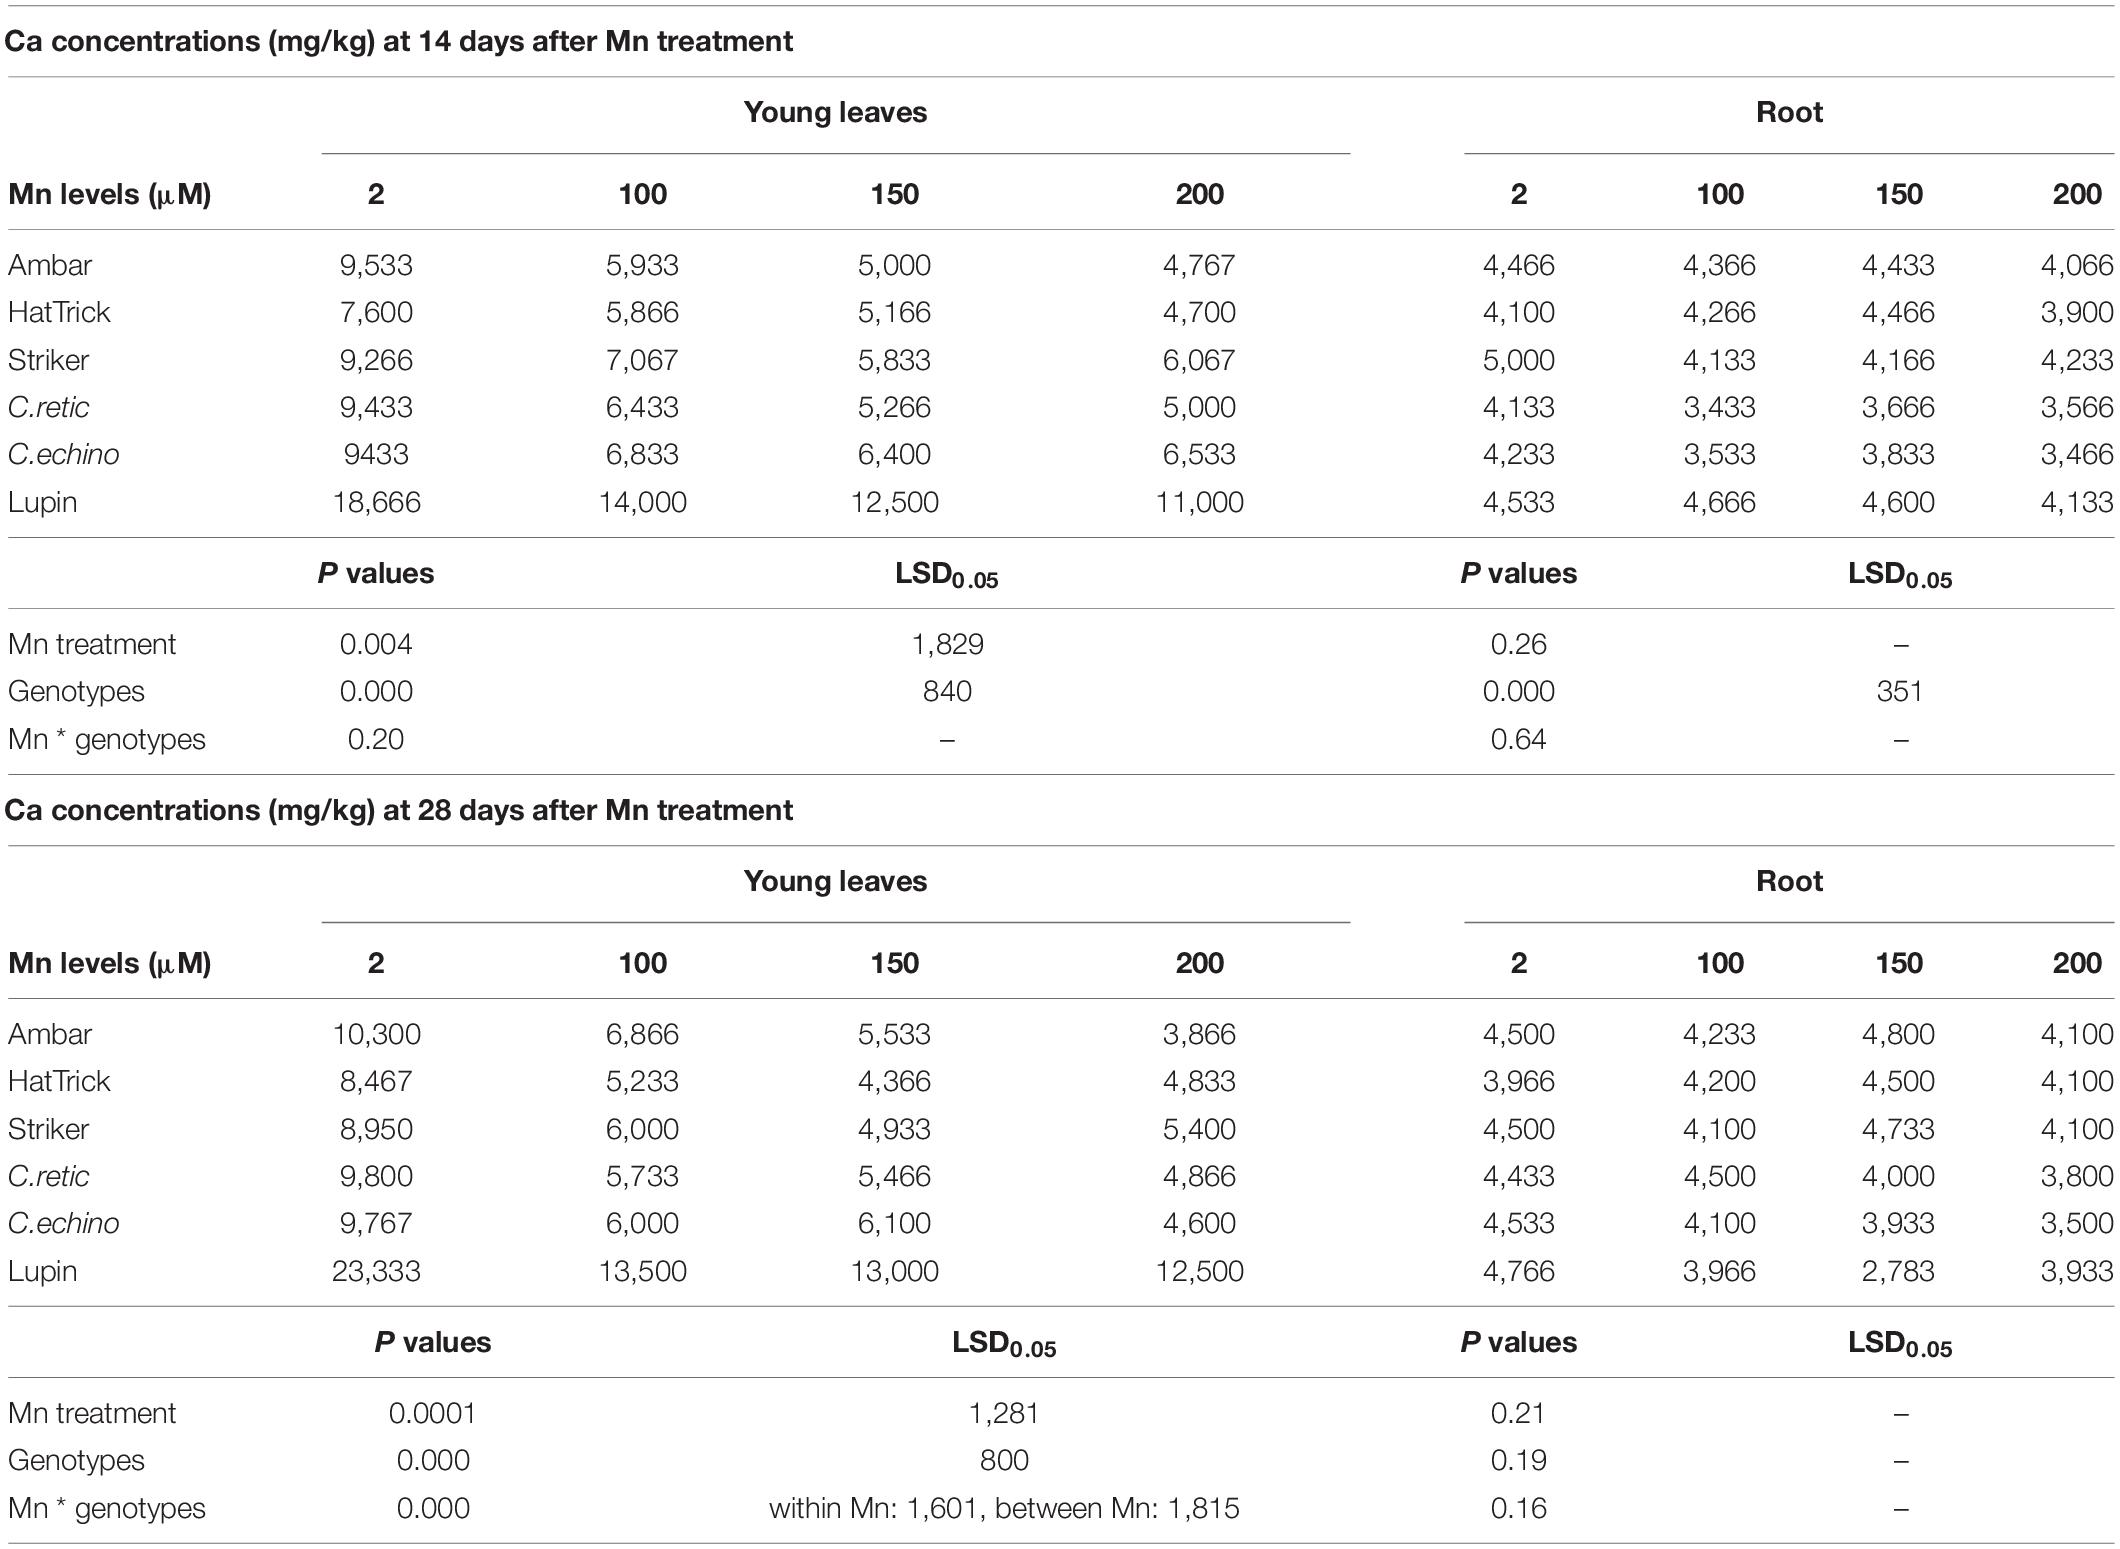
Table 4. Ca concentrations (mg/kg) in young leaves and roots of Cicer genotypes and lupin grown in solutions at 2, 100, 150, and 200 μM Mn for 14 and 28 days after Mn treatments.
The Ca concentration in root tissues of Cicer genotypes at both harvests was not affected by the increase in Mn concentrations in solutions (P ≥ 0.05) (Table 4). Among the genotypes, the mean Ca concentrations in roots of wild C.retic and C.echino accessions were lower than those in chickpea cultivars at the first harvest; the mean root Ca concentrations in C.retic and C.echino were 18 and 16% less than that in PBA Striker, respectively.
The shoot Ca uptake declined significantly with increasing Mn solution in Cicer genotypes (P ≤ 0.05); the wild C.retic accession showed a significant mean reduction of shoot Ca (63%), and its mean shoot Ca content was significantly lower than that of other Cicer genotypes. Chickpea cultivars PBA Striker and Ambar had high mean shoot Ca uptake compared with the PBA HatTrick (data presented as Supplementary File, Table C). Similarly, the root Ca uptake decreased with Mn treatments; however, the percentage decrease was smaller than that in shoots.
Mn/Ca ratios in shoot and root increased with an increase in Mn levels in treatment solutions, and wild C.retic accession had lower and higher mean Mn/Ca ratios in shoot and root, respectively, compared with other chickpeas. The results and data are presented in Appendix A as Supplementary Data (Table D).
Fe Concentrations and Uptake
Manganese treatments had a significant interaction with genotypes for Fe concentrations in young leaves at the first harvest (P ≤ 0.05) (Table 5). Manganese treatments had a significant effect on shoot Fe uptake (P ≤ 0.05) with 25–58% reduction at Mn levels of 100 to 200 μM at both harvests. The mean reduction in shoot Fe uptake of C.echino accession and PBA Striker was very less compared to that in other genotypes (Supplementary File, Table C). The mean Fe concentrations in young leaves of C.retic and C.echino accessions were 15 and 19% and 21 and 35% higher than Ambar at the first and second harvests, respectively. In lupin, Fe concentrations in young leaves were twice as high as those in Cicer genotypes. Root Fe concentrations at the second harvest showed a significant increase due to Mn (P ≤ 0.05) (Table 5). In contrast to young leaves’ Fe concentrations, the C.echino accession had significantly lower Fe in roots than had Ambar at both harvests.
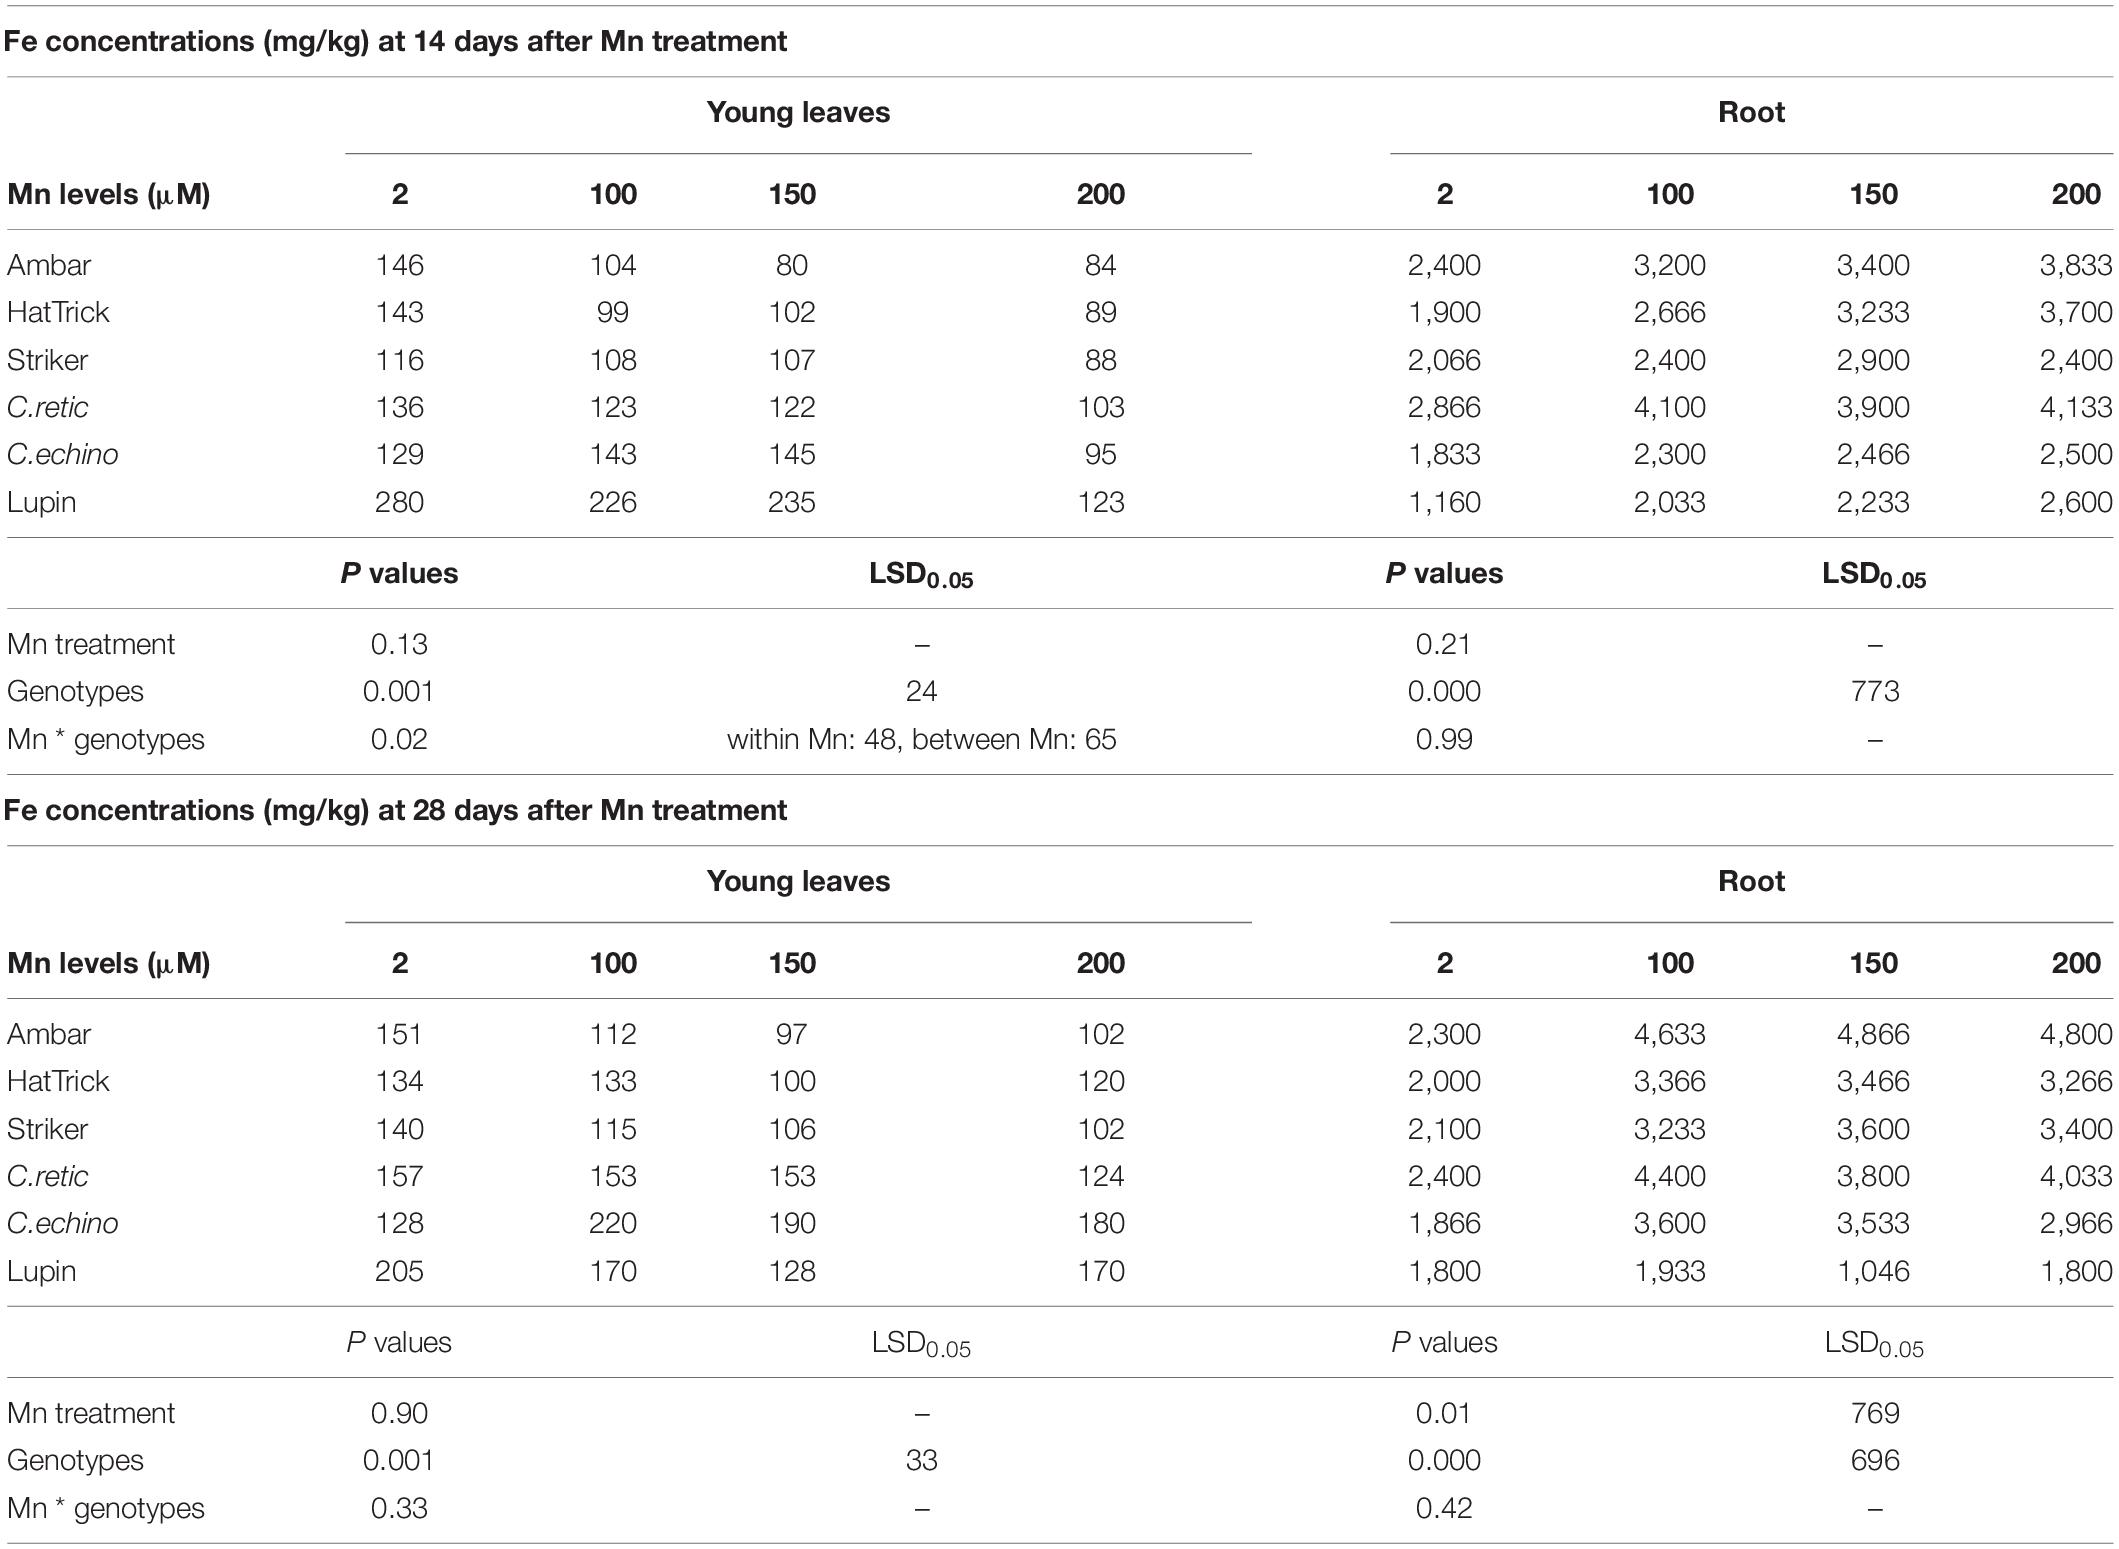
Table 5. Fe concentrations (mg/kg) in young leaves and roots of Cicer genotypes and lupin grown in solutions at 2, 100, 150, and 200 μM Mn for 14 and 28 days after Mn treatments.
There was a significant interaction between Mn treatments and cultivars (P ≤ 0.05) for shoot Mn/Fe ratio at both harvests: wild C.retic and C.echino accessions had lower Mn/Fe ratio in shoots compared to domestic cultivars (Supplementary Data).
Discussion
The screening of Cicer plants for Mn toxicity was not previously reported, and depending on the plant criterion used, concentrations of 50–100 μM Mn were toxic. The median toxic concentration of Mn required to reduce plant growth was 46 μM from studies of a range of species (Kopittke et al., 2010). Chickpeas were more sensitive to Mn toxicity than other species like sunflower (Blamey et al., 2015), triticale (Quartin et al., 1998), oats (Clark, 1983), narrow-leaved and white lupin (Blamey et al., 2015), and rice (Rout et al., 2001) where a Mn concentrations of 100 μM had no effect on plant growth. On the other hand, chickpeas had a similar level of tolerance to rapeseed genotypes (Brassica napus and Brassica rapa) (Moroni et al., 2003) and was more tolerant to Mn toxicity than barley (Williams and Vlamis, 1957) and cowpea and soybean (Blamey et al., 2017), which makes chickpeas suitable for cultivation in moderately acidic soils with soil solution Mn levels <100 μM. To differentiate among Cicer genotypes (both domestic cultivars and wild species) in tolerance to Mn toxicity, 100–200 μM Mn was identified in this study.
High-ionic-strength solutions will alter the outcomes of Mn toxicity studies as the high concentrations of nutrients will decrease Mn availability due to formation of complexes with Mn (Kopittke et al., 2010). The ionic concentration of the solution used in the present study was relatively low (ranging between 3,000 and 5,000 μM), compared to most of the Mn toxicity screening studies that commonly used Hoagland solution (26,000 μM). Actual Mn concentrations in solutions analyzed at day 1 and solution renewal (day 7) of the treatment additions were very close to required Mn treatments in the present study. Furthermore, the Geochem-EZ analysis of nutrient solution confirmed more than 90% availability of Mn in solutions with minimal loss of Mn2+ due to formation of complexes with metals and ligands. Similarly, using Geochem-EZ, we calculated that in Mn screening studies by Andrew and Hegarty (1969) and Rout et al. (2001), both with around 23,000 μM ionic concentration (for 182 and 142 μM Mn treatments, respectively), 86% of Mn2+ was available as a free metal for plant uptake, and in Quartin et al. (1998), with an ionic concentration of 7,000 μM (200 μM Mn), 90% of Mn2+ was available as a free metal for plant uptake. The ionic strength of the solution in this study reflects the soil solution concentration of a highly weathered Oxisol from Queensland, which is around 5,000 μM in soil extracts (Kopittke et al., 2010). The solution pH of 5.2 was maintained for the present study, which was appropriate for assessing Mn toxicity, but not as acidic as Al toxicity studies where usually a pH of <4.5 is used (Kopittke et al., 2011).
Additions of Ca, Fe, Al, Si, and NH4+ to the growth medium have been shown to ameliorate Mn toxicity in plants (Foy et al., 1988). For instance, silicon addition decreased Mn toxicity symptoms in soybean and cucumber (Cucumis sativus L.) and improved plant growth by preventing localized accumulation of Mn in leaves (Shi et al., 2005; Liu et al., 2019), and an increase in Fe supply in the solution ameliorated Mn toxicity in sunflower and soybean by decreasing Mn uptake and translocation (Blamey et al., 2019). The nutrient solution used in this study had no Si, and other nutrients were at low concentrations, making Mn in this solution more toxic than if Si was added. In studies by Rout et al. (2001) and Quartin et al. (1998), 86 and 92% of Ca2+ from 4,000 and 1,000 μM in solutions were available for plants according to Geochem-EZ, that is, 3,600 and 600 μM more Ca2+, respectively, compared with the present study.
Manganese toxicity in plants generally occurs as leaf chlorosis and crinkling symptoms; however, genetics, environmental conditions (such as light exposure and temperature), and Mn levels affect the type and extent of the symptoms (Fernando and Lynch, 2015), and the necrotic margins may be due to accumulation of excess Mn oxides and phenols in the cell wall (Horiguchi, 1987). Even though the wild C. echinospermum accession showed better tolerance to Mn toxicity than did C. reticulatum in terms of relative plant growth, they scored the same for Mn toxicity symptoms. The wild accessions were the first to show symptoms of Mn toxicity. Cultivars PBA Striker and Ambar had better relative plant growth compared with PBA HatTrick, and they scored lower for Mn toxicity symptoms. Scoring of visual symptoms could be helpful in diagnosis of Mn toxicity differences among domesticated chickpea cultivars. However, scoring alone was not a satisfactory parameter to rank wild accessions for Mn tolerance as the extent of the symptom severity was not closely related to plant growth response in wild accessions. Moreover, the toxicity symptoms increased with the duration of plant exposure to Mn treatments in all the genotypes, making it necessary to score on a fixed day after treatment to be a reliable parameter for ranking genotypes.
Chlorophyll fluorescence measurements have been used to assess the function of photosystem II of photosynthesis under Mn toxicity since the structural and functional integrity of chloroplasts is damaged by excess Mn (Hajiboland and Hasani, 2007). However, in the present study, Fv/Fm ratios measured at 21 days after Mn addition declined only at 150 μM Mn and did not discriminate among genotypes as well as visual scoring of intensity of symptoms or plant biomass measurements. Similarly, periodical measurements of Fv/Fm ratios did not predict the appearance of Mn toxicity symptoms in olive (Olea europaea) leaves (Chatzistathis et al., 2011), and Fv/Fm ratios with Mn treatments of 50 and 100 μM did not show any inhibition in rice and sunflower (Hajiboland and Hasani, 2007). In this study, the inhibition in plant growth measurements due to excess Mn was not reflected in the chlorophyll fluorescence response of Cicer, which suggests that growth and dry matter production in response to Mn toxicity are not determined by direct inhibition of photosynthesis but rather by other factors like oxidative damage and metabolic disturbances (Li et al., 2019), requiring further investigation in Cicer.
The present methodology of growing seedlings for several days before starting Mn screening was followed in similar works with soybean (Santos et al., 2017), ryegrass (Inostroza-Blancheteau et al., 2017), wheat (Khabaz-Saberi et al., 2010), and rice (Dziwornu et al., 2018). Also, the duration of the experiment that exposed plants to Mn2+ is critically important in developing a rapid screening protocol. Genotypic differences in relative plant growth were evident at 100–150 μM Mn, after 14 days of Mn treatments. Among all of the Mn treatments, 150 μM Mn showed the best discrimination into tolerant and intolerant genotypes with respect to relative shoot and root growth measured after 14 days of Mn treatments. At 14 days, the domestic genotypes Ambar, PBA Striker, and C. echinospermum were more tolerant than PBA HatTrick and C. reticulatum. The relative plant growth (shoot and root) after 14 days in 150 μM Mn solution for genotypes Ambar (79%), PBA Striker (75%) and C. echinospermum (71%) were significantly higher than that for PBA HatTrick (59%) and C. reticulatum (53%).
In all Cicer genotypes, relative root dry weight was more sensitive than relative shoot weight at Mn levels ≥150 μM at both harvests. Previous studies suggested that shoot injury due to excess Mn indirectly affects root growth, but more pronounced root growth reduction than shoot growth was reported for other plant species like wheat (Khabaz-Saberi et al., 2010). In contrast, in soybean 300 μM Mn did not affect root growth but reduced shoot dry matter significantly (Santos et al., 2017) and similarly in triticale (Quartin et al., 1998) and perennial ryegrass (Mora et al., 2009). However, rapeseed showed equal reduction in both shoot and root growth due to Mn stress (Moroni et al., 2003). Even though in the present study, root growth was more severely affected than shoot growth in Cicer species, shoot dry weight data were more accurate and easier to sample than those for roots. Furthermore, if soils are used for Mn toxicity rankings among genotypes, shoot dry weight can be more easily used than root dry weight.
Generally, in Cicer, Mn2+ ions were more concentrated in roots than in shoots, similar to clover (Trifolium repens L.) (Rosas et al., 2007) and ryegrass (Lolium perenne L.) (Mora et al., 2009). By contrast, in rice, leaves had higher Mn concentration than roots (Lidon, 2001; Millaleo et al., 2010). In this study, tolerant genotypes PBA Striker and C. echinospermum accession had high shoot/root Mn concentrations, indicating the increase in translocation of Mn from roots to shoots to a greater extent than that in sensitive C. reticulatum, while the shoot/root Mn accumulation or uptake per plant was significantly higher in tolerant genotypes PBA Striker and C. echinospermum than in other Cicer genotypes at first harvest. The Mn2+ taken up by roots is translocated to various shoot tissues; therefore, identification of long-distance transport regulation in Cicer could greatly improve the understanding of Mn tolerance mechanisms.
Manganese toxicity in plants can prevent uptake and translocation of other essential elements like Ca, Mg, Fe, and P (Blamey et al., 2015; Alejandro et al., 2020). In this experiment, Mn toxicity depressed Ca2+ concentrations in shoots of Cicer sp., suggesting competition between these two cations for specific absorption and translocation. Indeed, most of the Mn2+ transporters are non-specific and are able to transport other divalent cations like Ca2+, Zn2+, and Fe2+ (Alejandro et al., 2020). A similar decrease in Ca concentrations due to Mn toxicity was seen in barley plants (Alam et al., 2001). Even though there was a decrease in Ca2+ concentrations due to excess Mn in the solutions, the Ca concentrations in Cicer were adequate (Reuter and Robinson, 1997).
Excess Mn can sometimes produce symptoms that resemble Fe deficiency. Moreover, the addition of Fe alleviated Mn toxicity in beans and sunflower (Foy et al., 1988; Blamey et al., 2019). Among soybean cultivars, there were contrasting response of plant Fe to excess Mn due to genotypic differences within soybean which influence the expression of Mn toxicity symptoms (Izaguirre-Mayoral and Sinclair, 2005). In the present experiment, wild C. reticulatum and C. echinospermum accessions concentrated more Fe in shoots even under Mn toxicity, even though they showed more intense Mn toxicity symptoms compared with the Cicer cultivars.
Mean Mn concentrations of Cicer genotypes in control solution were between 120 and 300 mg/kg depending on plant tissue analyzed, and in 200 μM Mn solution, Mn concentrations were 3,500, 5,000, and 6,300 mg/kg in young leaves, old leaves, and roots, respectively. Lupin had Mn concentrations of around 6,000 to 7,000 mg/kg in young shoots and roots; however, old leaves had >10,000 mg/kg at 200 μM Mn. At a similar solution concentration of 200 μM Mn, canola (B. napus L.) contained an Mn concentration of 3,500 mg/kg (Moroni et al., 2003), similar to that of chickpeas, while soybean contained only 886 mg/kg in shoots (Lavres Junior et al., 2010). By comparison, clover contained up to 2,050 mg/kg in shoots and 7,481 mg/kg Mn in roots when grown at 355 μM Mn (Rosas et al., 2007).
In the present study, better Mn toxicity tolerance in cv. PBA Striker was associated with greater uptake and transport of Mn from roots to shoots than were sensitive C. reticulatum accession and cv. PBA HatTrick. Also, PBA Striker had higher shoot Ca and Mn concentrations and uptake compared with C. reticulatum, although it had reduced Fe concentrations in young leaves compared to sensitive wild C. reticulatum accession. Among the wild accessions, C. echinospermum, which showed better Mn toxicity tolerance, had higher shoot Mn concentrations compared with the C. reticulatum accession. Therefore, in Cicer genotypes, tolerant genotypes accumulated more Mn in shoots, suggesting that internal sequestration in shoots and tolerance to excess Mn are the main mechanisms of tolerance. Manganese is known to complex with organic compounds in less active plant cells or organelles like vacuoles, endoplasmic reticulum (Lidon et al., 2004; Millaleo et al., 2010; Li et al., 2019), and cell walls or is complexed by organic acids in different leaf tissues (Alejandro et al., 2020). In this respect, Cicer is similar to Mn-tolerant wheat (Khabaz-Saberi et al., 2010), rapeseed (Moroni et al., 2003), and maize genotypes (Stoyanova et al., 2009).
In spite of chickpea being a significant pulse crop and acidity being a major limitation for expanding its production areas, there is limited research on Mn toxicity in chickpea. The protocol developed here can be used to screen a wide range of released cultivars of chickpea and wild Cicer germplasm accessions to identify Mn-tolerant genotypes. Confirmation of Mn toxicity tolerance in soils is needed, but screening in soils in the field has proved unreliable due to the range of soil factors that alter soil Mn2+ concentrations, the level of mycorrhizal association in roots, and root rhizosphere effects (Nogueira and Cardoso, 2003; Moroni et al., 2009). The mycorrhizal association may alleviate Mn toxicity if the association is effective (Nogueira and Cardoso, 2003; Nogueira et al., 2004). Further research on linking phenotypic Mn toxicity tolerance responses with genomic responses may produce molecular markers for screening programs for Mn toxicity tolerance in Cicer. As Cicer was found to accumulate and tolerate high Mn under stress, identifying the key transporter genes responsible would increase our understanding of how they acquire, transport, and tolerate excess Mn.
Conclusion
Among the current prominent chickpea cultivars in Australia, PBA Striker was more tolerant than PBA HatTrick, suggesting that there is genotypic variation in Mn toxicity tolerance among chickpea cultivars currently grown in Australia. Moreover, neither of the accessions screened from C. reticulatum and C. echinospermum showed greater Mn toxicity tolerance than domestic cultivar PBA Striker. The limitations in both shoot and root dry matter in Mn-sensitive genotypes can be used as a selection criterion to screen genotypes for Mn toxicity, and the best discrimination into tolerant and intolerant Cicer genotypes was achieved at 100–200 μM Mn grown in Mn treatments for 14 days. Therefore, 150 μM Mn and 14 days of growth in low-ionic-strength nutrient solution at pH 5.2 are proposed for future large-scale screening of Cicer germplasm. The scoring of symptoms at 7 and 14 days was useful in domestic cultivars; however, in wild accessions, scoring did not distinguish among genotypes as well as differences in their dry weights. Chlorophyll fluorescence measurements were not a useful selection criterion for Mn toxicity differentiation among genotypes in this experiment. Manganese toxicity effects were not related to induced Ca or Fe deficiency even though increasing Mn had a detrimental effect on Ca concentrations and uptake. Manganese tolerance in Cicer genotypes was associated with greater uptake of Mn and translocation of Mn from roots to shoots, suggesting that their internal tolerance to excess Mn was the main mechanism of Mn toxicity tolerance.
Data Availability Statement
The original contributions presented in the study are included in the article/Supplementary Material, further inquiries can be directed to the corresponding author/s.
Author Contributions
KP designed and conducted this study under the supervision of RB and WV. KP wrote the original manuscript with revisions provided by RB and WV. All authors discussed the results and reviewed the manuscript.
Funding
This research was funded by the Grains Research and Development Corporation (GRDC-UMU00044) and the Australian Centre for International Agricultural Research (SMCN/2012/075).
Conflict of Interest
The authors declare that the research was conducted in the absence of any commercial or financial relationships that could be construed as a potential conflict of interest.
Acknowledgments
We gratefully acknowledge Dr. Jens D. Berger, CSIRO, for his involvement in the collection of wild Cicer accessions from Turkey; the Australian Grains Gene Bank for the provision of wild Cicer seed material for this study; and the Department of Primary Industries and Regional Development, Western Australia, and NSW Department of Primary Industries for providing the domestic cultivar seeds (C. arietinum L.). We thank the reviewers for their valuable comments on the manuscript.
Supplementary Material
The Supplementary Material for this article can be found online at: https://www.frontiersin.org/articles/10.3389/fpls.2020.588065/full#supplementary-material
Footnotes
- ^ Australian Grain Genebank (AGG) accession number 49936 is a C. reticulatum from Turkey; collection site Egil with AGG account name Egil_063, from Diyarbakir Province and Egil District; latitude: 38.2745, longitude: 40.06454; elevation: 987.68 m asl.
- ^ AGG accession number 50166 is a C. echinospermum from Turkey; collection site Kara with AGG account name Karab_162, from Urfa Province and Siverek District; latitude: 37.82429, longitude: 39.76289; elevation: 1,266.71 m asl.
References
Alam, S., Kamei, S., and Kawai, S. (2001). Amelioration of manganese toxicity in barley with iron. J. Plant Nutr. 24, 1421–1433. doi: 10.1081/pln-100106992
Alejandro, S., Höller, S., Meier, B., and Peiter, E. (2020). Manganese in plants: from acquisition to subcellular allocation. Front. Plant Sci. 11:300. doi: 10.3389/fpls.2020.00300
Andrew, C. S., and Hegarty, M. P. (1969). Comparative response to manganese excess of eight tropical and four temperate pasture legume species. Aust. J. Agric. Res. 20, 687–696. doi: 10.1071/ar9690687
Berger, J., Abbo, S., and Turner, N. C. (2003). Ecogeography of annual wild Cicer species: the poor state of the world collection. Crop Sci. 43, 1076–1090. doi: 10.2135/cropsci2003.1076
Blamey, F. P. C., Hernandez-Soriano, M. C., Cheng, M., Tang, C., Paterson, D. J., Lombi, E., et al. (2015). Synchrotron-based techniques shed light on mechanisms of plant sensitivity and tolerance to high manganese in the root environment. Plant Physiol. 169, 2006–2020.
Blamey, F. P. C., Li, C., Howard, D. L., Cheng, M., Tang, C., Scheckel, K. G., et al. (2019). Evaluating effects of iron on manganese toxicity in soybean and sunflower using synchrotron-based X-ray fluorescence microscopy and X-ray absorption spectroscopy. Metallomics 11, 2097–2110. doi: 10.1039/c9mt00219g
Blamey, F. P. C., McKenna, B. A., Li, C., Cheng, M., Tang, C., Jiang, H., et al. (2017). Manganese distribution and speciation help to explain the effects of silicate and phosphate on manganese toxicity in four crop species. New Phytol. 217, 1146–1160. doi: 10.1111/nph.14878
Chatzistathis, T., Papadakis, I., Therios, I., Giannakoula, A., and Dimassi, K. (2011). Is chlorophyll fluorescence technique a useful tool to assess manganese deficiency and toxicity stress in olive plants? J. Plant Nutr. 34, 98–114. doi: 10.1080/01904167.2011.531362
Clark, R. V. (1983). Leaf blotch in oats in relation to level of manganese nutrition and uptake. Can. J. Plant Pathol. 5, 89–96. doi: 10.1080/07060668309501633
Demirevska-Kepova, K., Simova-Stoilova, L., Stoyanova, Z., Hölzer, R., and Feller, U. (2004). Biochemical changes in barley plants after excessive supply of copper and manganese. Environ. Exp. Bot. 52, 253–266. doi: 10.1016/j.envexpbot.2004.02.004
Dziwornu, A. K., Shrestha, A., Matthus, E., Ali, B., Wu, L.-B., and Frei, M. (2018). Responses of contrasting rice genotypes to excess manganese and their implications for lignin synthesis. Plant Physiol. Biochem. 123, 252–259. doi: 10.1016/j.plaphy.2017.12.018
Edwards, D. G., and Asher, C. J. (1982). “Tolerance of crop and pasture species to manganese toxicity,” in Plant Nutrition 1982: Proceedings of the Ninth International Plant Nutrition Colloquium, ed. A. Scaife, (Slough: Commonwealth Agricultural Bureaux), 145–150.
El-Jaoual, T., and Cox, D. A. (1998). Manganese toxicity in plants. J. Plant Nutr. 21, 353–386. doi: 10.1080/01904169809365409
Fernando, D. R., and Lynch, J. P. (2015). Manganese phytotoxicity: new light on an old problem. Ann. Bot. 116, 313–319. doi: 10.1093/aob/mcv111
Foy, C. D., Scott, B. J., and Fisher, J. A. (1988). “Genetic differences in plant tolerance to manganese toxicity,” in Manganese in Soils and Plants, eds R. D. Graham, R. J. Hannam, and N. C. Uren, (Dordrecht: Kluwer Academic Publishers), 293–307. doi: 10.1007/978-94-009-2817-6_20
Foy, C. D., Weil, R. R., and Coradetti, C. A. (1995). Differential manganese tolerances of cotton genotypes in nutrient solution. J. Plant Nutr. 18, 685–706. doi: 10.1080/01904169509364931
GRDC, (2016). GRDC GROWNOTES Chickpeas- NORTHERN; Know More. Grow More. Barton: Grains Research & Development Corporation.
Hajiboland, R., and Hasani, B. D. (2007). Responses of antioxidant defense capacity and photosynthesis of bean (Phaseolus vulgaris L.) plants to copper and manganese toxicity under different light intensities. Acta Biol. Szegedien. 51, 93–106.
Hannam, R. H., and Ohki, K. (1988). “Detection of manganese deficiency and toxicity in plants,” in Manganese in Soils and Plants, eds R. D. Graham, R. J. Hannam, and N. C. Uren, (Dordrecht: Kluwer Academic Publishers).
Harries, M., Regan, K., and White, P. F. (2005). “Growing chickpea,” in Producing pulses in the Northern Agricultural Region Bulletin 4656, eds P. White, M. Harries, M. Seymour, and P. Burgess, (Perth: Department of Agriculture, Western Australia), 19–28.
Hayes, R. C., Conyers, M. K., Li, G. D., Poile, G. J., Price, A., McVittie, B. J., et al. (2012). Spatial and temporal variation in soil Mn2+ concentrations and the impact of manganese toxicity on lucerne and subterranean clover seedlings. Crop Pasture Sci. 63, 875–885. doi: 10.1071/cp12138
Horiguchi, T. (1987). Mechanism of manganese toxicity and tolerance of plants. Soil Sci. Plant Nutr. 33, 595–606. doi: 10.1080/00380768.1987.10557608
Inostroza-Blancheteau, C., Reyes-Díaz, M., Berríos, G., Rodrigues-Salvador, A., Nunes-Nesi, A., Deppe, M., et al. (2017). Physiological and biochemical responses to manganese toxicity in ryegrass (Lolium perenne L.) genotypes. Plant Physiol. Biochem. 113, 89–97. doi: 10.1016/j.plaphy.2017.02.003
Izaguirre-Mayoral, M. L., and Sinclair, T. R. (2005). Soybean genotypic difference in growth, nutrient accumulation and ultrastructure in response to manganese and iron supply in solution culture. Ann. Bot. 96, 149–158. doi: 10.1093/aob/mci160
Khabaz-Saberi, H., Rengel, Z., Wilson, R., and Setter, T. L. (2010). Variation of tolerance to manganese toxicity in Australian hexaploid wheat. J. Plant Nutr. Soil Sci. 173, 103–112. doi: 10.1002/jpln.200900063
Kopittke, P. M., Blamey, F. P. C., Asher, C. J., and Menzies, N. W. (2010). Trace metal phytotoxicity in solution culture: a review. J. Exp. Bot. 61, 945–954. doi: 10.1093/jxb/erp385
Kopittke, P. M., Blamey, F. P. C., Wang, P., and Menzies, N. (2011). Calculated activity of Mn2+ at the outer surface of the root cell plasma membrane governs Mn nutrition of cowpea seedlings. J. Exp. Bot. 62, 3993–4001. doi: 10.1093/jxb/err097
Lavres Junior, J., Reis, A. R., Rossi, M. L., Cabral, C. P., Nogueira, N. D. L., and Malavolta, E. (2010). Changes in the ultrastructure of soybean cultivars in response to manganese supply in solution culture. Sci. Agric. 67, 287–294. doi: 10.1590/s0103-90162010000300006
Li, J., Jia, Y., Dong, R., Huang, R., Liu, P., Li, X., et al. (2019). Advances in the mechanisms of plant tolerance to manganese toxicity. Int. J. Mol. Sci. 20:5096. doi: 10.3390/ijms20205096
Lidon, F. (2001). Tolerance of rice to excess manganese in the early stages of vegetative growth. Characterisation of manganese accumulation. J. Plant Physiol. 158, 1341–1348. doi: 10.1078/0176-1617-00507
Lidon, F. C., Barreiro, M. G., and Ramalho, J. C. (2004). Manganese accumulation in rice: implications for photosynthetic functioning. J. Plant Physiol. 161, 1235–1244. doi: 10.1016/j.jplph.2004.02.003
Liu, Y., Li, Z., and Xu, R. (2019). Distribution of manganese(II) chemical forms on soybean roots and manganese(II) toxicity. Pedosphere 29, 656–664. doi: 10.1016/s1002-0160(17)60413-2
Maesen, L. J. G. V. D., Maxted, N., Javadi, F., Coles, S., and Davies, A. M. R. (2007). “Taxonomy of the genus Cicer revisited,” in Chickpea Breeding and Management, eds S. S. Yadav, R. J. Redden, W. Chen, and B. Sharma, (Trowbridge: Cromwell Press).
Merga, B., and Haji, J. (2019). Economic importance of chickpea: production, value, and world trade. Cogent Food Agric. 5:1615718.
Millaleo, R., Reyes-Díaz, M., Ivanov, A. G., Mora, M. L., and Alberdi, M. (2010). Manganese as essential and toxic element for plants: transport, accumulation and resistance mechanisms. J. Soil Sci. Plant Nutr. 10, 476–494.
Mora, M. L., Rosas, A., Ribera, A., and Rengel, Z. (2009). Differential tolerance to Mn toxicity in perennial ryegrass genotypes: involvement of antioxidative enzymes and root exudation of carboxylates. Plant Soil 320, 79–89. doi: 10.1007/s11104-008-9872-1
Moroni, J. S., Conyers, M., Poile, G., and Wratten, N. (2009). “Quantifying the impact of high manganese (Mn) on canola under field conditions,” in Proceedings of the 16th Australian Research Assembly on Brassicas, Ballarat.
Moroni, J. S., Scott, B. J., and Wratten, N. (2003). Differential tolerance of high manganese among rapeseed genotypes. Plant Soil 253, 507–519.
Nogueira, M. A., and Cardoso, E. J. B. N. (2003). Mycorrhizal effectiveness and manganese toxicity in soybean as affected by soil type and endophyte. Sci. Agric. 60, 329–335. doi: 10.1590/s0103-90162003000200018
Nogueira, M. A., Magalhães, G. C., and Cardoso, E. J. B. N. (2004). Manganese toxicity in mycorrhizal and phosphorus-fertilized soybean plants. J. Plant Nutr. 27, 141–156. doi: 10.1081/pln-120027552
Quartin, V., Ramalho, J. C., and Nunes, M. A. (1998). Responses of biomass and several photosynthetic indicators to manganese excess in triticale. J. Plant Nutr. 21, 1615–1629. doi: 10.1080/01904169809365508
Reuter, D., and Robinson, J. (1997). Plant Analysis: An Interpretation Manual. (Clayton: Csiro Publishing), 585.
Rosas, A., Rengel, Z., and de la Luz Mora, M. (2007). Manganese supply and pH influence growth, carboxylate exudation and peroxidase activity of ryegrass and white clover. J. Plant Nutr. 30, 253–270. doi: 10.1080/01904160601118034
Rout, G. R., Samantaray, S., and Das, P. (2001). Studies on differential manganese tolerance of mung bean and rice genotypes in hydroponic culture. Agronomie 21, 725–733. doi: 10.1051/agro:2001166
Santos, E. F., Santini, J. M. K., Paixao, A. P., Junior, E. F., Lavres, J., Campos, M., et al. (2017). Physiological highlights of manganese toxicity symptoms in soybean plants: Mn toxicity responses. Plant Physiol. Biochem. 113, 6–19. doi: 10.1016/j.plaphy.2017.01.022
Shaff, J. E., Schultz, B. A., Craft, E. J., Clark, R. T., and Kochian, L. V. (2010). GEOCHEM-EZ: a chemical speciation program with greater power and flexibility. Plant Soil 330, 207–214. doi: 10.1007/s11104-009-0193-9
Shi, Q., Bao, Z., Zhu, Z., He, Y., Qian, Q., and Yu, J. (2005). Silicon-mediated alleviation of Mn toxicity in Cucumis sativus in relation to activities of superoxide dismutase and ascorbate peroxidase. Phytochemistry 66, 1551–1559. doi: 10.1016/j.phytochem.2005.05.006
Shrestha, A., Dziwornu, A., Ueda, Y., Wu, L., Mathew, B., and Frei, M. (2018). Genome-wide association study to identify candidate loci and genes for Mn toxicity tolerance in rice. PLoS One 13:e0192116. doi: 10.1371/journal.pone.0192116
Singh, K. B., Malhotra, R. S., Halila, M. H., Knights, E. J., and Verma, M. M. (1993). Current status and future strategy in breeding chickpea for resistance to biotic and abiotic stresses. Euphytica 73, 137–149. doi: 10.1007/bf00027190
Singh, K. B., and Ocampo, B. (1997). Exploitation of wild Cicer species for yield improvement in chickpea. Theory Appl. Genet. 95, 418–423. doi: 10.1007/s001220050578
Stoyanova, Z., Poschenrieder, C., Tzvetkova, N., and Doncheva, S. (2009). Characterization of the tolerance to excess manganese in four maize varieties. Soil Sci. Plant Nutr. 55, 747–753. doi: 10.1111/j.1747-0765.2009.00416.x
Tsunemitsu, Y., Genga, M., Okada, T., Yamaji, N., Ma, J. F., Miyazaki, A., et al. (2018). A member of cation diffusion facilitator family, MTP11, is required for manganese tolerance and high fertility in rice. Planta 248, 231–241. doi: 10.1007/s00425-018-2890-1
von Wettberg, E. J. B., Chang, P. L., Başdemir, F., Carrasquila-Garcia, N., Korbu, L. B., Moenga, S. M., et al. (2018). Ecology and genomics of an important crop wild relative as a prelude to agricultural innovation. Nat. Commun. 9:649.
Keywords: chickpea (Cicer arietinum L.), genotypic variation, manganese toxicity scoring, manganese tolerance, solution culture, wild Cicer
Citation: Pradeep K, Bell RW and Vance W (2020) Variation of Cicer Germplasm to Manganese Toxicity Tolerance. Front. Plant Sci. 11:588065. doi: 10.3389/fpls.2020.588065
Received: 28 July 2020; Accepted: 29 October 2020;
Published: 30 November 2020.
Edited by:
Manuel González-Guerrero, Polytechnic University of Madrid, SpainReviewed by:
Santiago Alejandro, Martin Luther University of Halle-Wittenberg, GermanyCorina Carranca, Instituto Nacional Investigaciao Agraria e Veterinaria (INIAV), Portugal
Copyright © 2020 Pradeep, Bell and Vance. This is an open-access article distributed under the terms of the Creative Commons Attribution License (CC BY). The use, distribution or reproduction in other forums is permitted, provided the original author(s) and the copyright owner(s) are credited and that the original publication in this journal is cited, in accordance with accepted academic practice. No use, distribution or reproduction is permitted which does not comply with these terms.
*Correspondence: Karthika Pradeep, Karthika_horti@yahoo.com