 Daisuke Ogawa1*†
 Toshihiro Sakamoto2†
 Hiroshi Tsunematsu1Noriko Kanno1Yasunori Nonoue1
 Jun-ichi Yonemaru1*
- 1Institute of Crop Science, National Agricultural and Food Research Organization, Tsukuba, Japan
- 2Institute for Agro-Environmental Sciences, National Agriculture and Food Research Organization, Tsukuba, Japan
High-throughput phenotyping systems with unmanned aerial vehicles (UAVs) enable observation of crop lines in the field. In this study, we show the ability of time-course monitoring of canopy height (CH) to identify quantitative trait loci (QTLs) and to characterise their pleiotropic effect on various traits. We generated a digital surface model from low-altitude UAV-captured colour digital images and investigated CH data of rice multi-parental advanced generation inter-cross (MAGIC) lines from tillering and heading to maturation. Genome-wide association studies (GWASs) using the CH data and haplotype information of the MAGIC lines revealed 11 QTLs for CH. Each QTL showed haplotype effects on different features of CH such as stage-specificity and constancy. Haplotype analysis revealed relationships at the QTL level between CH and, vegetation fraction and leaf colour [derived from UAV red–green–blue (RGB) data], and CH and yield-related traits. Noticeably, haplotypes with canopy lowering effects at qCH1-4, qCH2, and qCH10-2 increased the ratio of panicle weight to leaf and stem weight, suggesting biomass allocation to grain yield or others through growth regulation of CH. Allele mining using gene information with eight founders of the MAGIC lines revealed the possibility that qCH1-4 contains multiple alleles of semi-dwarf 1 (sd1), the IR-8 allele of which significantly contributed to the “green revolution” in rice. This use of remote-sensing-derived phenotyping data into genetics using the MAGIC lines gives insight into how rice plants grow, develop, and produce grains in phenology and provides information on effective haplotypes for breeding with ideal plant architecture and grain yield.
Introduction
Crops dramatically change during their cultivation in the field in terms of mass, morphology, and colours, and these changes are similar when grown in the same cultivation region and season. These phenological aspects in crops are possibly acquired through domestication (Gong, 2020; Lu et al., 2020) and are important to farmers in terms of efficient seasonal farming activities and maximisation of yields in a single harvest. How crops grow and develop differs depending on their genotypes, which often determine yield by regulating the transition from vegetative to the reproductive stage (Xue et al., 2008; Hill and Li, 2016). So far, to increase rice yields in breeding studies, genetic approaches using a population with natural variation and artificial mutation lines have largely focused on genes related to panicle number (PN), grain number per panicle, and grain weight (Xing and Zhang, 2010; Miura et al., 2011; Yin et al., 2021). On the other hand, how growth patterns during the cultivation term affect yield have not been examined in the field. One reason is that manual time-series measurement of crop growth is time-consuming and laborious. Another reason is that remote-sensing technology for observing crops has not been popular and familiar for breeding researchers. However, the advent of low-cost, user-friendly unmanned aerial vehicles (UAVs) is changing this situation.
Unmanned aerial vehicles can be used as non-destructive high-throughput phenotyping tools in the field and can facilitate the rapid observation of thousands of crop lines. A series of images covering a cultivation field are combined into an orthomosaic image using structure-from-motion/multi-view-stereo (SfM/MVS) software with high-accuracy ground control points (GCPs) (Jin et al., 2017; Weiss and Baret, 2017), enabling observation of a time-course of the changes in each crop line. Image data analysis can now be performed even by consumer-grade personal computers, and UAVs can be equipped with various sensors, such as digital red–green–blue (RGB), thermal, multispectral, and hyperspectral sensors (Gracia-Romero et al., 2019). From the image data derived from the sensors, specific phenotypes, such as vegetation fraction (VF), plant height, architecture, drought adaptability, and disease severity, have been evaluated (Gracia-Romero et al., 2017; Madec et al., 2017; Condorelli et al., 2018; Zhang et al., 2018; Chen et al., 2019; Hassan et al., 2019; Li et al., 2019; Marcial-Pablo et al., 2019; Ogawa et al., 2019; Wang et al., 2019b) and used for estimation of biomass and yield (Yue et al., 2017; Gong et al., 2018; Di Gennaro et al., 2019; Duan et al., 2019; Wang et al., 2019a).
One of the major issues in the use of UAVs in breeding studies is that the digital data deviate from the traditional traits related to yield, which are manually investigated using the conventional method using a ruler and scale. If the gaps between the image data and traditional trait data can be narrowed, it will accelerate the use of UAV imagery in the breeding study. In our previous study, we showed that VF calculated from UAV imagery is related to shoot dry weight during the vegetative stage in rice when observed in a population of multi-parental inter-mated lines [known as multi-parental advanced generation inter-cross (MAGIC) lines] named Japan-MAGIC (JAM) (Ogawa et al., 2021). A genome-wide association study (GWAS) using haplotype information in the JAM lines identified four quantitative trait loci (QTLs) for VF. Noticeably, the correlation between the VF and panicle weight (PW), grain yield trait was detected at the QTL level, suggesting that genetic analysis has the potential to make connections between high-throughput phenotyping data derived from UAV imagery and traditional yield trait data. This motivated us to examine another physical indicator, plant height, to reveal how vertical growth influences traits related to yield because VF represents growth only in two dimensions.
Plant height in crops is an important trait for plant architecture, affecting lodging tolerance and yield (Sakamoto and Matsuoka, 2004; Liu et al., 2018). Historically known as the “green revolution,” the introduction of semi-dwarf gene alleles resulted in remarkable increases in yields of wheat and rice (Peng et al., 1999; Sasaki et al., 2002). Plant height is regulated by many factors involved in the biosynthesis of and signal transduction by phytohormones, gibberellins (GA), brassinosteroids, and strigolactones (Salas Fernandez et al., 2009; Liu et al., 2018). Although the QTL analysis using genetically characterised populations and time-course plant height data has begun in wheat, maize, and rice (Tanger et al., 2017; Wang et al., 2019b; Lyra et al., 2020), the timing of the action of the genetic factors for plant height during the cultivation term and how they have an effect on plant architecture, biomass, and yield are scarcely known.
In this study, we focused on rice canopy height (CH) derived from UAV imagery. From 2 years of field experiments using the JAM lines, we showed that CH is a genetic trait. Genetic analysis using the JAM lines identified QTLs for CH (qCH), some of which have phenological features of growth stage specificity in their effects on CH. Haplotype analysis showed correlations of CH with other types of image data including VF and colour and with traits related to yield. Characterisation of these QTLs will facilitate the breeding of ideal rice varieties.
Materials and Methods
Cultivation of JAM Lines
The JAM population is derived from eight founders (Ogawa et al., 2018b): “Akidawara” (AK), “Bekogonomi” (BE), “Tachiaoba” (TC), “Mizuhochikara” (MI) (all japonica), “Suwon 258” (SU), “Takanari” (TK), “Hokuriku 193” (HO), and “Ruriaoba” (RU) (all indica). We cultivated 165 JAM lines (F7 in 2018 and F8 in 2019) without replication according to standard procedures at NARO in Tsukuba, Japan as described previously (Ogawa et al., 2021). In brief, seeds soaked in water at 28°C for 2 days were sown in trays filled with soil and incubated at 30°C in the dark for 2 days. Seedlings were grown in a paddy field in Kannondai, Tsukuba, for around a month, and then 33 seedlings per line were transplanted (11 plants 18 cm apart ×3 rows 30 cm apart, no replicates) into a nearby paddy field and grown for 5 months.
UAV-Based Aerial Photography
Aerial images were taken in the same way as described previously (Ogawa et al., 2021). In brief, a Phantom 4 Pro UAV (P4P; DJI, Shenzhen, China) flew automatically above the field at 10 m altitudes. The flight path and image shooting setting were planned by DJI GS Pro software as follows: capture mode, time interval; speed, 1.0 m/s; front overlap ratio, 80%; side overlap ratio, 79%; gimbal pitch angle, −90°; image size, 3:2 (5,472 × 3,648 pixels); image format, JPG; white balance, cloudy; aperture, auto; shutter, auto; and exposure compensation value, −1 or 0. To set the focus, the P4P was manually raised to 10 m, the camera was focused automatically on a region of the canopy, and then the focus mode was changed to manual. On GCPs, we painted black and white markers at eight points on paved surfaces surrounding the field and precisely measured the latitude, longitude, and altitude of each point with a TCRP1205 surveyor (Leica, Heerbrugg, Switzerland).
Generation of Orthomosaic Images and Digital Surface Model From the UAV Images
In Agisoft Metashape Professional v. 1.6.5 software (Agisoft, St. Petersburg, Russia), we generated an orthomosaic image from each set of aerial images using the following steps as described (Ogawa et al., 2019): (1) align photos (accuracy, high), (2) input GCPs, (3) build mesh (surface type, height field; source data, sparse cloud), (4) build digital elevation model (DEM; source data, sparse cloud), (5) calibrate colours (source data, model; calibrate white balance, no), and (6) build orthomosaic (surface DEM; blending mode, mosaic). A digital surface model (DSM) was also generated from the same dataset in the following steps: (1) align photos (accuracy, high), (2) input GCPs, (3) build dense cloud (accuracy, high), (4) build mesh (surface type, height field; source data, dense cloud), and (5) build DEM (source data, dense cloud). The orthomosaic images and the DSM images were analysed in ENVI v. 5.5 remote-sensing software (Harris Geospatial, Boulder, CO, USA). The map projection was converted to UTM zone 54N (WGS-84) with a 2-mm/pixel resolution. The converted image was rotated 66° clockwise to match the long-side direction of the field with the lateral direction of the final output image. Then the image was resized to a rectangle (28,000 × 14,000 pixels) including the field and the eight markers to minimise file size and thus processing time. The configuration of the computer used in this study is as follows: Intel(R) Core i7-6850-K CPU@3.8 GHz, 128 GB RAM, two NVIDIA GeForce GTX 1080Ti GPUs, and Windows 10 Pro, 64-bit operating system. It took 4 h for the whole process to create and analyse an orthomosaic image derived from about 600 images of a 30 m × 50 m field area. The workflow of the image capture and analysis are shown in Supplementary Figure 1.
Quantification of CH
We made a DSM of the paddy field from a series of UAV RGB data with GCPs (Supplementary Figure 2) and estimated the CH by taking the difference in DSM between the day before transplanting and the observation date. We conducted a field survey to measure the CH of the 165 JAM lines by using a handy laser range finder (GLM 50 C, Robert Bosch, Gerlingen, Germany) and confirmed that the correlation coefficient between CH from the model and manual measurement was high (r = 0.87) (Supplementary Figure 3).
Quantification of VF
The vegetation fraction was calculated as described previously (Ogawa et al., 2019). In brief, regions covering 3 × 3 plants of each JAM line in orthomosaic images were extracted, and RGB data were converted to the L*a*b* colour space (León et al., 2006). The a* data were used for auto-image thresholding by the Otsu method to create binary images for extracting plant regions, and the percentage of the number of pixels of the plant region to the total number of pixels was defined as the VF.
Haplotype-Based GWAS
Haplotypes in the 165 JAM lines were estimated as in an Arabidopsis MAGIC population (Kover et al., 2009) from sequencing data of the eight founders and of 13,603 single-nucleotide polymorphisms (SNPs) determined by genotyping-by-sequencing analysis (Ogawa et al., 2018a,b). The haplotypes at each SNP were defined from the genotypes of the founders. Haplotype-based GWAS used haplotype information at each SNP and phenotype data in non-parametric ANOVA (Kruskal–Wallis rank-sum test) in the “kruskal.test” package of R software. The p-values obtained from the statistical analysis were used for the Manhattan plot. To identify qCH QTLs, we selected SNPs with a p < 1.0 × 10⁻² in 2019 and 2018, and with the product of the two p-values is < 1.0 × 10⁻⁵. In the case of consecutive selected SNPs, the SNP with the lowest p-value defined the QTL unless the distance between them was more than 2 Mb. The effect of the haplotype on CH at each qCH QTL position was calculated using CH (Supplementary Data 1) and haplotype (Supplementary Data 2) data. We defined an averaged CH value per haplotype as a haplotype effect on CH. If the number of haplotypes was less than four (Supplementary Data 3), the data were not used for this study. We calculated the ratio of the average CH value for each haplotype to the average CH for all of the JAM lines. The haplotype effect was illustrated on scatter plots using R software.
Manual Measurement of Traits Related to Yield
Culm length (CL) and panicle length (PL) were assessed on the longest culm in each plant and measured with a ruler from 10 days to a month after heading. At the time of the measurement, the PN was counted. For measurement of PW and stem and leaf weight (SLW), shoots of mature plants were dried for over a month in a drying room and cut 3 cm below the panicle base to separate the parts (Ogawa et al., 2021). The total weight (TW) was calculated as PW + SLW. CL, PL, PN, PW, SLW, and TW values for each JAM line are averages of five plants. SDW was measured as described previously (Ogawa et al., 2021). All of the abbreviations in this manuscript are listed in Table 1.

Table 1. List of abbreviations.
Results
Detection of QTLs for CH
We observed how CH in the JAM lines changed during the cultivation term using UAV imagery. The average CH in the JAM lines increased for 83 days after transplanting to the field (DAT) and decreased moderately after that (Supplementary Figure 4A). This appears to be related to the vertical growth of rice plants until tillering and heading, followed by drooping of stems and panicles during maturation. Wide phenotypic variation was observed in the JAM lines at 83 DAT in both years. Positive correlations were detected in the timing after transplanting of six developmental stages (two tillering, heading, and maturation stages) in the 2-year data (Supplementary Figure 4B), indicating that the CH is a heritable trait.
To determine which genetic factors are involved in controlling CH, we performed a haplotype-based GWAS using CH data and haplotype information on 13,603 SNPs of the 165 JAM lines. As a result, we found 11 QTLs (Figure 1, Table 2, Supplementary Figure 5), and named them qCH1-1, qCH1-2, qCH1-3, qCH1-4, qCH2, qCH3, qCH5-1, qCH5-2, qCH7, qCH10-1, and qCH10-2. The time points when the QTLs were detected were different among the QTLs; qCH1 and qCH5-1, and qCH3, qCH10-1, and qCH10-2 were heading and maturation stage-specific, respectively. qCH1-2 and qCH1-4 were detected at the tillering, heading, and maturation stages.
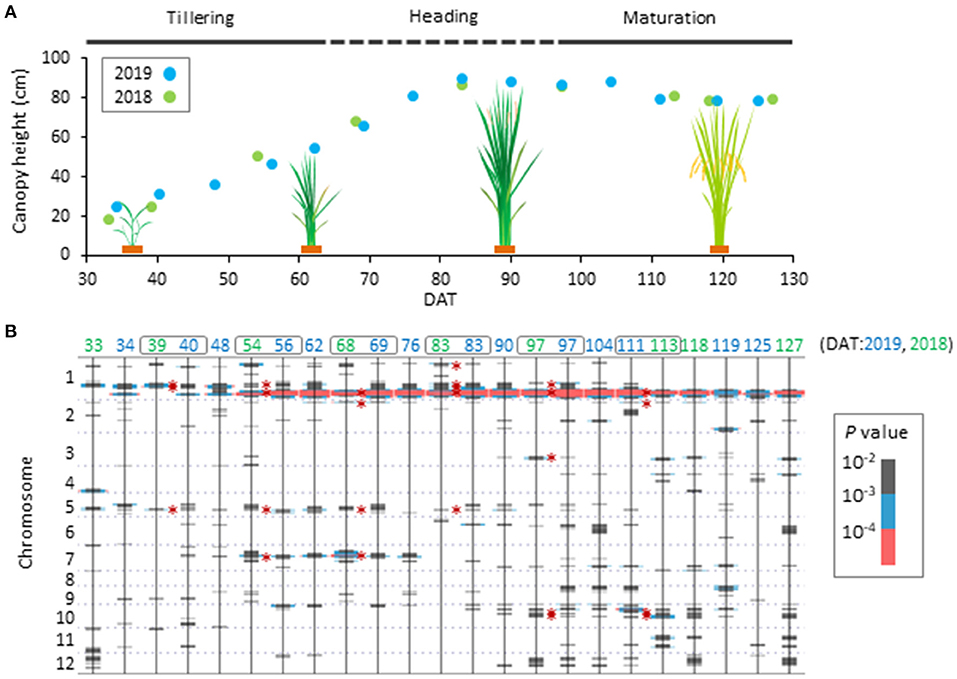
Figure 1. Time-course pattern of QTL appearance in canopy height of JAM lines. (A) Scheme of phenological change of canopy height (CH) of the JAM lines. Average values of canopy height (CH) of the 165 JAM lines were plotted. There are tillering, heading and maturation stages in the developmental process. (B) Summary of haplotype-based genome wide association study on CH using the 165 JAM lines. Results from data collected in 2019 and 2018 are shown together arranged in ascending order of DAT from left to right. Bars in grey, blue and pink were added at positions where P-values are lower than 10−2. Six time points of DAT indicated by grey boxes were focused on in this study. Defined QTL regions are marked with asterisks.
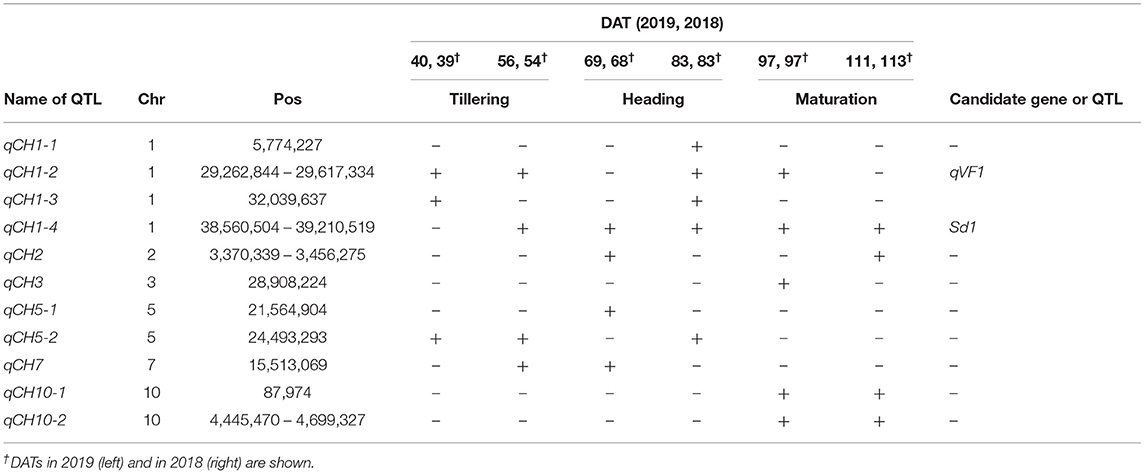
Table 2. Quantitative trait loci (QTLs) for canopy height (CH) shown in Figure 1.
Among the qCH QTLs, we first focused on qCH1-4, where the most remarkable peak was detected (Figure 1, Supplementary Figure 5) close to the semi-dwarf 1 (sd1) gene. The CH in lines possessing each of the haplotypes at qCH1-4 on CH was most different at 83 DAT in 2019 and 68 DAT in 2018 (Figure 2A). There are four alleles of the Sd1 gene in the eight founders of the JAM lines, as described previously (Ogawa et al., 2018b). When the lines were classified by their Sd1 gene allele based on the haplotype information, the CH of three classes (c: allele A, b: allele B, a: allele C and D) was statistically differentiated from 56 to 111 DAT in 2019 and from 68 to 97 DAT in 2018 (Figure 2B, Supplementary Figure 6), which is during the late tillering stage and early maturation stage. This Sd1 allelic pattern is consistent with the allele function presumed from data of CL (Ogawa et al., 2018b), indicating that Sd1 is a candidate gene for qCH1-4.
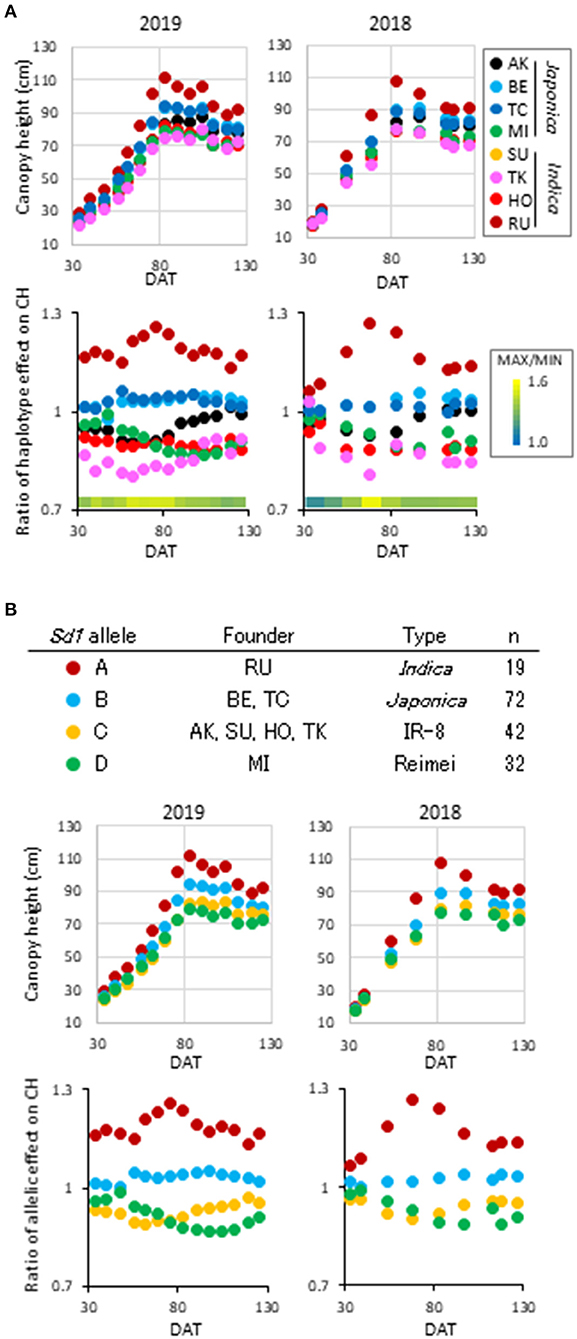
Figure 2. Haplotype effect on canopy height at qCH1-4. (A) Time-course pattern of haplotype effect on CH at qCH1-4. Average phenotypic values of the eight haplotypes (top) and ratio of the haplotype effect to average of the JAM lines (bottom) at each DAT in 2019 (left) and 2018 (right) are plotted. (B) Time-course pattern of Sd1 allelic effect on CH at qCH1-4. Four Sd1 alleles were included in the eight founders (top). Average phenotypic values of the four alleles (middle) and ratio of the allelic effect to average of the JAM lines (bottom) at each DAT in 2019 (left) and 2018 (right) are plotted.
The time-course pattern of haplotype effect on CH was different among the qCH QTLs (Figures 2A, 3, Supplementary Figure 7, Supplementary Data 4). To characterise the QTLs, hierarchical clustering analysis using correlation coefficient r-values of all CH data in 2019 and 2018 was performed (Supplementary Figures 8, 9). Pairs of QTLs close in chromosome position were located in the same clusters, such as qCH5-1 and qCH5-2, qCH1-2 and qCH1-3, and qCH10-1 and qCH10-2 because their pattern of haplotypes is similar between the two QTLs (Supplementary Data 2). Although qCH1-4 and qCH2 are on different chromosomes, they were located in the same cluster, where the haplotype effect on CH tended to be relatively stable through rice development and cultivation years (Figures 2A, 3, Supplementary Figure 7). Similar to qCH1-4, haplotype [RU] at qCH2 had a greater ability to increase CH. When the time-course haplotype data on CH was modelled using a quadratic curve (Supplementary Figure 10), the coefficients showing the sharpness of curve for [RU] at qCH1-4 and qCH2 were remarkably lower than for the other haplotypes.
Figure 3. Time-course pattern of haplotype effect on CH at qCH QTLs except for qCH1-4. Average of haplotype effect on CH (left) and ratio of the haplotype effect to the average values in the JAM lines (right) at each DAT in 2019 were plotted.
Effect of qCH on Vegetation Fraction
qCH1-2 was close to the position of qVF1 (Ogawa et al., 2021), which is a QTL for VF, detecting using images as shown in Supplementary Figure 11. To examine the relationship between CH and VF at all qCH QTLs including qCH1-2, we carried out correlation analysis at the haplotype level. The haplotype effects on CH and VF were highly correlated at qCH1-1, qCH1-2, and qCH1-3 (Supplementary Figure 12A), indicating that these QTLs contribute to both lateral and vertical growth. At qCH1-2 and qCH1-3, the indica haplotypes [RU, HO, and TK] caused increased CH and VF relative to the japonica haplotypes [AK, BE, TC, and MI] (Supplementary Figure 12B), and CH was also related to shoot dry weight (SDW) (Supplementary Figure 12C).
Effect of qCH on Leaf Colour
It has been reported that stem and leaf elongation and leaves turning pale green are induced by the effect of plant hormone gibberellin (GA) in Arabidopsis (Jacobsen and Olszewski, 1993; Olszewski et al., 2002). It is well-known that GA plays a role in controlling leaf length and CL in rice (Sasaki et al., 2002; Liu et al., 2018). This motivated us to examine if CH is correlated with leaf colour from tillering to maturation. We isolated the leaf region from orthomosaic images and obtained a* data from RGB data (León et al., 2006). We used minus a* (–a*) data as an indicator of leaf colour, which ranges from red (−128) to green (+128). The average –a* in the 165 JAM lines increased until 69 DAT in 2019 and until 83 DAT in 2018 during the early heading stage and then decreased during maturation (Supplementary Figure 13A). The –a* data at the selected six time-points were similar between 2019 and 2018 (Supplementary Figure 13B). We expected a negative correlation between CH and –a* (green colour level of leaves) in the JAM lines like the GA response in Arabidopsis, but a simple negative correlation was not observed (Supplementary Figure 14).
At the QTL level, the relationship between CH and –a* depended on the qCH QTLs and the time-point (Supplementary Figure 14). Correlation values between haplotype effects on CH and –a* dramatically changed from 97 to 111 DAT in 2019 and from 83 to 113 DAT in 2018 during maturation at several qCH QTLs. To understand these changes, we examined haplotype effects on CH and –a* in detail. We focused on the effects of haplotype (TC) at qCH1-1, haplotype (RU) at qCH1-4, and haplotype (RU) at qCH2, which have a strong ability to increase CH. The effect of haplotype (TC) at qCH1-1 was kept on CH and –a* at a high level until 111 DAT in 2019 and 113 DAT in 2018, but the other two haplotypes caused sudden drops in –a* (Figure 4). This indicates that specific haplotypes can lead to rapid leaf senescence during maturation. Considering that Sd1 encoding GA 20-oxidase is a candidate of qCH1-4, involvement of GA in leaf senescence is presumed.
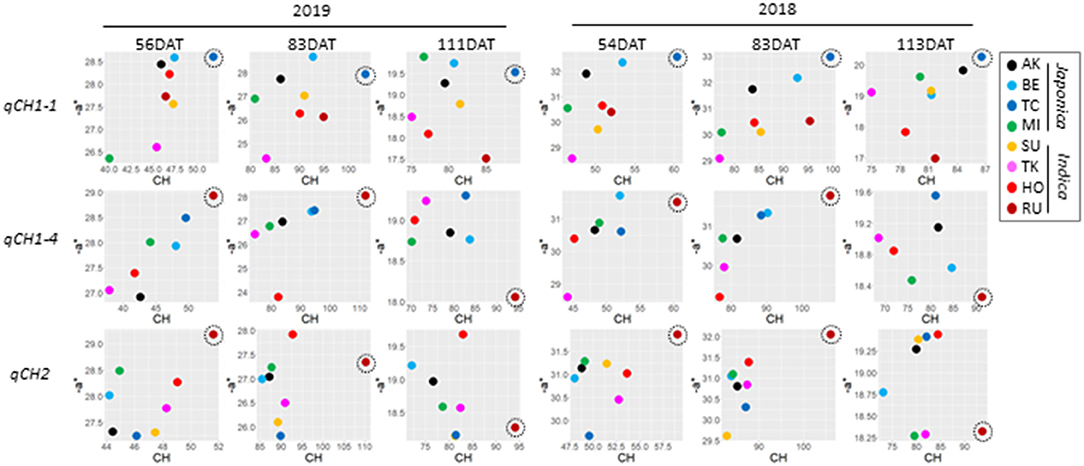
Figure 4. Difference of the relationship between CH and –a* data at qCH QTLs. Plots of the correlation of haplotype effect between CH and –a* at qCH1-1 (top), qCH1-4 (middle) and qCH2 (bottom) in 2019 (left) and 2018 (right). Haplotype [TC] at qCH1-1, haplotype [RU] at qCH1-4, and haplotype [RU] at qCH2 were focused on as remarkable haplotypes for CH, and are indicated by dotted circles.
Effect of qCH QTLs on Traits Related to Yield
To clarify relationships between CH and traits related to yield, we first examined if CH contributes to traits including CL, PL, and PN. CH and CL in 165 JAM lines were highly correlated at 83 and 97 DAT in 2019 and 2018, but not after that, possibly because plant architecture including panicle and leaf positions drastically changed during maturation (Supplementary Figure 15A). Consistent with this, the patterns of haplotype effects on CH were highly similar to those on CL at all qCH QTLs (Supplementary Figures 15B, 16). The relationship between CH and PL was positive in the JAM lines in 2019 and 2018, but the relationship between CH and PN was negative (Supplementary Figure 15B). At the QTL level, the pattern of the haplotype effect on CH was positively related to that on PL clearly at qCH1-1, qCH2, and qCH7 in 2019 and 2018 (Supplementary Figure 17A) and was negatively done to that on PN at qCH1-4 and qCH7 (Supplementary Figure 17B).
We next examined if CH is associated with PW, SLW, and the TW. CH data tended to be weakly correlated to SLW and TW in 2019 and 2018, but not to PW (Supplementary Figure 15A). At the QTL level, the relationship of the haplotype effects on CH and TW was not robust in 2019 and 2018 (Supplementary Figure 15B). Correlation of haplotype effects on CH and SLW was observed at qCH1-1, qCH1-2, qCH1-4, qCH2, and qCH10-2 in 2019 and 2018 although the time-points when the correlation was detected depending on the QTL. Intriguingly, among the qCH QTLs, a negative relationship between CH and PW was often found at qCH1-4, qCH2, and qCH10-2. When the ratio of PW to SLW was examined at the three QTLs, CH was negatively related to the ratio (Figure 5A). QTL haplotypes that reduced CH led to significantly increased PW and decreased SLW in contrast to those with the effect of increasing CH, at least once in the 2 years' experiments (Figure 5B). These results suggest regulation of the balance between PW and SLW by the QTLs for CH.
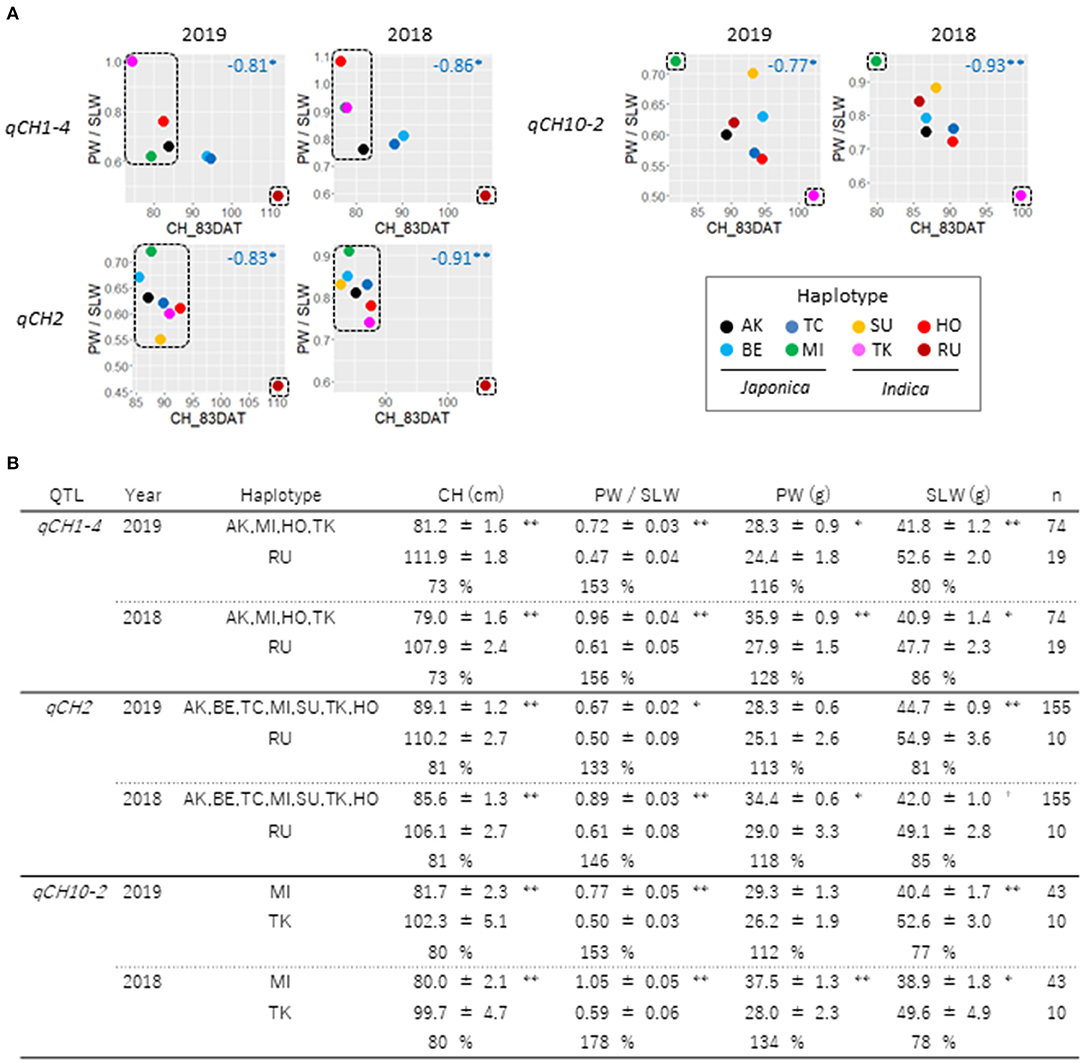
Figure 5. Relationships between CH and ratio of PW to SLW at qCH QTLs. (A) Haplotype effects on CH at 83DAT and ratio of PW to SLW in 2019 (left) and 2018 (right) at qCH1-4, qCH2 and qCH10-2 were plotted. Numbers in blue indicate Pearson's r. Asterisks indicate significant correlations (Pairwise two-sided, **P < 0.01, *P < 0.05). (B) Comparison of haplotype effects on CH, PW/SLW, PW and SLW at qCH1-4, qCH2 and qCH10-2 were shown. Data on haplotypes enclosed by dotted lines in (A) at the three QTLs were examined. Mean ± standard error of phenotypes and ratio of phenotype data in top haplotype class to that in bottom haplotype class at each QTL were shown (student t-test: **P < 0.01, *P < 0.05, +P < 0.1).
Discussion
Traditional crop breeding research has focused mainly on traits that can be obtained in a single destructive inspection. This approach missed information about the timing and significance of changes in growth and development. Remote-sensing technology has the potential to compensate (Sakamoto et al., 2012; Sakamoto, 2018). In this study, we developed a CH measurement method using UAV imagery with rice cultivated in a paddy field and performed GWAS using time-course CH data and haplotype information in JAM lines. Due to the opportunity of multiple observations, we were able to identify 11 qCH QTLs, which were robust in the 2 years of the experiments. By analysing haplotype effects on CH, we revealed significant correlations of the haplotype data in 2019 and 2018 at all QTLs, and the persistence and transience of different haplotype functions in vertical growth showed differences in phenology among QTLs.
As summarised in Figure 6, haplotype analysis using JAM lines revealed; (1) correlation between haplotype effects on CH and CL at all QTLs, (2) correlation between haplotype effects on CH and PL at qCH1-1, qCH2, and qCH7, and (3) negative correlation between haplotype effects on CH and PN at qCH1-4 and qCH7. These results indicate differing pleiotropic effects of qCH QTLs on traits related to yield, except for CL. Furthermore, the negative correlation of haplotype effects on CH and the ratio of PW to SLW was detected at qCH1-4, qCH2, and qCH10-2, all of which function at least during the maturation stage. This indicates that CH contributes to increasing the final number of leaves and stems instead of grains in panicles under the control of haplotypes at qCH1-4, qCH2, and qCH10-2, implying the influence of phenological CH regulation on the allocation of photosynthetic products to leaves and stems or grains.
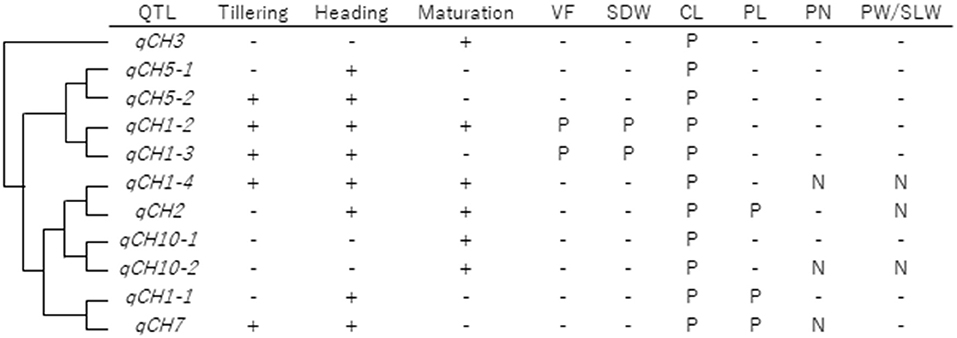
Figure 6. Summary of qCH QTLs. qCH QTLs were aligned in order of hierarchical clustering in terms of haplotype effect on CH in 2019 and 2018, shown in Supplementary Figure 9. Each QTL was detected in the three stages (tillering, heading, and maturation) and the positive (P) or negative (N) relationships of haplotype effects between CH and VF, SDW, CL, PL, PN, and PW/SLW were shown. In terms of VF and SDW, results shown in Supplementary Figure 12 were summarised. In terms of CL, PL, and PN, P or N was labelled when significant correlation (P < 0.05) was detected a total of twice or more among the six time points in 2019 and 2018. In terms of PW/SLW, results shown in Figure 5B were summarised.
We also attempted to examine the relationship between CH and data derived from UAV imagery including VF and –a*, leaf colour. Haplotype analysis in terms of VF revealed a connection between lateral and vertical growth at qCH1-2 and qCH1-3, which are close to qVF1 (Ogawa et al., 2021). In the case of –a* data analysis, rapid leaf senescence was observed for haplotype (RU) of qCH1-4 and qCH2, which has a strong ability to increase CH. PW in JAM lines with this haplotype was lower than that in the other haplotypes, implying some relationship among yield, senescence, and timing, and intensity of shoot growth during the cultivation term. In Japan, only the cultivar RU among the eight founders of the JAM lines is cultivated for whole crop silage. The haplotype (RU) at qCH1-4 and qCH2 might play a central role to increase the amount of leaf and stem relative to grains.
Our haplotype approach detected qCH1-4 as the most remarkable QTL for CH, whose candidate is the Sd1 gene. qCH1-4 affected the balance between the amount of leaf and stem and yield in this genetic study, showing the effectiveness of the green revolution with the Sd1 gene in the JAM lines. In breeding, it is said that the overuse of Sd1 in rice cultivars runs the risk of lowing genetic diversity (Liu et al., 2018). To avoid this risk, haplotypes at qCH2 and qCH10-2 with effects that lower CH may be options for the production of new semi-dwarf cultivars because they also induce an increase of yield like qCH1-4.
In the method of CH measurement, it took 30 min for capturing RGB images of 30 m × 50 m field area by using UAV and 4 h for image analysis. The method enabled the measurement of CH with high accuracy without any laborious steps, demonstrating an effective way to examine CH of rice lines grown in the field. We used the Agisoft MetaShape Professional v. 1.6.5 software to create orthomosaic images and ENVI software (Harris Geospatial, Boulder, CO, USA) to analyse phenotype data, which we have also been used for the analysis of VF and plant architecture in our previous works (Ogawa et al., 2019, 2021). We believe that both of the software is very useful for high-throughput phenotyping using UAVs because it is user-friendly and keeping updated. As alternative SfM/MVS software, Pix4D is known to create orthomosaic images for investigating phenotypes of crops (Zhang et al., 2018; Chen et al., 2019; Hassan et al., 2019; Li et al., 2019, Marcial-Pablo et al., 2019).
In this study, we showed correlations and trade-off relationships between CH and the other traits at the QTL level. It is suggested that QTLs for CH are key factors for plant architecture, biomass, and yield. This study was accomplished by the integration of the remote-sensing technology and genetics using our rice MAGIC population. Our methodology can generate more than 100,000 (8 haplotypes × 13,615 SNPs) haplotype patterns for each time-course of phenotype data in a 1-year experiment. If the number of SNPs is increased and the experiments continue, haplotype data with phenotypic information increase. Haplotype pattern analysis using recently developed massive data analysis methods, such as machine learning, will uncover further relationships between traits useful for the production of ideal varieties. This haplotype approach using a genetically characterised population can be applied to other high-throughput phenotyping data and other crops. We believe such trials will advance digital data-driven breeding.
Data Availability Statement
The raw data supporting the conclusions of this article will be made available by the authors, without undue reservation.
Author Contributions
DO and J-iY conceptualised the research. DO, TS, HT, NK, YN, and J-iY performed the investigations. DO, TS, and J-iY developed the methodology and performed the formal analysis. DO, NK, and YN provided the resources. DO, TS, HT, and J-iY performed data curation. DO, HT, and J-iY helped with funding acquisition. DO provided project administration and wrote the manuscript. J-iY helped with writing the original draft of the manuscript. TS and J-iY reviewed and edited the manuscript. All authors contributed to the article and approved the submitted version.
Funding
This study was supported by grants from the Ministry of Agriculture, Forestry and Fisheries of Japan [Smart-breeding system for Innovative Agriculture (Grant Number: BAC1003)], and from the Science and Technology Research Promotion Program for Agriculture, Forestry, Fisheries and Food Industry (Grant Number: 27007B).
Conflict of Interest
The authors declare that the research was conducted in the absence of any commercial or financial relationships that could be construed as a potential conflict of interest.
Publisher's Note
All claims expressed in this article are solely those of the authors and do not necessarily represent those of their affiliated organizations, or those of the publisher, the editors and the reviewers. Any product that may be evaluated in this article, or claim that may be made by its manufacturer, is not guaranteed or endorsed by the publisher.
Acknowledgments
We thank Emi Abe, Aono Yuko, Terumi Satou, Megumi Suzuki, Yukari Shimazu, Tomomi Koguchi, Miho Shoji, and Mitsue Ito for the field support, and Matthew Shenton for scientific discussion and English editing of the manuscript.
Supplementary Material
The Supplementary Material for this article can be found online at: https://www.frontiersin.org/articles/10.3389/fpls.2021.715184/full#supplementary-material
References
Chen, Y., Sidhu, H. S., Kaviani, M., McElroy, M. S., Pozniak, C. J., and Navabi, A. (2019). Application of image-based phenotyping tools to identify QTL for in-field winter survival of winter wheat (Triticum aestivum L.). Theor. Appl. Genet. 132, 2591–2604. doi: 10.1007/s00122-019-03373-6
Condorelli, G. E., Maccaferri, M., Newcomb, M., Andrade-Sanchez, P., White, J. W., French, A. N., et al. (2018). Comparative aerial and ground based high throughput phenotyping for the genetic dissection of NDVI as a proxy for drought adaptive traits in durum wheat. Front. Plant Sci. 9:893. doi: 10.3389/fpls.2018.00893
Di Gennaro, S. F., Toscano, P., Cinat, P., Berton, A., and Matese, A. (2019). A low-cost and unsupervised image recognition methodology for yield estimation in a vineyard. Front. Plant Sci. 10:559. doi: 10.3389/fpls.2019.00559
Duan, B., Fang, S., Zhu, R., Wu, X., Wang, S., Gong, Y., et al. (2019). Remote estimation of rice yield with unmanned aerial vehicle (UAV) data and spectral mixture analysis. Front. Plant Sci. 10:204. doi: 10.3389/fpls.2019.00204
Gong, Y., Duan, B., Fang, S., Zhu, R., Wu, X., Ma, Y., et al. (2018). Remote estimation of rapeseed yield with unmanned aerial vehicle (UAV) imaging and spectral mixture analysis. Plant Methods 14:70. doi: 10.1186/s13007-018-0338-z
Gong, Z. (2020). Flowering phenology as a core domestication trait in soybean. J. Integr. Plant Biol. 62, 546–549. doi: 10.1111/jipb.12934
Gracia-Romero, A., Kefauver, S. C., Fernandez-Gallego, J. A., Vergara-Diaz, O., Nieto-Taladriz, M. T., and Araus, J. L. (2019). UAV and ground image-based phenotyping: a proof of concept with durum wheat. Remote Sens. 11:25. doi: 10.3390/rs11101244
Gracia-Romero, A., Kefauver, S. C., Vergara-Diaz, O., Zaman-Allah, M. A., Prasanna, B. M., Cairns, J. E., et al. (2017). Comparative performance of ground vs. aerially assessed rgb and multispectral indices for early-growth evaluation of maize performance under phosphorus fertilization. Front. Plant Sci. 8:2004. doi: 10.3389/fpls.2017.02004
Hassan, M. A., Yang, M., Fu, L., Rasheed, A., Zheng, B., Xia, X., et al. (2019). Accuracy assessment of plant height using an unmanned aerial vehicle for quantitative genomic analysis in bread wheat. Plant Methods 15:37. doi: 10.1186/s13007-019-0419-7
Hill, C. B., and Li, C. (2016). Genetic architecture of flowering phenology in cereals and opportunities for crop improvement. Front. Plant Sci. 7:1906. doi: 10.3389/fpls.2016.01906
Jacobsen, S. E., and Olszewski, N. E. (1993). Mutations at the SPINDLY locus of Arabidopsis alter gibberellin signal transduction. Plant Cell 5, 887–896. doi: 10.1105/tpc.5.8.887
Jin, X. L., Liu, S. Y., Baret, F., Hemerle, M., and Comar, A. (2017). Estimates of plant density of wheat crops at emergence from very low altitude UAV imagery. Remote Sens. Environ. 198, 105–114. doi: 10.1016/j.rse.2017.06.007
Kover, P. X., Valdar, W., Trakalo, J., Scarcelli, N., Ehrenreich, I. M., Purugganan, M. D., et al. (2009). A Multiparent Advanced Generation Inter-Cross to fine-map quantitative traits in Arabidopsis thaliana. PLoS Genet. 5:e1000551. doi: 10.1371/journal.pgen.1000551
León, K., Mery, D., Pedreschi, F., and León, J. (2006). Color measurement in L*a*b* units from RGB digital images. Food Res. Int. 39, 1084–1091. doi: 10.1016/j.foodres.2006.03.006
Li, B., Xu, X., Han, J., Zhang, L., Bian, C., Jin, L., et al. (2019). The estimation of crop emergence in potatoes by UAV RGB imagery. Plant Methods 15:15. doi: 10.1186/s13007-019-0399-7
Liu, F., Wang, P., Zhang, X., Li, X., Yan, X., Fu, D., et al. (2018). The genetic and molecular basis of crop height based on a rice model. Planta 247, 1–26. doi: 10.1007/s00425-017-2798-1
Lu, S., Dong, L., Fang, C., Liu, S., Kong, L., Cheng, Q., et al. (2020). Stepwise selection on homeologous PRR genes controlling flowering and maturity during soybean domestication. Nat. Genet. 52, 428–436. doi: 10.1038/s41588-020-0604-7
Lyra, D. H., Virlet, N., Sadeghi-Tehran, P., Hassall, K. L., Wingen, L. U., Orford, S., et al. (2020). Functional QTL mapping and genomic prediction of canopy height in wheat measured using a robotic field phenotyping platform. J. Exp. Bot. 71, 1885–1898. doi: 10.1093/jxb/erz545
Madec, S., Baret, F., de Solan, B., Thomas, S., Dutartre, D., Jezequel, S., et al. (2017). High-throughput phenotyping of plant height: comparing unmanned aerial vehicles and ground LiDAR estimates. Front. Plant Sci. 8:2002. doi: 10.3389/fpls.2017.02002
Marcial-Pablo, M. d. J., Gonzalez-Sanchez, A., Jimenez-Jimenez, S. I., Ontiveros-Capurata, R. E., and Ojeda-Bustamante, W. (2019). Estimation of vegetation fraction using RGB and multispectral images from UAV. Int. J. Remote Sens. 40, 420–438. doi: 10.1080/01431161.2018.1528017
Miura, K., Ashikari, M., and Matsuoka, M. (2011). The role of QTLs in the breeding of high-yielding rice. Trends Plant Sci. 16, 319–326. doi: 10.1016/j.tplants.2011.02.009
Ogawa, D., Nonoue, Y., Tsunematsu, H., Kanno, N., Yamamoto, T., and Yonemaru, J. I. (2018a). Discovery of QTL alleles for grain shape in the Japan-MAGIC rice population using haplotype information. G3 8, 3559–3565. doi: 10.1534/g3.118.200558
Ogawa, D., Sakamoto, T., Tsunematsu, H., Kanno, N., Nonoue, Y., and Yonemaru, J. I. (2021). Haplotype analysis from unmanned aerial vehicle imagery of rice MAGIC population for the trait dissection of biomass and plant architecture. J. Exp. Bot. 72, 2371–2382. doi: 10.1093/jxb/eraa605
Ogawa, D., Sakamoto, T., Tsunematsu, H., Yamamoto, T., Kanno, N., Nonoue, Y., et al. (2019). Surveillance of panicle positions by unmanned aerial vehicle to reveal morphological features of rice. PLoS ONE 14:e0224386. doi: 10.1371/journal.pone.0224386
Ogawa, D., Yamamoto, E., Ohtani, T., Kanno, N., Tsunematsu, H., Nonoue, Y., et al. (2018b). Haplotype-based allele mining in the Japan-MAGIC rice population. Sci. Rep. 8:4379. doi: 10.1038/s41598-018-22657-3
Olszewski, N., Sun, T. P., and Gubler, F. (2002). Gibberellin signaling: biosynthesis, catabolism, and response pathways. Plant Cell 14(Suppl), S61–80. doi: 10.1105/tpc.010476
Peng, J., Richards, D. E., Hartley, N. M., Murphy, G. P., Devos, K. M., Flintham, J. E., et al. (1999). 'Green revolution' genes encode mutant gibberellin response modulators. Nature 400, 256–261. doi: 10.1038/22307
Sakamoto, T. (2018). Refined shape model fitting methods for detecting various types of phenological information on major US crops. Isprs J. Photogrammetry Remote Sens. 138, 176–192. doi: 10.1016/j.isprsjprs.2018.02.011
Sakamoto, T., Gitelson, A. A., Nguy-Robertson, A. L., Arkebauer, T. J., Wardlow, B. D., Suyker, A. E., et al. (2012). An alternative method using digital cameras for continuous monitoring of crop status. Agric. Forest Meteorol. 154, 113–126. doi: 10.1016/j.agrformet.2011.10.014
Sakamoto, T., and Matsuoka, M. (2004). Generating high-yielding varieties by genetic manipulation of plant architecture. Curr. Opin. Biotechnol. 15, 144–147. doi: 10.1016/j.copbio.2004.02.003
Salas Fernandez, M. G., Becraft, P. W., Yin, Y., and Lübberstedt, T. (2009). From dwarves to giants? Plant height manipulation for biomass yield. Trends Plant Sci. 14, 454–461. doi: 10.1016/j.tplants.2009.06.005
Sasaki, A., Ashikari, M., Ueguchi-Tanaka, M., Itoh, H., Nishimura, A., Swapan, D., et al. (2002). Green revolution: a mutant gibberellin-synthesis gene in rice. Nature 416, 701–702. doi: 10.1038/416701a
Tanger, P., Klassen, S., Mojica, J. P., Lovell, J. T., Moyers, B. T., Baraoidan, M., et al. (2017). Field-based high throughput phenotyping rapidly identifies genomic regions controlling yield components in rice. Sci. Rep. 7:42839. doi: 10.1038/srep42839
Wang, F., Wang, F., Zhang, Y., Hu, J., Huang, J., and Xie, J. (2019a). Rice yield estimation using parcel-level relative spectral variables from UAV-based hyperspectral imagery. Front. Plant Sci. 10:453. doi: 10.3389/fpls.2019.00453
Wang, X., Zhang, R., Song, W., Han, L., Liu, X., Sun, X., et al. (2019b). Dynamic plant height QTL revealed in maize through remote sensing phenotyping using a high-throughput unmanned aerial vehicle (UAV). Sci. Rep. 9:3458. doi: 10.1038/s41598-019-39448-z
Weiss, M., and Baret, F. (2017). Using 3D point clouds derived from UAV RGB imagery to describe vineyard 3D macro- structure. Remote Sens. 9:17. doi: 10.3390/rs9020111
Xing, Y., and Zhang, Q. (2010). Genetic and molecular bases of rice yield. Annu. Rev. Plant Biol. 61, 421–442. doi: 10.1146/annurev-arplant-042809-112209
Xue, W., Xing, Y., Weng, X., Zhao, Y., Tang, W., Wang, L., et al. (2008). Natural variation in Ghd7 is an important regulator of heading date and yield potential in rice. Nat. Genet. 40, 761–767. doi: 10.1038/ng.143
Yin, C., Zhu, Y., Li, X., and Lin, Y. (2021). Molecular and genetic aspects of grain number determination in rice (Oryza sativa L.). Int. J. Mol. Sci. 22:728. doi: 10.3390/ijms22020728
Yue, J., Yang, G., Li, C., Li, Z., Wang, Y., Feng, H., et al. (2017). Estimation of winter wheat above-ground biomass using unmanned aerial vehicle-based snapshot hyperspectral sensor and crop height improved models. Remote Sens. 9:708. doi: 10.3390/rs9070708
Keywords: canopy height, GWAS, haplotype, high-throughput phenotyping, magic, phenology, QTL, UAV
Citation: Ogawa D, Sakamoto T, Tsunematsu H, Kanno N, Nonoue Y and Yonemaru J-i (2021) Remote-Sensing-Combined Haplotype Analysis Using Multi-Parental Advanced Generation Inter-Cross Lines Reveals Phenology QTLs for Canopy Height in Rice. Front. Plant Sci. 12:715184. doi: 10.3389/fpls.2021.715184
Received: 26 May 2021; Accepted: 13 September 2021;
Published: 15 October 2021.
Edited by:
Sean Mayes, University of Nottingham, United KingdomReviewed by:
Hongyan Liu, Shanghai Agrobiological Gene Center, ChinaFrédéric Cointault, Agrosup Dijon, France
Copyright © 2021 Ogawa, Sakamoto, Tsunematsu, Kanno, Nonoue and Yonemaru. This is an open-access article distributed under the terms of the Creative Commons Attribution License (CC BY). The use, distribution or reproduction in other forums is permitted, provided the original author(s) and the copyright owner(s) are credited and that the original publication in this journal is cited, in accordance with accepted academic practice. No use, distribution or reproduction is permitted which does not comply with these terms.
*Correspondence: Daisuke Ogawa, daisuke.ogawa@affrc.go.jp; Jun-ichi Yonemaru, yonemaru@affrc.go.jp
†These authors have contributed equally to this work