 Wanli Han1†
 Jieyin Zhao1†Xiaojuan Deng1Aixing Gu1Duolu Li1Yuxiang Wang1Xiaoshuang Lu1Qianli Zu1Qin Chen1Quanjia Chen1
 Jinfa Zhang2Yanying Qu1*
- 1Engineering Research Centre of Cotton, Ministry of Education/College of Agriculture, Xinjiang Agricultural University, Ürümqi, China
- 2Department of Plant and Environmental Sciences, New Mexico State University, Las Cruces, NM, United States
Fusarium wilt caused by Fusarium oxysporum f. sp. vasinfectum (FOV) is one of the most destructive diseases in cotton (Gossypium spp.) production, and use of resistant cultivars is the most cost-effective method managing the disease. To understand the genetic basis of cotton resistance to FOV race 7 (FOV7), this study evaluated a recombinant inbred line (RIL) population of 110 lines of G. barbadense from a cross between susceptible Xinhai 14 and resistant 06-146 in eight tests and constructed a high-density genetic linkage map with resequencing-based 933,845 single-nucleotide polymorphism (SNP) markers covering a total genetic distance of 2483.17 cM. Nine quantitative trait loci (QTLs) for FOV7 resistance were identified, including qFOV7-D03-1 on chromosome D03 in two tests. Through a comparative analysis of gene expression and DNA sequence for predicted genes within the QTL region between the two parents and selected lines inoculated with FOV7, GB_D03G0217 encoding for a calmodulin (CaM)-like (CML) protein was identified as a candidate gene. A further analysis confirmed that the expression of GB_D03G0217 was suppressed, leading to increased disease severity in plants of the resistant parent with virus induced gene silencing (VIGS).
Introduction
Cotton (Gossypium spp.) is the most important fiber crop for the textile industry in the world. In addition, it is also an important source of feed, food and biofuel components (Fang and Percy, 2015). G. hirsutum (Upland cotton) is a tetraploid cotton species and is grown in more than 80 countries, producing 97% of world cotton due to its high yield and wide adaptation. Its closed related another tetraploid G. barbadense (extra-long staple, Egyptian, Pima or Sea-Island cotton) is grown for high quality fibers with long, strong and fine parameters (Zhang et al., 2014). However, due to its low yield potentials and requirements for warm and dry weathers, G. barbadense is only grown in limited production areas in about a dozen of countries including China, India, Uzbekistan, Tajikistan, Turkmenistan, Spain, Egypt, Israel, Sudan, Peru, and the United States1. China ranks the third after the United States and India in production of the extra-long staple G. barbadense, which is grown in the Xinjiang Autonomous Region, a Northwest province.
There are various limiting factors that threaten cotton production (Hillock, 1992). Fusarium wilt (FW), caused by the fungus Fusarium oxysporum f. sp. vasinfectum (FOV), is one of the most serious diseases of cotton (Zhang et al., 2015; Sanogo and Zhang, 2016; Bell et al., 2019). FOV is a soil-borne plant fungal pathogen that causes Fusarium wilt through root infection in many plant species, including important economic crops such as cotton, cabbage, banana, watermelon and tomato (De Cal et al., 2000; Galindo and Deyholos, 2016; Xing et al., 2016; Dale et al., 2017; Li et al., 2017; Rana et al., 2017; Upasani et al., 2017). This pathogen exists in the soil and crop residues in the form of mycelia, chlamydia or small sclerotia and can survive in the soil for 5–10 years before causing infection (Galindo and Deyholos, 2016). FW usually develops after the seedling stage, and its visual symptoms include leaf chlorosis and necrosis, wilting, vascular tissue discoloration, and ultimately plant death (Ma and Zhang, 1986). In cotton, 8 nominal races have been reported based on pathogenicity tests using a set of differential plant hosts, including races 1 and 2 in the United States and Tanzania, race 3 in Egypt, Sudan and Israel, race 4 in India and the United States (Kim et al., 2005; Halpern et al., 2019; Zhu et al., 2020), race 5 in Sudan, race 6 in Brazil and Paraguay, and races 7 and 8 in China (Davis et al., 2006). However, races 3 and 5, as well as races 4 and 7 were later found to be indistinguishable between one another based on DNA, genetic and morphological analyses (Davis et al., 2006; Bell et al., 2019; Halpern et al., 2020; Zhu et al., 2021). Although both races 7 and 8 were reported in China, race 7 is more widespread and more virulent than race 8 which is limited in a very narrow area. Among different strategies managing FOV in cotton production, breeding and employment of resistant cultivars has been the only cost-effective method (Zhang et al., 2015; Sanogo and Zhang, 2016).
Most G. barbadense cultivars and accessions in Chinese cotton germplasm collection are susceptible or highly susceptible to FOV7 (Zhang et al., 2015). Zhu et al. (2010) mapped a single dominant resistance gene on chromosome D11 (c21) in early segregating populations from a G. barbadense cross of susceptible Xinhai 21 × highly resistant HK 237 based on simple sequence repeat (SSR) markers. However, no follow-up validation was reported. In the United States, a major dominant resistant gene (FOV1) to race 1 on chromosome D07 (c16) was identified and mapped in Pima S-7 (G. barbadense) using SSR markers (Wang and Roberts, 2006; Ulloa et al., 2011). Another major resistance gene (FOV4) conferring resistance to race 4 was identified in resistant Pima S-6 and mapped to chromosome D02 (c14), based on also SSR markers (Ulloa et al., 2013).
In China, genetic studies and breeding for FOV7 resistance has mainly been focused on Upland cotton since the 1950s, when two highly resistant lines- Chuan 52–128 and Chuan 57–681 were developed through repeated selections in FOV7-infested fields from highly susceptible Delfos 531 and Deltapine 15, respectively (Zhang et al., 2015). These two resistant Upland cotton lines have become the donors for numerous resistant commercial cultivars developed in the 1960s and onward. Through quantitative and qualitative (Mendelian) genetic analyses (Feng et al., 1998), the two sources of resistance were found to carry two different resistance genes (FW1 and FW2). In a subsequent SSR-based marker analysis, a dominant resistance gene (FWR), presumably one of the two major resistance genes (FW1 and FW2), was mapped to chromosome D03 (c17), using two F2:3 populations (Wang et al., 2009). Most recently, through a genome-wide association study (GWAS) on 290 Chinese Upland accessions followed with a CRISPR/Cas9-mediated knockout, Gh_D03G0209 (named GhGLR4.8) on D03 encoding a GLUTAMATE RECEPTOR-LIKE (GLR) protein was identified as the candidate gene for the resistance gene Fov7 (Liu et al., 2021). Fov7 is presumably one of the two major resistance genes identified and named earlier by Feng et al. (1998). However, whether there exist the same resistance genes conferring resistance to FOV7 in G. barbadense is currently unknown.
Because cotton responses to FOV infections can be quantitatively measured through a rating system based on visual disease severity (Sanogo and Zhang, 2016), genetic studies on FOV resistance in cotton have been often performed using quantitative genetic approaches such as diallel analysis and generation mean analysis (for a review, see Zhang et al., 2015). With the advent of molecular markers, quantitative trait locus (QTL) mapping has been used to locate QTLs for FOV resistance on chromosomes, resulting in reporting of numerous QTLs associated with FOV resistance (Said et al., 2013, 2015a,2015b; Zhang et al., 2015; Abdelraheem et al., 2017). However, QTL mapping for FOV resistance using linkage analysis and GWAS has been almost exclusively focused on Upland cotton. There have been a few reports using SSRs in genomic studies of G. barbadense (Abdelraheem et al., 2013, 2015, 2020; Wang et al., 2013), and no high density linkage map has been published for G. barbadense because a low level of polymorphisms in SSR markers within the species.
The genomes of 3–79, Hai 7124 and Xinhai 21 of G. barbadense have been recently sequenced with updates in China (Hu et al., 2019; Wang et al., 2019), providing important genomic resources for studying the genetics and genomics of this important cultivated cotton species in order to accelerate breeding using marker-assisted selection (MAS) or genomic selection (GS). However, the major QTLs for FOV7 in G. barbadense are currently not well understood. To identify QTLs and discover candidate genes related to FOV7 resistance in G. barbadense, our study took advantage of the genome sequence information of G. barbadense to construct the first high-quality, high-density genetic linkage map in G. barbadense based on genome resequencing of 110 recombinant inbred lines (RILs) from a cross of FOV7-susceptible Xinhai 14 and FOV7-resistant 06-146. The map was used to identify FOV7 resistance QTLs. A stable QTL on chromosome D03 was identified, and genes within the QTL region were further evaluated through RNA-seq of the two parents and quantitative RT-PCR (qRT-PCR) analysis of selected RILs. A candidate gene was validated through virus-induced gene silencing (VIGS). This study combined genome resequencing and RNA-seq in a RIL population, providing new knowledge for understanding the genetic and genomic basis of resistance to FOV7 in G. barbadense.
Materials and Methods
Plant Materials
A single-seeded descent method was used to advance F2 plants from a cross between the FOV7-susceptible G. barbadense cultivar Xinhai 14 and the FOV7-resistant 06-146. As a result, 110 F2:7 RILs were produced and used in this study.
Evaluation for FOV7 Resistance and Data Analysis
The two parents and 110 RIL lines were grown in eight tests including seven field tests and one laboratory test between 2011 and 2018. In 2011–2012, four field tests were first conducted including two field tests each year at Experimental Base, Xinjiang Academy of Agricultural Sciences, Alar, Xinjiang, and Experimental Farm, Xinjiang Korla Academy of Agricultural Sciences, Alar, Xinjiang. This was followed by three field tests in 2016–2018 each year at the same site of Alar. Single-row plots were used with the plot length of 3 m, the row spacing of 0.35 m, and the plant spacing of 0.10 m. For each of the above seven field tests, a randomized complete block design (RCBD) with three replications was used to arrange all the experimental units (i.e., the two parents and 110 RILs). Seeds were hand planted in mid-April each year, and crop management practices followed local recommendations.
In 2017, a laboratory test using artificial inoculation was performed using the same RCBD with three replications on campus of Xinjiang Agricultural University, Urumqi, Xinjiang. Seeds were sown to pots filled with a mixture of vermiculite and sterilized farm soil (in a ratio of 1:2) in a manner of 10 holes per pot with two seed per hole on May 3rd,2017. The daily temperature in the laboratory ranged between 25.0 and 28.0°C, with supplementary lights provided. At the cotyledon stage, plants were artificially inoculated with 50 ml of FOV7 inoculum (with the concentration of 1 × 10⁶ conidia ml–1) via the root-wounding method (Pei et al., 2019). Non-inoculated pots for the RILs were used as control. FOV7-caused disease symptoms were first observed at the 2-leaf stage.
In all the evaluations for FOV7 resistance, a rating scale of 0 to 4 based on foliar disease severity was used to evaluate each plant, as the following: 0 = healthy, with no disease symptoms; 1 = 25.0% of the leaf area exhibited disease symptoms; 2 = 25.1–50.0% of the leaf area exhibited disease symptoms or plants were slightly dwarfed in stature; 3 = 50.1–75.0% of the leaf area exhibited disease symptoms or plants severely dwarfed in stature; and 4 = > 75.0% of the leaf area exhibited disease symptoms or plants completely defoliated or died (Sanogo and Zhang, 2016). For the seven field tests, evaluation for FOV7 resistance was conducted during flowering or boll development stage (i.e., mid-July to early October) each year. For the laboratory test, screening was completed on May 23th, 2018, i.e., 20 days after inoculation FOV7 (Supplementary Table 1).
The average disease severity rate (DSR), i.e., the sum of DSRs divided by the number of plants, was calculated among the replicates of each line. The describe function in the Hmisc package of R was used to perform a descriptive statistical analysis of the RIL population. Analysis of variance and generalized heritability determination in the parents and RILs were performed in R. If the F test was significant, then a multiple comparison least significant difference (LSD) test (with P < 0.05 indicating significance) was used (Li et al., 2016).
DNA Library Preparation and Resequencing
In July 2017, young leaves of the two parents and 110 RILs were collected and stored at −70°C. Using a miniprep method (Zhang and Stewart, 2000), genomic DNA for each line was extracted and cleaned. The sequencing library was constructed based on the follow steps: the quantified DNA samples were randomly sheared by ultrasonic disruption, and DNA fragments were repaired with an addition of A at the 3′ end. Followed by addition of sequencing adapters, the ligated DNA fragments were purified and amplified by PCR using primers designed from the adaptors. Finally, the library for each line was sequenced using the Illumina sequencing platform.
Single-Nucleotide Polymorphism (SNP) Identification of Sequencing Data
The raw sequence reads obtained by sequencing were filtered to obtain clean reads, by removal of adapter sequences and low quality reads with N bases greater than 10%. The clean paired-end resequencing reads were mapped to the reference genome of G. barbadense Hai 7124 (Hu et al., 2019) using the Burrows–Wheeler Alignment (BWA) software (Li and Durbin, 2009). After duplicate reads were removed by the Picard’s Mark Duplicate tool, the GATK software was used to identify SNPs and Indels (Simona et al., 2017).
Construction of a High Density Genetic Map
The linkage map of the RIL population was constructed using HighMap software (Liu et al., 2014). SMOOTH was used to correct errors based on parental genotype contributions, and the k-nearest neighbor algorithm was used to correct incorrect genotypes (Hans et al., 2005). Map distance was calculated using the Kosambi mapping function. The chi-square test was used to identify SNPs deviated from the expected 1:1 ratio for SNPs in the RIL population. Polymorphic SNPs with significant segregation distortion (P < 0.01) were removed from linkage analysis.
The SNP markers in the linkage map were further aligned to the reference genome using the local BLAST method. The parental markers with a sequencing depth of 10 × or higher were used to select SNPs in the RIL population, and a marker that was not mapped on a chromosome in the parents was removed. Among the resulted 933,845 SNPs, a moving window of 15 SNPs with 11 or more SNPs of parental type aa or bb was considered homozygous aa or bb type. Otherwise, it was deemed an ab type. When there was a SNP typing change along a chromosome in any line, a recombination breakpoint occurred. SNPs between recombination breakpoints were classified into recombination bins. A recombination bin was defined as a chromosomal segment with no genetic recombination. Finally, a representative SNP within each bin was used to construct a genetic map. Bins within a less than 10 kb region were combined.
Quantitative Trait Locus Mapping
The mean phenotypic DSR values for RILs in 8 tests were used for QTL mapping with the R-3.6.2 software package “qtl.” A composite interval mapping method was employed to locate QTLs for FOV7 resistance (Karl and Saunak, 2009). A stringent LOD threshold was calculated through a permutation test. The parameters for QTL mapping procedure were set as follows: calculation time of 1,000 times, Type I error P value at 0.05, PIN (probability level of entering the model) at 0.001, and mapping step length of 1.0 cM. If QTLs identified in two or more tests with confidence intervals (CI, 95%) overlapped, they were considered the same and stable QTL. The CI for each QTL was set as the location distance interval corresponding to a one LOD drop from both sides of the peak.
Identification of Candidate Genes Through RNA-Seq and Quantitative RT-PCR
To identify potential candidate genes, BLAST was used to extract gene sequences within stable QTL regions based on the reference genome (Hu et al., 2019), and predicted genes in the associated regions were compared with these in different genome databases- the GO and KEGG (Du et al., 2020). To analyze the general expression pattern of the candidate genes, the transcriptome (i.e., RNA-seq) from the two parents (Xinhai14 and 06-146) and selected highly resistant (HR) and highly susceptible (HS) RILs were performed on a cDNA library constructed using 10 μg of total RNA extracted from each biological sample of each genotype (Yao et al., 2019). Briefly, seeds for these lines were grown in pots and inoculated with FOV7 conidia, as described earlier. The roots, stems and young leaf tissues for each genotype were collected at 0, 4, 8, 12, 24, and 48 h post-inoculation. Three biological samples for each line were separately harvested for RNA extraction. A total RNA extraction kit (Tiangen, China) was used to extract RNA from the biological samples. Poly-adenylated RNA was purified and concentrated with oligo (dT)-conjugated magnetic beads (Invitrogen, Shanghai, China) and then iron fragmented at 95°C, followed by end repair and 5′ adaptor ligation. Reverse transcription was then performed with RT primers harboring 3′ adaptor sequences and randomized hexamers. After cDNA was purified and amplified, 200–500 bp PCR products were purified, quantified, and stored at −80°C until sequencing. cDNA clusters were generated and sequenced using an Illumina HiSeq2000 platform following the manufacturer’s instructions. Based on the SNPs and Indels information of the parents, we compared the genes with different expressions.
Based on the cDNA sequences for the candidate genes, Primer 5.0 software was used to design primers in a specific region at the 5′ end or 3′ end of a gene sequence for quantitative RT-PCR (qRT-PCR) analysis (Supplementary Table 2). For reverse transcription, 5 × All-In-One Mastermix (Abm, Canada) was used on root RNA. The resulting cDNA was used as a template for quantifying the expression of candidate genes by qRT-PCR on each biological sample with three technical replicates, and the internal reference gene used was GbUBQ7. Real-time PCR amplification was performed on an ABI 7500 Fast system. A BrightGreen 2 × qPCR Mastermix kit (Abm, Canada) was used according to the provider’s instructions. In a total amplification volume of 20 μL, the PCR reaction program was as follows: predenaturation at 94°C for 30 s, followed by 40 cycles of denaturation at 95°C for 5 s, annealing at 57°C for 5 s, and extension at 72°C for 34 s. The results were used for relative quantitative analysis via the 2–ΔΔCt method (Tanino et al., 2017).
Virus Induced Gene Silencing Analysis of GbCML in Cotton
Tobacco rattle virus (TRV)-based VIGS was performed in cotton as described previously (Liu and Page, 2008). The pTRV1, pTRV2, and pTRV2 derivatives harboring specific regions of GbCML were transformed into Agrobacterium tumefaciens strain GV3101 by electroporation. The primers used for GbCML fragment amplification are listed in Supplementary Table 2. Seven-day-old seedlings of the resistant parent 06-146 were transformed with a mixture of Agrobacterium cultures harboring pTRV1 with pTRV2, or its derivative plasmids. After the completion of inoculation, the 06-146 seedlings were washed with deionized water to remove excess agro-bacterial inoculum and grown at 25°C under a 16-h/8-h light/dark cycle in an environment-controlled growth chamber. After 2 weeks of cultivation, the plants were inoculated with FOV7 inoculum, as described earlier. The experiments were performed with at least 18 seedlings per treatment and were repeated three times. DSR was assessed for each seedling, as described earlier.
Results
Disease Severity Rate in Parents and Recombinant Inbred Lines
Across the eight tests, the DSR ranged 0–0.8 for 06-146 and 1.2–3.0 for Xinhai 14, and Xinhai 14 had a significantly higher (P < 0.01) DSR than 06-146 in each test (Table 1). For the RIL population, the DSR ranged from 0 to 3.2–3.4 in six tests and as high as 3.8–4 in two tests. There were RILs that had significantly higher DSR and were therefore more susceptible to FOV7 than the susceptible parent, indicating transgressive segregation toward susceptibility in the RIL population. However, results in skewness and kurtosis in each test showed that the DSR followed a normal distribution in the RIL population (Figure 1 and Table 1). An analysis of variance (ANOVA) showed that the broad heritability estimates (i.e., the percentage of the total phenotypic variance accounted by the genotypic variance) of FOV7 resistance as measured by DSR in this RIL population ranged between 82.93 and 89.58%, indicating that the FOV7 resistance was highly heritable in this RIL population (Supplementary Table 3). The two-way analysis of variance (ANOVA) revealed highly effects of genotypes, environment and genotype × environment interaction on DSR. Most importantly, genotype explained the most variance while the genotype × environment interaction was accounted for more than 27% of the variation in each of the DSR (Supplementary Table 3).
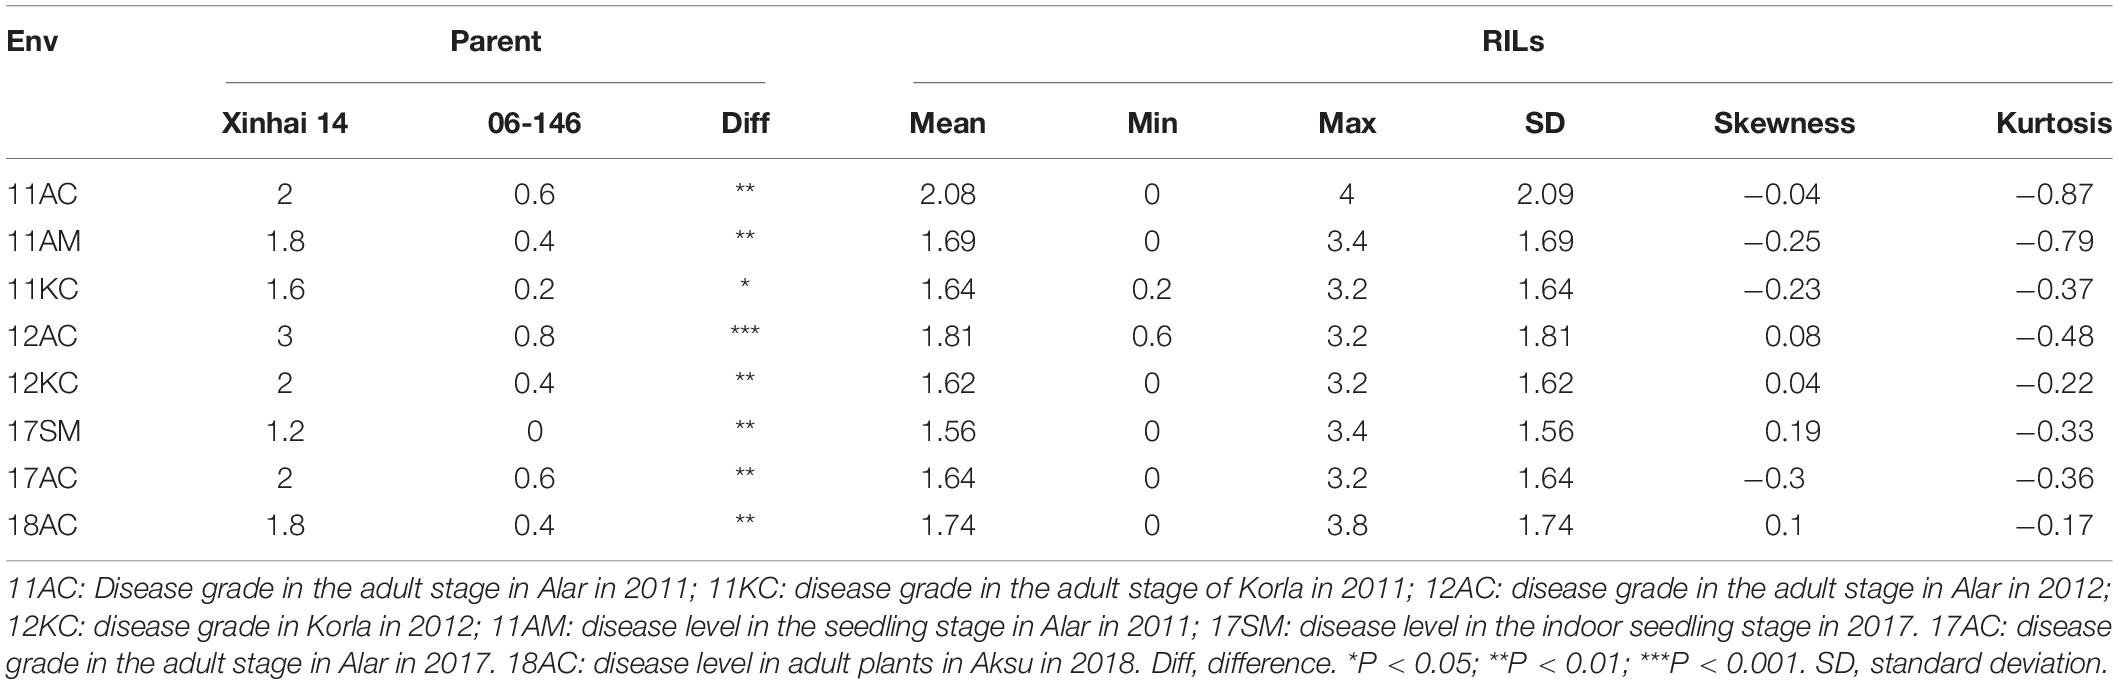
Table 1. Disease severity rating in Xinhai 14, 06-146 and their RIL population of 110 lines.
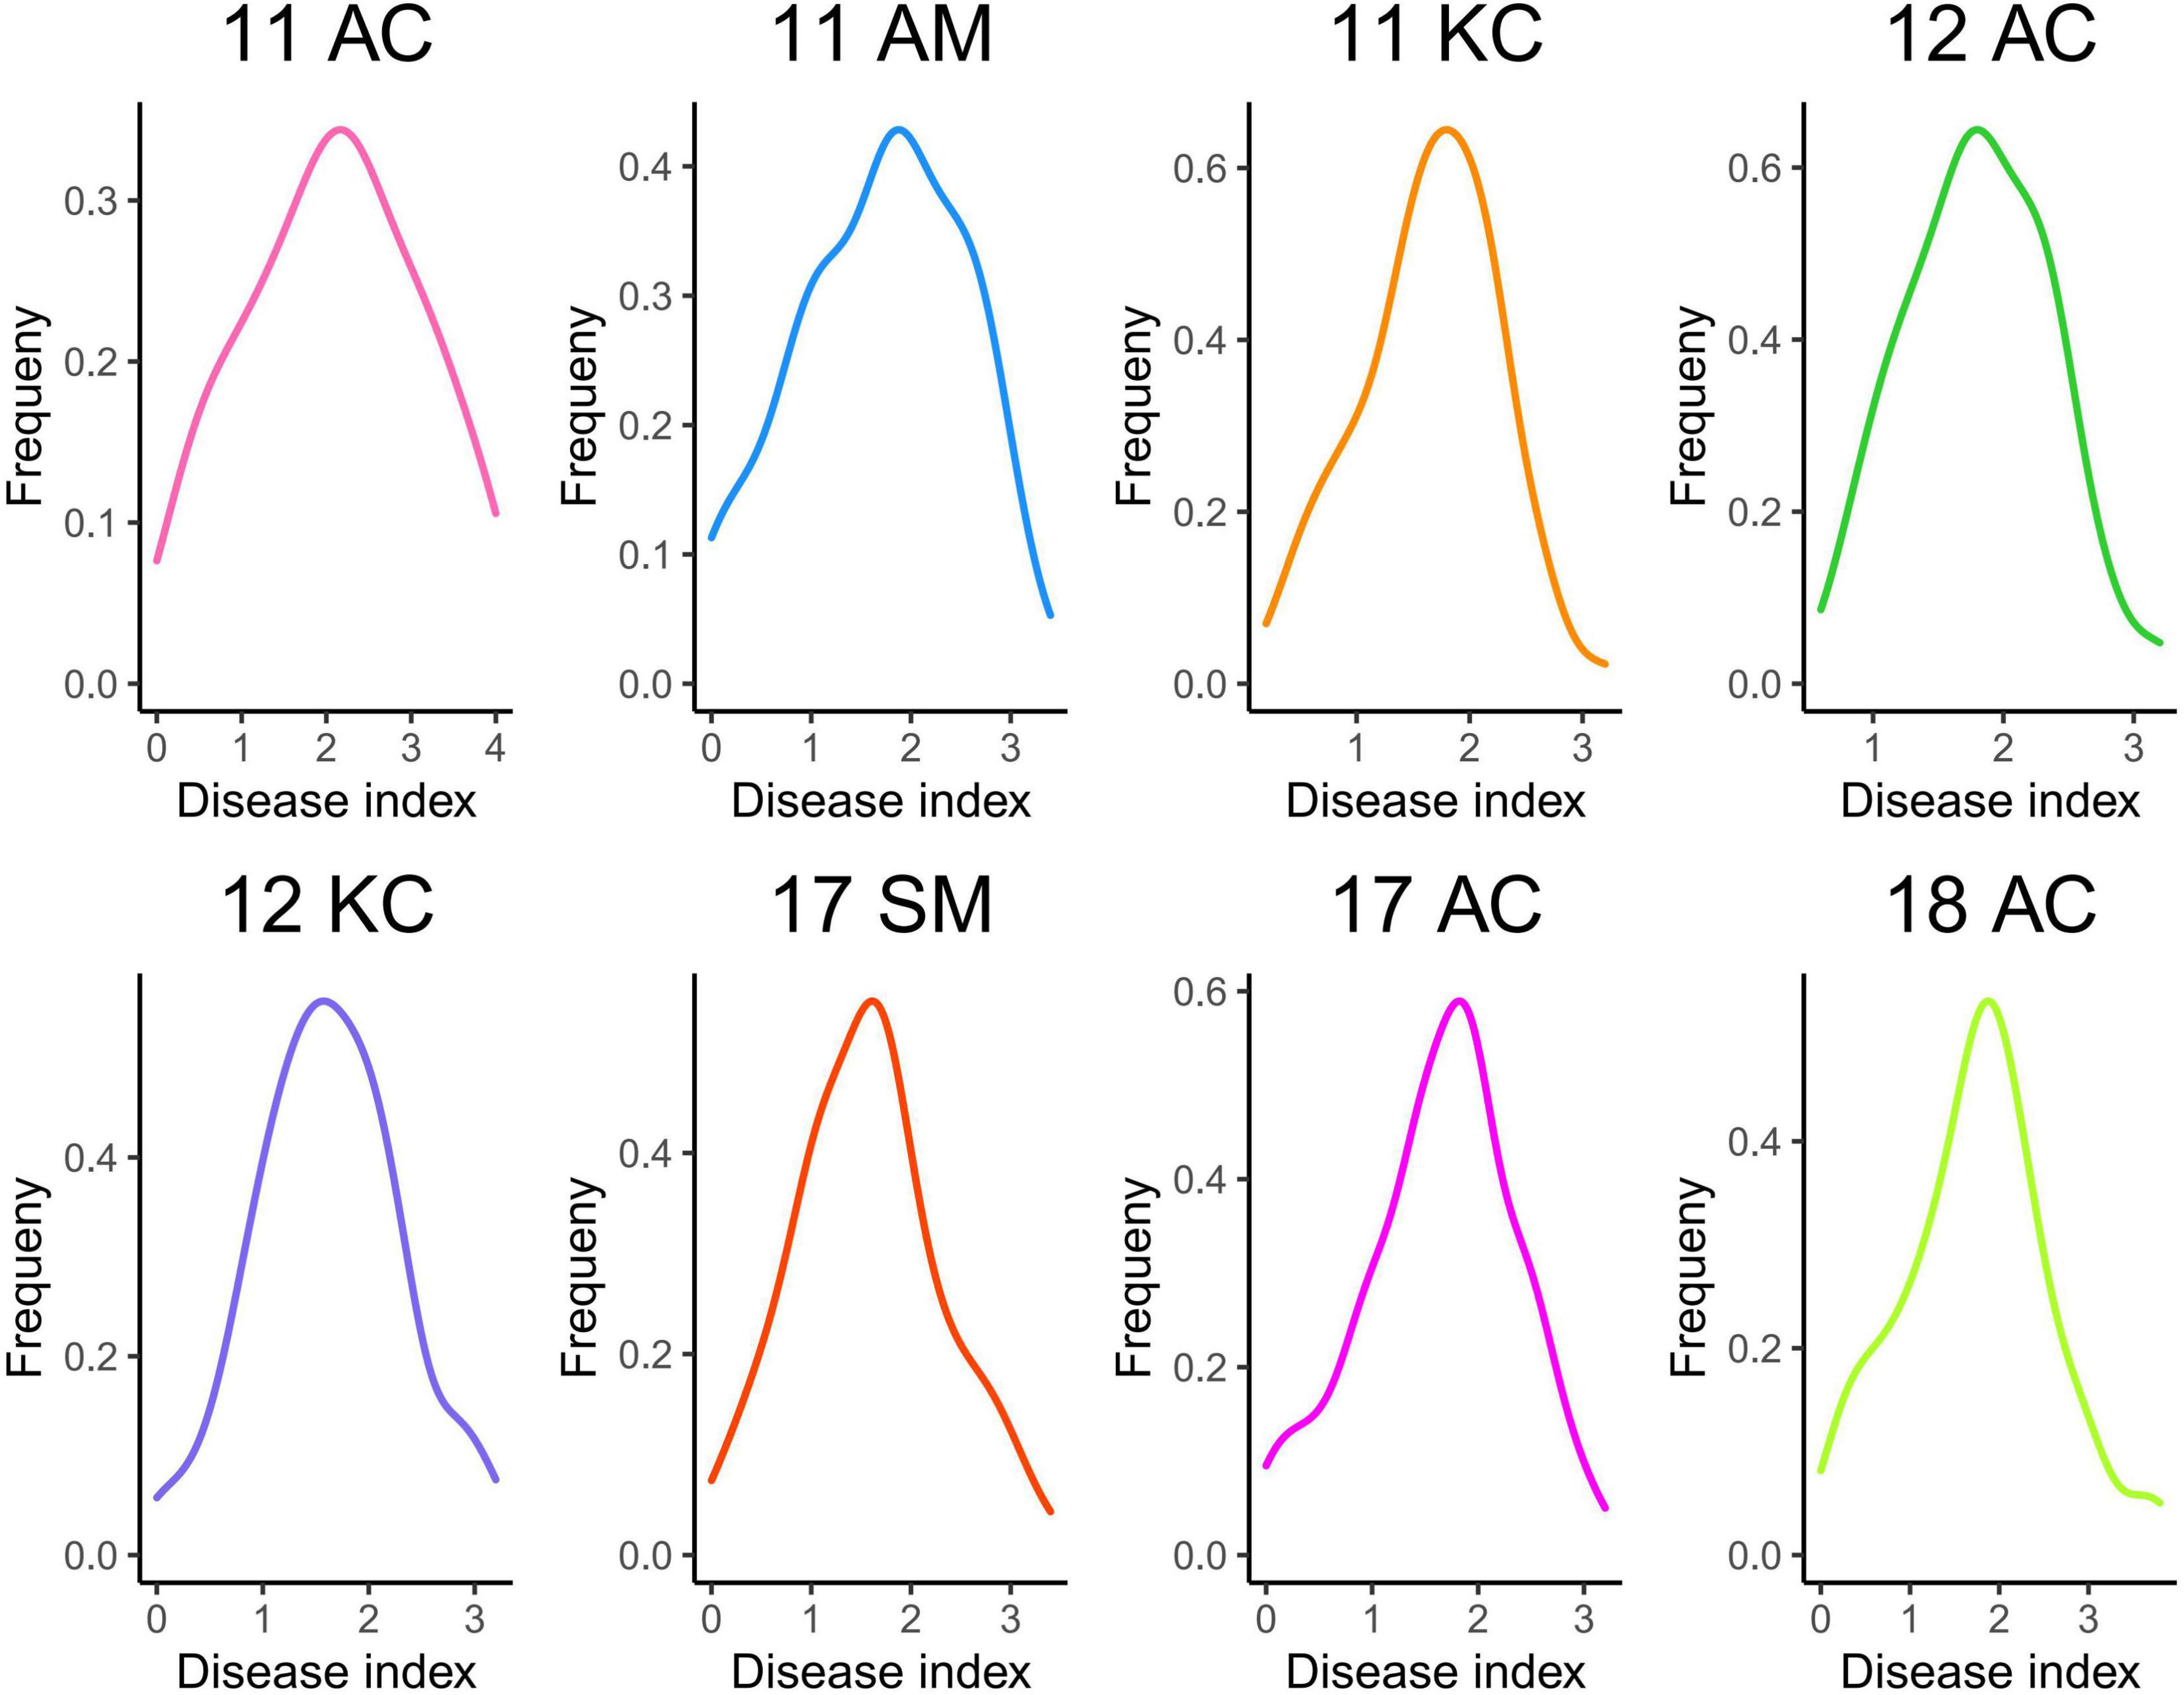
Figure 1. Frequency distribution of disease severity rating in 110 RILs tested in different environments.
The influence of genotype and environmental factors on plant traits has always been an obstacle in the process of breeding. Most traits are affected by both environmental and genetic factors. Understanding the mechanism of disease resistance is still a challenge in cotton breeding. Variance analysis of DSR in 8 environments showed that it was significantly affected by genotype, environment and genotype × environment interaction. Therefore, more attention should be given to changes in the planting environment to reduce the impact of environmental factors on cotton disease resistance in cotton production (Table 2). Because of the significant difference in DSR between the two parents and significant variation in DSR within the RIL population, further QTL mapping of FOV7 resistance is warranted. Because of the significant difference between the two parents and significant variation within the RIL population in DSR, further QTL mapping for FOV7 resistance was warranted.
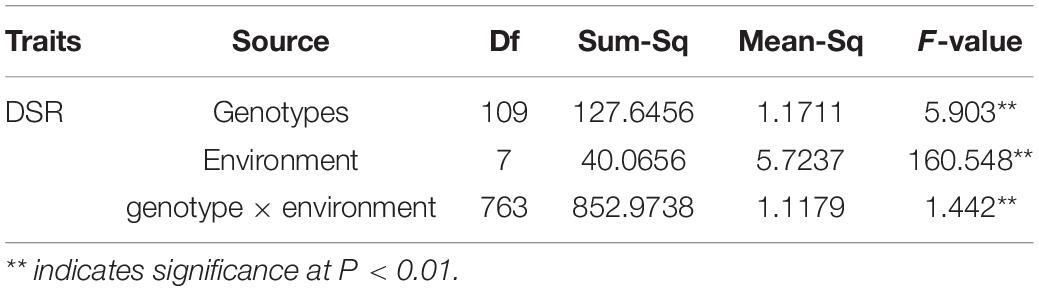
Table 2. ANOVA for DSR traits across multiple environments.
Statistics of DNA Resequencing Data
The sequencing depth for Xinhai 14 and 06-146 was 13 × (30.95 Gbp) and 16 × (38.06 Gbp), respectively, with an average sequencing depth for the parents of 14.5 × and 97% of the genome coverage for the reference genome Hai 7124. The average sequencing depth for the RILs was 7 × (with an average of 17.65 Gbp per RIL) with average genome coverage of 95% (Supplementary Table 4). The Q30 value exceeded 90%, and the GC content was greater than 34.72% (Supplementary Table 5).
Identification of Single-Nucleotide Polymorphisms Between the Two Parents and Construction of a High Density Linkage Genetic Bin Map
Using clean reads, a total of 933,845 SNPs were divided into 3,627 bins distributed on 26 chromosomes (Figure 2). The genetic map had a total genetic mapping distance of 2,483.17 cM (Table 3). The average number of bins in each chromosome was 138.5, with D13 having the fewest bins (53) and A06 the most bins (342). The average genetic distance for each chromosome was 95.51 cM, with D13 the shortest (41.17 cM) and A01 the longest (148.04 cM). The average genetic distance between two neighboring bins was 0.79 cM, and the largest gap between bins (19.3 cM) resided on A10 and D13. However, most of the gaps (96.71%) were less than 5 cM.
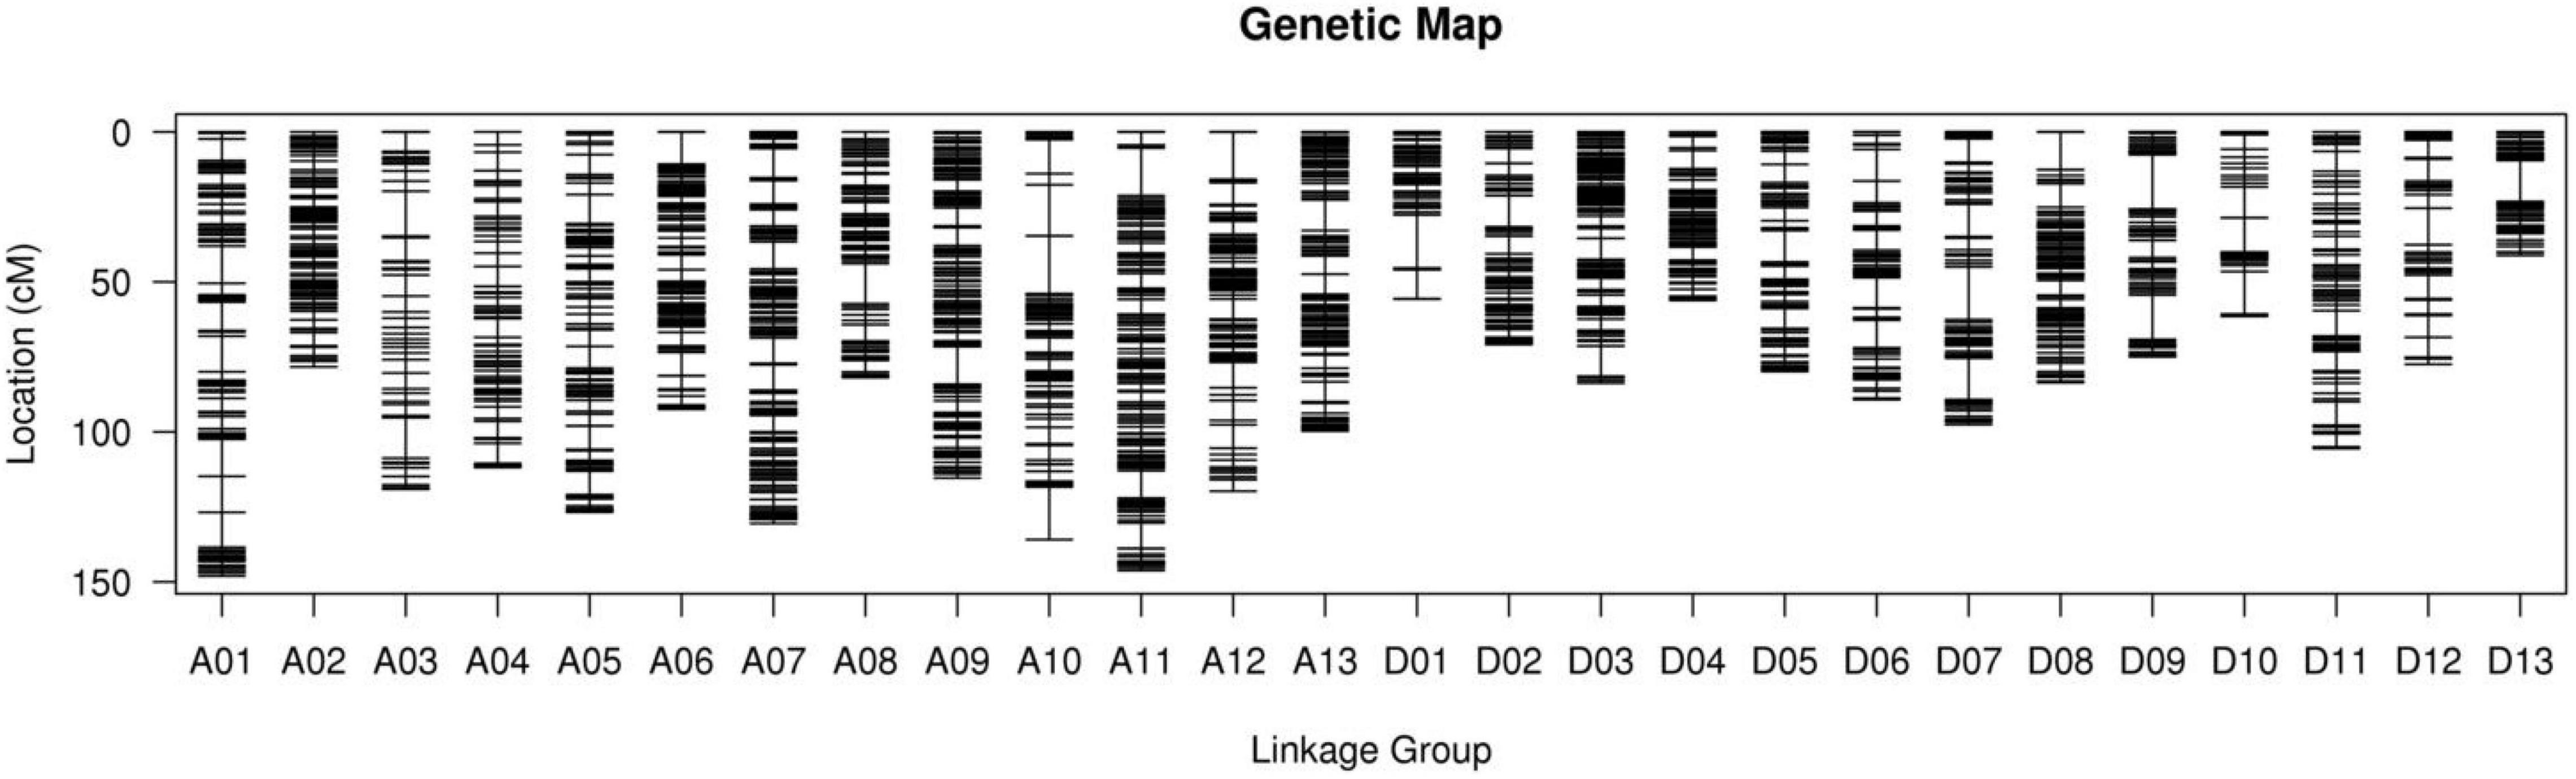
Figure 2. The distribution of SNP markers in the 26 linkage groups/chromosomes.
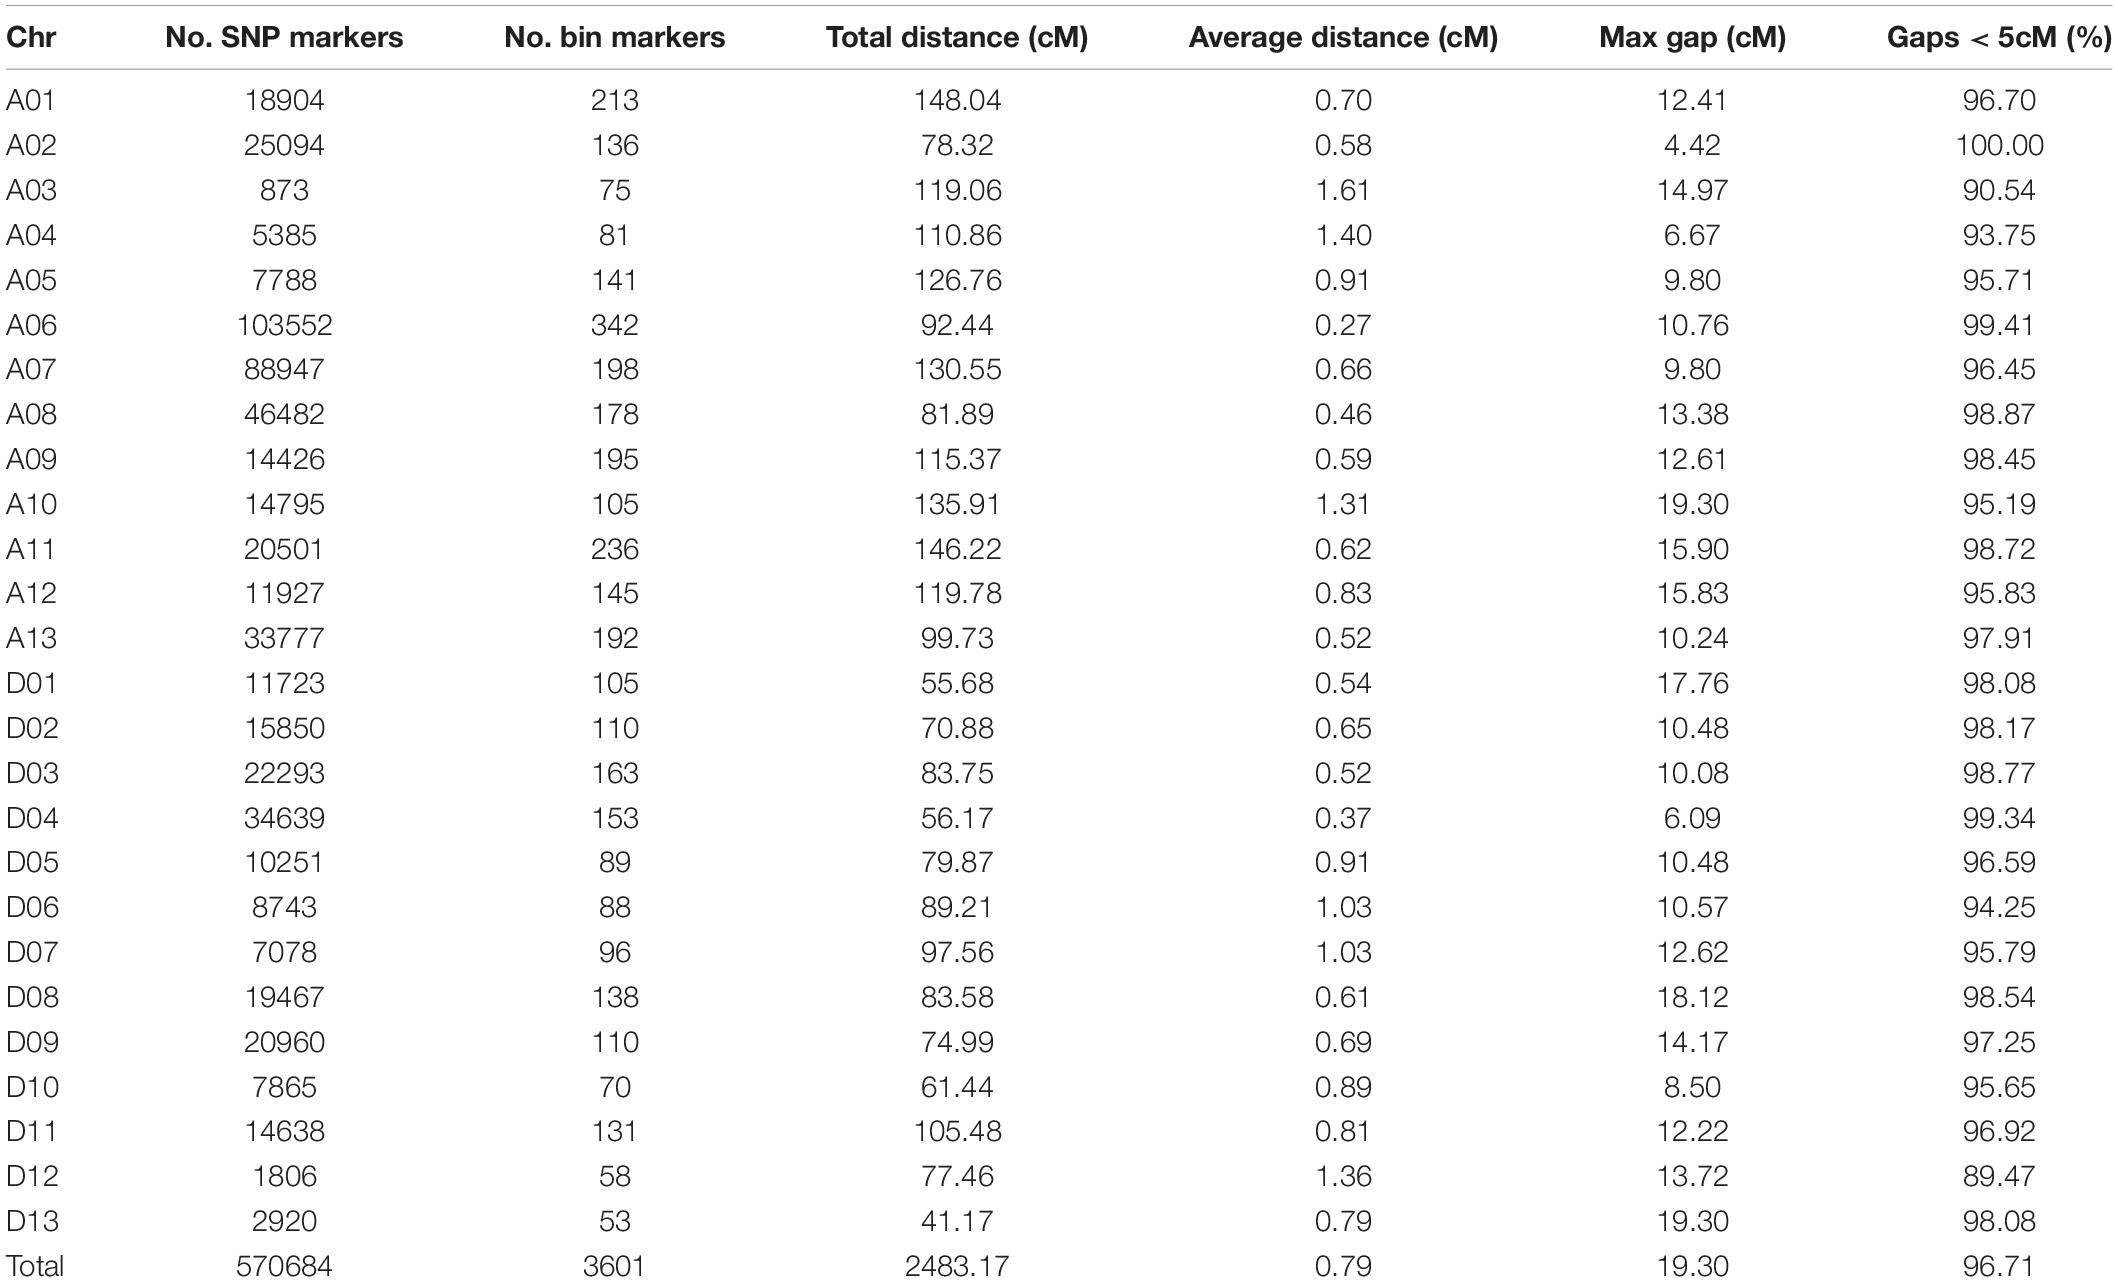
Table 3. Detailed information on the SNP markers in the genetic map.
Collinearity Analysis Between the Linkage Map and the Physical Map
A collinearity analysis was performed between the positions of the same SNPs on the reference genome in physical distance and the linkage map in genetic distance (Supplementary Figure 1). An overall high collinearity was observed. Except for chromosomes A12 and D05 with a Spearman correlation coefficient below 0.9, the correlation coefficient was higher than 0.9 for each chromosome including 0.99 for D13, with an average of 0.96 (Supplementary Table 6). These results showed that the order of most of the SNP markers in the linkage map was highly consistent with their sequence positions on the reference Hai 7124 genome, indicating that the quality of the linkage map was highly reliable.
Mapping of Quantitative Trait Locus for Resistance to FOV7
Nine QTLs for FOV7 resistance were detected on 7 chromosomes (A01, A05, A07, A09, D03, D05, and D09) (Table 4 and Figure 3), each of which (except for one) explained 3.5–19.7% of the phenotypic variation. Among the QTLs, 7 could be detected in only one environment, showing obvious environmental specificity and that the mode of action and expression of these QTLs changed greatly. QTLs detected in a single environment might be due to a low rate of phenotypic contribution, genetic effects, or environmental effects. Moreover, an unstable QTL can be considered promising for application if it has a strong effect. Nevertheless, such QTLs generally are not used.
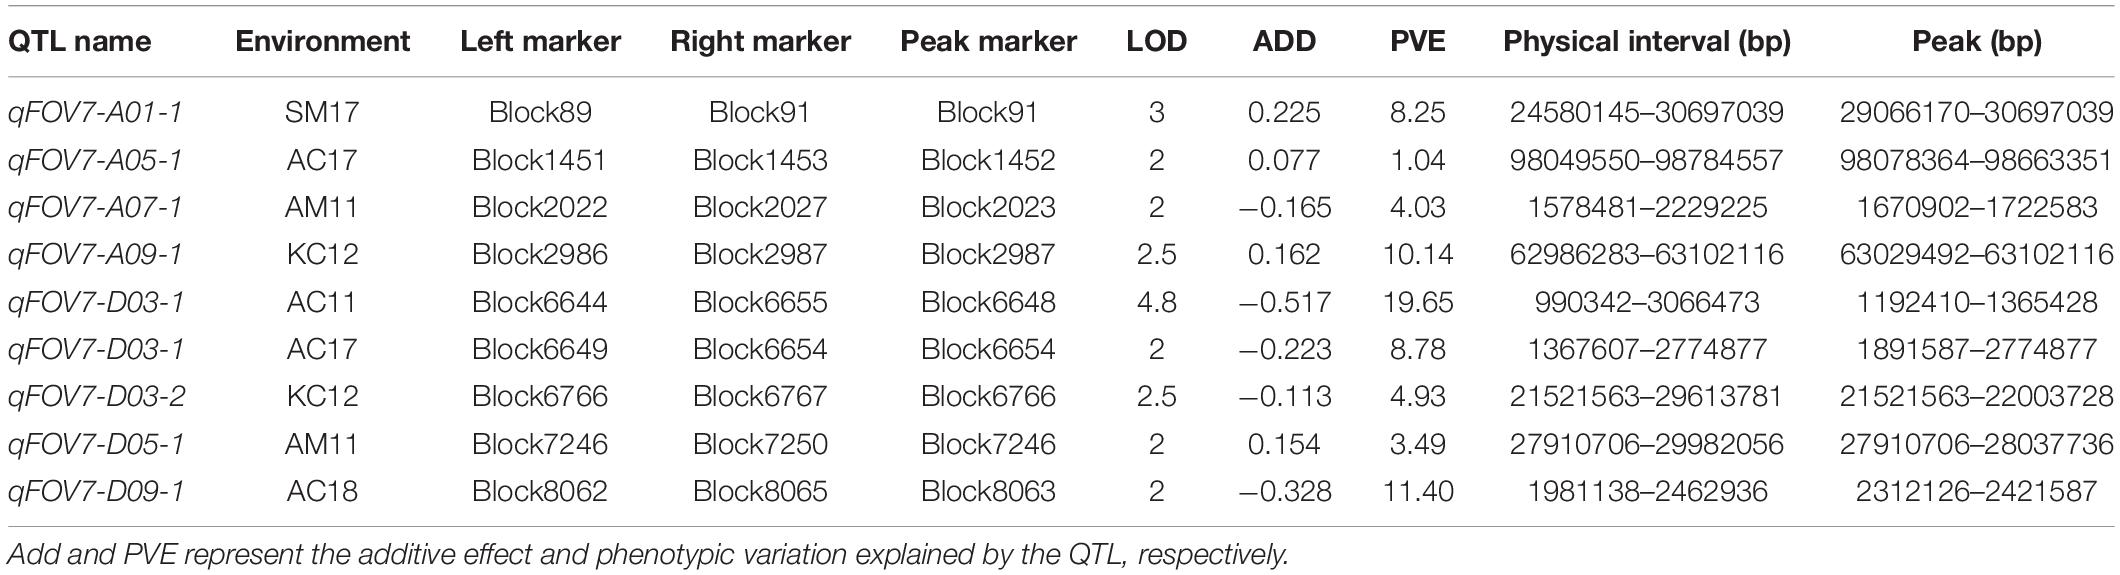
Table 4. Summary of FOV7 resistance QTLs identified in different environments.
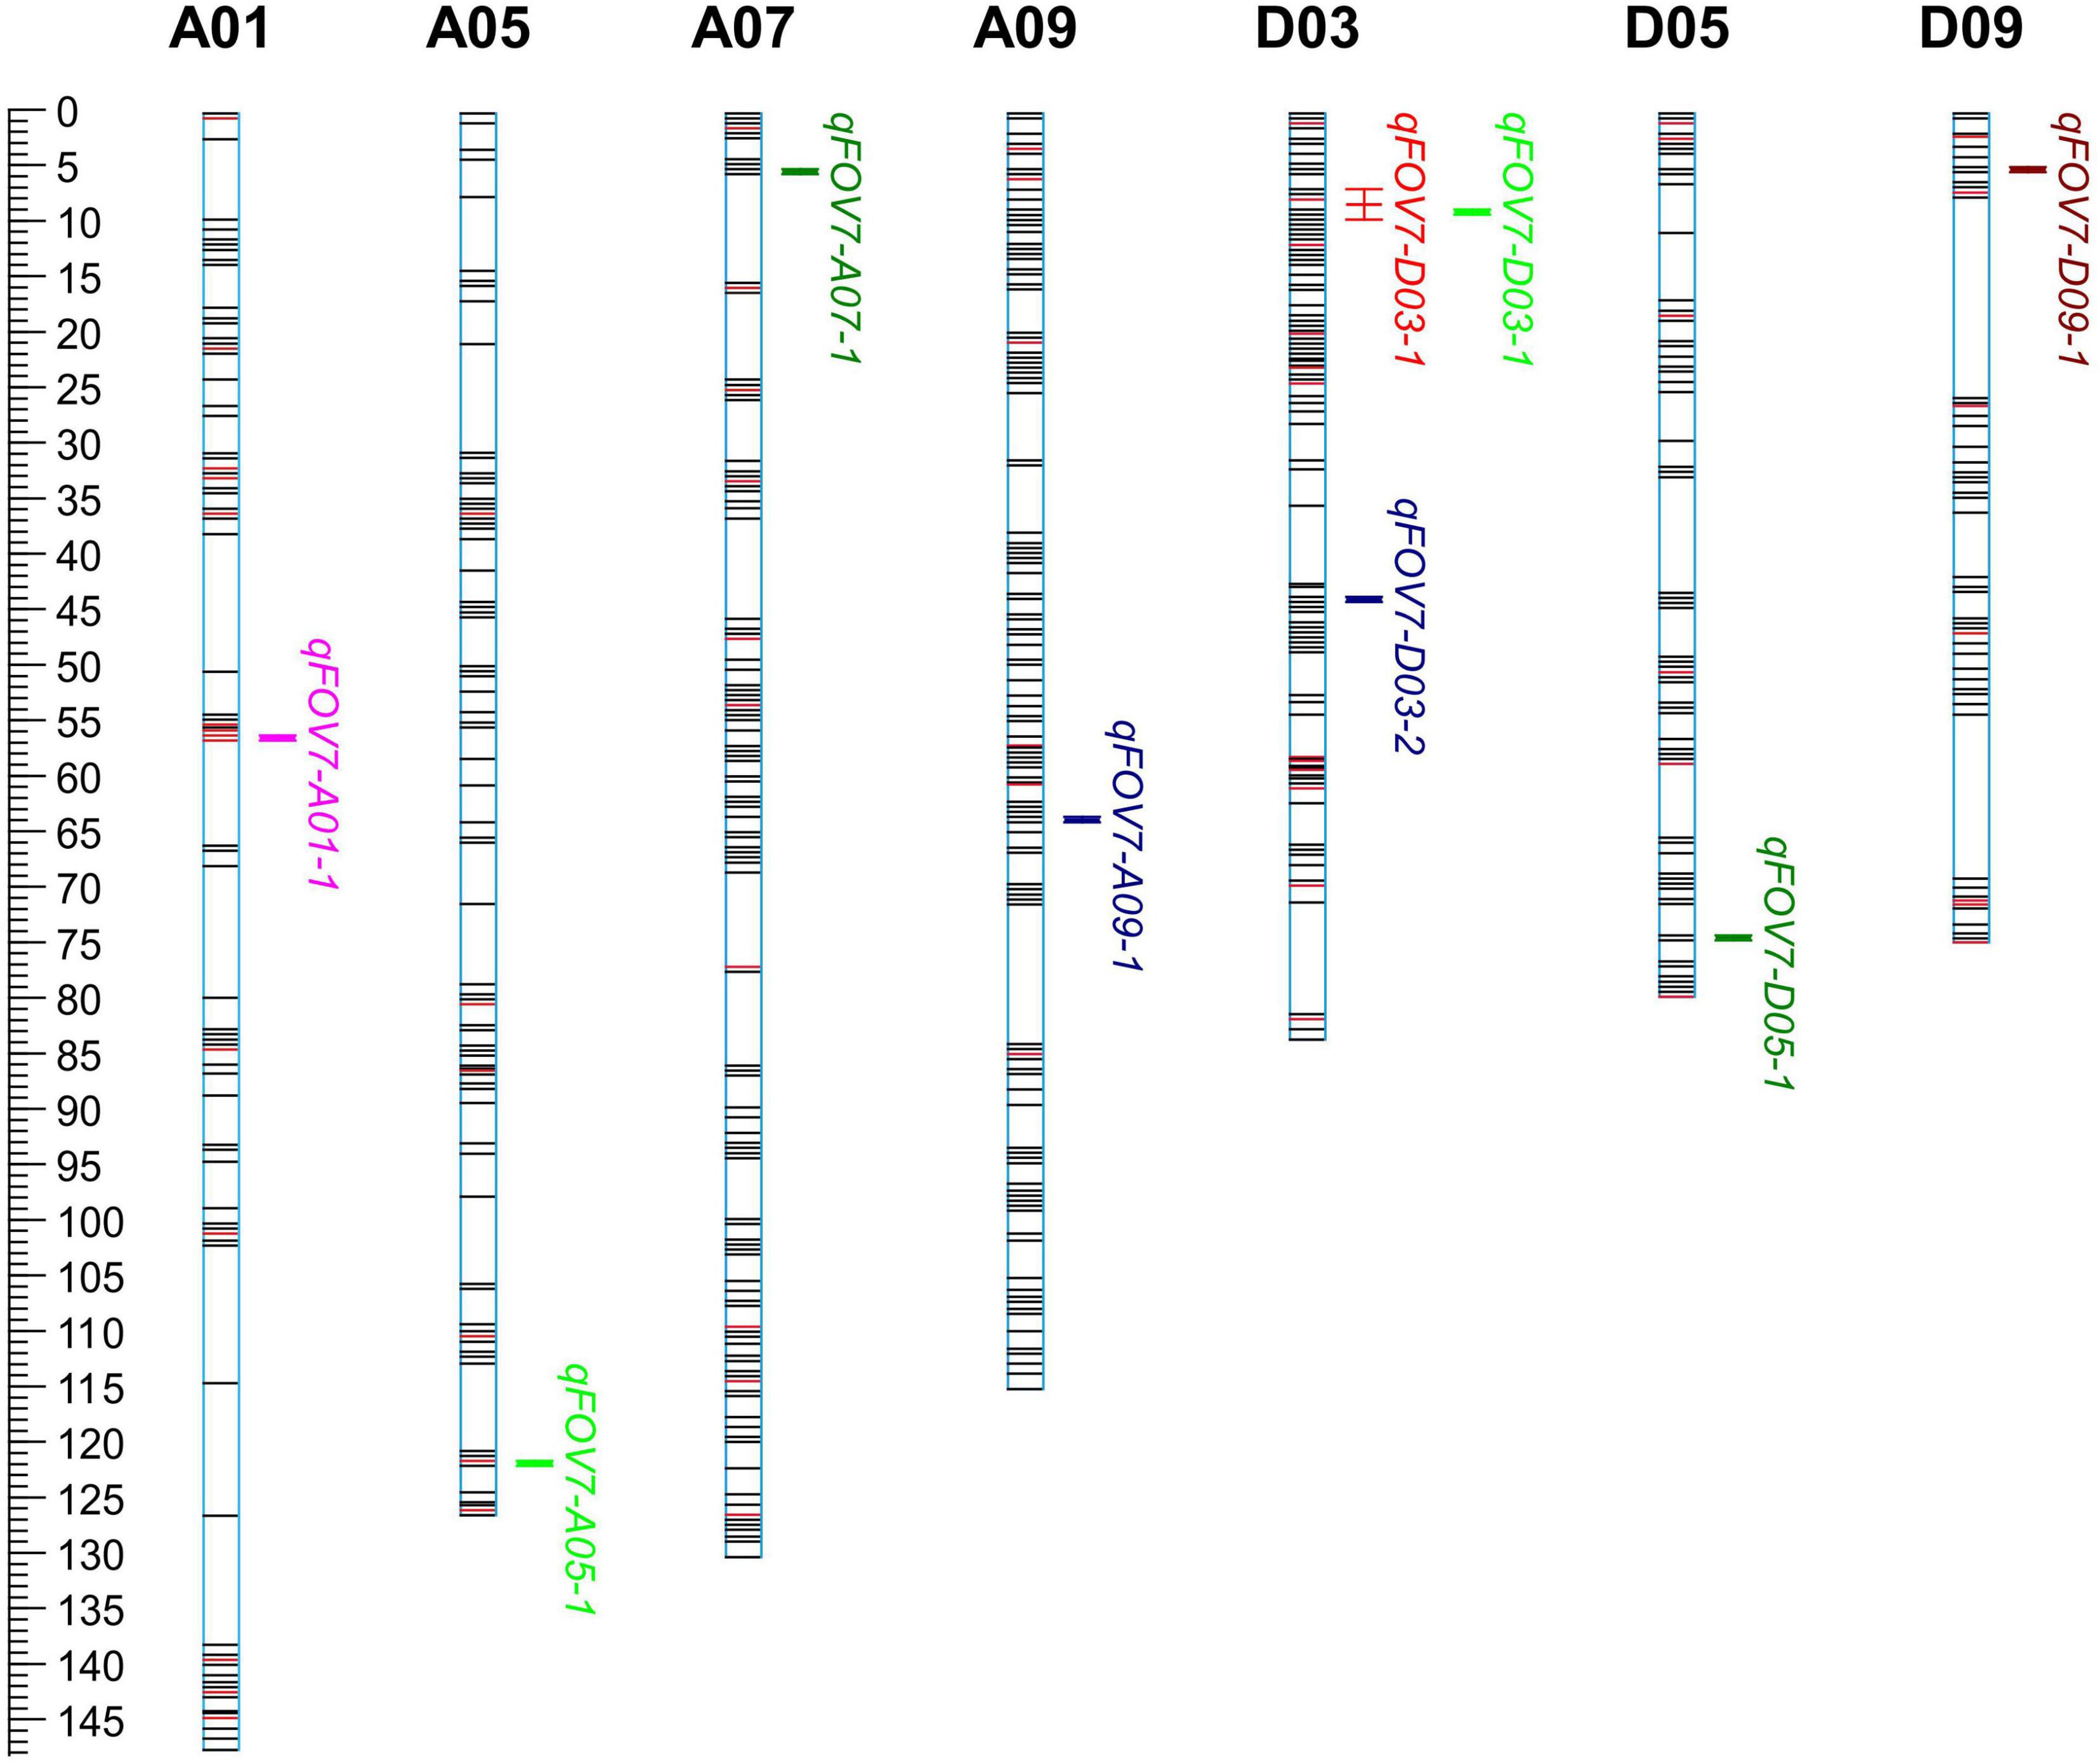
Figure 3. The chromosome distribution of QTLs for FOV7 resistance in a RIL population of Gossypium barbadense.
The widest range of phenotypic variation was observed in qFOV7-D03-1. A common QTL, qFOV7-D03-1, was identified on D03 in AC11 and AC17. A genome-wide association study (GWAS) showed that qFOV7-D03-1 was located on chromosome D03 chromosome and had a length of 1.97–2.37 Mb in G. hirsutum, consistent to the finding of Liu. This result strongly suggested that qFOV7-D03-1 is the main QTL for resistance to Fusarium wilt in G. barbadense. Therefore, qFOV7-D03-1 was considered to be a stably inherited QTL for follow-up studies related to FOV7 resistance.
Identification of Candidate Genes for qFOV7-D03-1
Within the qFOV7-D03-1 interval between 0.99 and 3.06 Mb on chromosome D03, 161 putative genes were predicted. Of these genes, 105 had annotation information (Supplementary Table 7). Through examining the transcriptome data of the parents and selected highly resistant (HR) and highly susceptible (HS) RILs within the RIL population, only six genes (GB_D03G0217, GB_D03G0235, GB_D03G0244, GB_D03G0268, GB_D03G0275, and GB_D03G0289) showed significant differential expression between the parents and between the HR and HS groups of RILs (Figure 4A and Supplementary Table 8). A comparison of the sequences between the two parents showed that upstream, downstream, exon, or intron regions in five genes (GB_D03G0217, GB_D03G0235, GB_D03G0244, GB_D03G0268, and GB_D03G0275) contained SNPs/Indels (Figure 4B).
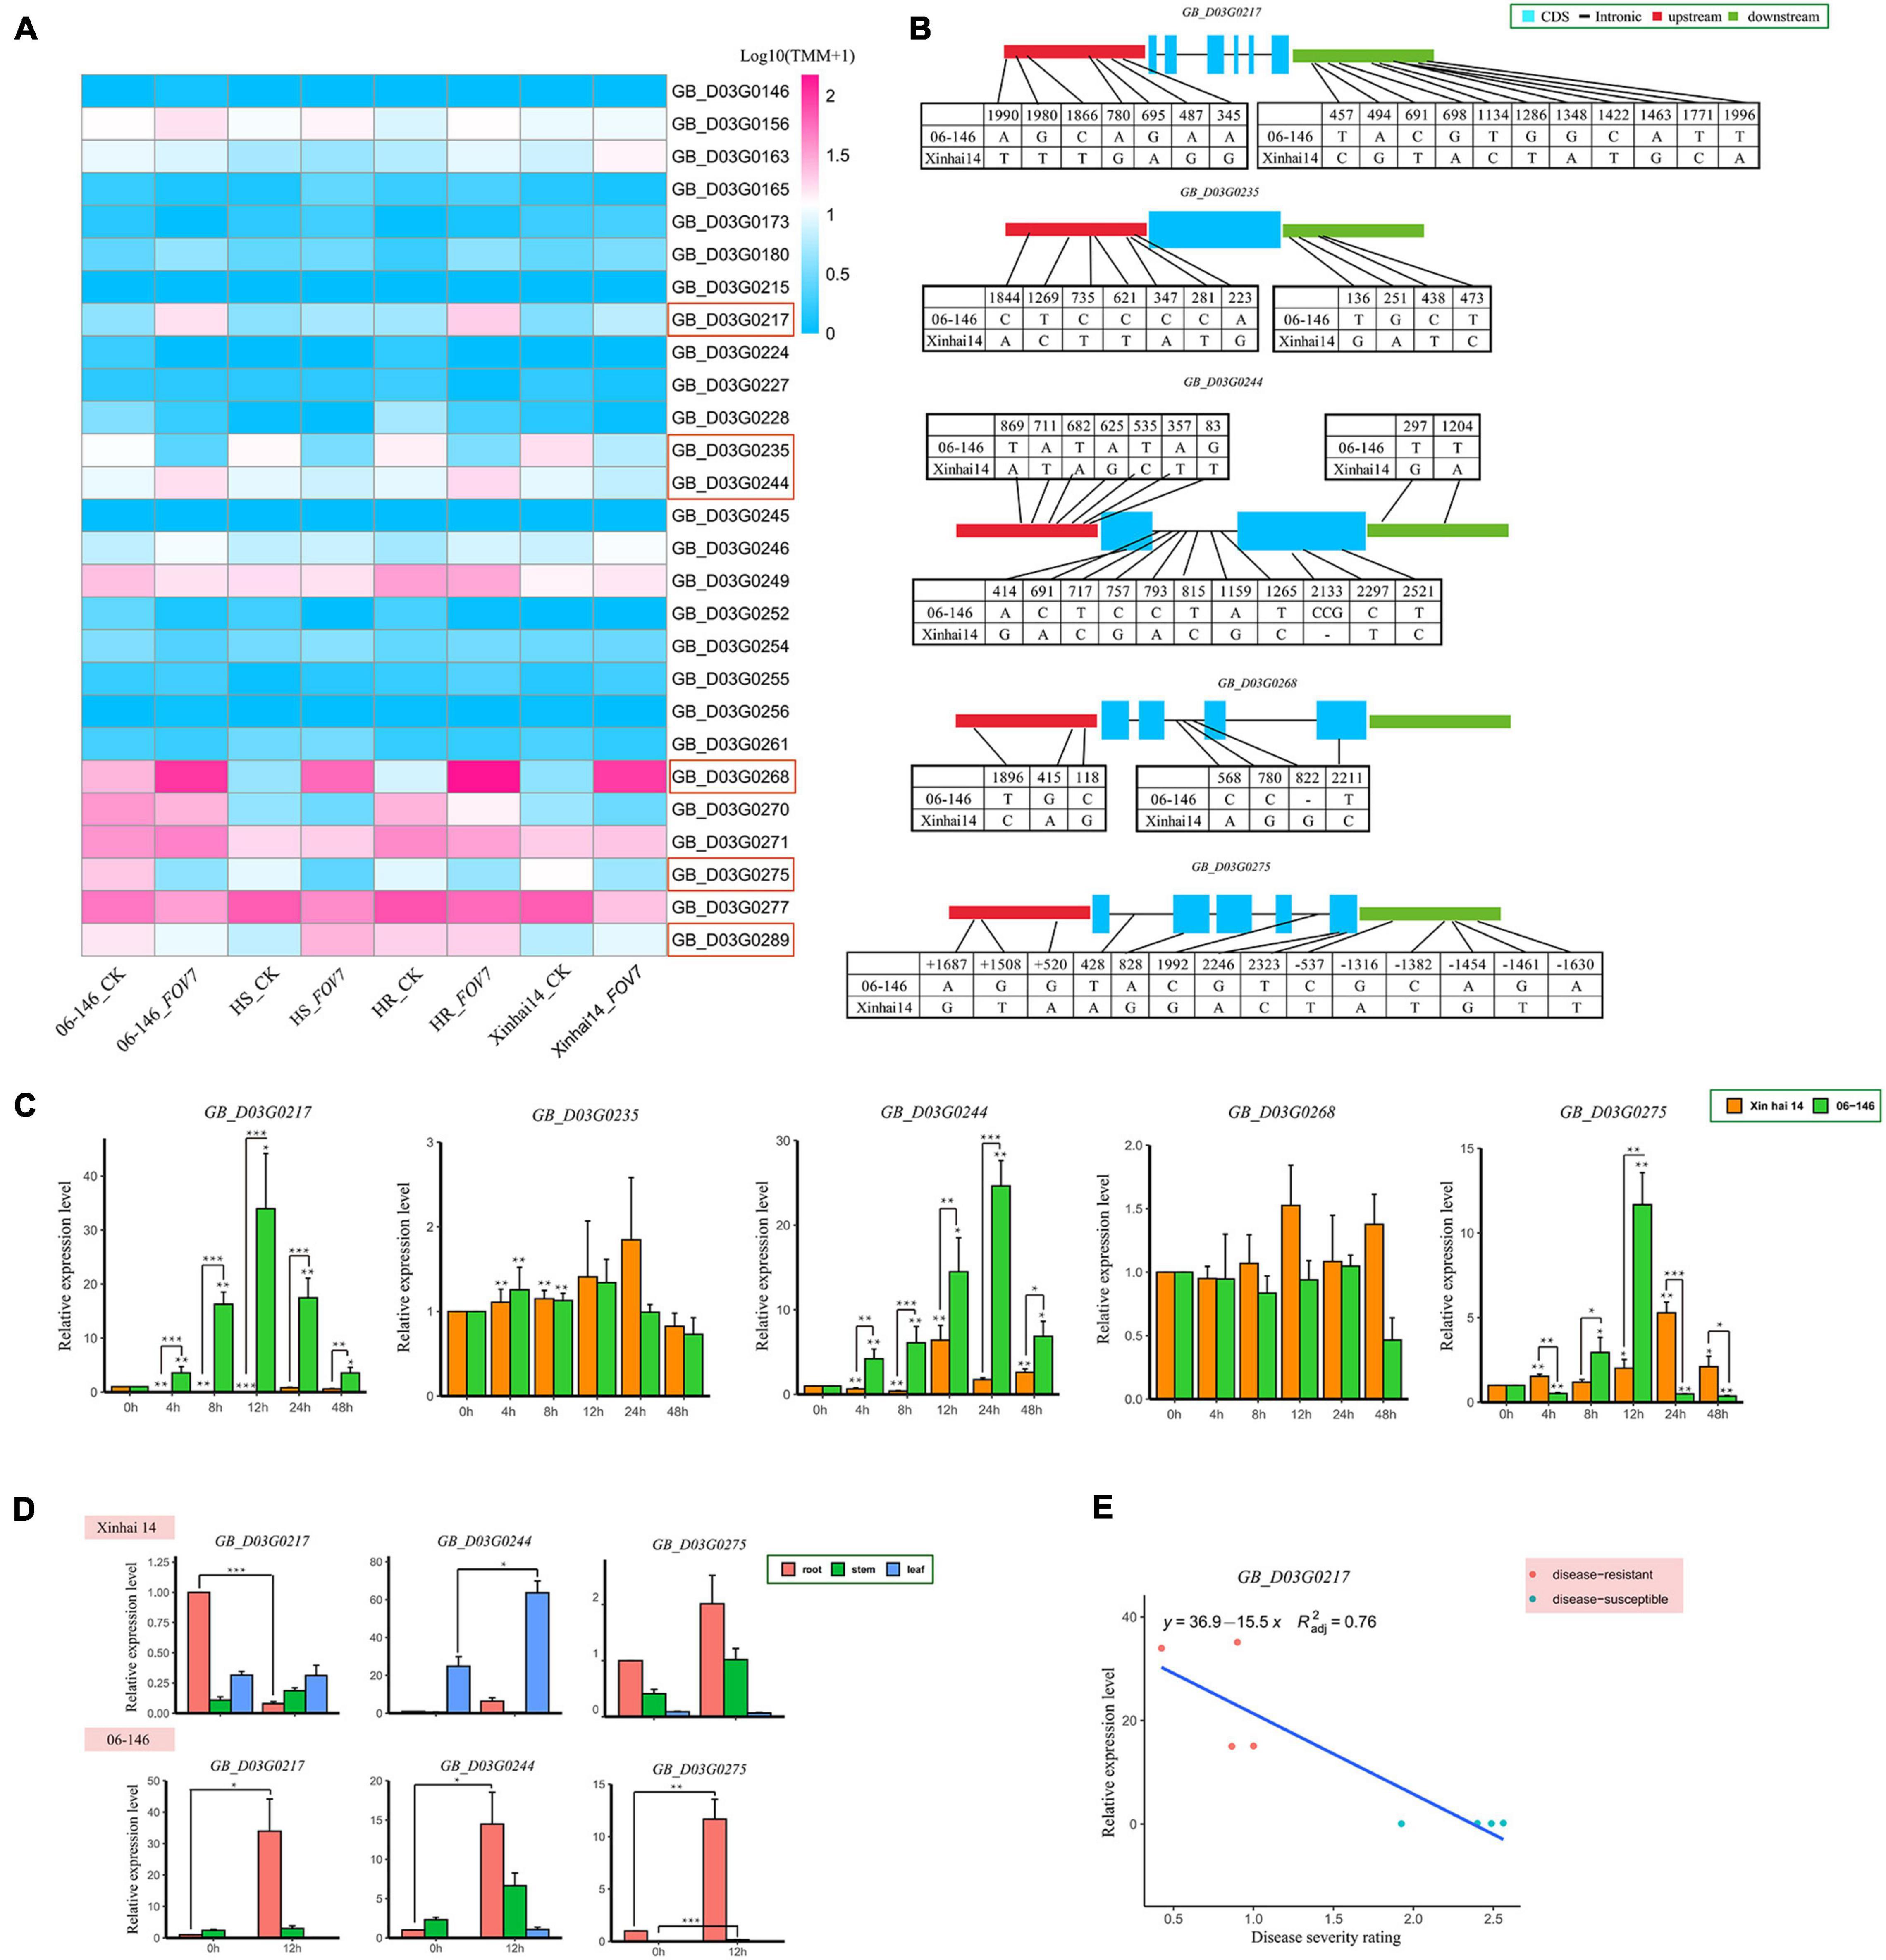
Figure 4. (A) Expression analysis of 27 genes from the parent and RIL populations under FOV7 stress based on transcriptome data. (B) SNP and Indel information between Xinhai 14 and 06-146. (C) Expression profiling of five candidate genes related to FOV7 resistance. The error bars represent the means of three replicates ± SEs. Statistically significant differences from the control group are indicated with *P < 0.05; **P < 0.01; and ***P < 0.001. (D) Tissue-specific expression analysis of three candidate genes related to FOV7 resistance. The error bars represent the means of three replicates ± SEs. Statistically significant differences from the control group are indicated as *P < 0.05; **P < 0.01;***P < 0.001. (E) Expression patterns of the GB_D03G0217 gene in apical organs of eight lines inoculated with FOV7, detected by qRT–PCR; red and blue dots indicate four FOV7-resistant lines and four FOV7 susceptible lines, respectively.
To further study possible roles of these five candidate genes (with differences in expression levels and DNA sequences between the two parents) in FOV7 resistance, qRT-PCR was used to compare the transcription levels in the roots of the two parents at the seedling stage during different time points after FOV7 inoculation. Genes except for GB_D03G0235 and GB_D03G0268 exhibited increased expression in the roots after inoculation, as compared to the non-inoculated control (Figure 4C). However, only three genes (GB_D03G0217, GB_D03G0244, and GB_D03G0275) showed significant differential expression during the same period following inoculation between the two parents. The results suggest possible roles of these three genes in the response to FOV7 infection in G. barbadense.
To understand if these three genes are root-specific, their expression levels were compared among roots, stems and leaves. Results showed that their expression was generally the highest in the roots, both before and after FOV7 inoculation (Figure 4D). Interestingly, these three genes exhibited significant expression changes in different tissues before and after FOV7 inoculation. Among these three genes, only GB_D03G0217 showed significant changes in the roots but with opposite expression patterns between the two parents and was therefore chosen as the possible candidate gene for the QTL.
To further study the involvement of the GB_D03G0217 after G. barbadense was subjected to FOV7 infection, four FOV7-resistant lines and four susceptible lines were compared (Figure 4E). Results showed that the expression of GB_D03G0217 was significantly higher in the resistant lines than in the susceptible lines. The linear regression between the DSR and the expression level in the eight lines was significant (r = 0.872, P < 0.01).
Virus Induced Gene Silencing Analysis of GbCML in Cotton
To further verity the function of GB_D03G0217 in relation to FOV7 resistance, a bioinformatics analysis indicated that it encodes a calmodulin-like (CML) protein, named GbCML here. As shown in Figure 5A, VIGS plants infiltrated with Agrobacteria carrying GbTRV1 + GbCML exhibited an albino phenotype on newly developed true leaves after infiltration, indicating that the VIGS system worked efficiently under our experimental conditions, as expected. The qRT-PCR analysis showed that the expression of GbCML in VIGS plants was significantly lower than that in control plants with the empty vector (Figure 5B). To further understand the relationship between changes in GbCML expression and FOV7 resistance in VIGS plants, 18 VIGS plants were evaluated for their resistance to FOV7 (Figures 5C,D). The VIGS plants exhibited FOV7-associated foliar symptoms including necrosis and yellowing (Figure 5C), with a significant higher DSR (Figure 5D). Therefore, suppression of the GbCML gene expression in the VIGS plants of the resistant parent 06-146 led to increased susceptibility to FOV7. The results suggested that GbCML played a role in defending cotton against FOV7.
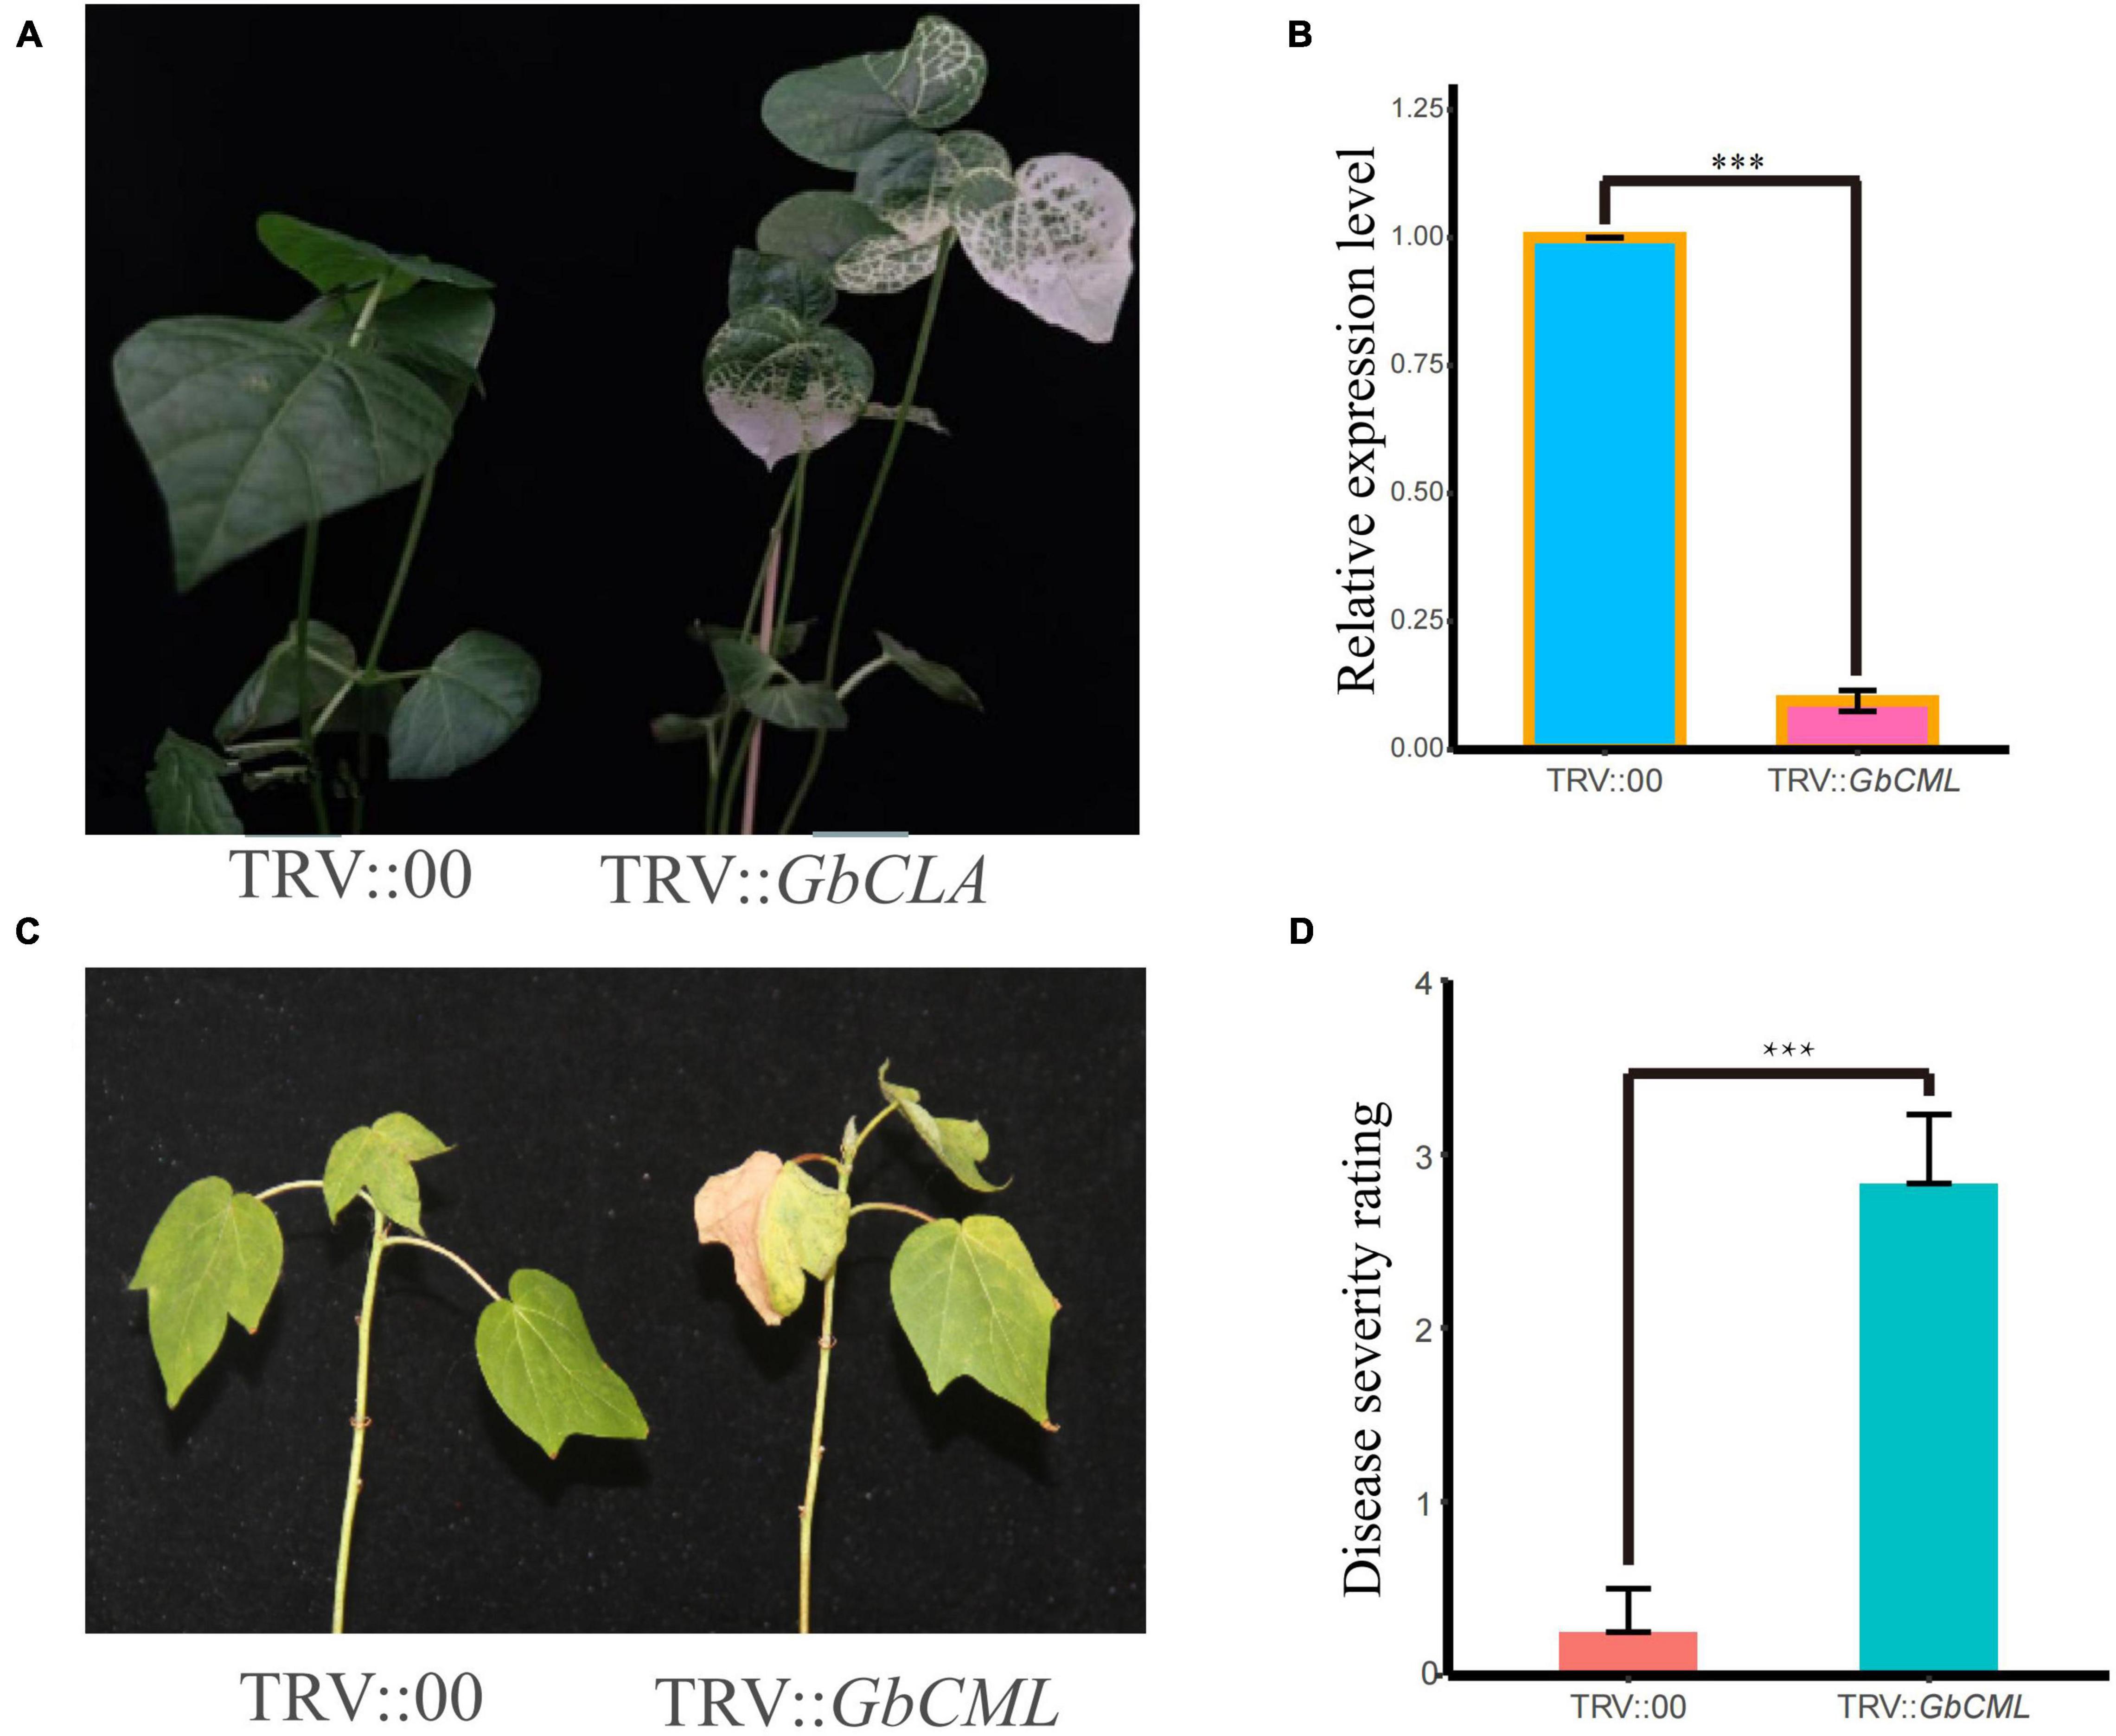
Figure 5. Effects of silencing of GbCML on 06-146 susceptibility to FOV7. Two weeks after infiltration, seedlings were inoculated with FOV7. (A) Seven day-old cotton plants were infiltrated with Agrobacterium carrying TRV:GbCLA. The photographs were taken at 2 weeks after infiltration. (B) qRT-PCR for detection of silencing efficiency. (C) Representative seedlings of control (CK) and silenced plants after inoculation with FOV7 at 20 days post-inoculation (dpi). (D) Responses of control (CK) (TRV:00) and silenced (TRV:GbCML) plants to the FOV7 at 20 dpi. Disease severity rating (DSR) in CK and silenced plants each with eighteen experimental replicates. The DSR were measured at 20 dpi. Error bars represent the standard deviation of eighteen biological replicates; asterisks indicate statistically significant differences, as determined by t-test (P < 0.001).
Discussion
In this study, we resequenced 110 G. barbadense RILs and their two parents and constructed a high-density genetic map in a G. barbadense RIL population for the first time based on 933,845 high-quality SNP markers. The linkage map had a total genetic distance of 2,483.17 cM for 26 linkage groups (i.e., chromosome pairs). The genetic variation within G. barbadense is known to be low (Zhang et al., 2014). Because of the close genetic relatedness of the two parental lines, which were developed in Xinjiang, China, there were chromosomal regions with minimal sequence variation, leading to large gaps between bins. However, as expected, the RIL population showed a higher recombination rate and higher position resolution than the F2 population due to many generations of self-pollination to break tight linkages. Although the RIL population was not large, the DSR trait was normally distributed in each of the eight tests, indicating that the RIL population was suitable for identifying QTLs for FOV7 resistance in G. barbadense. As a result, nine QTLs for FOV7 resistance, including one common QTL (qFOV7-D03-1) on chromosome D03, were identified. This study represents the first investigation of FOV7 resistance using a RIL population evaluated in multiple tests for QTL mapping in G. barbadense.
Wang et al. (2009) was the first to use molecular mapping technology to identify four QTLs, including one major gene (FwR) on D03, for FOV7 resistance in early segregating populations (F2:3) of G. hirsutum based on SSR markers. Most recently, Liu et al. (2021) reported that Gh_D03G0209 (named GhGLR4.8) on D03 encoding a GLUTAMATE RECEPTOR-LIKE (GLR) protein was the candidate gene for the resistance gene Fov7 within the 1.97–2.37 Mb region based on a GWAS of 290 Chinese G. hirsutum accessions and CRISPR/Cas9-mediated knockout analysis. The region containing FOV7 is within the region (0.99–3.01 Mb) of the common QTL qFOV7-D03-1 identified in this study. Although GhGLR4.8 has the highest homology (99.84%) to GB_D03G1991 on the same chromosome, GB_D03G1991 is not within the QTL region for qFOV7-D03-1. Therefore, its role in conferring resistance to FOV7 in this G. barbadense RIL population was ruled out. The genetic bases of resistance between G. barbadense and G. hirsutum are likely different.
In this study, a detailed comparative analysis of gene expression and DNA sequences within the qFOV7-D03-1 region between the two parents revealed only five candidate genes. Through further qRT-PCR of different tissues between the two parents and roots after inoculation of FOV7 between two groups (resistant vs. susceptible) of lines, GB_D03G0217 was identified as the candidate gene for verification using VIGS. GB_D03G0217 was homologous to the gene AT3G50360 encoding a calmodulin (CaM)-like (CML) protein in Arabidopsis. It is currently known that CML and CaM proteins are primary Ca2 + sensors regulating cellular functions in response to environmental cues, including gene expression during plant immune responses (Chiasson et al., 2005; Cheval et al., 2013; Zhu et al., 2017; Bredow and Monaghan, 2019).
To date, many studies have focused on yield and fiber quality traits in G. barbadense, while few studies have focused on resistance to FOV7. Due to the planting pattern of cotton in the field, disease resistance has become the main problem and challenge in cotton breeding. In our study, stable QTLs and candidate genes related to FOV7 resistance were obtained by QTL mapping in G. barbadense. Although 7 QTLs could be detected in only one environment, they showed obvious environmental specificity. Unexpected results might be obtained if we further apply multiomics. Although only a small number of stable QTLs were detected, unstable QTLs can also be used to select some disease-resistant varieties for specific areas. To further improve the location resolution for in-depth analysis, a larger genetic population needs to be developed with the stable QTL region. This study laid a foundation for improving disease resistance, breeding efficiency and the development of molecular markers in cotton breeding.
In summary, nine QTLs related to FOV7 resistance were identified, including qFOV7-D03-1 on chromosome D03, in two experiments. However, QTL stability was influenced by the environment. Through a combined analysis of QTL linkage mapping and gene expression, the CML gene (GB_D03G0217) gene on D03 was identified as a candidate gene likely conferring resistance to FOV7 in G. barbadense. VIGS showed that resistance to FOV7 in G. barbadense was positively regulated by GBCML.
Data Availability Statement
The data presented in the study are deposited in the NCBI repository, accession number PRJNA798892.
Author Contributions
WH, QJC, and YQ conceived and designed the experiments. WH, JYZ, DL, YW, QC, QZ, XL, and XD collected public datasets and performed the experiments. WH, JYZ, JFZ, XD, AG, QJC, and YQ analyzed the data. WH, JYZ, and JFZ wrote the manuscript. WH, JFZ, QJC, and YQ revised the manuscript. All authors read and approved the final manuscript.
Funding
This work was supported by the Major Special Project of the Xinjiang Uygur Autonomous Region (2020A01002-2) and New Cultivar Breeding of Transgenic Herbicide Resistance in Cotton (2020ZX08005-005). The funding agencies played no role in the design of the study, data collection or analysis, or interpretation or writing of the manuscript.
Conflict of Interest
The authors declare that the research was conducted in the absence of any commercial or financial relationships that could be construed as a potential conflict of interest.
Publisher’s Note
All claims expressed in this article are solely those of the authors and do not necessarily represent those of their affiliated organizations, or those of the publisher, the editors and the reviewers. Any product that may be evaluated in this article, or claim that may be made by its manufacturer, is not guaranteed or endorsed by the publisher.
Supplementary Material
The Supplementary Material for this article can be found online at: https://www.frontiersin.org/articles/10.3389/fpls.2022.815643/full#supplementary-material
Supplementary Figure 1 | Genetic linkage map and genome collinearity map.
Footnotes
References
Abdelraheem, A., Fang, D., Dever, J., and Zhang, J. F. (2020). QTL analysis of agronomic, fiber quality, and abiotic stress tolerance traits in a recombinant inbred population of pima cotton. Crop Sci. 60, 1823–1843.
Abdelraheem, A., Liu, F., Song, M., and Zhang, J. F. (2017). A meta-analysis of quantitative trait loci for abiotic and biotic stress resistance in tetraploid cotton. Mol. Genet. Genom. 292, 1221–1235. doi: 10.1007/s00438-017-1342-0
Abdelraheem, A., Mahdy, E., and Zhang, J. (2013). Mapping of candidate genes and quantitative trait loci of drought tolerance in a recombinant inbred line population of Gossypium barbadense. Proc. Beltwide Cotton Conf. 2013, 179–184.
Abdelraheem, A., Mahdy, E., and Zhang, J. (2015). The first linkage map for a recombinant inbred line population in cotton (Gossypium barbadense) and its use in studies of PEG-induced dehydration tolerance. Euphytica 205, 941–958. doi: 10.1007/s10681-015-1448-6
Bell, A. A., Gu, A., Olvey, J., Wagner, T. A., Tashpulatov, J. J., Prom, S., et al. (2019). Detection and characterization of Fusarium oxysporum f. sp. vasinfectum VCG0114 (Race 4) isolates of diverse geographic origins. Plant Dis. 103, 1998–2009. doi: 10.1094/PDIS-09-18-1624-RE
Bredow, M., and Monaghan, J. (2019). Regulation of plant immune signaling by calcium-dependent protein kinases. Mol. Plant Microbe Interact. 32, 6–19. doi: 10.1094/MPMI-09-18-0267-FI
Cheval, C., Aldon, D., Galaud, J.-P., and Ranty, B. (2013). Calcium/calmodulin-mediated regulation of plant immunity. Bioch. Biophy. Acta Mol. Cell Res. 1833, 1766–1771. doi: 10.1016/j.bbamcr.2013.01.031
Chiasson, D., Ekengren, S. K., Martin, G. B., Dobney, S. L., and Snedden, W. A. (2005). Calmodulin-like proteins from Arabidopsis and tomato are involved in host defense against Pseudomonas syringae pv. tomato. Plant Mol. Biol. 58, 887–897. doi: 10.1007/s11103-005-8395-x
Dale, J., James, A., Paul, J. Y., Khanna, H., Smith, M., Peraza-Echeverria, S., et al. (2017). Transgenic Cavendish bananas with resistance to Fusarium wilt tropical race 4. Nat. Commun. 8:1496. doi: 10.1038/s41467-017-01670-6
Davis, R. M., Colyer, P. D., Rothrock, C. S., and Kochman, J. K. (2006). Fusarium wilt of cotton: Population diversity and implications for management. Plant Dis. 90, 692–703. doi: 10.1094/PD-90-0692
De Cal, A., Garcia-Lepe, R., and Melgarejo, P. (2000). Induced resistance by Penicillium oxalicum against Fusarium oxysporum f. sp. lycopersici: Histological studies of infected and induced tomato stems. Phytopathology 90, 260–268. doi: 10.1094/PHYTO.2000.90.3.260
Du, Z., Qi, H., Liu, X., Kai, Z., Emmanuel, K, S., Liu, X. D., et al. (2020). AllEnricher: a comprehensive gene set function enrichment tool for both model and non-model species. BMC Bioinformatics 21:106. doi: 10.1186/s12859-020-3408-y
Feng, C. D., Zhang, J. F., Liu, J. L., Wu, Z. B., Guo, J. H., and Sun, J. Z. (1998). Allelism and linkage test of upland cotton genes resistant to Fusarium wilt. Hereditas 20, 33–36.
Galindo, G. L., and Deyholos, M. K. (2016). RNA-seq transcriptome response of flax (Linum usitatissimum L.) to the pathogenic fungus Fusarium oxysporum f. sp. lini. Front. Plant Sci. 7:1766. doi: 10.3389/fpls.2016.01766
Halpern, H. C., Bell, A. A., Wagner, T. A., Liu, J., Nichols, R. L., Olvey, J., et al. (2019). First report of Fusarium wilt of cotton caused by Fusarium oxysporum f. sp. vasinfectum race 4 in Texas, U.S.A. Plant Dis. 102:446. doi: 10.1094/pdis-07-17-1084-pdn
Halpern, H. C., Qi, P., Kemerait, R. C., and Brewer, M. T. (2020). Genetic diversity and population structure of races of Fusarium oxysporum causing cotton wilt. G3 10, 3261–3269. doi: 10.1534/g3.120.401187
Hans, O., Piet, S., Richard, G. F. V., and Herman, J. E. (2005). SMOOTH: a statistical method for successful removal of genotyping errors from high-density genetic linkage data. Theor. Appl. Genet. 112, 187–194. doi: 10.1007/s00122-005-0124-y
Hillock, R. J. (1992). “Fusarium wilt,” in Cotton diseases, ed. R. J. Hillocks (Wallingford: CAB International), 127–160.
Hu, Y., Chen, J., Fang, L., Zhang, Z., Ma, W., Niu, Y., et al. (2019). Gossypium barbadense and Gossypium hirsutum genomes provide insights into the origin and evolution of allotetraploid cotton. Nat. Genet. 51, 739–748. doi: 10.1038/s41588-019-0371-5
Kim, Y., Hutmacher, R. B., and Davis, R. M. (2005). Characterization of California isolates of Fusarium oxysporum f. sp. vasinfectum. Plant Dis. 89, 366–372. doi: 10.1094/PD-89-0366
Li, C., Dong, Y., Zhao, T., Li, L., Li, C., Yu, E., et al. (2016). Genome-wide SNP linkage mapping and QTL analysis for fiber quality and yield traits in the upland cotton recombinant inbred lines population. Front. plant sci. 7:1356. doi: 10.3389/fpls.2016.01356
Li, H., and Durbin, R. (2009). Fast and accurate short read alignment with Burrows-Wheeler transform. Oxford: Bioinformatics, 14.
Li, X. G., Zhang, Y. N., Ding, C. F., Xu, W. H., and Wang, X. X. (2017). Temporal patterns of cotton Fusarium and Verticillium wilt in Jiangsu coastal areas of China. Sci. Rep. 7:12581. doi: 10.1038/s41598-017-12985-1
Liu, D. Y., Ma, C. X., Hong, W. G., Huang, L., Liu, M., Liu, H., et al. (2014). Construction and analysis of high-density linkage map using high-throughput sequencing data. PLoS One 9:e98855. doi: 10.1371/journal.pone.0098855
Liu, E., and Page, J. E. (2008). Optimized cDNA libraries for virus-induced gene silencing (VIGS) using tobacco rattle virus. Plant Methods 4:5. doi: 10.1186/1746-4811-4-5
Liu, S., Zhang, X., Xiao, S., Ma, J., Shi, W., Qin, T., et al. (2021). A single-nucleotide mutation in a GLUTAMATE RECEPTOR-LIKE gene confers resistance to fusarium wilt in Gossypium hirsutum. Adv. Sci. 8:2002723. doi: 10.1002/advs.202002723
Ma, C., and Zhang, H. (1986). A preliminary study on cotton yield loss caused by Fusarium wilt disease. Acta Phytopathol. Sin. 16, 251–264.
Pei, Y. K., Li, X. C., Zhu, Y. T., Ge, X. Y., Liu, N. N., Jia, Y. J., et al. (2019). GhABP19, a novel germin-like protein from Gossypium hirsutum, plays an important role in the regulation of resistance to Verticillium and Fusarium wilt pathogens. Front. Plant Sci. 10:583. doi: 10.3389/fpls.2019.00583
Rana, A., Sahgal, M., and Johri, B. N. (2017). “Fusarium oxysporum: Genomics, diversity and plant–host interaction,” in Developments in Fungal Biology and Applied Mycology, eds T. Satyanarayana, S. K. Deshmukh, and B. N. Johri (Berlin: Springer), 159–199. doi: 10.1007/978-981-10-4768-8_10
Said, J. I., Knapka, J. A., Song, M. Z., and Zhang, J. F. (2015a). Cotton QTLdb: a cotton QTL database for QTL analysis, visualization, and comparison between Gossypium hirsutum and G. hirsutum × G. barbadense populations. Mol. Genet. Genomics 290, 1615–1625. doi: 10.1007/s00438-015-1021-y
Said, J. I., Song, M. Z., Wang, H. T., Lin, Z. X., Zhang, X. L., Fang, D. D., et al. (2015b). A comparative meta-analysis of QTL between intraspecific Gossypium hirsutum and interspecific G. hirsutum × G. barbadense populations. Mol. Genet. Genomics 290, 1003–1025.
Said, J., Lin, Z. X., Zhang, X. L., Song, M. Z., and Zhang, J. F. (2013). A comprehensive QTL meta-analysis for fiber quality, yield, yield related and morphological traits, drought tolerance, and disease resistance in tetraploid cotton. BMC Genomics 14:776. doi: 10.1186/1471-2164-14-776
Sanogo, S., and Zhang, J. F. (2016). Resistance sources, resistance screening techniques and disease management for Fusarium wilt in cotton. Euphytica 207, 255–271. doi: 10.1007/s10681-015-1532-y
Simona, D. S., Giovanni, M., Rosamaria, P., Antonio, M., Vladan, M., and Stefania, T. (2017). GATK hard filtering: tunable parameters to improve variant calling for next generation sequencing targeted gene panel data. BMC Bioinformatics 18 (Suppl .5):119. doi: 10.1186/s12859-017-1537-8
Tanino, Y., Kodama, M., Daicho, H., Yoshito, M., Towa, Y., Yukiji, Y., et al. (2017). Selection of laboratory procedures to detect toxigenic by the 2-step method. Rinsho Biseibutshu Jinsoku Shindan Kenkyukai shi. 27, 9–14.
Ulloa, M., Hutmacher, R. B., Roberts, P. A., Wright, S. D., Nichols, R. L., and Davis, R. M. (2013). Inheritance and QTL mapping of Fusarium wilt race 4 resistance in cotton. Theor. Appl. Genet. 126, 1405–1418. doi: 10.1007/s00122-013-2061-5
Ulloa, M., Wang, C., Hutmacher, R. B., Wright, S. D., Davis, R. M., Saski, C. A., et al. (2011). Mapping Fusarium wilt race 1 resistance genes in cotton by inheritance, QTL and sequencing composition. Mol. Genet. Genomics 286, 21–36. doi: 10.1007/s00438-011-0616-1
Upasani, M. L., Limaye, B. M., Gurjar, G. S., Kasibhatla, S. M., Joshi, R. R., Kadoo, N. Y., et al. (2017). Chickpea-Fusarium oxysporum interaction transcriptome reveals differential modulation of plant defense strategies. Sci. Rep. 7:7746. doi: 10.1038/s41598-017-07114-x
Wang, C., and Roberts, P. A. (2006). A Fusarium wilt resistance gene in Gossypium barbadense and its effect on root-knot nematode-wilt disease complex. Phytopathology 96, 727–734. doi: 10.1094/PHYTO-96-0727
Wang, M., Tu, L., Yuan, D., Zhu, L., Shen, C., Li, J., et al. (2019). Reference genome sequences of two cultivated allotetraploid cottons, Gossypium hirsutum and Gossypium barbadense. Nat. Genet. 51, 224–229. doi: 10.1038/s41588-018-0282-x
Wang, P., Su, L., Qin, L., Hu, B., Guo, W., and Zhang, T. (2009). Identification and molecular mapping of Fusarium wilt resistant gene in upland cotton. Theor. Appl. Genet. 119, 733–739. doi: 10.1007/s00122-009-1084-4
Wang, X., Yu, Y., Sang, J., Wu, Q., Zhang, X., and Lin, Z. (2013). Intraspecific linkage map construction and QTL mapping of yield and fiber quality of ‘Gossypium babrdense’. Aust. J. Crop Sci. 7, 1252–1261.
Xing, M., Lv, H., Ma, J., Xu, D., Li, H., Yang, L., et al. (2016). Transcriptome profiling of resistance to Fusarium oxysporum f. sp. conglutinans in cabbage (Brassica oleracea) roots. PLoS One 11:e014804. doi: 10.1371/journal.pone.0148048
Yao, Z., Chen, Q., Chen, D., Zhan, L., Zeng, K., Gu, A., et al. (2019). The susceptibility of sea-island cotton recombinant inbred lines to Fusarium oxysporum f. sp. vasinfectum infection is characterized by altered expression of long noncoding RNAs. Sci. Rep. 9:2894. doi: 10.1038/s41598-019-39051-2
Zhang, J. F., Percy, R. G., and McCarty, J. C. (2014). Introgression genetics and breeding between Upland and Pima cotton: a review. Euphytica 198, 1–12.
Zhang, J. F., and Stewart, J. M. (2000). Economical and rapid method for extracting cotton genomic DNA. J. Cotton Sci. 4, 193–201. doi: 10.1094/PDIS-01-21-0218-PDN
Zhang, J. F., Sanogo, S., Ma, Z. Y., and Qu, Y. Y. (2015). Breeding, genetics, and quantitative trait locus mapping for Fusarium wilt resistance in cotton. Crop Sci. 55, 2435–2453.
Zhu, X., Robe, E., Jomat, L., Aldon, D., Mazars, C., and Galaud, J.-P. (2017). CML8, an Arabidopsis calmodulin-like protein, plays a role in Pseudomonas syringae plant immunity. Plant Cell Physiol. 58, 307–319. doi: 10.1093/pcp/pcw189
Zhu, Y. J., Zhang, X. Y., Li, J. R., Han, L., and Zhang, W. (2010). Inheritance of resistance to Fusarium wilt and their molecular marker in Gossypium barbadense (In Chinese with English abstract). Xinjiang Agric. Sci. 2, 268–273.
Zhu, Y., Abdelraheem, A., Lujan, P., Idowu, O. J., Sullivan, P., Nichols, R., et al. (2021). Detection and characterization of Fusarium wilt (Fusarium oxysporum f. sp. vasinfectum) race 4 causing Fusarium wilt of cotton seedlings in New Mexico, USA. Plant Dis. 5:2021. doi: 10.1094/PDIS-10-20-2174-RE
Keywords: Gossypium barbadense, recombinant inbred lines, genome resequencing, single-nucleotide polymorphism (SNP), quantitative trait locus (QTL), Fusarium wilt (FOV7), candidate genes
Citation: Han W, Zhao J, Deng X, Gu A, Li D, Wang Y, Lu X, Zu Q, Chen Q, Chen Q, Zhang J and Qu Y (2022) Quantitative Trait Locus Mapping and Identification of Candidate Genes for Resistance to Fusarium Wilt Race 7 Using a Resequencing-Based High Density Genetic Bin Map in a Recombinant Inbred Line Population of Gossypium barbadense. Front. Plant Sci. 13:815643. doi: 10.3389/fpls.2022.815643
Received: 29 November 2021; Accepted: 10 January 2022;
Published: 10 March 2022.
Edited by:
Linghe Zeng, United States Department of Agriculture (USDA), United StatesReviewed by:
Zhang Zhengsheng, Southwest University, ChinaLiangsheng Xu, Northwest A&F University, China
Copyright © 2022 Han, Zhao, Deng, Gu, Li, Wang, Lu, Zu, Chen, Chen, Zhang and Qu. This is an open-access article distributed under the terms of the Creative Commons Attribution License (CC BY). The use, distribution or reproduction in other forums is permitted, provided the original author(s) and the copyright owner(s) are credited and that the original publication in this journal is cited, in accordance with accepted academic practice. No use, distribution or reproduction is permitted which does not comply with these terms.
*Correspondence: Yanying Qu, xjyyq5322@126.com
†These authors have contributed equally to this work