 Zi-Piao Ye1†
 Ting An2†
 Govindjee Govindjee3
 Piotr Robakowski4
 Alexandrina Stirbet5
 Xiao-Long Yang6
 Xing-Yu Hao7
 Hua-Jing Kang8*
 Fu-Biao Wang1*
- 1The Institute of Biophysics in College of Mathematics and Physics, Jinggangshan University, Ji’an, Jiangxi, China
- 2School of Biological Sciences and Engineering, Jiangxi Agriculture University, Nanchang, China
- 3Plant Biology, Biochemistry, and Biophysics, University of Illinois at Urbana-Champaign, Urbana, IL, United States
- 4Faculty of Forestry and Wood Technology, Poznan University of Life Sciences, Poznan, Poland
- 5Retired, Newport News, VA, United States
- 6School of Life Sciences, University of Nantong, Nantong, Jiangsu, China
- 7College of Agriculture/State Key Laboratory of Sustainable Dry land Agriculture Jointly Built by the Shanxi Province and the Ministry of Science and Technology, Shanxi Agricultural University, Taiyuan, Shanxi, China
- 8Southern Zhejiang Key Laboratory of Crop Breeding of Zhejiang Province, Wenzhou Academy of Agricultural Sciences, Wenzhou, Zhejiang, China
The models used to describe the light response of electron transport rate in photosynthesis play a crucial role in determining two key parameters i.e., the maximum electron transport rate (Jmax) and the saturation light intensity (Isat). However, not all models accurately fit J–I curves, and determine the values of Jmax and Isat. Here, three models, namely the double exponential (DE) model, the non-rectangular hyperbolic (NRH) model, and a mechanistic model developed by one of the coauthors (Z-P Ye) and his coworkers (referred to as the mechanistic model), were compared in terms of their ability to fit J–I curves and estimate Jmax and Isat. Here, we apply these three models to a series of previously collected Chl a fluorescence data from seven photosynthetic organisms, grown under different conditions. Our results show that the mechanistic model performed well in describing the J–I curves, regardless of whether photoinhibition/dynamic down-regulation of photosystem II (PSII) occurs. Moreover, both Jmax and Isat estimated by this model are in very good agreement with the measured data. On the contrary, although the DE model simulates quite well the J–I curve for the species studied, it significantly overestimates both the Jmax of Amaranthus hypochondriacus and the Isat of Microcystis aeruginosa grown under NH4+-N supply. More importantly, the light intensity required to achieve the potential maximum of J (Js) estimated by this model exceeds the unexpected high value of 105 μmol photons m−2 s−1 for Triticum aestivum and A. hypochondriacus. The NRH model fails to characterize the J-I curves with dynamic down-regulation/photoinhibition for Abies alba, Oryza sativa and M. aeruginosa. In addition, this model also significantly overestimates the values of Jmax for T. aestivum at 21% O2 and A. hypochondriacus grown under normal condition, and significantly underestimates the values of Jmax for M. aeruginosa grown under NO3–N supply. Our study provides evidence that the ‘mechanistic model’ is much more suitable than both the DE and NRH models in fitting the J–I curves and in estimating the photosynthetic parameters. This is a powerful tool for studying light harvesting properties and the dynamic down-regulation of PSII/photoinhibition.
Introduction
Solar energy is an important environmental factor that drives charge separation in both photosystem I (PSI) and photosystem II (PSII) to produce electron transport rate, the J (see Table 1 for the list of abbreviations), which directly affects the subsequent formation of NADPH and ATP, as well as their allocation for carboxylation versus oxygenation of ribulose bisphosphate (RuBP) (Shevela et al., 2023). Chlorophyll a (Chl a) fluorescence is a valuable and sensitive tool for studying and understanding the electron transport process in photosynthesis, providing insights into the efficiency and functionality of electron transport and responses of photosynthetic organisms to changing environmental conditions (Mar and Govindjee, 1972; Govindjee, 1990, 2004; Baker, 2008; Stirbet et al., 2020). Moreover, the relationship between Chl a fluorescence and electron transport is complex and can be influenced by changes in environmental conditions, such as light intensity, temperature, and the availability of CO2. Thus, accurately and rapidly characterizing the light-response curve of Chl a fluorescence (i.e., the J–I curve) of photosynthetic organisms can facilitate the assessment of their potential photosynthetic capacity over a wide range of ambient light intensities (White and Critchley, 1999; Maxwell and Johnson, 2000; Long and Bernacchi, 2003; Yin et al., 2009; von Caemmerer, 2013; Yin et al., 2021; Chang et al., 2023), which is crucial for optimizing agricultural productivity, studying ecosystem dynamics, and assessing the impact of environmental changes on photosynthetic processes.
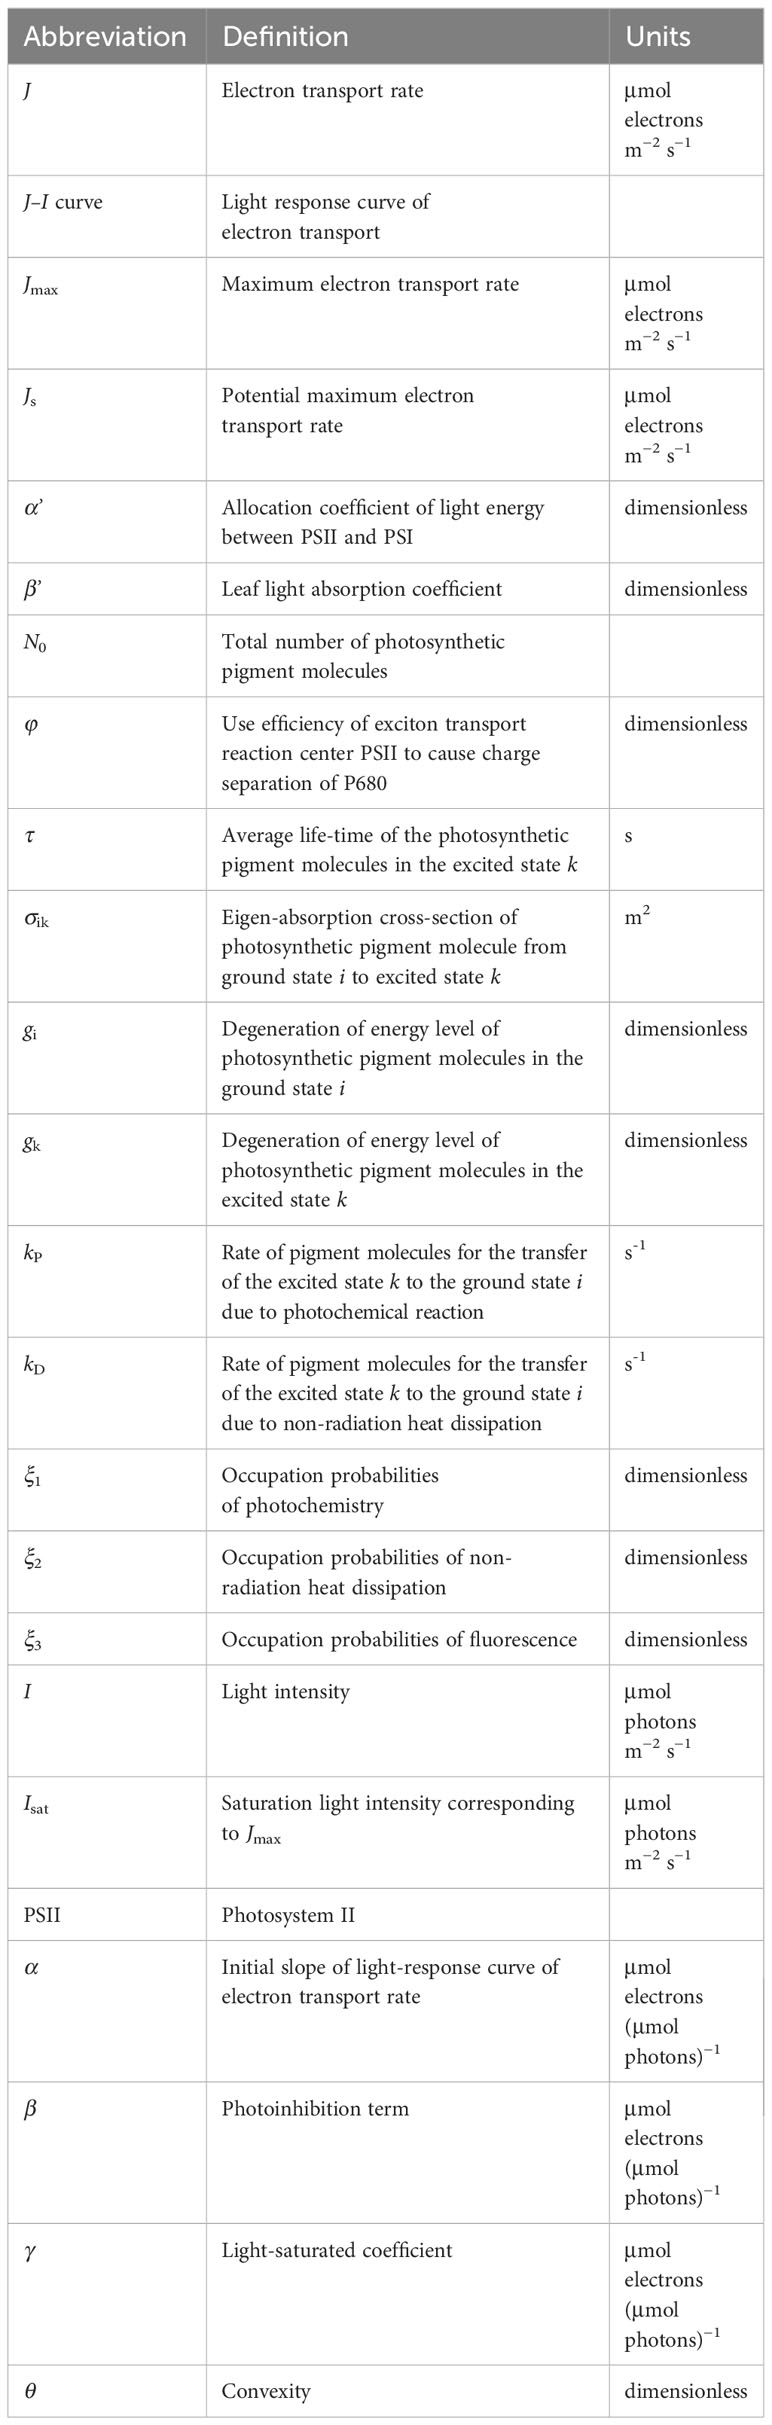
Table 1 Definitions of the abbreviations.
Generally, for algae and cyanobacteria, the J–I curve is divided into three distinct parts depending on the light intensity levels: (1) light-limited, (2) light-saturated, and (3) photoinhibitory/dynamic down-regulation of PSII (Ralph and Gademann, 2005). The J level increases almost linearly with the increasing light intensity over the light-limited region until the light intensity reaches the saturation level (Isat), after which the J level decreases with the increasing light intensity due to dynamic down-regulation of PSII/photoinhibition induced by high light intensity (Ralph and Gademann, 2005; Suggett et al., 2007; Yang et al., 2023). However, the division of the J–I curve for plants is much more complex (Robakowski, 2005; Ye et al., 2013a, b, 2016, 2019; Hu et al., 2021; He et al., 2022; Robakowski et al., 2022). Some plants show that the decrease in J with increasing light intensity is insignificant (Robakowski, 2005; Ye et al., 2013b; Robakowski et al., 2018; Ye et al., 2020); for some other plants, J fails to reach saturation even at the highest value of light intensity (Ye et al., 2013b; Buckley and Diaz-Espejo, 2015). Consequently, a robust J–I model should accurately provide the J responses to irradiance across all I levels and all patterns of J–I curves mentioned above. In addition, an ideal J–I model should also accurately determine two key parameters (i.e., Isat and Jmax) defining the J–I curves regardless of dynamic down-regulation of PSII/photoinhibition in the photosynthetic organisms under various environmental conditions.
Over the past 40 years, various models have been developed to characterize the J–I curves and estimate Jmax and Isat. Currently, the models for J–I curves of algae, cyanobacteria and plants are the double exponential model (referred to as DE model; Platt et al., 1980), the non-rectangular hyperbolic model (referred to as NRH model; von Caemmerer, 2000; Long and Bernacchi, 2003, 2013; Yin et al., 2009, 2021) which is a sub-model of FvCB model (Farquhar et al., 1980; von Caemmerer, 2000), a model developed by Ye et al. (Ye et al., 2013a, b) (referred to as a mechanistic model) and a few other models (e.g., single exponential model; Harrison and Platt, 1986; Robakowski, 2005). However, these models have been used differently; for example, the single exponential model has been shown to simulate J–I curves of algae, cyanobacteria, and plants, but it could obtain only the initial slope of the J–I curve (α) and the value of Jmax (Rascher et al., 2000; Robakowski, 2005). The DE model has been mainly used for fitting the J–I curves of algae and cyanobacteria, and to provide values of Jmax, Isat and α (Ralph and Gademann, 2005). The NRH model has been extensively applied to fit the J–I curves of plants, but it has only provided values of α and Jmax (Long and Bernacchi, 2003; von Caemmerer, 2013; Ye et al., 2019; Yin et al., 2021). However, the mechanistic model (developed by Ye et al., 2013a, b) has been found to be increasingly of use in simulating the J–I curves of algae, cyanobacteria, and plants, as well as in obtaining the values of α, Jmax and Isat (Serodio et al., 2013; Ye et al., 2013a; Morfopoulos et al., 2014; Sun et al., 2015; Ahammed et al., 2018; Robakowski et al., 2018; Yang et al., 2018; Ye et al., 2019; Robakowski et al., 2022; Yang et al., 2023). These models provide valuable tools for understanding the photosynthetic performance of different photosynthetic organisms under various environmental conditions.
The establishment of different J-I models is based on different photosynthetic tissues and photosynthetic units. For example, the DE model is mainly constructed based on the photosynthetic characteristics of algae and cyanobacteria, with the photosynthetic factory as the basic unit (Platt et al., 1980; Eilers and Peeters, 1988). The NRH model, on the other hand, is based on the photosynthetic characteristics of C3 plants (von Caemmerer, 2000; Long and Bernacchi, 2003; von Caemmerer, 2013). It is not yet known, however, whether the differences in models establishment is the reason why the DE model is only limited to simulate the J–I curve of algae and cyanobacteria, but not of the plants, and why the NRH model has only been used for fitting the J–I curves of C3 plants but not of algae and cyanobacteria. Although the mechanistic model is based more on the photosynthetic characteristics of C3 and C4 plants, with individual photosynthetic pigment molecules as the basic unit (Ye et al., 2013a, b), it is unclear whether the mechanistic model can accurately and precisely fit all types of J–I curves mentioned above, and whether the values of Jmax and Isat fitted with this model are close to the corresponding observed values, and whether there is any significant difference between the fitted values of Jmax and Isat and their corresponding observed values.
To our knowledge, the aforementioned models have not yet been applied to compare the measured (observed) values of the cardinal points of light response curves with the values simulated with the models using the taxa of photosynthetic organisms from the different functional groups: evergreen conifer trees, crops, C3 and C4 plants, ornamental plants and algae. Thus, the goal of this study was to evaluate the performance of the mechanistic model versus the most widely used DE and NRH models for the I level from zero to a high level of irradiance, using the experimental data collected on seven different photosynthetic species under various environmental conditions. In addition, to consider a broader range of model comparisons, we also compared the Eilers and Peeters model (referred to as EP model; Eilers and Peeters, 1988) with the mechanistic model. Despite the fact that the EP model represents the relationship between light intensity and the rate of photosynthesis in algae and phytoplankton (Eilers and Peeters, 1988; Schreiber and Klughammer, 2013), we found that the model can also fit the J-I curve if we consider the rate of photosynthesis as J. We have presented the fitting results of the EP model in the Supporting Information.
Materials and methods
Chl a fluorescence parameters were collected from seven different photosynthetic organisms. The detailed growth conditions, measurement methods, parameter settings, and fitting methods of the J-I curve for each of the photosynthetic species are described below:
(i) Abies alba Mill., which follows the C3 carboxylation pathway, was grown under high light (HL) condition representing 100% of full sun irradiation, and low light (LL) condition representing 40% of full sun irradiation in Poznan, western Poland. The Chl a fluorescence was determined using a fluorescence monitoring system (FMS 2, Hansatech, Norfolk, UK). The fully expanded current-year needles were subjected to a dark adaptation at room temperature (21-23 °C) for 30 minutes. The measurements of Chl a fluorescence were conducted using modulated and saturated light intensities set at 0.05 μmol photons m-2 s-1 and 15.3 mmol photons m-2 s-1, respectively. Other parameters of the instrument were set following the method of Robakowski et al. (2022). The electron transport rates (ETR) were calculated using the formula ETR = α × ΦPSII × PPF × 0.5, as proposed by Maxwell and Johnson (2000). Here, α refers to needle absorptance, ΦPSII denotes the quantum yield of PSII, PPF represents the photosynthetic photon flux of actinic light. Assumptions were made that the excitation energy is partitioned equally between the two photosystems (hence the factor of 0.5; Maxwell and Johnson, 2000).
(ii) Two rice (Oryza sativa L.) varieties, which follow the C3 carboxylation pathway, are Wufengyou 1326 and Ganfengyou 1326 (Ye et al., 2019). In 2014, the rice seedlings were planted at Jinggangshan University experimental farm in Ji’an city, Jiangxi Province, China. The farm had moderate soil fertility, and field management followed the local rice planting process, including regular water and timely weed control. Healthy rice flag leaves, with similar growth, were selected and tagged during the heading stage. The J level of the rice leaves at the dough stage was measured using a portable photosynthesis analyzer (LI-6400, Li-Cor INC. USA) with a fluorescence leaf chamber (LI-6400-40). The CO2 flow rate in the leaf chamber was set at 390 μmol mol-1, the temperature of the leaf chamber was set at 30 °C, and the photosynthetically active radiation (PAR) was set at 2000, 1800, 1600, 1400, 1200, 1000, 800, 600, 400, 200, 150, 100, 50 and 0 μmol photons m-2 s-1.
(iii) Triticum aestivum L., which follows the C3 carboxylation pathway, was ‘Qimai 22’. Seeds were sown in October 2011 with regular field management practices. When the wheat was in the flowering stage, healthy and similarly grown plants, randomly selected, were chosen for the measurement of Chl a fluorescence. The J-I curves of flag leaves were determined using a portable photosynthesis/fluorescence analyzer (LI-6400, Li-Cor INC. USA). The temperature in the leaf chamber was set at 33 °C, The CO2 flow rate was set at 380 μmol mol-1, and the PAR was set at 2000, 1800, 1600, 1400, 1200, 1000, 800, 600, 400, 200, 150, 100, 50 and 0 μmol photons m-2 s-1 (Kang et al., 2019).
(iv) The variety of Setaria italica L., which follows the C4 carboxylation pathway, used was ‘An 04’. The experiment was conducted at the experimental base of Shanxi Agricultural University in Taiyuan city, Shanxi Province, China. Seeds were sown in plastic barrels with a diameter and height of 0.28×0.26 m. After the seedlings had three true leaves, the experimental treatments were performed. Two moisture treatments were set: non-drought stress (normal watering) and drought stress. The relative leaf water content was used to measure the degree of drought stress on the plants. The fully expanded reverse second leaves were selected for measuring the J-I curves using a portable photosynthesis/fluorescence analyzer (LI-6400XT, Li-Cor INC. USA) during the heading stage. The CO2 flow rate was set at 500 μmol mol-1, and the PAR was set at 2000, 1800, 1600, 1200, 800, 600, 400, 200, 100 and 0 μmol photons m-2 s-1 during the measurement (Feng et al., 2022).
(v) In another experiment, Zea mays L., specifically the ‘KFJT-1’ variety with a C4 carboxylation pathway, was used. The seeds were sown in a growth chamber with a light intensity set at 1500 LUX after seeds germination. The daily light cycle consisted of 13 hours of light and 11 hours of darkness. After one month of plant growth, one healthy leaf was selected from each plant for Chl a fluorescence measurement using a portable photosynthesis/fluorescence measurement system (Li-6800-01A, Li-Cor INC. USA). The CO2 flow rate in the leaf chamber was set at 500 μmol mol-1, and the relative humidity was controlled at around 70%. The measurement was conducted using the built-in program of the instrument, with the light intensity gradient set at 2000, 1800, 1600, 1400, 1200, 1000, 800, 600, 400, 200, 150, 100, 50, 25 and 0 μmol photons m-2 s-1 (Wang et al., 2022).
(vi) The grain amaranth (Amaranthus hypochondriacus L.), which follows the C4 carboxylation pathway, was planted in the field at the Yucheng Comprehensive Experiment Station of the Chinese Academy of Sciences. The light intensity in this region usually reaches around 2000 μmol photons m-2 s-1 during the growing season. The seedlings were planted on June 15th 2012, and promptly watered during the entire experimental period. The Chl a fluorescence of the fully expanded sun-exposed leaves was measured using a portable photosynthesis/fluorescence analyzer (LI-6400, Li-Cor INC. USA) after 45 days of planting in the field. The J-I curves of the leaves were measured using the built-in program of the instrument, with the CO2 flow rate maintained at 380 μmol mol-1, the temperature of the leaf chamber at 35 °C, and the light intensity gradient set at 2000, 1800, 1600, 1400, 1200, 1000, 800, 600, 400, 200, 150, 100, 50, 25 and 0 μmol photons m-2 s-1 (Ye et al., 2020).
(vii) Microcystis aeruginosa FACHB905 used in our experiment, which follows C3 carboxylation pathway, was obtained from the Freshwater Algae Culture Collection of the Institute of Hydrobiology, Chinese Academy of Sciences. After two generations of propagation on BG11 medium, algal cells, in the mid-exponential growth phase, were collected for the experiment. The algal cells were subjected to starvation treatment and then inoculated into the BG11 medium, containing 10 ml g-1 of NO3–N (NaNO3) or 10 ml/g of NH4+-N (NH4Cl). When the algal density reached 1.8 × 10⁶ cells mL-1, the J-I curves of the algal were measured with the built-in program of a Phyto-PAM fluorescence monitoring system manufactured by Walz Germany (Yang et al., 2023).
Data processing and statistical analysis
The J–I curves (of Chl a fluorescence transient) of all the collected data have been fitted by the DE, NRH and mechanistic models to obtain the key parameters defining the J–I curves, using the Photosynthesis Model Simulation Software (PMSS), which is available in both Chinese and English versions (http://photosynthetic.sinaapp.com, Jinggangshan University, Ji’an).
All the statistical tests were performed using the SPSS 18.5 statistical software package (SPSS, Chicago, IL). Student’s t-test was used to test whether there were significant differences between the fitted and measured values of the quantitative traits, such as Jmax and Isat. Goodness of fit of the mathematical model to the experimental observations was assessed using the coefficient of determination (R2 = 1 – SSE/SST, where SST is the total sum of squares and SSE is the error sum of squares) with probability obtained in the analysis of variance.
Examples of model application
The mechanistic model of J–I curve of Chl a fluorescence can be described as (Ye et al., 2013a, b):
The definitions and units of the parameters in the Equation 1 are listed in the Table 1. According to Ye et al (Ye et al., 2013a, b), α’ was defined as the allocation coefficient of light energy between PSII and PSI (dimensionless); β’ was defined as the leaf light absorption coefficient (dimensionless); N0was defined as the total number of photosynthetic pigment molecules; σik was defined as the eigen-absorption cross-section of photosynthetic pigment molecule from ground state i to excited state k (unit: m2), representing the ability of plant pigment molecules to absorb light energy, and the values may vary among different plants and algae; φ was defined as the use efficiency of excitons transport reaction center PSII to cause charge separation at P680 (dimensionless); gi and gk were defined as the degeneration of energy level of photosynthetic pigment molecules in the ground state i and excited state k (dimensionless), respectively; ξ1, ξ2, and ξ3 were the occupation probabilities of photochemistry, non-radiation heat dissipation, and fluorescence (dimensionless), respectively; kP was defined as the rate of pigment molecules from the excited state k to the ground state i due to photochemical reaction (unit: s-1); kD was defined as the rate of pigment molecules from the excited state k to the ground state i due to non-radiation heat dissipation (unit: s-1); τ was defined as the average life-time of the photosynthetic pigment molecules in the excited state k (unit: s). α', β', N0, σik, φ, gi, gk, ξ1, ξ2, ξ3, kP, kD and τ in the mechanistic model are used to characterize the intrinsic properties of chlorophyll molecules, and their values vary and depend on photosynthetic species and environmental conditions. But for a given species under specific conditions, we can assume that (μmol electron (μmol photons)−1) was defined as the initial slope of the J–I curve, ((μmol photons)−1 m2 s) was defined as the “dynamic down-regulation term of PSII/photoinhibition”, and ((μmol photons)−1 m2 s) was defined as “the saturation term of photosynthesis” (Ye et al., 2013a, b). Then, the Equation 1 can be simplified as:
Taking the first derivative of Equation 2 yields the following formula:
Since the first derivative of Equation 3 can be equal to zero and its second derivative can be less than zero, we suggest that Equation 3 has critical points, which can be used to calculate the values of Isat and Jmax of photosynthetic organisms. Therefore, when setting Equation 3 equal to zero, the Isat can be calculated as:
Substituting Equation 4 into Equation 2, the Jmax can be calculated as:
According to Ye et al (Ye et al., 2013a, b), the coefficients in the mechanistic model have specific biological significance. (1) When I< Isat, J increases with increasing I. The slopes of this increasing part of curves can be compared among species or among ecotypes within the same species, under different environmental conditions or experimental treatments. This suggests that the response of J to increasing I can vary among species or among ecotypes within a species. (2) When I = Isat, J reaches its maximum value Jmax (Equation 5), the values of Jmax are species-specific and also vary within the species reflecting adaptation to the light environment. Different species may have different Jmax, indicating their specific abilities to utilize light for photosynthesis. (3) When I > Isat, the photosynthetic organisms undergo photoinhibitory/dynamic down-regulation of PSII, and J decreases with increasing I. The value of photoinhibition term (β, Equation 2) depends on species, intraspecific variation and environmental factors, especially on the light level. This is species-specific and provides the information about the species’ tolerance to the photoinhibitory conditions (high light, low temperature, drought). In summary, the species-specific differences in the response of J to increasing light intensity (I) and the values of Jmax and photoinhibition (β) in the mechanistic model indicate the specific biological adaptations and tolerances of different species to their light environments.
In Figure 1, we show the J–I curve (fitting with the mechanistic model) for three C3 species (i.e., Abies alba Mill., Oryza sativa L. and Triticum Aestivum L.), three C4 species (i.e., Setaria italica L., Zea mays L. and Amaranthus hypochondriacus L.) and for one cyanobacterium (Microcystis aeruginosa FACHB905). The three distinct parts of J–I curves such as the light-limited, light-saturated and photoinhibitory regions are shown for A. alba grown under LL (Figure 1A), for O. sativa grown under normal conditions (Figure 1B) and M. aeruginosa grown under two different nitrogen supplies (Figure 1F). On the other hand, A. alba grown under HL (Figure 1A), T. aestivum at 2% O2 (Figure 1C), S. italica under non-drought (normal water) conditions (Figure 1D) and Z. mays grown under normal conditions (Figure 1E) exhibited a small decline of the J level with increasing light intensity beyond the Isat. Data for T. aestivum at 21% O2 (Figure 1C), for S. italica under drought stress (Figure 1D) and Z. mays grown under normal conditions (Figure 1E) show that the J level hardly increases with increasing light intensity beyond the Isat. However, we note that the J level for T. aestivum at 21% O2 (Figure 1C) as well as for A. hypochondriacus grown under normal conditions (Figure 1E) reaches saturation at about 2000 μmol photons m−2 s−1. Moreover, the fitted curves demonstrate that the mechanistic model fits quite well the J–I curves of all the seven species, regardless of whether photoinhibition/dynamic down-regulation occurs, or not, and this with extremely good fits (R2 ≥ 0.994) (Figure 1; Table 2). Furthermore, the results fitted by the mechanistic model in Table 2 show that the photosynthetic parameters (e.g., Jmax and Isat) of the seven species are in very close agreement with their corresponding observed values, and that there is no significant difference between the fitted values of Jmax (and Isat) of the seven species and their corresponding observed values (Table 2; Supplementary Table S2).
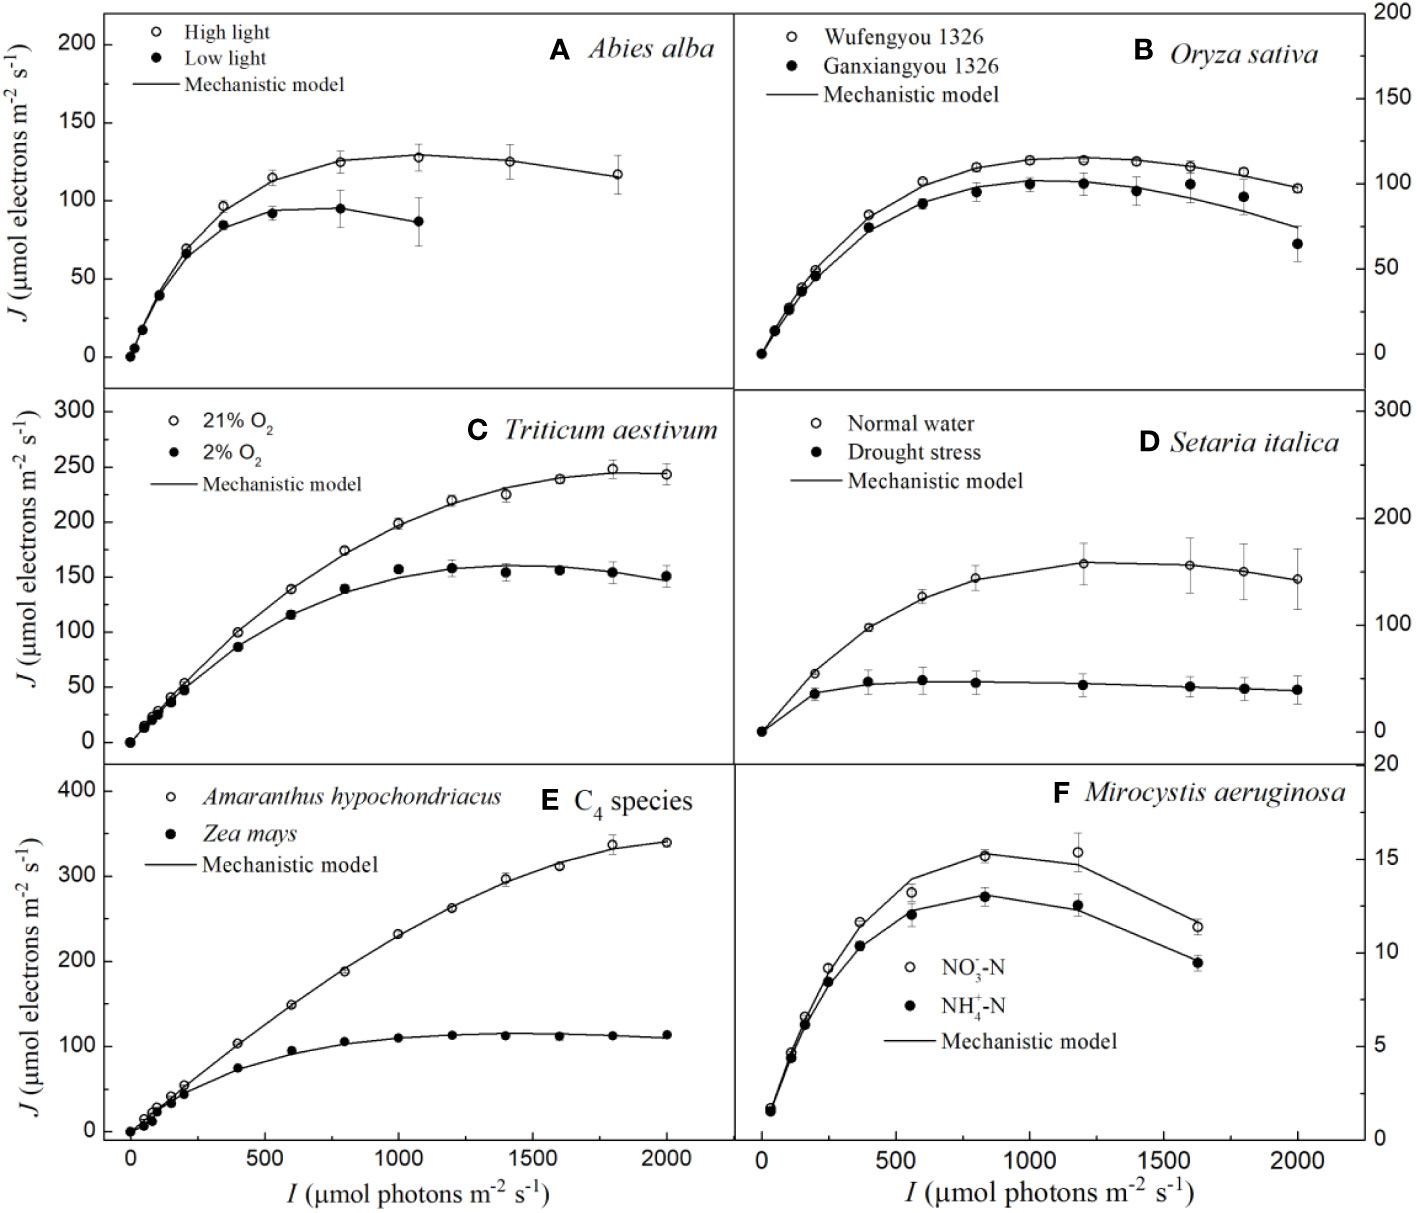
Figure 1 Light response curves of photosynthetic electron fitted by the mechanistic model for seven species under various environmental conditions (means ± SE, n = 3 - 6). A, Abies alba; B, Oryza sativa; C, Triticum aestivum; D, Setaria italica; E, C4 species; F, Microcystis aeruginosa.
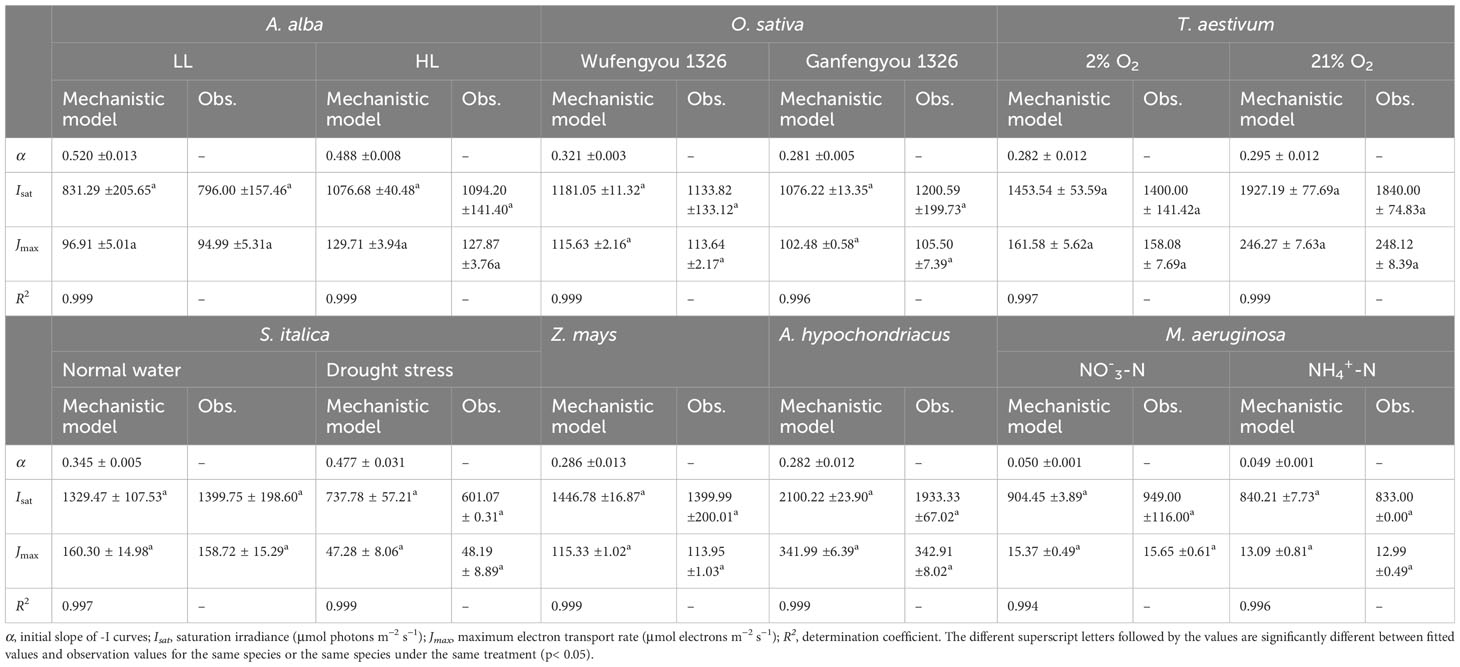
Table 2 Results fitted by the mechanistic model and observation values of photosynthetic parameters for seven species under various conditions (mean ± SE, n = 3-6).
We further conducted a comparison between the fits of the J–I curves obtained from our mechanistic model and those obtained from a highly classic DE model. We note that the DE model has been earlier used to simulate the J–I curves in algae and cyanobacteria (Platt et al., 1980; Harrison and Platt, 1986; Henley, 1993; Rascher et al., 2000; Ralph and Gademann, 2005; Karageorgou and Manetas, 2006; Yang et al., 2023), but rarely in plants due to differences in the physiology and light response characteristics of these photosynthetic species. The DE model is expressed as follows:
where, Js is a parameter reflecting the maximum, potential, light saturated J, α (>0) is the initial slope (μmol electrons (μmol photons)−1) of the J-I curve, β (>0; in μmol electrons (μmol photons)−1) is used to represent the photoinhibition term (Harrison and Platt, 1986) or dynamic down-regulation of PSII (Ralph and Gademann, 2005), obtained from the slope of the J–I, when the PSII activity decreases (Henley, 1993). If β = 0, Equation 6 becomes a single exponential model (Harrison and Platt, 1986). In this case, theoretically, Js must be equal to Jmax, but, it also means that the light intensity (Isat) at which the electron transport rate saturates (Jmax) cannot be calculated since there is no inflection point in the J-I curve fitted by the single exponential to determine a saturation point.
Based on Equation 6, the parameters Isat and Jmax were calculated by Equation 7 and Equation 8, respectively:
And
We note that the DE model has been widely used to fit the J–I curves of algae and cyanobacterium (Platt et al., 1980; Harrison and Platt, 1986; Henley, 1993; Ralph and Gademann, 2005). Our results show that although it simulates J–I curves of plants well with high R2, it significantly overestimates both Jmax and Isat for A. hypochondriacus growing under normal conditions (Figure 2, Table 3). Further, there is a significant difference between the estimated Jmax and Isat and their corresponding observed values (Tables 3, S2). On the other hand, for M. aeruginosa grown under NH+4-N supply, the model significantly underestimates Isat (Table 3; Supplementary Table S2). Although Isat and Jmax can be calculated by Equation 7 and Equation 8, respectively, and there are no significant differences between the estimated and the observed values of Isat and Jmax for all the species except for A. hypochondriacus growing under normal conditions, and for M. aeruginosa grown under NH+4-N supply (for Isat), Js estimated by the DE model is significantly greater than the Jmax (Table 3), especially for T. aestivum (grown at 2% O2 and 21% O2), Z. mays (grown under normal conditions), and even M. aeruginosa (grown under different nitrogen treatments) (Table 3). For instance, for T. aestivum, grown at 2% O2 and 21% O2, the values of Js estimated by the DE model are 4.81×10⁶ and 1.10×10⁷ μmol photons m−2 s−1 (Table 3), respectively. However, for T. aestivum, grown at 2% O2 and 21% O2, the observed values of Jmax are 158.08(± 7.69) and 248.12 (± 8.39) μmol photons m−2 s−1, respectively. In addition, when we fit the J–I curves of T. aestivum (grown at 2% O2 and 21% O2) by a single exponential model (), the values of Jmax are 164.55 and 280.25 μmol photons m−2 s−1, respectively. For O. sativa cv Ganfengyou 1326 (grown under normal conditions), Js estimated by the DE model is 75.56 (±5.89) μmol photons m−2 s−1, which is, however, significantly lower than its observed value of Jmax (105.50 (±7.39) μmol photons m−2 s−1) (Table 3).
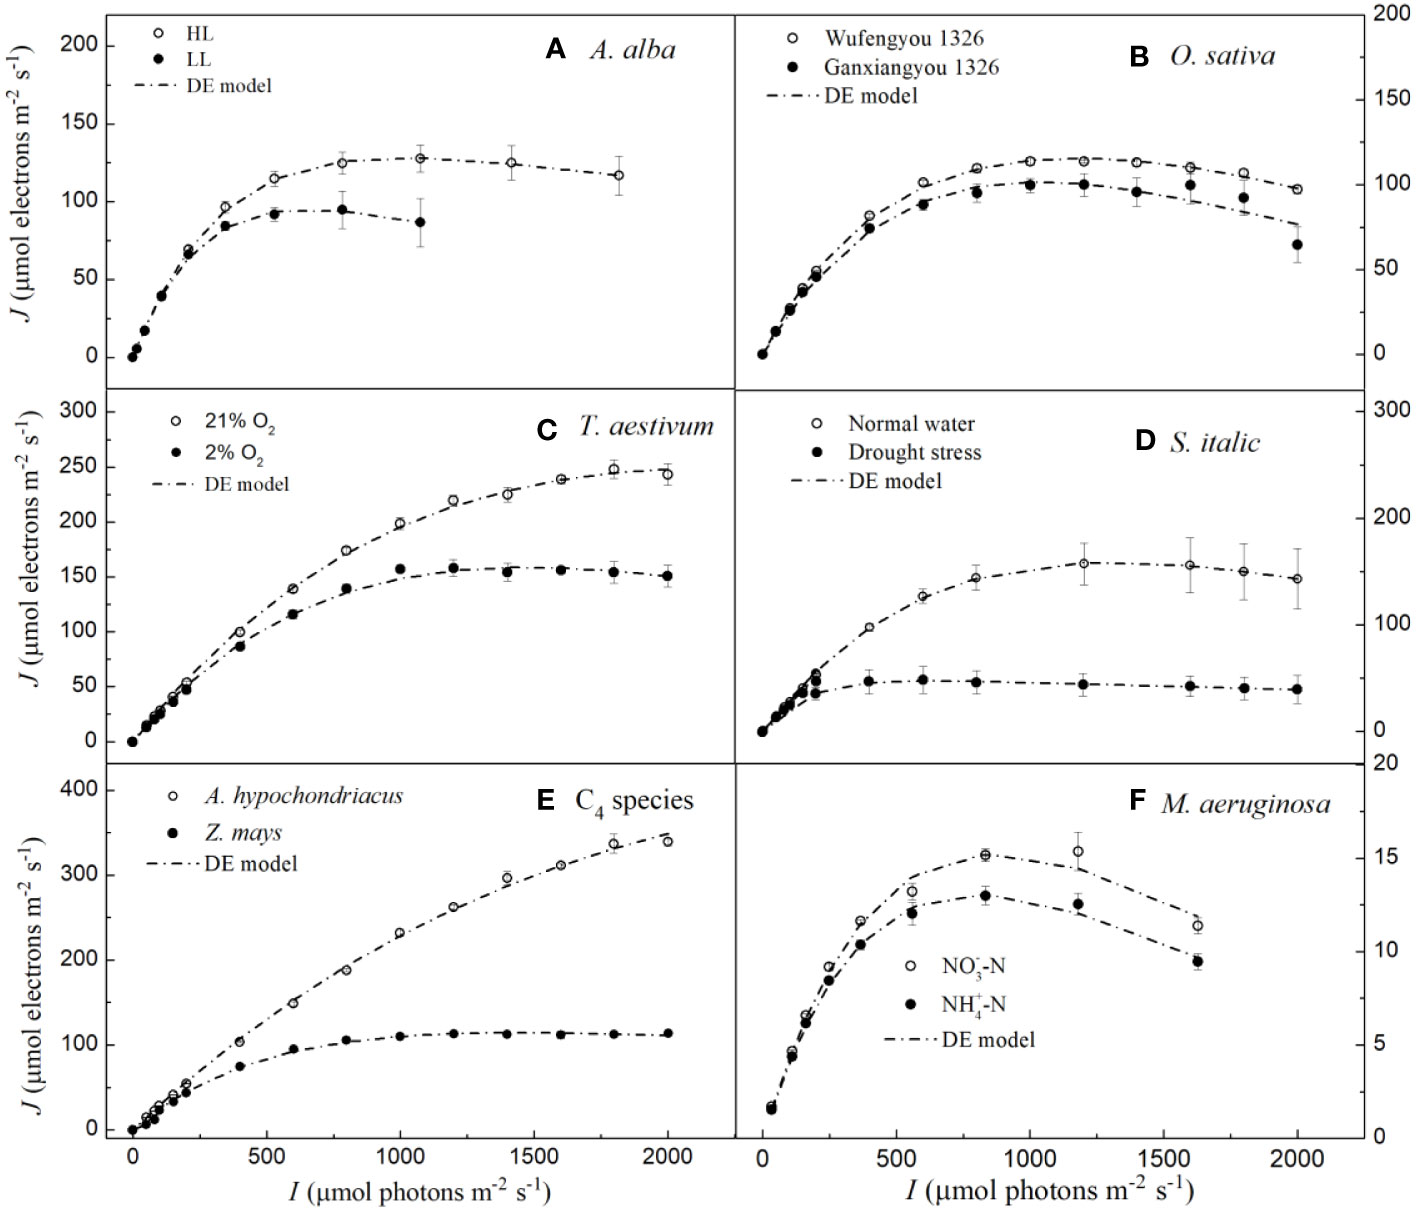
Figure 2 Light response curves of photosynthetic electron fitted by the DE model for seven species under various environmental conditions (means ± SE, n = 3 - 6). A, Abies alba; B, Oryza sativa; C, Triticum aestivum; D, Setaria italica; E, C4 species; F, Microcystis aeruginosa.
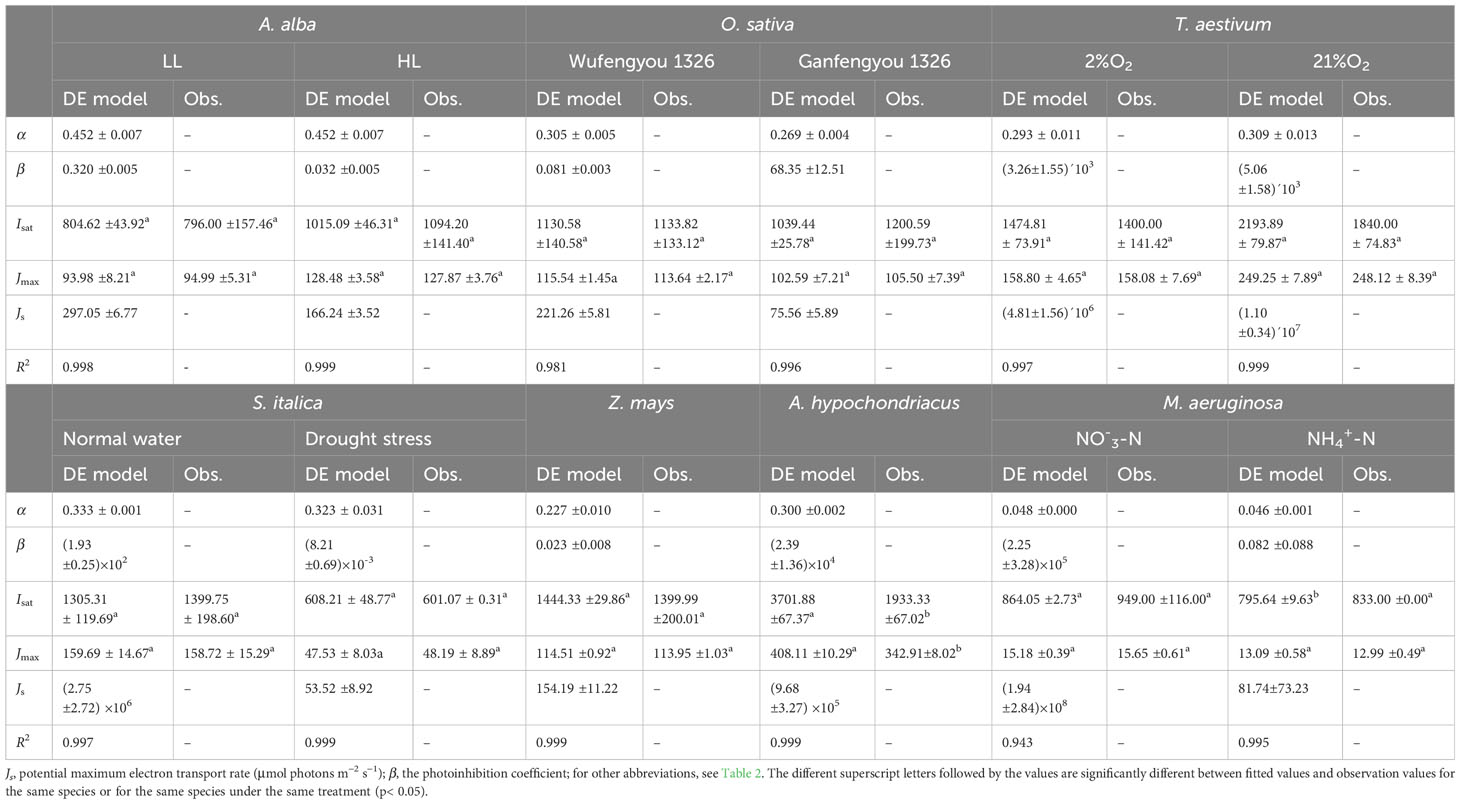
Table 3 Results fitted by DE model and observation values of photosynthetic parameters for seven species under various conditions (mean ± SE, n = 3-6).
Compared with the DE model which has been widely used to fit J–I curves of algae and cyanobacteria, the NRH model (von Caemmerer, 2000) has been mainly used to fit the J–I curves of plants (von Caemmerer, 2000; Long and Bernacchi, 2003; Miao et al., 2009; Gu et al., 2010; Bernacchi et al., 2013; von Caemmerer, 2013; Buckley and Diaz-Espejo, 2015; Cai et al., 2018; Yin et al., 2021). The NRH model gives the values of ‘J’ and dJ/dI (Equation 9 and Equation 10, respectively; for further information, see von Caemmerer (von Caemmerer, 2000, 2013) and Yin et al. (2021)).
where, α is the initial slope of the J–I curve (μmol electrons (μmol photons)−1), and θ (0<θ<1) is the curve convexity.
The first derivative of Equation 9 is:
where, dJ/dI equals to α if I is zero, and dJ/dI >0 if I>0. We note that Equation 9 is an asymptote function that fails to determine the Isat.
In Figure 3, we can observe that the NRH model fails to fit the J-I curves of the plant species and cyanobacteria under dynamic down-regulation of PSII/photoinhibition conditions, and it overestimates Jmax for T. aestivum grown at 21% O2 and A. hypochondriacus grown under normal conditions, and there is a significant difference between the estimated and observed Jmax values for each species (p< 0.05) (Table 4; Supplementary Table S2). Moreover, this model significantly underestimates Jmax for M. aeruginosa grown under NO-3-N supply, with a notable discrepancy between the estimated and observed Jmax values (p< 0.05) (Table 4). In addition, this model fails to accurately represent the distinct characteristics of the J–I curves observed in A. alba (Figure 3A), O. sativa (Figure 3B), and M. aeruginosa (Figure 3F), where the J–I curves evidently exhibit a decline as I increases beyond Isat. However, compared with the DE and NRH models, our results show that the mechanistic model not only simulates well (R2≥0.994) all the J–I curves for different photosynthesis organisms under various environmental conditions (Figures 1-3), but also provides both Jmax and Isat which are very close to the corresponding observed values (Table 2; Supplementary Table S2).
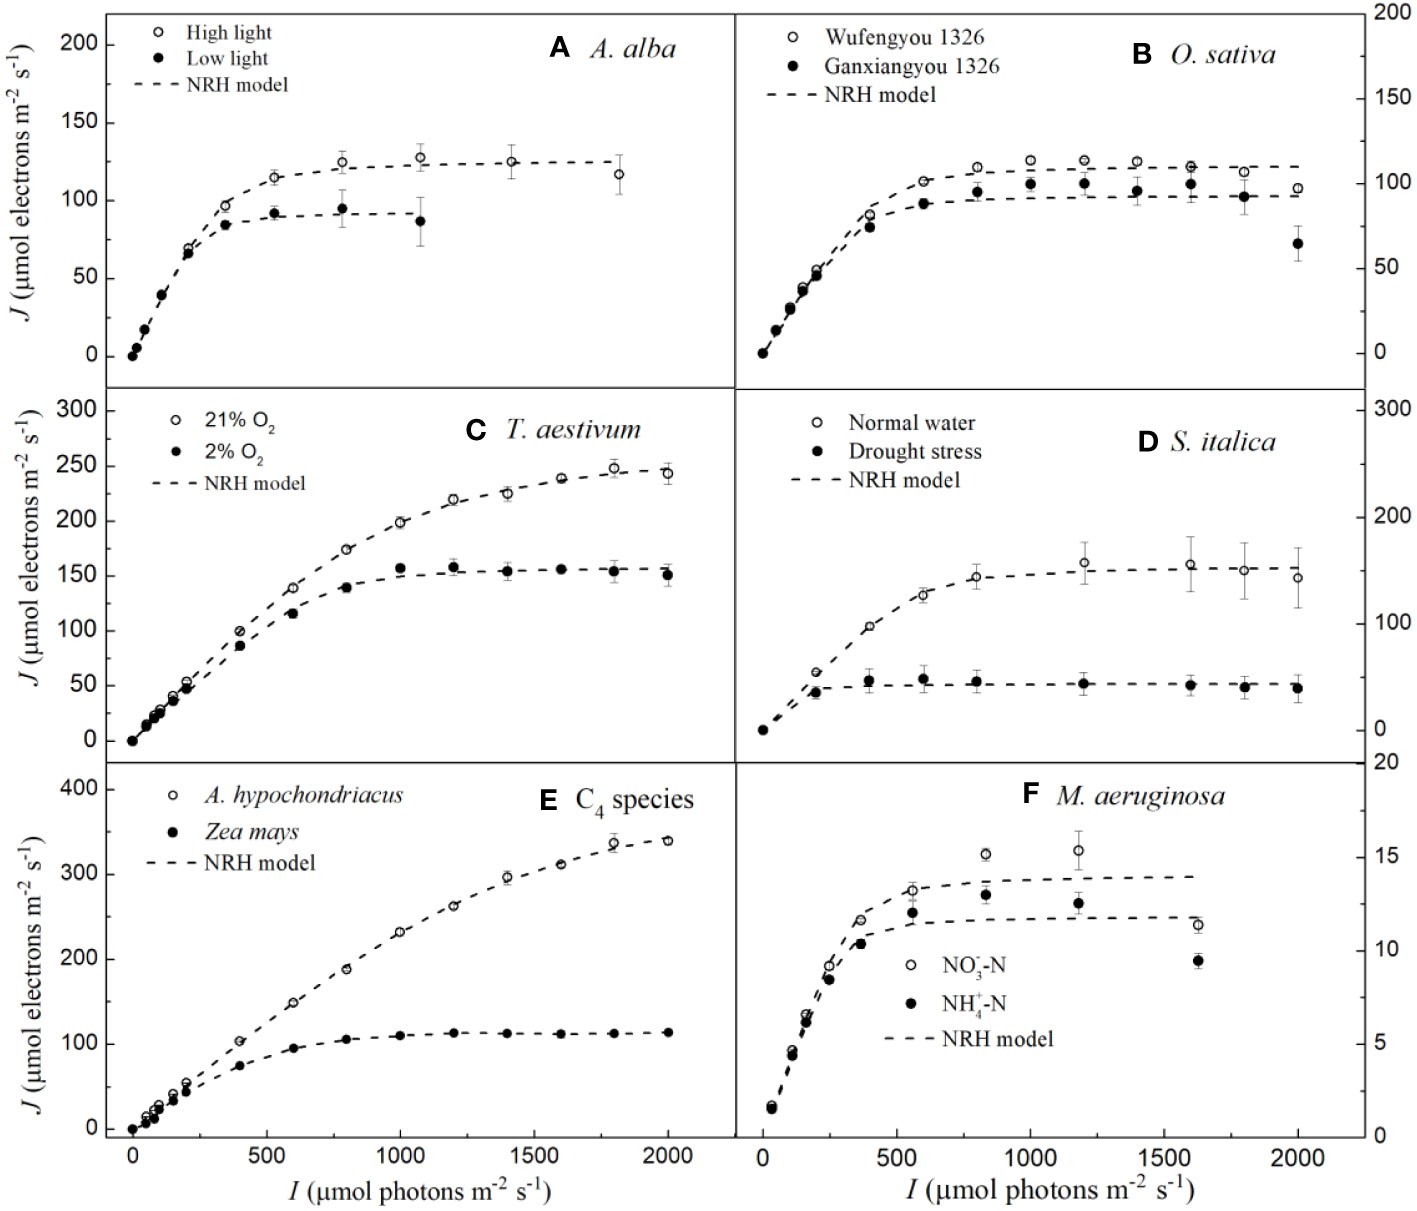
Figure 3 Light response curves of photosynthetic electron fitted by the NRH model for seven species under various environmental conditions (means ± SE, n = 3 - 6). A, Abies alba; B, Oryza sativa; C, Triticum aestivum; D, Setaria italica; E, C4 species; F, Microcystis aeruginosa.
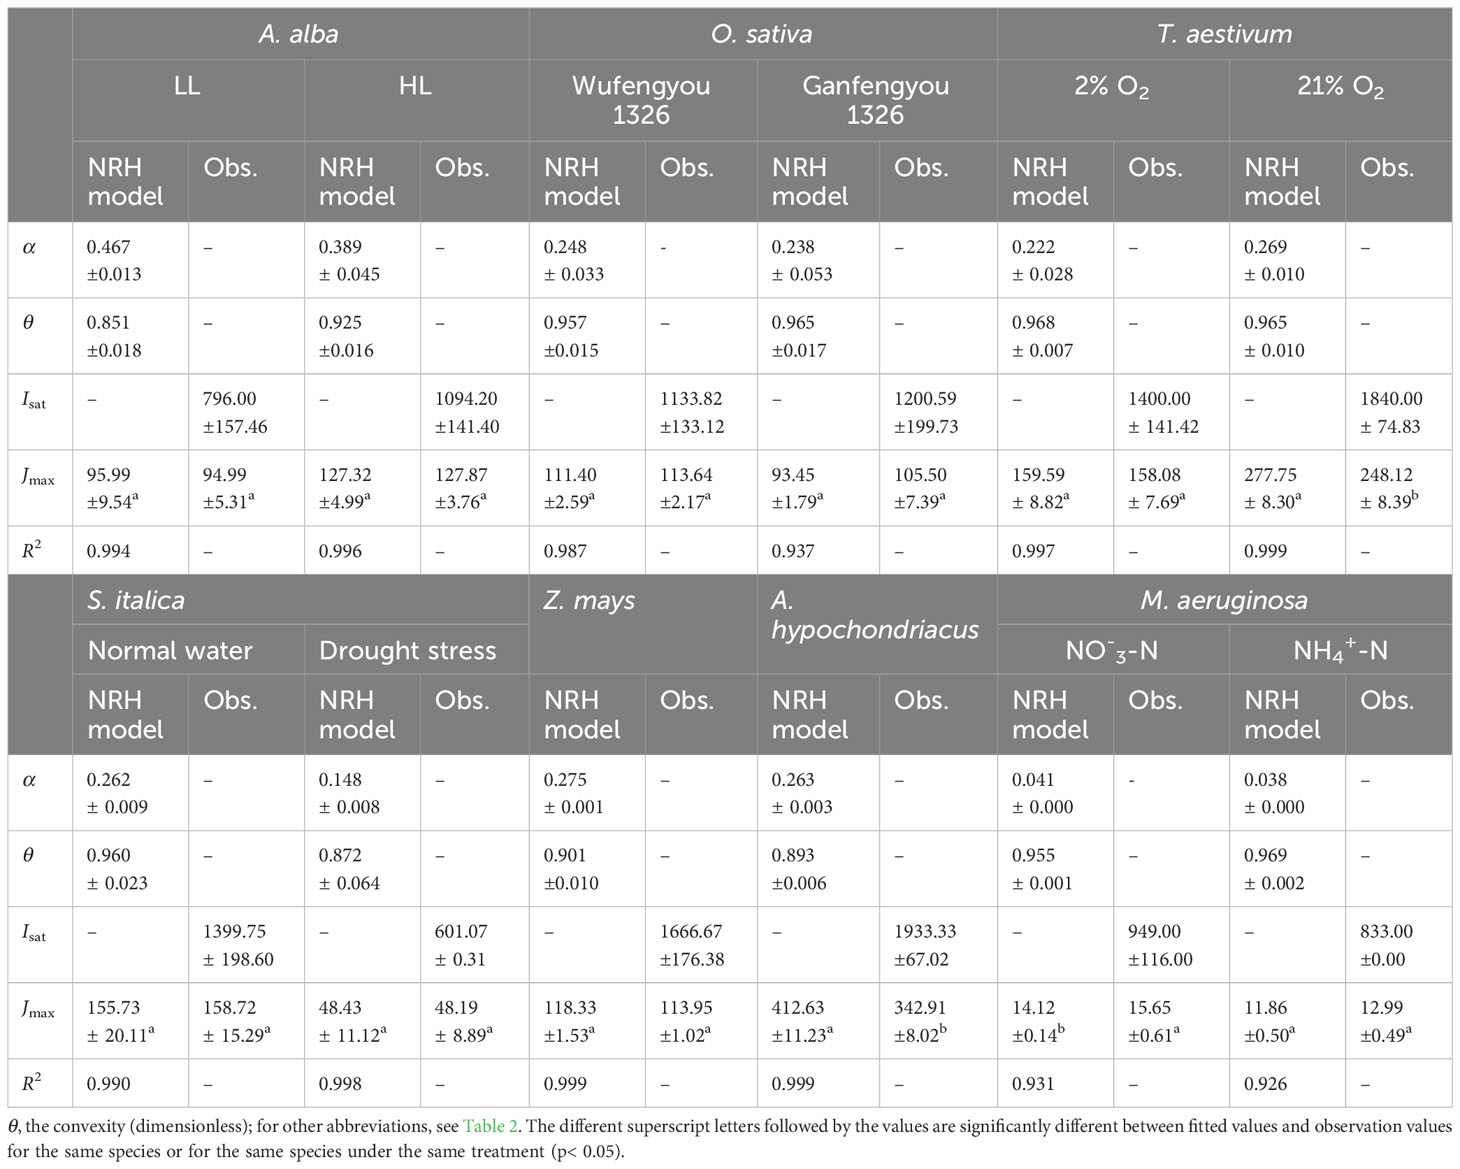
Table 4 Results fitted by NRH model and observation values of photosynthetic parameters for seven species under various conditions (mean ± SE, n = 3-6).
Discussion
According to Ralph and Gademann (2005), the Chl a fluorescence transient J–I curves of algae and cyanobacteria may be divided into three distinct parts depending on the level of light intensity used to illuminate the samples; these include light-limited, light-saturated, and photoinhibitory regions/dynamic down-regulation of PSII. We refer the readers to the J–I curves of plants, i.e., the section without light-saturated region in T. aestivum grown at 21% O2 (Figures 1C, 2C, 3C), in A. hypochondriacus grown under normal conditions (Figures 1E, 2E, 3E), but without obvious photoinhibitory regions/dynamic down-regulation of PSII for S. italica grown under drought stress (Figures 1D, 2D, 3D), and in Z. mays grown under normal conditions (Figures 1E, 2E, 3E). These results indicate that the J–I curves of plants are much more complex compared to those of algae and cyanobacteria. The main reason for this difference is considered to be related to the living environment and evolution of plants and algae. Algae have evolved to adapt to low-intensity light in aquatic environments over a long period of time, and therefore, their saturation light intensity is generally lower than 1000 μmol photons m−2 s−1 (Ralph and Gademann, 2005; Karageorgou and Manetas, 2006; Yang et al., 2023). On the other hand, plants have evolved differently to adapt to terrestrial environments, leading to significant differences in their saturation light intensity. In this study, the saturation light intensity for S. italica grown under drought stress fitted by the mechanistic model was 737.78 μmol photons m−2 s−1, while for A. hypochondriacus grown under normal conditions it was as high as 2100.22 μmol photons m−2 s−1 (Table 2). Therefore, when measuring J-I curves, if the experimental conditions set the light intensity below 2000 μmol photons m−2 s−1, The J-I curves of some plant species may not show obvious photoinhibitory regions/dynamic down-regulation of PSII. Similar findings have also been observed previously on Capsicum annuum L. and Laminaria hyperborea [(Gunnerus) Foslie, 1884] (Liang et al., 2018; Yang et al., 2018).
Although many models of the J–I curves have been developed over the years (Stirbet et al., 2024), it is still unclear what criteria a model should fulfill to be considered as close to a perfect one. To our knowledge, a complete model for the J–I curves should meet all the following requirements. It should (1) give good fits for all types of J–I curves for photosynthetic organisms under different environmental conditions; (2) provide estimates of photosynthetic parameters (e.g., Isat and Jmax) that are close to the corresponding measured values without any significant differences; and (3) provide the parameters or coefficients that have clear biological significance. Although the EP model has been considered to be an excellent model for fitting J-I curves of algae and phytoplankton, and incorporated into chlorophyll fluorescence instruments (WalZ, Germany), providing parameters such as the maximum rate of photosynthetic production (Pm), the optimal and characteristic light intensities (Im and Ik), and α, but it has rarely been used for fitting the J-I curves of plants (Eilers and Peeters, 1988; Schreiber and Klughammer, 2013). However, this model fails to accurately represent the distinct characteristic of the J-I curves observed in O. sativa cv Ganfengyou 1326 grown under normal condition and M. aeruginosa grown under different nitrogen treatments, where the J-I curves evidently exhibit a decline as I increases beyond Isat (Supplementary Figure S1). Furthermore, unlike the DE and EP models which are constructed with photosynthetic factory or photosynthetic units as the basic unit (Platt et al., 1980; Eilers and Peeters, 1988), the mechanistic model is built based on individual photosynthetic pigment molecules (Ye et al., 2013a, b). In addition to accurately and precisely calculate the parameters of Jmax and Isat for different photosynthetic organisms under various environmental conditions (Table 2), the mechanistic model can also obtain certain parameters that reflect the intrinsic characteristics of photosynthetic pigment molecules, such as the number of photosynthetic pigment molecules in the excited state (Nk), the eigen-absorption cross-section of photosynthetic pigment molecule from ground state i to excited state k (σik), the effective optical absorption cross-section of photosynthetic pigment molecule from ground state i to excited state k (σ’ik), and the minimum average life-time of photosynthetic pigment molecules in the excited state k (τmin) (Ye et al., 2013b, 2019; He et al., 2020). The mechanistic models can not only fit the J/I curves of algae (Liang et al., 2018; Yang et al., 2023), but also fit the J/I curves of higher plants under various environmental conditions (Sun et al., 2015; He et al., 2020; Ye et al., 2020; Wang et al., 2022). Therefore, based on the fact that the DE, EP, and NRH models are only applicable to either algae or plants and provide limited parameters, the mechanistic model has the potential to become an ideal model for fitting J-I curves of different photosynthetic organisms (including C3, C4 plants and algae) under various environmental conditions.
A number of studies have previously compared the parameters obtained from different J–I models in algae and cyanobacteria (Jassby and Platt, 1976; Frennette et al., 1993). Alternative models, such as the DE model, have given different fitting effects (Frennette et al., 1993; Yang et al., 2018). Previous studies have indicated that the fitting performance of the DE model in estimating Jmax and Isat mainly depends on whether dynamic down-regulation of the PSII occurs in plants, algae and cyanobacteria (Suggett et al., 2007; Buckley and Diaz-Espejo, 2015). In this study, our results show that the DE model can fit the J–I curves well for all the studied species, regardless of photoinhibition/dynamic down-regulation of PSII (Figure 1); however, this model significantly overestimates both Isat and Jmax for A. hypochondriacus grown under normal conditions and underestimates Isat for M. aeruginosa grown under NH+4-N supply (Table 3, Supplementary Table S2). More importantly, although Js is termed as the maximum, potential, light saturated J, the values of Js estimated by this model are significantly greater than the observed values of Jmax except for S. italica gown under drought stress and O. sativa cv Ganfengyou 1326 grown under normal conditions, specially, for T. aestivum (grown at 2% O2 and 21% O2), Z. mays (grown under normal conditions), and M. aeruginosa (grown under different nitrogen treatments) (Table 3). For instance, when T. aestivum is grown at 21% O2, the value of Js estimated by the DE model is 1.10×10⁷ μmol photons m−2 s−1, whereas the observed value of Jmax is 248.12 (± 8.39) μmol photons m−2 s−1. In addition, if J–I curves of T. aestivum at 21% O2 are fitted by the single exponential model, the value of Jmax is 280.25 μmol photons m−2 s−1. Previous studies suggest that although the Js in plants and algae vary among different species and environmental conditions, its value is generally expected to be the similar to Jmax and lower than 103 μmol electrons m−2 s−1 (Buckley and Farquhar, 2004; Baker, 2008; Feng et al., 2022). In our study, however, the value of Js is unexpectedly high attaining up to 108 μmol electrons m−2 s−1 (Table 3). On the other hand, for O. sativa cv Ganfengyou 1326 (grown under normal conditions), Js estimated by the DE model is 75.56 (±5.89) μmol photons m−2 s−1, which is significantly lower than its observed value of Jmax (105.50 (±7.39) μmol photons m−2 s−1) (Table 3). Some other studies have also indicated that Js in the DE model is not a potentially real Jmax, but only a coefficient without any biological significance, and the role of the parameter introduced for Js in Equation 6 is simply to facilitate the calculation of Jmax and Isat (Buckley and Farquhar, 2004; Suggett et al., 2007). To our knowledge, there are only a few case studies in which the values of Js have been reported when the J–I curves of algae and cyanobacteria were simulated by the DE model (Suggett et al., 2007; Buckley and Diaz-Espejo, 2015; Liang et al., 2018). The possible reason why Js has rarely been discussed in the literature may be due to the challenges in explaining its biological meaning when its value is evidently higher or lower than the observed Jmax.
The value of photoinhibition coefficient (β) in the DE model may vary in different photosynthetic organisms under various environmental conditions (Harrison and Platt, 1986). Generally, the value of β falls within the range of 0.05 to 0.2 μmol electrons (μmol photons)−1 (Harrison and Platt, 1986; Ralph and Gademann, 2005). However, our results demonstrate that the estimated value of β obtained from fitting the DE model is exceptionally high, reaching up to 105 for M. aeruginosa grown under NO-3-N supply, as presented in Table 3. Similar to the Js, it is challenging to comprehend the biological significance of β in the DE model. Consequently, the DE model is not an appropriate model for fitting J–I curves and for estimating Jmax and Isat, as well as for interpreting the biological significance of coefficients Js and β in the model.
The NRH model has been a sub-model in the FvCB model when irradiance is below the saturation level (Long and Bernacchi, 2003; Buckley and Farquhar, 2004; Sharkey et al., 2007; Miao et al., 2009; Yin et al., 2009; Gu et al., 2010; Bernacchi et al., 2013; von Caemmerer, 2013; Park et al., 2016; Cai et al., 2018; Yin et al., 2021). This model has been widely used in studies on various C3 plants under different environmental conditions, but it has been rarely used to fit the J–I curves of algae and cyanobacteria (von Caemmerer, 2000; Long and Bernacchi, 2003; Miao et al., 2009; Gu et al., 2010; Bernacchi et al., 2013; von Caemmerer, 2013; Buckley and Diaz-Espejo, 2015; Cai et al., 2018; Yin et al., 2021). In this study, we find that this model can well simulate the J–I curves without PSII dynamic down-regulation/photoinhibition in T. aestivum at two different O2 concentrations (Figure 3C), in S. italica grown under drought stress (Figure 3D), and in Z. mays and A. hypochondriacus grown under normal conditions (Figure 3E), all with extremely good fits (R2≥0.997), but it poorly characterizes the J–I curves with PSII dynamic down-regulation/photoinhibition for A. alba under HL (Figure 3A), O. sativa grown under normal conditions (Figure 3B) and M. aeruginosa under different nitrogen treatments (Figure 3F). The reason behind this mainly lies in the fact that the NRH model is a function without a maximum value, representing an asymptotic line without inflection points. As a result, the NRH model can poorly characterize the J–I curves of higher plant species and of algae with PSII dynamic down-regulation/photoinhibition. In addition, for T. aestivum grown at 21% O2 concentration (Figure 3C), and for A. hypochondriacus grown under normal conditions (Figure 3E) without PSII dynamic down-regulation/photoinhibition, the NRH model overestimates the values of Jmax, especially for A. hypochondriacus grown under normal conditions (Tables 4, S2). The fitted results, depicted here, are consistent with the findings of earlier studies (Buckley and Diaz-Espejo, 2015; Ye et al., 2019). Meanwhile, this model underestimates the Jmax for M. aeruginosa grown under NO-3-N supply (Table 4; Supplementary Table S2). In addition, for A. alba grown under HL and LL (Figure 3A), O. sativa grown under normal conditions (Figure 3B), S. italica grown under drought stress (Figure 3D) and M. aeruginosa grown under NO3–N and NH4+-N supplies (Figure 3F), the curves fitted by the NRH model deviate from the measurements on the J–I curves, especially for M. aeruginosa (Figure 3F). More importantly, this model fails to estimate Isat accurately due to its asymptote nature without an extreme value. At the same time, the NRH model is also unsuitable for accurately estimating the values of Jmax and determining the value of Isat (Table 4, Supplementary Table S2). Therefore, we can conclude that the NRH model is not a good choice for fitting the J–I curves.
Although the EP model is primarily used to fit I response to the rate of photosynthesis (Eilers and Peeters, 1988; Schreiber and Klughammer, 2013), it can also be used to fit J-I curves for different photosynthetic organisms if photosynthesis is replaced by electron transport rate (J). From the fitting results of this study, it can be seen that the EP model can fit the J-I curves of plants or algae under photoinhibition/dynamic down-regulation (Supplementary Figure S1). For example, the EP model can fit the J-I curves of Ganfengyou 1326 (R2 = 0.973) and M. aeruginosa (R2 = 0.976 or 0.989) under photoinhibition/dynamic down-regulation, and the fitting coefficients for the J-I curves of other plants in this study showed extremely good fits (R2 ≥ 0.996). Furthermore, except for significantly overestimating the values of Isat for A. hypochondriacus grown under normal conditions, and significantly underestimating the values of Isat for M. aeruginosa grown under NH4+-N supply (Supplementary Tables S1, S2), the values of Jmax and Isat fitted by the EP model were very close to their corresponding observed values for the other plant species (Supplementary Table S1). However, considering that the EP model, like the DE, is based on the photosynthetic factory or photosynthetic unit as the basic unit, the relationship between these coefficients of k, α, β, γ, and δ in the model and the characteristics of photosynthetic pigment molecules are unknown (Eilers and Peeters, 1988). In addition, we found that b is a negative value for A. hypochondriacus, and it must be positive in the model (Eilers and Peeters, 1988). Consequently, it is not a perfect model for fitting J-I curves of different photosynthetic organisms under various environmental conditions.
Compared with the DE and NRH models, fitting the mechanistic model to previously collected data not only yielded excellent fits (R2≥0.994), but also provided the values of Jmax and Isat which were very close to their corresponding observed values (Table 2). Moreover, no significant differences were found between the fitted values for Jmax (and Isat) and their corresponding observed values (p< 0.05; Table 2). Our results are consistent with the findings of earlier studies (Ye et al., 2013a, 2016; Robakowski et al., 2018; Yang et al., 2018; Ye et al., 2019; Zuo et al., 2019; Ye et al., 2020; Hu et al., 2021; He et al., 2022; Robakowski et al., 2022; Yang et al., 2023). In addition, previous results have also demonstrated that this model is suitable for fitting the J–I curves of algae and cyanobacteria (Ye et al., 2013a; Liang et al., 2018; Yang et al., 2023). The aforementioned results indicate that the mechanistic model is not only appropriate for fitting the J–I curves, but also for estimating the values of both Jmax and Isat regardless of the dynamic down-regulation/photoinhibition in different photosynthetic organism under various environmental conditions. In addition, the three coefficients (i.e., α, β and γ) in the model have clear biological significance. Our results, in this study, demonstrate that the mechanistic model is much more universal than both the NRH and DE models; therefore, it is the optimal option for fitting J–I curves (Figures 1-3), and for estimating the values of Jmax and of Isat for different photosynthetic organisms under various environmental conditions (Tables 2-4).
In conclusion, our results show that the mechanistic model can address the limitations observed in both the DE and NRH models. Our current study highlights the robustness of the mechanistic model in accurately characterizing the J–I curves of seven species under various environmental conditions (Figures 1-3).This contributes significantly to our comprehension of leaf-scale modelling of J–I relations, especially in (1) reproducing the entire curves from low to high I levels for different photosynthetic organisms under various environmental conditions, and (2) obtaining key measurable parameters (e.g., Jmax and Isat) derived from the J–I curve for different plants, algae and cyanobacteria, grown under various environmental conditions (Table 2).
To facilitate the utilization of our mechanistic model of the J−I curve by other researchers, we have developed and exploited a Photosynthesis Model Simulation Software (PMSS) with both Chinese and English versions (http://photosynthetic.sinaapp.com). In PMSS, users can access various models (including classical model, such as rectangular hyperbolic model, non-rectangular hyperbolic model, exponential model, double exponential model, Eilers-Peeters model), e.g., light and CO2-response models of photosynthesis, electron transport rate, instantaneous water-use efficiency (defined as A/Tr; A, net photosynthesis rate; Tr, transpiration rate), and intrinsic water-use efficiency (defined as A/gs; A, net photosynthesis rate; gs, stomatal conductance). These models are useful mathematical tools for studying the photosynthetic characteristics of plants, algae, and cyanobacteria, as well as for estimating their key photosynthetic parameters.
Data availability statement
The original contributions presented in the study are included in the article/Supplementary Material. Further inquiries can be directed to the corresponding authors.
Author contributions
Z-PY: Conceptualization, Formal Analysis, Funding acquisition, Resources, Writing – original draft, Writing – review & editing. TA: Data curation, Investigation, Writing – review & editing. GG: Writing – review & editing. PR: Data curation, Investigation, Writing – review & editing. AS: Data curation, Investigation, Writing – review & editing. X-LY: Investigation, Visualization, Writing – review & editing. X-YH: Data curation, Investigation, Writing – review & editing. H-JK: Conceptualization, Data curation, Formal Analysis, Investigation, Writing – review & editing. F-BW: Conceptualization, Data curation, Investigation, Writing – original draft, Writing – review & editing.
Funding
The author(s) declare financial support was received for the research, authorship, and/or publication of this article. This research was supported by the Natural Science Foundation of China (Grant No. 32260063 and 31960054), and the Natural Science Foundation of Jiangxi Province (Grant No.20224BAB205020).
Acknowledgments
Govindjee acknowledges computational help he received from the office of Information Technology of the School of Integrative Biology, University of Illinois at Urbana- Champaign.
Conflict of interest
The authors declare that the research was conducted in the absence of any commercial or financial relationships that could be construed as a potential conflict of interest.
Publisher’s note
All claims expressed in this article are solely those of the authors and do not necessarily represent those of their affiliated organizations, or those of the publisher, the editors and the reviewers. Any product that may be evaluated in this article, or claim that may be made by its manufacturer, is not guaranteed or endorsed by the publisher.
Supplementary material
The Supplementary Material for this article can be found online at: https://www.frontiersin.org/articles/10.3389/fpls.2024.1332875/full#supplementary-material
References
Ahammed, G. J., Xu, W., Liu, A., Chen, S. (2018). COMT1 silencing aggravates heat stress-induced reduction in photosynthesis by decreasing chlorophyll content, photosystem II activity and electron transport efficiency in tomato. Front. Plant Sci. 9. doi: 10.3389/fpls.2018.00998
Baker, N. R. (2008). Chlorophyll fluorescence: a probe of photosynthesis in vivo. Annu. Rev. Plant Biol. 59, 89–113. doi: 10.1146/annurev.arplant.59.032607.092759
Bernacchi, C. J., Bagley, J. E., Serbin, S. P., Ruiz-Vera, U. M., Rosenthal, D. M., Vanloocke, A. (2013). Modelling C3 photosynthesis from the chloroplast to the ecosystem. Plant Cell Environ. 36, 1641–1657. doi: 10.1111/pce.12118
Buckley, T. N., Diaz-Espejo, A. (2015). Reporting estimates of maximum potential electron transport rate. New Phytol. 205, 14–17. doi: 10.1111/nph.13018
Buckley, T. N., Farquhar, G. D. (2004). A new analytical model for whole-leaf potential electron transport rate. Plant Cell Environ. 27, 1487–1502. doi: 10.1111/j.1365-3040.2004.01232.x
Cai, C., Li, G., Yang, H. L., Yang, J., Liu, H., Struik, P. C., et al. (2018). Do all leaf photosynthesis parameters of rice acclimate to elevated CO2, elevated temperature, and their combination, in FACE environments? Global Change Biol. 24, 1685–1707. doi: 10.1111/gcb.13961
Chang, T. G., Wei, Z. W., Shi, Z., Xiao, Y., Zhao, H., Chang, S. Q., et al. (2023). Bridging photosynthesis and crop yield formation with a mechanistic model of whole-plant carbon nitrogen interaction. Plants 5, 1–19. doi: 10.1093/insilicoplants/diad011
Eilers, P. H. C., Peeters, J. C. H. (1988). A model for the relationship between light internsity and the rate of photosynthesis in phytoplankton. Ecol. Model. 42, 199–215. doi: 10.1016/0304-3800(88)90057-9
Farquhar, G. D., von Caemmerer, S., Berry, J. A. (1980). A biochemical model of photosynthetic CO2 assimilation in leaves of C3 species. Planta 149, 78–90. doi: 10.1007/bf00386231
Feng, Y. N., Wang, Y. B., Ren, H. F., Zhang, D. S., Zong, Y. Z., Shi, X. R., et al. (2022). Mechanism of the effect of elevated CO2 concentration on mitigating drought stress in foxtail millet. J. China Agr Univ 27, 43–57. doi: 10.11841/j.issn.1007-4333
Frenette, J. J., Demers, S., Legendre, L., Dodson, J. (1993). Lack of agreement among models for estimating the photosynthetic parameters. Limnol Oceanogr. 38, 679–687. doi: 10.4319/lo.1993.38.3.0679
Govindjee, G. (1990). Photosystem II heterogeneity: the acceptor side. Photosynth Res. 25, 151–160. doi: 10.1007/bf00033157
Govindjee, G. (2004). “Chlorophyll a fluorescence: a bit of basics and history,” in chlorophyll a fluorescence: a signature of photosynthesis. Eds. Papageorgiou, G. C., Govindjee (Kluwer Academic (now Springer, Dordrecht, Netherlands), 1–42.
Gu, L., Pallardy, S. G., Tu, K., Law, B. E., Wullschleger, S. D. (2010). Reliable estimation of biochemical parameters from C3 leaf photosynthesis-intercellular carbon dioxide response curves. Plant Cell Environ. 33, 1852–1874. doi: 10.1111/j.1365-3040.2010.02192.x
Harrison, W. G., Platt, T. (1986). Photosynthesis-irradiance relationships in polar and temperate phytoplankton populations. Polar Biol. 5, 153–164. doi: 10.1007/BF00441695
He, L., Luo, H., He, X. P., Bian, J. M., Zhu, C. L., Fu, J. R., et al. (2020). Photosynthetic characteristics of different super early rice based on mechanistic model of light-response of photosynthetic electron flow. J. Nucl Agr Sci 34, 418–424. doi: 10.11869/j.issn.100-8551.2020.02.0418
He, Y. L., Wu, Y., Ye, Z. P., Zhou, S. X., Ye, S. C., Liu, W. X. (2022). Response of intrinsic characteristics of light-harvesting pigment molecules, light use efficiency to light intensity for oil-tea (Camellia oleifera). Acta Bot. Boreali-Occidential Sin. 42, 1552–1560. doi: 10.7606/j.issn.1000-4025.2022.09.1552
Henley, W. J. (1993). Measurement and interpretation of photosynthesis light-response curves in algae in the context of photoinhibition and diel changes. J. Phycol 29, 729–739. doi: 10.1111/j.0022-3646.1993.00729.x
Hu, W. H., Xiao, Y. A., Yan, X. H., Ye, Z. P., Zeng, J. J., Li, X. H. (2021). Photoprotective mechanisms under low temperature and high light stress of Photinia × fraseri and Osmanthus fragrans during overwintering. Bull. Bot. Res. 41, 938–946. doi: 10.7525/j.issn.1673-5102.2021.06.012
Jassby, A. D., Platt, T. (1976). Mathematical formulation of the relationship between photosynthesis and light for phytoplankton. Limnol Oceanogr 21, 540–547. doi: 10.4319/lo.1976.21.4.0540
Kang, H. J., Duan, S. H., An, T., Ye, Z. P. (2019). Estimation of maximum electron transport rate of wheat based on FvCB model. J. Triticeae Crops 39, 1377–1384. doi: 10.7606/j.issn.1009-1041.2019.11.14
Karageorgou, P., Manetas, Y. (2006). The importance of being red when young: anthocyanins and the protection of young leaves of Quercus coccifera from insect herbivory and excess light. Tree Physiol. 26, 613–621. doi: 10.1093/treephys/26.5.613
Liang, Z. R., Liu, F., Yuan, Y. M., Du, X. X., Wang, W. J., Sun, X. T. (2018). Effect of different temperatures on growth and photosynthetic characteristic of Laminaria hyperborea young seedling. Mar. Sci. 42, 71–78. doi: 10.11759/hykx20171121003
Long, S. P., Bernacchi, C. J. (2003). Gas exchange measurements, what can they tell us about the underlying limitations to photosynthesis? Procedures and sources of error. J. Exp. Bot. 54, 2393–2401. doi: 10.1093/jxb/erg262
Mar, T., Govindjee, G. (1972). Kinetic models of oxygen evolution in photosynthesis. J. Theor. Biol. 36, 427–446. doi: 10.1016/0022-5193(72)90001-x
Maxwell, K., Johnson, N. G. (2000). Chlorophyll fluorescence-a practical guide. J. Exp. Bot. 51, 659–668. doi: 10.1093/jexbot/51.345.659
Miao, Z., Xu, M., Lathrop, R. G., Wang, Y. (2009). Comparison of the A–Cc curve fitting methods in determining maximum ribulose-1, 5-bisphosphate carboxylase/oxygenase carboxylation rate, potential light saturated electron transport rate and leaf dark respiration. Plant Cell Environ. 32, 109–122. doi: 10.1111/j.1365-3040.2008.01900.x
Morfopoulos, C., Sperlich, D., Peñuelas, J., Filella, I., Llusià, J., Medlyn, B. E. (2014). A model of plant isoprene emission based on available reducing power captures responses to atmospheric CO2. New Phytol. 203, 125–139. doi: 10.1111/nph.12770
Park, K. S., Kim, S. K., Cho, Y. Y., Cha, M. K., Jung, D. H., Son, J. E. (2016). A coupled model of photosynthesis and stomatal conductance for the ice plant (Mesembryanthemum crystallinum L.), a facultative CAM plant. Hortic. Environ. Biote 57, 259–265. doi: 10.1007/s13580-016-0027-7
Platt, T., Gallegos, C. L., Harrison, W. G. (1980). Photoinhibition of photosynthesis in natural assemblages of marine phytoplankton. J. Mar. Res. 38, 687–701. doi: 10.1093/pasj/57.2.341
Ralph, P. J., Gademann, R. (2005). Rapid light curves: a powerful tool assess photosynthetic activity. Aquat Bot. 82, 222–237. doi: 10.1016/j.aquabot.2005.02.006
Rascher, U., Liebieg, M., Lüttge, U. (2000). Evaluation of instant light-response curves of chlorophyll fluorescence parameters obtained with a portable chlorophyll fluorometer on site in the field. Plant Cell Environ. 23, 1397–1405. doi: 10.1046/j.1365-3040.2000.00650.x
Robakowski, P. (2005). Susceptibility to low-temperature photoinhibition in three conifers differing in successional status. Tree Physiol. 25, 1151–1160. doi: 10.1093/treephys/25.9.1151
Robakowski, P., Łukowski, A., Ye, Z. P., Kryszewski, A., Kowalkowski, W. (2022). Northern provenances of silver fir differ with acclimation to contrasting light regimes. Forests 13, 1164. doi: 10.3390/f13081164
Robakowski, P., Pers-Kamczyc, E., Ratajczak, E., Thomas, P. A., Ye, Z. P., Rabska, M., et al. (2018). Photochemistry and antioxidative capacity of female and male Taxus baccata L. acclimated to different nutritional environments. Front. Plant Sci. 9. doi: 10.3389/fpls.2018.00742
Schreiber, U., Klughammer, C. (2013). Wavelength-dependent photodamage to Chlorella investigated with a new type of multi-color PAM chlorophyll fluorometer. Photosynth Res. 114, 165–177. doi: 10.1007/s11120-013-9801-x
Serodio, J., Ezequiel, J., Frommlet, J., Laviale, M., Lavaud, J. (2013). A method for the rapid generation of nonsequential light-response curves of chlorophyll fluorescence. Plant Physiol. 163, 1089–1102. doi: 10.1104/pp.113.225243
Sharkey, T. D., Bernacchi, C. J., Farquhar, G. D., Singsaas, E. L. (2007). Fitting photosynthetic carbon dioxide response curves for C3 leaves. Plant Cell Environ. 30, 1035–1040. doi: 10.1111/j.1365-3040.2007.01710.x
Shevela, S., Kern, J. F., Govindjee, G., Messinger, J. (2023). Solar energy conversion by photosystem II: principles and structures. Photosynth Res. 156, 279–307. doi: 10.1007/s11120-022-00991-y
Stirbet, A., Guo, Y., Lazár, D., Govindjee, G. (2024). From leaf to multiscale models of photosynthesis: Applications and challenges for crop improvement. Photosynth. Res., in the press, # dOc4fc9c_eO8e_4efa
Stirbet, A., Lazár, D., Guo, Y., Govindjee, G. (2020). Photosynthesis: basics, history and modelling. Ann. Bot. 126, 511–537. doi: 10.1093/aob/mcz171
Suggett, D. J., Le Floc’H, E., Harris, G. N., Leonardos, N., Geider, R. J. (2007). Different strategies of photoacclimation by two strains of Emiliania huxleyi (haptophyta). J. Phycol 43, 1209–1222. doi: 10.1111/j.1529-8817.2007.00406.x
Sun, J., Sun, J., Feng, Z. (2015). Modelling photosynthesis in flag leaves of winter wheat (Triticum aestivum) considering the variation in photosynthesis parameters during development. Funct. Plant Biol. 42, 1036–1044. doi: 10.1071/FP15140
von Caemmerer, S. (2000). Biochemical models of leaf photosynthesis. Vol. 2 (Collingwood, Australia: CSIRO Publishing).
von Caemmerer, S. (2013). Steady-state models of photosynthesis. Plant Cell Environ. 36, 1617–1630. doi: 10.1111/pce.12098
Wang, X., Yang, X. L., Ye, Z. P., Lu, Y. T., Ma, X. F. (2022). Stomatal and non-stomatal limitations to photosynthesis in Sorghum bicolor at different temperatures. Plant Physiol. J. 58, 1245–1253. doi: 10.13592/j.cnki.ppj.2021.0403
White, A. J., Critchley, C. (1999). Rapid light curves: a new fluorescence method to assess the state of the photosynthetic apparatus. Photosynth Res. 59, 63–72. doi: 10.1023/A:1006188004189
Yang, X. L., Dong, W., Liu, L. H., Bi, Y. H., Xu, W. Y., Wang, X. (2023). Uncovering the differential growth of Microcystis aeruginosa cultivated under nitrate and ammonium from a photophysiological perspective. ACS EST Water 3, 1161–1171. doi: 10.1021/acsestwater.2c00624
Yang, X. M., Wu, X. L., Liu, Y. F., Li, T. L., Qi, M. (2018). Analysis of chlorophyll and photosynthesis of a tomato chlorophyll-deficient mutant induced by EMS. Chin. J. Appl. Ecol. 29, 1983–1989. doi: 10.13287/j.1001-9332.201806.021
Ye, Z. P., Hu, W. H., Yan, X. H., Duan, S. H. (2016). Photosynthetic characteristics of different plant species based on a mechanistic model of light-response of photosynthesis. Chin. J. Ecol. 35, 2544–2552. doi: 10.13292/j.1000-4890.201609.032
Ye, Z. P., Ling., Y., Yu, Q., Duan, H. L., Zhou, S. X. (2020). Quantifying light response of leaf-scale water-use efficiency and its interrelationships with photosynthesis and stomatal conductance in C3 and C4 Species. Front. Plant Sci. 11. doi: 10.3389/fpls.2020.00374
Ye, Z. P., Robakowski, P., Suggett, D. J. (2013a). A mechanistic model for the light response of photosynthetic electron transport rate based on light harvesting properties of photosynthetic pigment molecules. Planta 237, 837–847. doi: 10.1007/s00425-012-1790-z
Ye, Z. P., Suggett, D. J., Robakowski, P., Kang, H. J. (2013b). A mechanistic model for the photosynthesis–light response based on the photosynthetic electron transport of photosystem II in C3 and C4 species. New Phytol. 199, 110–120. doi: 10.1111/nph.12242
Ye, Z. P., Yin, J. H., Chen, X. M., An, T., Duan, S. H. (2019). Investigation on photosynthetic characteristics of flag leaves of several hybrid rice cultivars in dough stage. Acta Agr Zhejiangensis 31, 355–364. doi: 10.3969/j.issn.1004-1524.2019.03.02
Yin, X., Busch, F. A., Struik, P. C., Sharkey, T. D. (2021). Evolution of a biochemical model of steady-state photosynthesis. Plant Cell Environ. 44, 2811–2837. doi: 10.1111/pce.14070
Yin, X. Y., Struik, P. C., Romero, P., Harbinson, J., Evers, J. B., van der Putten, P. E. L., et al. (2009). Using combined measurements of gas exchange and chlorophyll fluorescence to estimate parameters of a biochemical C3 photosynthesis model: a critical appraisal and a new integrated approach applied to leaves in a wheat (Triticum aestivum) canopy. Plant Cell Environ. 32, 448–464. doi: 10.1111/j.1365-3040.2009.01934.x
Keywords: double exponential model, dynamic down-regulation, electron transport rate, mechanistic model, non-rectangular hyperbolic model, photoinhibition
Citation: Ye Z-P, An T, Govindjee G, Robakowski P, Stirbet A, Yang X-L, Hao X-Y, Kang H-J and Wang F-B (2024) Addressing the long-standing limitations of double exponential and non-rectangular hyperbolic models in quantifying light-response of electron transport rates in different photosynthetic organisms under various conditions. Front. Plant Sci. 15:1332875. doi: 10.3389/fpls.2024.1332875
Received: 03 November 2023; Accepted: 02 February 2024;
Published: 27 February 2024.
Edited by:
Stefano Santabarbara, National Research Council (CNR), ItalyReviewed by:
Milan Szabo, Eötvös Loránd Research Network (ELKH), HungaryOded Liran, University of Haifa, Israel
Copyright © 2024 Ye, An, Govindjee, Robakowski, Stirbet, Yang, Hao, Kang and Wang. This is an open-access article distributed under the terms of the Creative Commons Attribution License (CC BY). The use, distribution or reproduction in other forums is permitted, provided the original author(s) and the copyright owner(s) are credited and that the original publication in this journal is cited, in accordance with accepted academic practice. No use, distribution or reproduction is permitted which does not comply with these terms.
*Correspondence: Fu-Biao Wang, wfb19872856@163.com; Hua-Jing Kang, kanghuajing@126.com
†These authors have contributed equally to this work