 Kainan Zhao1,2
 Yibin Lan
 Changqing Duan
 Keji Yu
- 1Center for Viticulture and Enology, College of Food Science and Nutritional Engineering, China Agricultural University, Beijing, China
- 2Key Laboratory of Viticulture and Enology, Ministry of Agriculture and Rural Affairs, Beijing, China
- 3College of Biological Sciences and Biotechnology, Beijing Forestry University, Beijing, China
Proanthocyanidins (PAs) and anthocyanins are flavonoids that contribute to the quality and health benefits of grapes and wine. Salinity affects their biosynthesis, but the underlying mechanism is still unclear. We studied the effects of NaCl stress on PA and anthocyanin biosynthesis in grape suspension cells derived from berry skins of Vitis vinifera L. Cabernet Sauvignon using metabolite profiling and transcriptome analysis. We treated the cells with low (75 mM NaCl) and high (150 mM NaCl) salinity for 4 and 7 days. High salinity inhibited cell growth and enhanced PA and anthocyanin accumulation more than low salinity. The salinity-induced PAs and anthocyanins lacked C5’-hydroxylation modification, suggesting the biological significance of delphinidin- and epigallocatechin-derivatives in coping with stress. The genes up-regulated by salinity stress indicated that the anthocyanin pathway was more sensitive to salt concentration than the PA pathway, and WGCNA analysis revealed the coordination between flavonoid biosynthesis and cell wall metabolism under salinity stress. We identified transcription factors potentially involved in regulating NaCl dose- and time-dependent PA and anthocyanin accumulation, showing the dynamic remodeling of flavonoid regulation network under different salinity levels and durations. Our study provides new insights into regulator candidates for tailoring flavonoid composition and molecular indicators of salt stress in grape cells.
1 Introduction
Grapevine (Vitis vinifera L.) is one of the most economically important fruit crops in the world. It produces a wide range of flavonoids, especially in the berry skins of red varieties. Among flavonoids, proanthocyanidins (PAs) and anthocyanins are important compounds that contribute to the quality and health benefits of grapes and wine (Garrido-Bañuelos et al., 2022). PAs, also known as condensed tannins, are polymers of flavan-3-ols that can affect the astringency, bitterness, and mouthfeel of wine (Ma et al., 2014). Anthocyanins are glycosylated derivatives of anthocyanidins that are responsible for the red or purple colors of grape skins and red wine (Zhang et al., 2022).
The biosynthesis of anthocyanins and PAs in plants starts from the common phenolic precursor, phenylalanine, which is catalyzed to cinnamic acid by phenylalanine ammonia-lyase (PAL) (Rasmussen and Dixon, 1999). Cinnamic acid is sequentially catalyzed by cinnamate 4-hydroxylase (C4H) and 4-coumarate-CoA ligase (4CL) to form 4-coumaroyl-CoA (Schilmiller et al., 2009). Chalcone synthase (CHS) catalyzes the condensation of 4-coumaroyl-CoA with three molecules of malonyl-CoA to produce naringenin chalcone, the first committed intermediate of the flavonoid pathway (Hrazdina et al., 1986). Naringenin chalcone is further isomerized to naringenin by chalcone isomerase (CHI) (Moustafa and Wong, 1967), followed by hydroxylation mediated by various cytochrome P450 enzymes, such as flavanone 3-hydroxylase (F3H), flavonoid 3’-hydroxylase (F3’H), and flavonoid 3’,5’-hydroxylase (F3’5’H) to produce dihydroflavonols (Forkmann et al., 1980; Britsch and Grisebach, 1986; Menting et al., 1994). Dihydroflavonols are subsequently reduced by dihydroflavonol 4-reductase (DFR) to form 2,3-trans-leucoanthocyanidins (Fischer et al., 1988). These 2,3-trans-leucoanthocyanidins can undergo conversion into anthocyanidins by anthocyanidin synthase (ANS) with the aid of glutathione transferase (GST) or into 2,3-trans-flavan-3-ols (e.g., (+)-catechin) by leucoanthocyanidin reductase (LAR) (Yu et al., 2019; Eichenberger et al., 2023). Anthocyanidins are then glycosylated by UDP-glucose:flavonoid 3-O-glucosyltransferase (UFGT) to form anthocyanins (Ford et al., 1998), which can be further modified by acylation and methylation (Hugueney et al., 2009). At the downstream of ANS, anthocyanin reductase (ANR) utilizes ANS product intermediates to produce 2,3-cis-flavan-3-ols (e.g., (-)-epicatechin) and 2,3-cis-leucoanthocyanidins (Jun et al., 2021). The polymerization of PAs is believed to be non-enzymatic, which requires flavan-3-ols as starter units, and leucoanthocyanidins or their conjugates derived carbocation as the extension units (Jun et al., 2021; Yu et al., 2022, 2023).
A number of transcription factors that modulate the expression of flavonoid pathway genes have been identified in the context of berry development. Deluc et al. (2006, 2008) demonstrated that VvMYB5a and VvMYB5b activate the upstream flavonoid pathway to enhance both PA and anthocyanin production. Subsequently, VvMYBPA1, VvMYBPA2, and VvMYBPAR were identified as the three transcriptional activators that specifically target the PA branch genes VvLAR1 and VvANR (Bogs et al., 2007; Terrier et al., 2009; Koyama et al., 2014). VvMYBC2-L1, VvMYBC2-L2, and VvMYBC2-L3 are negative regulators of PA biosynthesis that downregulate VvMYBPA1, VvMYBPA2, and several PA structural genes, including VvLARs and VvANR (Huang et al., 2014; Cavallini et al., 2015; Zhu et al., 2019). Our previous studies showed that VvMYB86 promotes PA accumulation by tuning the flux between PA and anthocyanin pathways (Cheng et al., 2021), while VvbHLH93 inhibits PA production by broadly targeting flavonoid pathway genes (Cheng et al., 2022). Confirmed by transgenic grape suspension cells, VvNAC17 is an activator of both PA and anthocyanin pathways (Badim et al., 2022). Recently, Wei et al. (2023) found that VvWRKY70 is a bi-functional transcription factor that simultaneously represses norisoprenoid and flavonoid biosynthesis.
Salinity stress is a predominant issue for agriculture in arid and semi-arid regions, and has the potential to impair grape yield and wine quality (Zhou‐Tsang et al., 2021). Plant responses to salinity stress involve a biphasic mechanism, which includes an early osmotic phase and a late ionic phase (Munns and Tester, 2008), both of which can lead to excessive production of reactive oxygen species (ROS) (Chele et al., 2021). The accumulation of flavonoids under salinity stress is considered to be a strategy of antioxidation or ROS scavenging in plants (Shah and Smith, 2020). However, most studies have focused on the effect of salinity stress on anthocyanin biosynthesis, while the impact on PA accumulation has been largely neglected. In model plant species, salinity stress has been shown to increase the accumulation of anthocyanins (Lotkowska et al., 2015; Kim et al., 2022), but the evidence for the effect of salinity on anthocyanin biosynthesis in grape berries is not consistent. The canopy NaCl spray experiments showed that moderate salinity (20 mM and 60 mM) and high salinity (100 mM and 150 mM) slightly enhanced and inhibited the biosynthesis of anthocyanin in grape berries, respectively (Li et al., 2013; Han et al., 2024). However, the irrigation with mild saline in the vineyard did not cause a significant change in the color density of wine products (Walker et al., 2000), suggesting that the effect of moderate salinity on anthocyanin accumulation is limited. The discrepancy may result from different grape varieties, various treatment methods, the choice of treatment time points, and the interaction between salinity and other environmental factors (Jan et al., 2021; Han et al., 2024). In addition, more experimental evidence is needed to elucidate how high salinity affects anthocyanin and PA biosynthesis in grapes.
Plant cell culture is a convenient system to study metabolite biosynthesis, cell development, and response to specific stimuli, as it allows for more precise control of treatment conditions (Onofrio et al., 2009; Almagro et al., 2014; Ayenew et al., 2015; Ric-Varas et al., 2020). Previous studies have shown that sugar, light, heat, and jasmonate can induce the biosynthesis of anthocyanins or PAs in grape cell cultures (Larronde et al., 1998; Vitrac et al., 2000; Decendit et al., 2002; Zhang et al., 2002; Onofrio et al., 2009; Ayenew et al., 2015). However, the effect of salinity on PA and anthocyanin metabolism in grape cells remains unclear. In this study, we explored the responses of PA and anthocyanin accumulation to different combinations of NaCl (75 mM and 150 mM) and treatment time (4 day and 7 day) in grape suspension cells. We found that the anthocyanin pathway was more sensitive to salt concentration than the PA pathway, and that flavonoid accumulation was coordinated with cell wall metabolism. We also identified transcription factors that potentially modulated the flavonoid regulation network in response to different salinity levels and durations. Our study reveals new flavonoid regulators and markers of salt stress in grape cells.
2 Materials and methods
2.1 Cell cultures and salinity treatment
The grape suspension cell system was established from Vitis vinifera L. Cabernet Sauvignon berry skin-derived callus described in our previous study (Cheng et al., 2022). The grape cell suspensions were cultivated according to the method of Osuga et al. (1999) with slight modifications. Briefly, the calli were transferred to 250 mL flask containing 60 mL of B5 basic liquid medium (3.21 g L-1, pH 5.8 to 6.0), supplemented with 20 g L-1 of sucrose, 2.5 g L-1 of acid-hydrolyzed casein, 0.2 mg L-1 of kinetin (KT), and 0.1 mg L-1 of naphthaleneacetic acid (NAA). The suspension cells were maintained at 25 ± 1°C in the dark with the a shaker speed of 95 rpm. Subcultures were performed every 14 days at a 1:2 ratio (v/v). For salinity treatment, NaCl was added to the fresh maintaining medium at the indicated concentration. Suspension cells were subjected to different NaCl concentrations (0 mM, 75 mM, and 150 mM) in 250 mL flasks, designated as the control group (Ctrl), low salinity group (L), and high salinity group (H), respectively. Each treatment was performed in three biological replicates. As the activation of anthocyanin pathway in grapevine is light-dependent, the experimental suspension cells were cultivated under the same condition as above, except for a 16 h/8 h light/dark cycle with a light intensity of 125 μmol m-2 s-1. Cells were harvested at the specified time intervals by vacuum filtration, washed with cold distilled water, and weighed. The samples for metabolite and gene expression analysis were frozen in liquid nitrogen and stored at -80°C until use.
2.2 Quantification of soluble and insoluble PAs
Two mL of suspension cell cultures were subjected to gravity sedimentation for 10 min, and the supernatant was discarded. The cell pellets were extracted with 1 mL of 70% (v/v) acetone/water containing 0.5% (v/v) ascorbic acid by vortexing for 30 min. The resulting mixture was centrifuged at 8,000g for 5 min, and the supernatant was collected. The extraction was repeated twice, and the combined supernatants were evaporated by nitrogen flow. The dry extracts were re-dissolved in 400 μL of 50% (v/v) methanol/water to obtain soluble PAs. The remained cell pellets after soluble PAs extraction contained insoluble PAs. Soluble and insoluble PAs were quantified using DMACA method and Butanol-HCl lysis assay, respectively, as described in our previous study (Cheng et al., 2022).
2.3 Quantification of total anthocyanin
To extract total anthocyanins from two mL of suspension cell cultures, the medium was removed and the cells were sonicated in 1 mL of 50% (v/v) methanol/water with an ice water bath for 20 min. The resulting homogenate was centrifuged at 8,000g for 5 min, and the supernatant was evaporated under the nitrogen flow. The dry extracts were re-dissolved in 400 μL of 50% (v/v) methanol/water. The quantification of total anthocyanins followed the pH-differential method optimized for grape cell cultures (Cheng et al., 2021).
2.4 PAs and anthocyanin profiling using LC/MS
To analyze the composition of PAs and anthocyanins, suspension cells were ground under liquid nitrogen and freeze-dried. For the cleavage of both soluble and insoluble PAs, 30 mg of dry powder was suspended in phloroglucinolysis buffer (0.5% (w/v) ascorbic acid, 0.3 N HCl, and 50 g/L phloroglucinol in methanol) and incubated at 50°C for 20 min. The reaction was stopped by adding 200 mM sodium acetate. After centrifugation at 8,000g for 5 min, the supernatant was evaporated under the nitrogen flow and re-dissolved in 400 μL of 50% (v/v) methanol/water. For the extraction of anthocyanins, 30 mg of dry powder was sonicated in 1 mL of 50% (v/v) methanol/water with an ice water bath for 20 min. The mixture was then centrifuged at 8,000g for 5 min and the supernatant was evaporated under the nitrogen flow and re-dissolved in 200 μL of 50% (v/v) methanol/water. Both PA building blocks and anthocyanins were detected using an Agilent 1200 HPLC system coupled with an Agilent 6410 triple quadrupole (QqQ) mass spectrometer. A Poroshell 120 EC-C18 column (150 × 2.1 mm, 2.7 μm, Agilent Technologies) was used for metabolite separation. Targeted LC/MS analysis of PA building blocks and anthocyanins with multiple reaction monitoring (MRM) followed the method established in our previous study (Li et al., 2017).
2.5 RNA extraction, library construction, and sequencing
The total RNA of grape suspension cells was isolated using the Universal Plant Total RNA Extraction Kit (BioTeke, Beijing, China). The quality and quantity of the RNA samples were assessed by an Agilent Bioanalyzer 2100 system (Agilent, CA, USA). The cDNA library construction and Illumina Novaseq sequencing were performed by Novogene Biotech Co., Ltd (Beijing, China) following the standard procedures.
2.6 Transcript assembly and quantification of gene expression level
To obtain clean reads, raw data were filtered by removing low-quality reads, adapter sequences, and poly-N sequences. The clean reads were then aligned to the Vitis vinifera reference genome (version V1) using HISAT2 v2.0.5 with default parameters. Reference-based transcript assembly and novel transcript prediction were performed by StringTie v1.3.3b. Read counts for each gene were obtained by FeatureCounts v1.5.0-p3. Gene expression levels were estimated by calculating the fragments per kilobase of transcript per million mapped reads (FPKM) values. The heatmaps for visualizing gene expression levels were plotted using the Heatmap tool on the Galaxy web-based platform (https://usegalaxy.org/).
2.7 qRT-PCR analysis
To validate the RNA-seq results, the same RNA-seq samples were used for qRT-PCR analysis. The RNA was reverse transcribed using HiScript® II Q RT SuperMix for qPCR (+gDNAwiper) (Vazyme, Nanjing, China) following the manufacturer’s instructions. The qRT-PCR reactions were performed using SYBR qPCR Master Mix (Vazyme, Nanjing, China) on an ABI 7300 real-time system (Thermo Fisher, USA). The qRT-PCR program consisted of an initial denaturation at 95°C for 30 s, followed by 40 cycles of denaturation at 95°C for 10 s and annealing/extension at 60°C for 31 s. VvUbiquitin1 was used as a reference gene to normalize the expression levels of the target genes (Bogs et al., 2005). The relative expression levels were calculated using the 2-ΔΔCT method. The gene-specific primers used in the study are listed in Supplementary Table 1.
2.8 Differential expression analysis and gene functional enrichment
To identify differentially expressed genes (DEGs) between two experimental groups, the R package DESeq2 1.20.0 was used with the default parameters. The Benjamini and Hochberg method was applied to compute the adjusted P-value (padj), which was then used together with the Fold change (FC) to detect significant differences in gene expression. The criteria for significant differential expression were padj < 0.05 and |Log2(FC)| > 1. The DEGs between two groups were visualized by volcano plots using Hiplot (https://hiplot.org), an online platform for interactive data visualization. The DEGs were subjected to GO and KEGG pathway enrichment analysis using TBtools, a software suite for biological data analysis (Chen et al., 2020). The enrichment results were visualized by bubble plots, rose charts, and bee plots using Hiplot. The functionally grouped GO analysis was performed using ClueGO, a Cytoscape plug-in that integrates GO terms and creates functionally organized GO networks (Bindea et al., 2009). The parameters for ClueGO analysis were set as follows: overlap threshold 50%, kappa score 0.5, and the default settings for the other options.
2.9 Gene co-expression analysis
Gene co-expression analysis was performed using the R package WGCNA 1.72 with FPKM value matrix as the input. The soft threshold was selected as 6 based on the scale-free topology criterion and the mean connectivity of the network. The minimum number of genes allowed to be included in the module was set to 50. Other parameters for the analysis were kept as the defaults. The co-expression network was visualized by Cytoscape V3.6.1.
2.10 Flavonoid related transcription factor annotation
Transcription factor genes in DEGs were identified using BLASTN against Vitis vinifera database in Plant Transcription Factor Database (PlantTFDB) V5.0. The identified transcription factor genes were further annotated using BLASTX against a combined database of NCBI nr with the sequences of experimentally characterized flavonoid transcription factors retrieved manually based on the published literatures. NCBI BLAST standalone version 2.13.0+ was used in the above analysis with default parameters.
2.11 Statistical analysis
The statistical analysis of the data was conducted using the SPSS software version 21.0. Data were plotted using GraphPad software version 8.0.2.
3 Results
3.1 75 mM and 150 mM NaCl inhibited the growth of grape suspension cells to different extent
The effect of salinity stress on flavonoid metabolism in grapes was investigated using a suspension cell system derived from berry skins of Vitis vinifera L. Cabernet Sauvignon. To determine the optimal salt concentration for inducing stress response, we treated the suspension cells with different concentrations of NaCl for two weeks, and measured the fresh weight as an indicator of cell growth. We found that 75 mM NaCl inhibited cell proliferation, and 150 mM NaCl further reduced cell growth (Figure 1A). Higher concentrations of NaCl (200 mM, 300 mM, and 400 mM) did not cause additional decrease in fresh weight compared to 150 mM NaCl (Figure 1B). Based on these results, we inferred that 75 mM NaCl was sufficient to induce a significant stress response in grape suspension cells, and that 150 mM NaCl triggered a more severe one. Therefore, it was worth studying the response of PA and anthocyanin biosynthesis under both treatments. For convenience, we used low salinity (L) and high salinity (H) to represent 75 mM and 150 mM of NaCl, respectively.
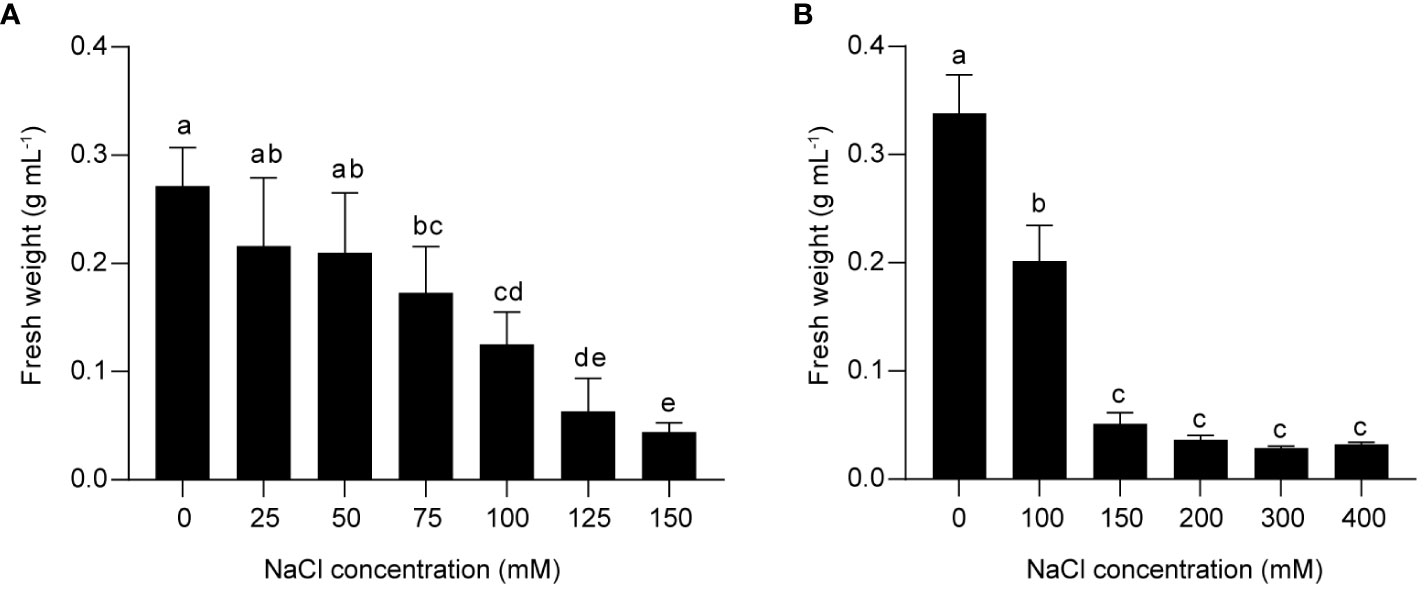
Figure 1 The effects of different NaCl concentrations on the growth of grape suspension cells. The cell suspensions derived from berry skins of Vitis vinifera L. Cabernet Sauvignon were treated with various levels of NaCl for two weeks, and the fresh weight was measured as an indicator of cell growth. (A) 150 mM NaCl induced a more severe inhibition of cell growth than 75 mM NaCl. (B) The growth of grape suspension cells was inhibited by NaCl concentrations above 150 mM, but the fresh weight was not further decreased compared to 150 mM NaCl. Data are presented as the mean ± SD (n = 3 biological replicates; different letters above the bars indicate significant differences (P < 0.05) according to one-way ANOVA with Duncan test).
3.2 PA and anthocyanin accumulation in grape suspension cells under NaCl stress
To investigate the effect of NaCl stress on PA and anthocyanin biosynthesis in grape suspension cells, we performed time-series assays to monitor the content of these metabolites throughout a culture cycle. We found that soluble PAs and insoluble PAs remained relatively stable under both L and H treatments for the first 6 days, and then increased from day 6 onwards (Figure 2). Anthocyanins in H group also accumulated mainly from day 6 to day 14. In contrast, L stress did not induce significant amounts of anthocyanins in suspension cells, similar to the control group (Ctrl) (Figure 2). The color of the suspension cells reflected the changes in anthocyanin content. Correspondingly, suspension cells under H at day 4 and day 7 (H-4d and H-7d) showed a deep red color, which was not observed in Ctrl at either day 4 or day 7 (Ctrl-4d and Ctrl-7d) (Figure 3A). The cells treated with L for 7 days (L-7d) had a slight pink hue, which was more obvious than that of L samples at day 4 (L-4d) (Figure 3A). In addition, L-4d and H-4d samples exhibited growth inhibition phenotype, as indicated by their lower fresh weight than Ctrl-4d (Figure 3B). Unlike L treatment group, the fresh weight of H samples did not increase from day 4 to day 7 (Figure 3B). These results suggest that the degree of salinity stress experienced by the L and H samples differed, at least from day 4 onwards.
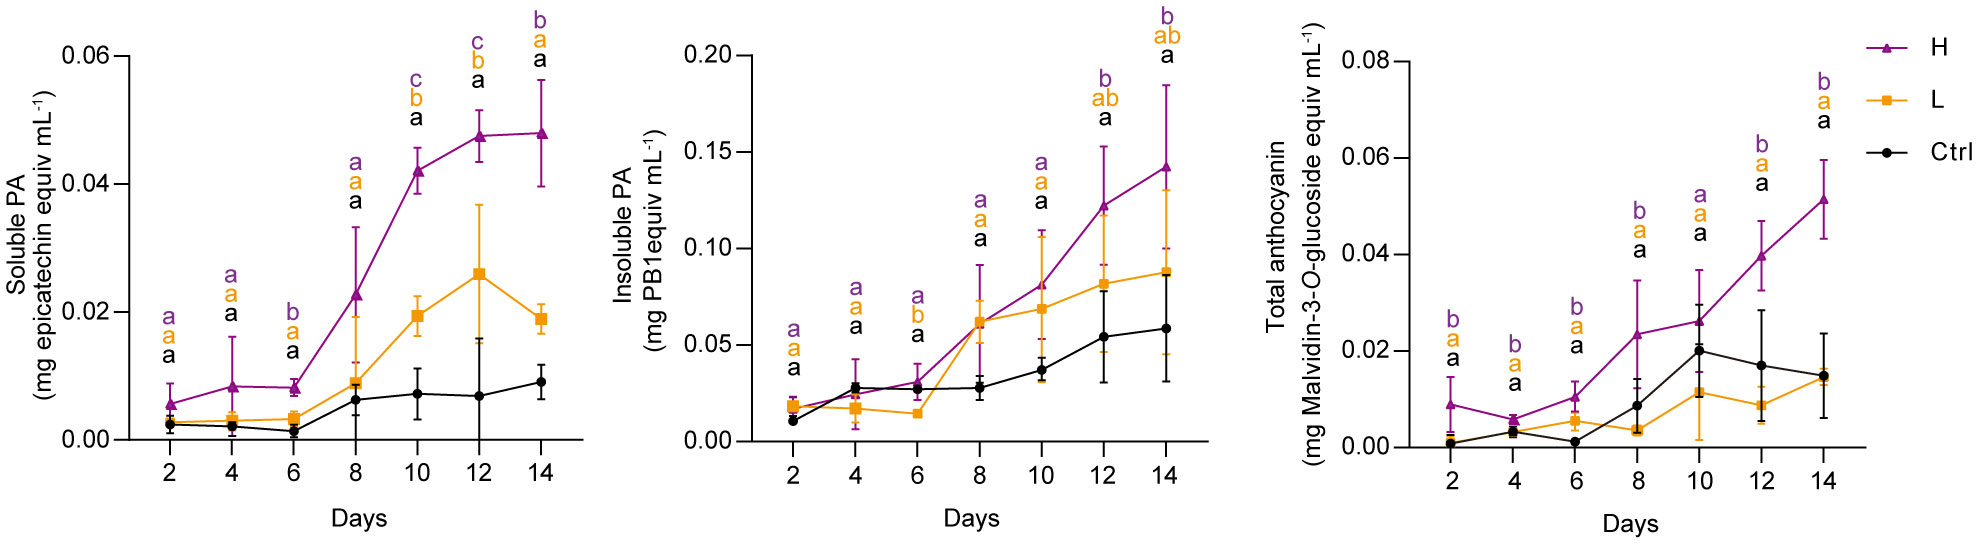
Figure 2 Time series quantification of soluble PAs, insoluble PAs and total anthocyanins in grape suspension cells under 0 mM (Ctrl), 75 mM (L) and 150 mM (H) NaCl treatment conditions. Soluble PAs were extracted using acetone/water solvent followed by chloroform extraction, and insoluble PAs were present in the residues after soluble PAs acetone/water extraction. Soluble PAs were measured by the DMACA method and expressed as epicatechin equivalents. Insoluble PAs were quantified by the butanol-HCl lysis method and expressed as procyanidin B1 (PB1) equivalents. Total anthocyanins were extracted using methanol/water solvent and determined by pH-differential method. The levels of total anthocyanins were expressed as malvidin-3-O-glucoside equivalents. Data are shown as the mean ± SD (for n = 3 biologically independent samples); the different letters above the bars represent statistically significant differences (P < 0.05) determined by one-way ANOVA with Duncan test.
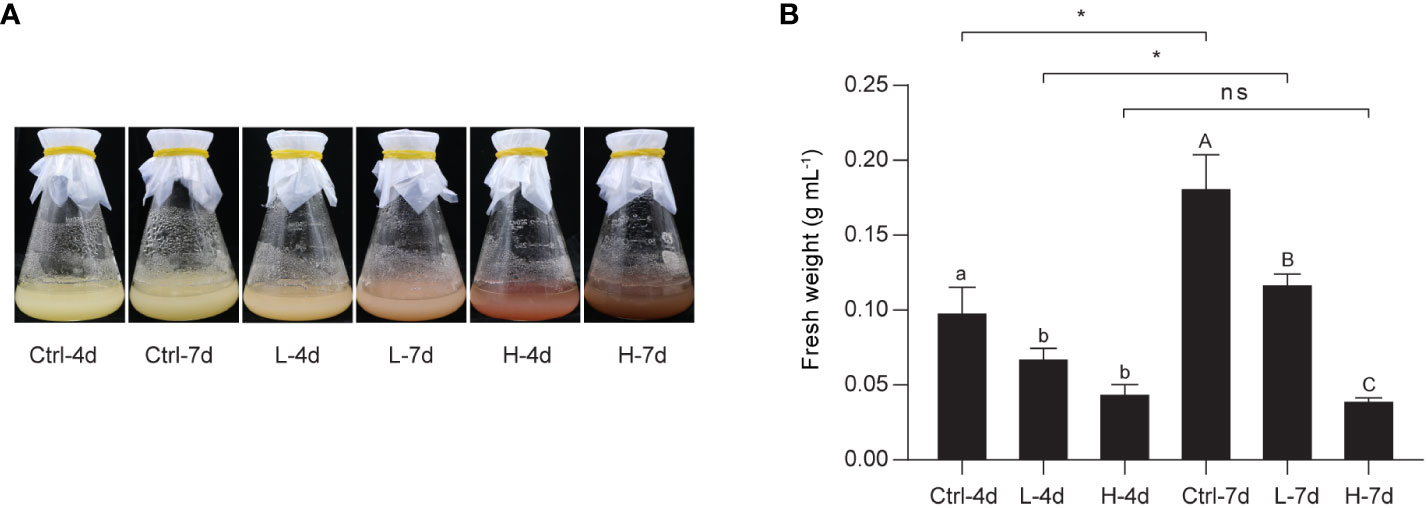
Figure 3 Photographs and fresh weight of the grape suspension cells used for metabolite and transcriptome analysis. (A) Photographs of the grape suspension cells treated with 0 mM NaCl (Ctrl), 75 mM NaCl (L) and 150 mM NaCl (H) at day 4 (4d) and day 7 (7d). (B) Fresh weight of the grape suspension cells from each treatment group. Data are shown as the mean ± SD (for n = 3 biologically independent samples; the different letters above the bars represent statistically significant differences (P < 0.05) determined by one-way ANOVA with Duncan test; * P< 0.05, two-tailed unpaired Student’s t tests; ns, not significant).
To gain the insight into the composition of PA building blocks in the current suspension cell system, we directly subjected the ground cell samples to phloroglucinolysis followed by LC/MS analysis. The flavan-3-ol monomers detected by this technique consist of free flavan-3-ols and PA starter units, while phloroglucinol-flavan-3-ol adducts are derived from PA extension units. Quantification results revealed that (-)-epicatechin extension unit was the predominant PA building block in grape suspension cells with or without salinity treatments, while (-)-epigallocatechin-, galloyl-(-)-epicatechin- and (+)-catechin-type subunits together accounted for only one-tenth of the total flavan-3-ols (Figure 4A). This suggested that the flux to 2,3-cis flavan-3-ols was preferred in the suspension cells, which was the common case in grape berry skins. However, the low levels of (-)-epigallocatechin reflected the fact that C5’-hydroxylation was somewhat blocked in the suspension cell system under NaCl stress. Compared with L treatment, H stress was more effective in inducing total flavan-3-ol accumulation at both day 4 and day 7 (Figure 4A). The total flavan-3-ol level of H-7d was twice that of H-4d, while there was no further increase in total flavan-3-ol content in either L or Ctrl groups from day 4 to day 7 (Figure 4A).
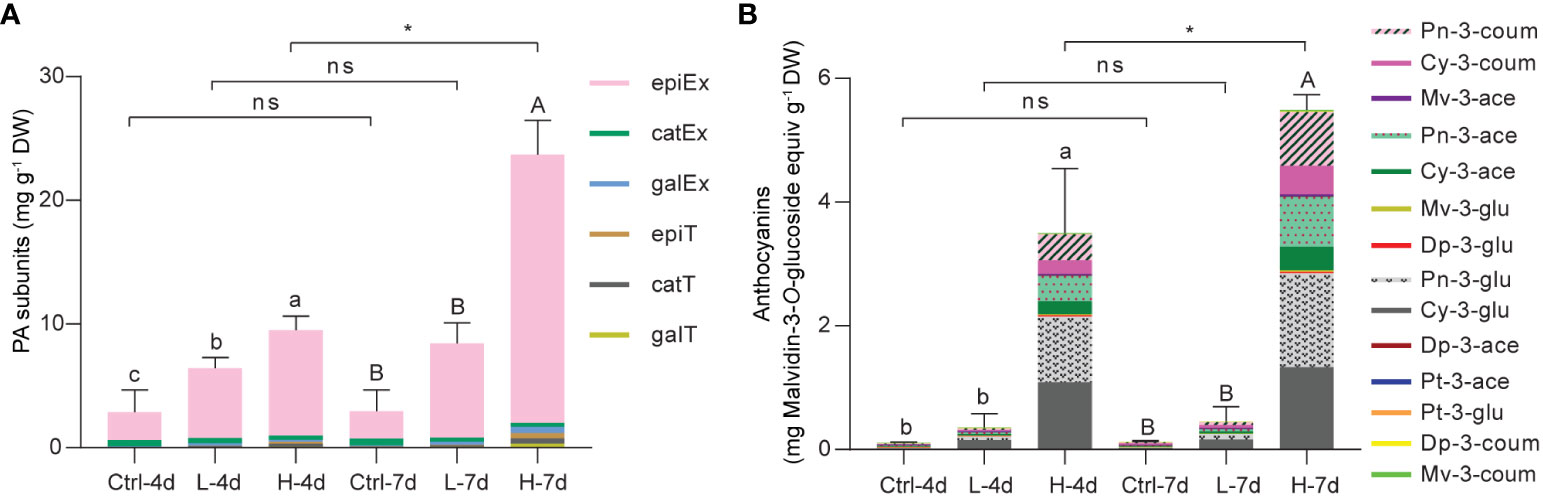
Figure 4 Compositional analysis of PAs and anthocyanins in grape suspension cells under 0 mM (Ctrl), 75 mM (L) and 150 mM (H) NaCl treatment conditions. (A) The analysis of composition of PA subunits in each grape suspension cell sample. Dry sample powders were directly subjected to phloroglucinolysis in order to cleavage both soluble and insoluble PAs. The resulting extracts were subjected to LC/MS analysis (epiEx, (-)-epicatechin extension unit; catEx, (+)-catechin extension unit; galEx, (-)-epicatechin-3-O-gallate extension unit; epiT, (-)-epicatechin terminal subunit/free monomer; catT, (+)-catechin terminal subunit/free monomer; galT, (-)-epicatechin-3-O-gallate terminal subunit/free monomer). (B) The analysis of composition of anthocyanins in each grape suspension cell sample. Anthocyanins were extracted with methanol/water and subjected to LC/MS analysis (Pn-3-coum, Peonindin-3-O-6”-coumaroyl-glucoside; Cy-3-coum, Cyanidin-3-O-6”-coumaroyl-glucoside; Mv-3-ace, Malvidin-3-O-6”-acetyl-glucoside; Pn-3-ace, Peonindin-3-O-6”-acetyl-glucoside; Cy-3-ace, Cyanidin-3-O-6”-acetyl-glucoside; Mv-3-glu, Malvidin-3-O-glucoside; Dp-3-glu, Delphindin-3-O-glucoside; Pn-3-glu, Peonindin-3-O-glucoside; Cy-3-glu, Cyanidin-3-O -glucoside; Dp-3-ace, Delphindin-3-O-6”-acetyl-glucoside; Pt-3-ace, Petunidin-3-O-6”-acetyl-glucoside; Pt-3-glu, Petunidin-3-O-glucoside; Dp-3-coum, Delphindin-3-O-6”-coumaroyl-glucoside; Mv-3-coum, Malvidin-3-O-6”-coumaroyl -glucoside). The content of each type of anthocyanin was expressed as malvidin-3-O-glucoside equivalents. Data are shown as the mean ± SD (for n = 3 biologically independent samples; the different letters above the bars represent statistically significant differences (P < 0.05) determined by one-way ANOVA with Duncan test; * P< 0.05, two-tailed unpaired Student’s t tests; ns, not significant).
To examine anthocyanin composition, we subjected 50% methanol/H2O (v/v) soluble extracts to LC/MS analysis following the method we developed previously (Li et al., 2017). Consistent with the cell color shown in Figure 3A, LC/MS data revealed that anthocyanins were mainly accumulated in H-4d and H-7d samples. The profiles of anthocyanins in these two samples were nearly identical, although total anthocyanin concentration in H-7d was one-third higher than in H-4d (Figure 4B). Anthocyanins induced in suspension cells were predominantly cyanidin-based. More than half of these anthocyanins were 3’-O-methylated cyanidin-3-O-glucoside (also known as peonidin-3-O-glucoside), of which over forty percent were further acetylated and coumaroylated (Figure 4B). Thus, in despite of a deficiency of 3’5’-hydroxylated anthocyanins, the common types of anthocyanin modifications in grape berry skins existed in the suspension cells under NaCl stress.
3.3 NaCl stress-induced gene expression profiles in flavonoid pathway
Transcriptome analysis was performed with Illumina RNA-Seq to investigate the response of gene expression to NaCl stress in the grape suspension cell system. Transcripts were assembled from pair-end reads based on the grape PN40024.V1 genome, and their expression levels were normalized by Fragments Per Kilobase Million (FPKM). Differentially expressed genes (DEGs) between two given conditions were identified using DESeq2 (|Log2(FC)| > 1, padj < 0.05). qPCR data and FRKM values of the selected flavonoid pathway genes correlated well (Supplementary Figure 1), suggesting that the RNA-Seq experiment was reliable.
Kyoto Encyclopedia of Genes and Genomes (KEGG) pathway enrichment analysis showed that flavonoid biosynthesis was the most significantly enriched pathway by H treatments, followed by phenylpropanoid biosynthesis and plant hormone signal transduction; DEGs between samples of L and Ctrl groups were not enriched in any KEGG terms, except for a few genes of mitogen-activated protein kinase (MAPK) signaling pathway in L-4d (Figure 5A). Correspondingly, the expression levels of the structural genes in flavonoid pathway were generally increased with the increasing NaCl concentration, which was consistent with the salt dose-dependent accumulation of PAs and anthocyanins (Figure 5B). Compared with other flavonoid structural genes, the response of F3’5’H genes to salinity stress was more complex in the suspension cells. Two of five isoforms of F3’5’Hs detected by the RNA-Seq assay were mainly expressed in H-4d and H-7d samples, while the transcription of the other three was activated only in H-4d (Figure 5B). F3’5’H competes with F3’H for naringenin or dihydrokaempferol to produce 3’5’-hydroxylated backbones of PAs and anthocyanins (Bogs et al., 2006). Similar to the results from a previous study on the expansion and sub-functionalization of F3’5’H (Falginella et al., 2010), the unsustainable expression of F3’5’H copies was likely responsible for the negligible levels of delphinidin-derived anthocyanins and epigallocatechin-based PAs in the suspension cells.
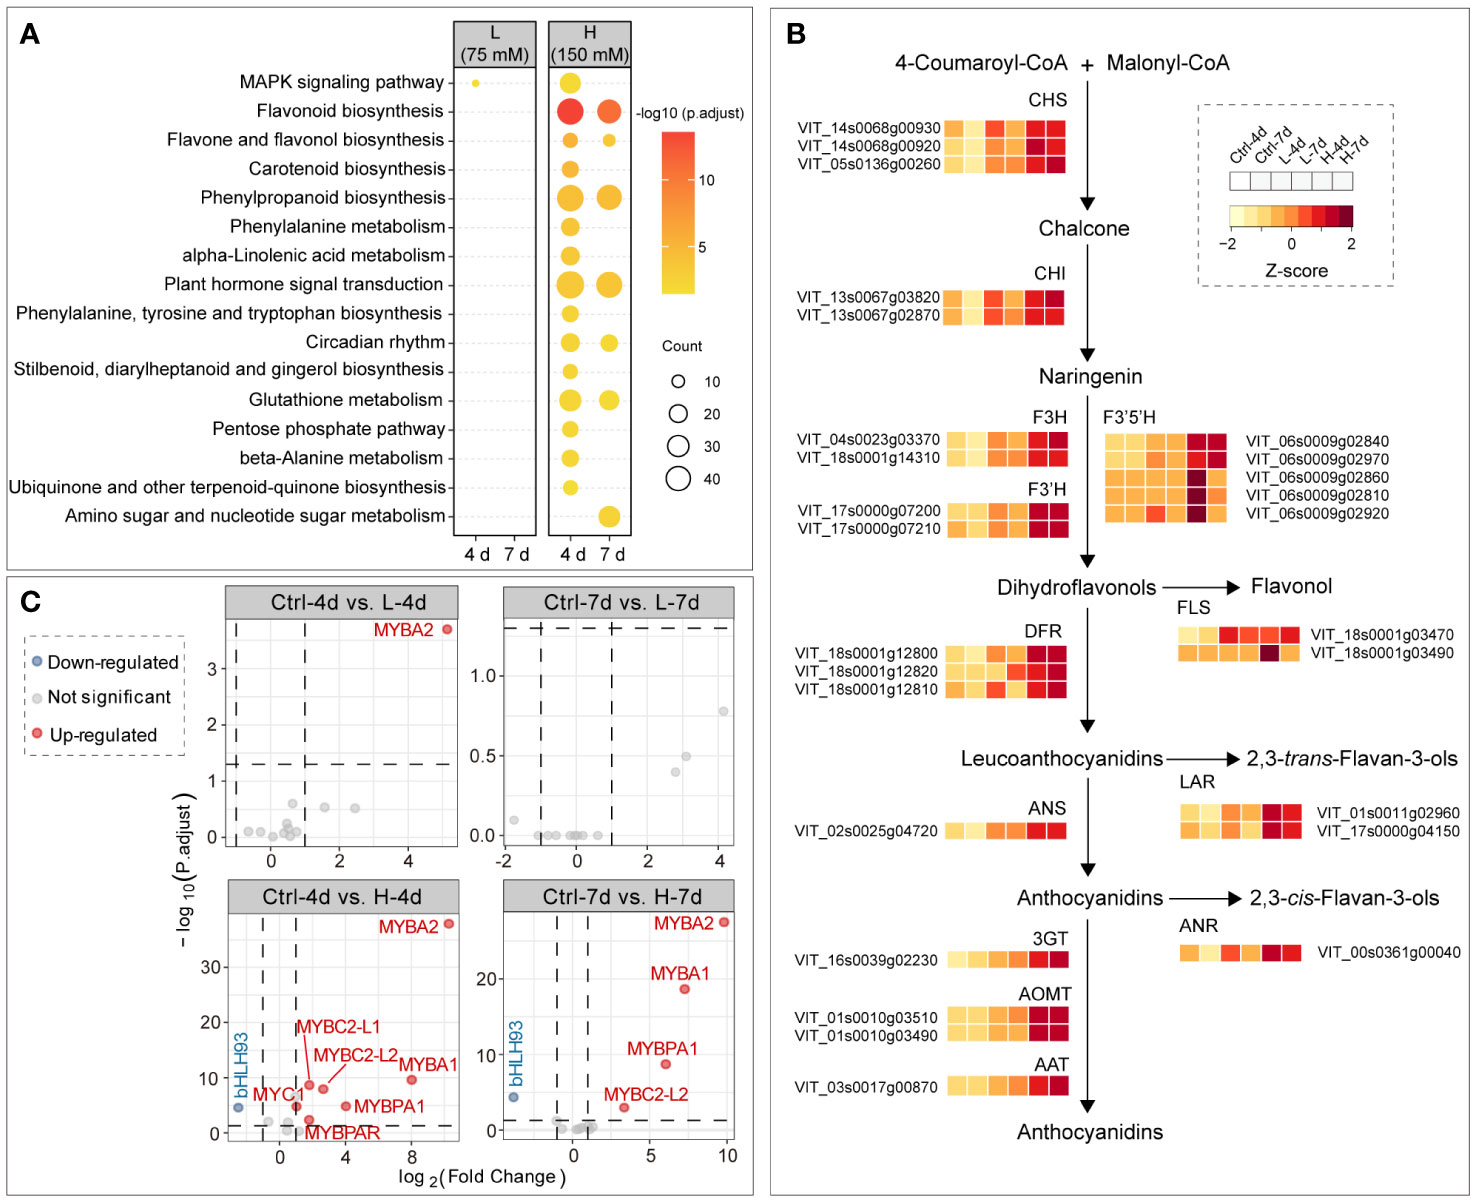
Figure 5 Salinity stress induced gene expression in flavonoid pathway. (A) KEGG enrichment of DEGs between salinity treatment and control groups at day 4 and day 7. (B) Gene expression patterns in flavonoid pathway among samples. (C) Differential expression analysis of well characterized flavonoid transcription factor genes in grape suspension cells, and transcription factor genes VvMYBA1/A2, VvMYB5a/5b, VvMYBC1, VvWDR1, VvMYBPA1/PA2, VvMYBPAR, VvMYBC2-L1/L2, VvMYB86 and VvbHLH93 are included in the plots.
The PA and anthocyanin biosynthesis related transcription factors, including MYB, bHLH/MYB and WD40/WDR family proteins, have been extensively studied in grapes. However, these works have mostly been carried out in the context of berry development, rather than under stress conditions. VvMYB5a and VvMYB5b activate the general flavonoid pathway in grapevine (Deluc et al., 2006, 2008), but their gene expression levels were not affected by salinity stress in the grape suspension cells (Figure 5C). This suggested that additional regulators were required for channeling the flux to flavonoid pathway in grape cells under salinity stress. Two functional isoforms of MYBA genes, namely VvMYBA1 and VvMYBA2, are essential for anthocyanin synthesis in red grape cultivars (Walker et al., 2007), and their expression levels were up-regulated for at least 60 times under H treatment, compared to the controls (Figure 5C). This corresponded to the high expression levels of anthocyanin genes, including DFR, ANS, 3GT, AOMT and AAT, under H treatment at both day 4 and day 7 (Figure 5B). The expression level of VvMYBPA1, a gene that activates PA synthesis, increased under H treatment, but not under L treatment. This was in line with the expression patterns of VvANR and VvLARs. Whereas the gene encoding VvMYBPA2, another key positive transcription factor in PA pathway (Terrier et al., 2009), was not responsive to the salinity stress, the gene encoding VvMYBPAR, phylogenetically clustered with VvMYBPA2 (Koyama et al., 2014), was up-regulated in H-4d sample. Although two of three MYBC2 PA pathway repressor genes, namely VvMYBC2-L1 and VvMYBC2-L2 (Cavallini et al., 2015), were also activated by salinity stress, their inhibition of PA accumulation was not significant in the grape suspension cell system as indicated by the metabolite data. VvMYBC2 and VvMYBPA1 are the targets of VvbHLH93, which inhibits the expression of VvLARs in PA pathway and promotes the transcription of anthocyanin genes (Cheng et al., 2022). VvbHLH93 expression level was down-regulated in both H-4d and H-7d samples, which partially explained the similar expression patterns of VvMYBPA1 and VvMYBC2 genes under salinity stress (Figure 5C). In addition, VvMYB86, a gene oppositely regulating PA and anthocyanin biosynthesis (Cheng et al., 2021), was neither responsive to L nor H salinity stress. This was consistent with the similar accumulation patterns of PA and anthocyanin in cells under salt stress conditions.
3.4 Identification and co-expression analysis of genes that essentially responded to NaCl stress in grape suspension cells
We used a Venn diagram to compare the number of DEGs among the four conditions: Ctrl-4d vs. L-4d, Ctrl-7d vs. L-7d, Ctrl-4d vs. H-4d and Ctrl-7d vs. H-7d. The diagram showed that H treatment had a much stronger effect on the transcriptome of the suspension cells than L at both time points (Figure 6A). Only eight genes were commonly regulated by both L and H treatments: VvCORA-like, protein phosphatase 2C (VvPP2C), Kunitz trypsin inhibitor 2 (VvKTI2), VvMYBA3, VvAOMT, glutathione S-transferase 4 (VvGST4), and two isoforms of polygalacturonases (VvPG1 and VvPG2). These eight genes were all up-regulated by L treatment, and their transcriptions were further enhanced by H treatment (Figure 6B). This suggested that they were essential for the response to NaCl stress.

Figure 6 Identification and co-expression analysis of genes consistently involved in NaCl stress response in grape suspension cells. (A) Venn diagram of eight genes that were differentially expressed under both high (H) and low (L) salinity at day 4 (4d) and day 7 (7d). (B) The expression patterns of the eight genes across all the samples. (C) The clustering of module eigengenes based on WGCNA analysis. (D) KEGG enrichment of genes in the red, brown and purple modules in (C). (E) The co-expression network containing the genes consistently responsive to salinity stress in the brown module. The top 20 co-expression genes for VvCORA-like, VvMYBA3, VvAOMT, VvGST4 and the two VvPGs were retrieved by ranking the weight values from WGCNA analysis, and only the nodes with more than one edge were kept for the network visualization.
To investigate the potential associations among the eight genes, weighted correlation network analysis (WGCNA) was performed, and 16 modules were identified in total. Among them, VvCORA-like, VvMYBA3, VvAOMT, VvGST4, VvPG1 and VvPG2 were clustered in the brown module, while VvPP2C and VvKTI2 were assigned to the purple and red modules, respectively (Supplementary Table 2). Eigengene-based clustering analysis revealed that the brown, red and purple modules were closely related (Figure 6C), indicating that they might share common biological functions. The flavonoid pathway of KEGG term was significantly enriched combining the genes from these three modules (Figure 6D). In particular, the majority of flavonoid genes were included in the brown module, while the red and purple modules contained only around 15% of the flavonoid genes, such as a VvCHI isoform (VIT_13s0067g03820), a VvDFR isoform (VIT_18s0001g12820), VvANS, and VvANR. This suggested that the brown module was more relevant to salinity-induced anthocyanin and PA biosynthesis.
Within the brown module, VvAOMT catalyzes anthocyanin methylation (Hugueney et al., 2009), and VvGST4 is a PA transporter and the final enzyme to product anthocyanidin (Pérez-Díaz et al., 2016; Eichenberger et al., 2023). Although the SNPs within the VvMYBA3 locus were tightly associated with grape berry color, the overexpression of VvMYBA3 in the grape suspension cells did not induce the expression of Vv3GT and anthocyanin accumulation (Walker et al., 2007; Fournier-Level et al., 2009; Guo et al., 2019). Moreover, the functions of VvCORA-like, VvPG1 and VvPG2 in vivo were still unknown. However, since they co-existed with flavonoid genes in the same module, we speculated that they might have a role in anthocyanin and PA biosynthesis under salinity stress. We retrieved the top 20 co-expression genes for each of these six genes based on the weight values of the adjacency matrix from WGCNA. The gene co-expression network was constructed accordingly, and only the nodes with more than one edge were kept for visualization. The genes in this network were mainly related to flavonoid biosynthesis and cell wall metabolism (Figure 6E). The hub genes of this network included the ones encoding shikimate kinase and acidic class III chitinase, which were required for the synthesis of flavonoid precursors and the defense against pathogens and oxidative stress in grapevine, respectively (Almagro et al., 2014; Gonçalves et al., 2019). However, the mechanism of how cell wall composition influences flavonoid biosynthesis under salinity stress was still unclear. Within the network, VvMYBA3 was directly linked with the well-characterized anthocyanin genes, VvAOMT, VvF3H1 and VvMYBA2, as well as a cellulose synthase-like coding gene (VvCSLH1) and two lignin synthesis genes, caffeoyl-coenzyme A O-methyltransferase (VvCCoAOMT) and hydroxycinnamoyltransferase (VvHCT). VvAAT was co-expressed with VvAMOT and VvGST4, which were also directly connected with each other. VvPG2 was linked to VvAMOT and VvGST4 through VvCYTb5 and VvF3H2, respectively. VvLAR1 and VvLAR2 were both the co-expression partners of VvPG1. The two VvPGs were also associated with the aid of VvUGT84A13, whose homolog in pedunculate oak was identified as a candidate gene involved in gallotannin biosynthesis (Mittasch et al., 2014). CORA-like proteins are believed to play roles in magnesium uptake and storage in plants, and their gene expression is enhanced by stress conditions (Chen and Ma, 2013; Jha et al., 2021). Our data showed that VvCORA-like was mainly co-expressed with VvLARs, VvF3H2, VvHCT and two aminotransferase coding genes, suggesting that it was potentially involved in phenolic metabolism under salinity stress.
3.5 Identification of regulator candidates involved in NaCl concentration-dependent PA and anthocyanin accumulations of grape suspension cells
Besides the several genes that were constitutively responsive to salinity stress, many genes were differentially expressed depending on the NaCl concentration. The GO enrichment analysis revealed that the higher level of NaCl suppressed the expression of genes involved in cell growth processes, such as DNA replication, cell cycle regulation, spindle assembly, RNA primer synthesis, nuclear division inhibition, and meiosis II (Figure 7). This further supported the findings that high salt concentrations hindered grape suspension cell proliferation at the transcriptional level. Compared with L treatment, the H treatment enhanced the expression of genes related to phenylalanine and flavonoid metabolism in grape suspension cells at both day 4 and day 7 (Figure 7). This suggested the key roles of phenylalanine and flavonoid pathways in coping with the increased salt stress, possibly by enhancing the accumulations of PA and anthocyanin in cells.
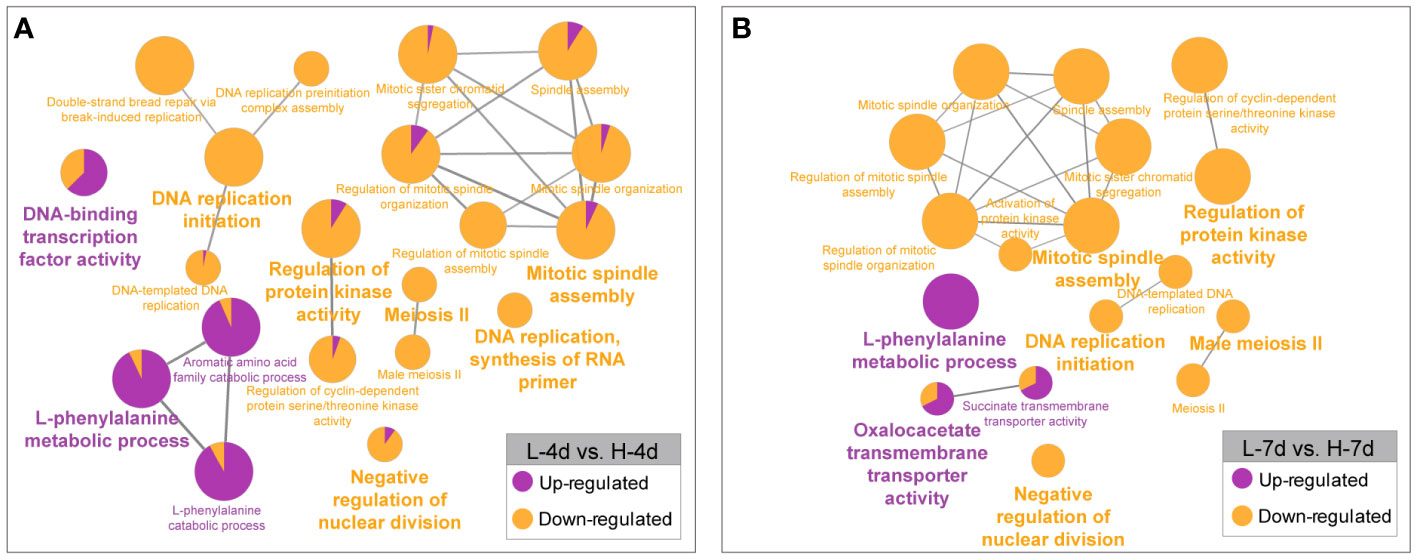
Figure 7 GO enrichment analysis of genes with NaCl dose-dependent expression. The genes that were up- or down-regulated by increasing salinity levels at day 4 (A) and day 7 (B) were analyzed separately. The results were visualized by functionally grouped networks, which show the relationships among the enriched GO terms. The node size reflects the term enrichment significance, and the proportions of up- and down-regulated genes in each term are shown in purple and orange, respectively.
To gain insights into the regulators responsible for the NaCl-dose dependent activation of PA and anthocyanin pathways in grape suspension cells, we obtained differentially expressed transcription factor genes (|Log2(FC)| > 1, padj < 0.05) from L-4d vs. H-4d and L-7d vs. H-7d comparison groups, using BLASTN against Plant Transcription Factor Database (PlantTFDB) V5.0. Seventeen transcription factors were further annotated as flavonoid pathway relevant, using BLASTX against a combined database of NCBI nr and experimentally characterized flavonoid transcription factors from crops and model species (Table 1). Five flavonoid-relevant transcription factors exhibited NaCl-dose dependent expression only at day 4 but not at day 7: VvMYBC2-L3 (VIT_14s0006g01620), which was down-regulated in H-4d compared with L-4d; and the homologs of Fragaria × ananassa FAV1 (VIT_11s0037g00010), Arabidopsis NAC32 (VIT_18s0001g02300), Prunus persica NAC25 (VIT_00s0375g00040) and VvNAC17 (VIT_19s0014g03290) were up-regulated in H-4d. Among these three NAC transcription factors, AtNAC32 represses the stress-induced anthocyanin synthesis (Mahmood et al., 2016), while PpNAC25 promotes anthocyanin accumulation (Geng et al., 2022). Moreover, Badim et al. (2022) demonstrated that overexpressing VvNAC17 in grape suspension cells induces the biosynthesis of both PA and anthocyanin. FaRAV1 has been shown to activate the general phenylpropanoid and flavonoid pathways, while its homolog in Malus domestica (MdRAV1) is found to repress PA biosynthesis (Li et al., 2020; Zhang et al., 2020). At both day 4 and day 7, the expression of VIT_01s0011g03070 (a homolog of MdRVA1), VIT_18s0001g09250 (a homolog of the anthocyanin pathway repressor AtLBD38) (Rubin et al., 2009), and VIT_08s0058g01390 (a flavonoid pathway repressor, VvWRKY70) were down-regulated in the H samples compared with the L groups. The expression levels of the homologs of anthocyanin pathway activators OsMYB3 from rice (VIT_04s0008g01800) (Zheng et al., 2021) and MdERF109 from apple (VIT_03s0063g00460) (Ma et al., 2021), the classical flavonoid activators VvMYBPA1 and VvMYBA1/2/3, and that of the well characterized PA negative regulators VvMYBC2-L1 and VvMYBC2-L2 were increased with the elevation of NaCl concentration at both time points. The up-regulation of VvMYBC2-L1 expression may partially associate with the down-regulation of VvMYBC2-L3 transcript level, as VvMYBC2-L3 is a VvMYBC2-L1 negative regulator in grapevine (Cavallini et al., 2015). This indicates that VvMYBC2-L family proteins can fine-tune each other to regulate flavonoid biosynthesis under salinity stress. A homolog of Arabidopsis AtERF4 (VIT_19s0014g02240), which is proposed to promote light-induced anthocyanin biosynthesis (Koyama and Sato, 2018), did not exhibit NaCl-dose-dependent expression at day 4 but showed lower expression level at day 7 as NaCl stress increased. These findings extended our understanding of the coordination of various of flavonoid/phenepropanoid activators and suppressors to cope with different levels of salinity stress.
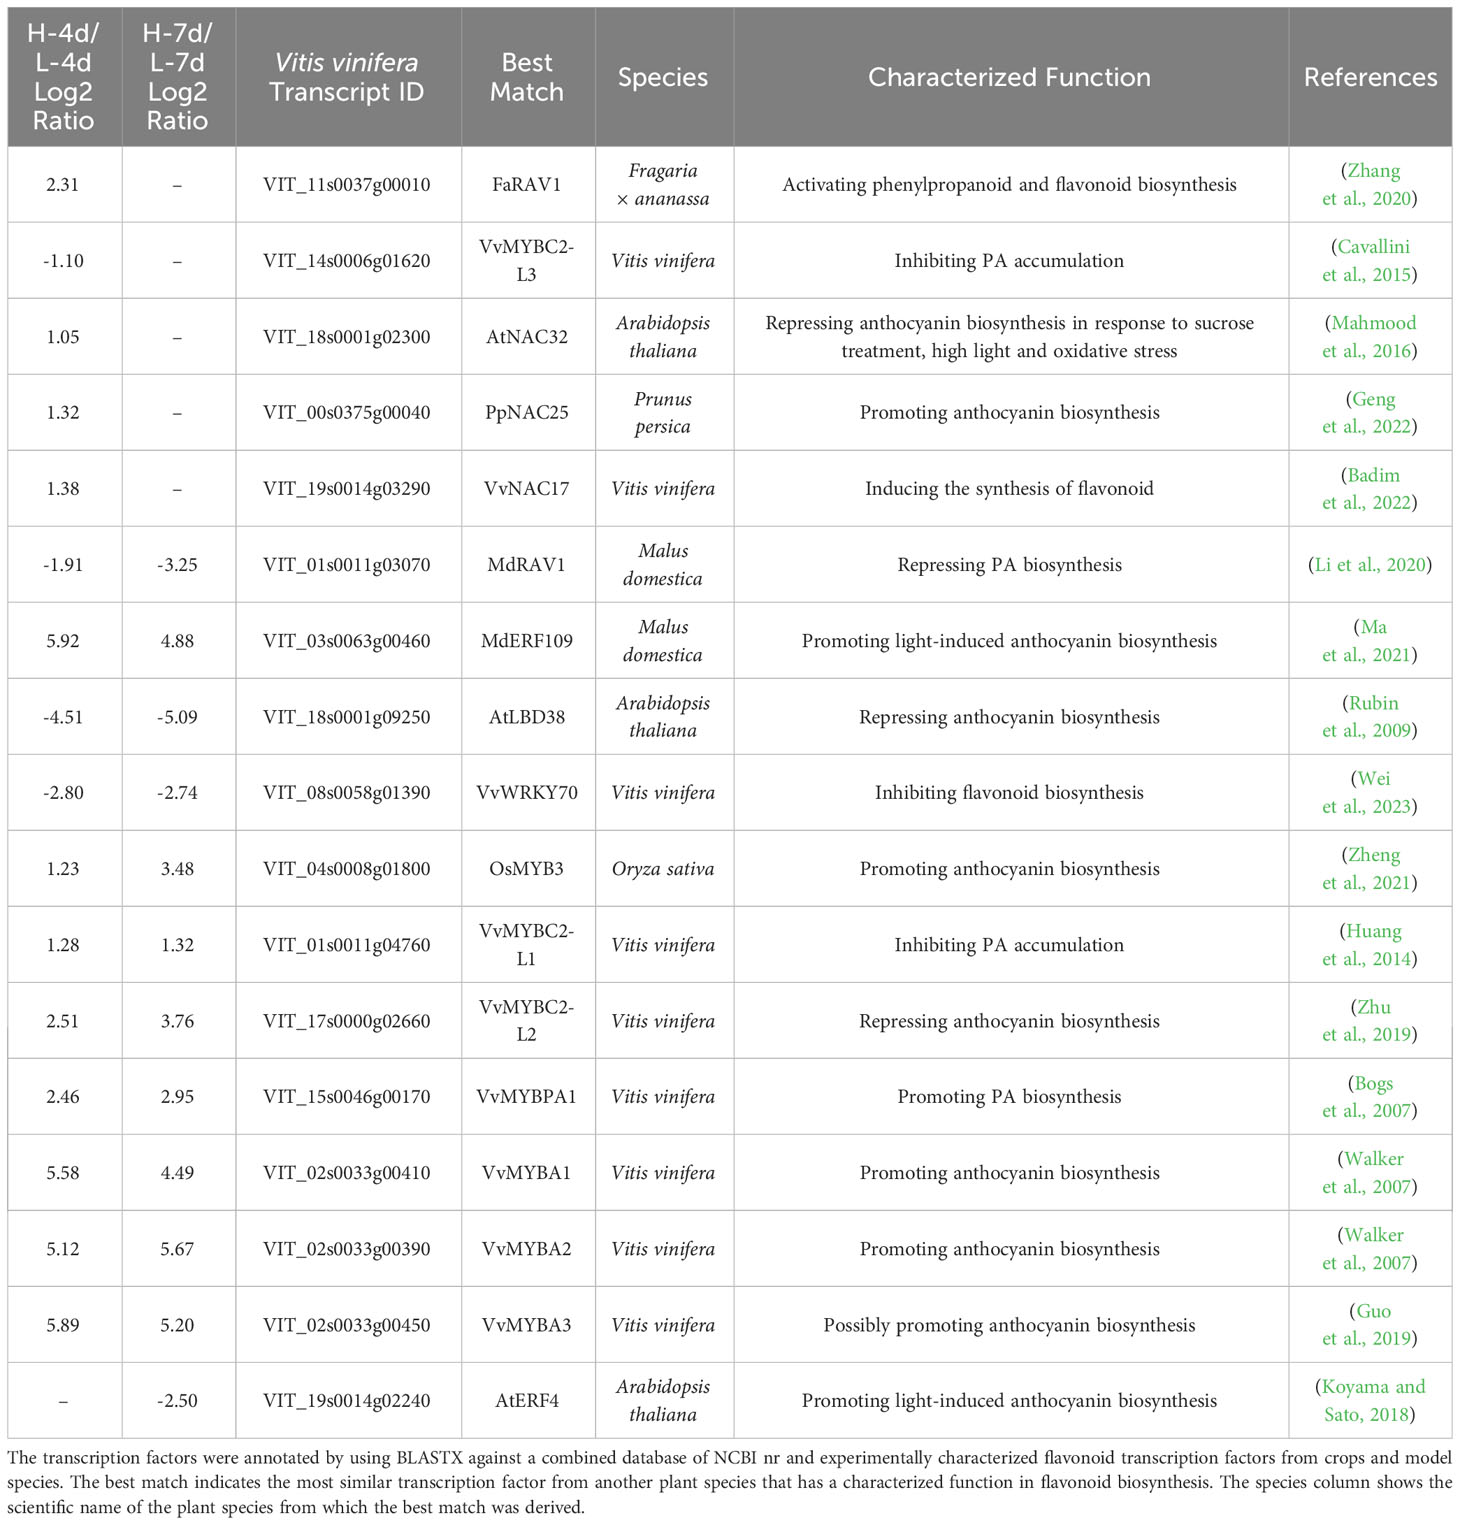
Table 1 List of the annotated flavonoid transcription factor genes with NaCl dose-dependent expression.
3.6 Salinity stress duration-dependent differential gene expression in the grape suspension cells
Salinity stress duration also had varying effects on PA content, anthocyanin accumulation, and cell fresh weight in the H and L groups (Figures 3A, 4). We identified salinity stress duration-dependent DEGs from the RNA-Seq data by excluding the DEGs that were only affected by cultivation time in the control groups (Figures 8A, D). The Venn diagram analysis showed that the L group had fewer DEGs than the H group with increasing salinity stress duration. The GO enrichment analysis showed that the L group DEGs were mainly enriched in biological processes or molecular functions related to acyltransferase activity, oligosaccharide metabolism, response to stimulus, water deprivation, and hormone (Figure 8B). The KEGG enrichment analysis showed that the L group DEGs had down-regulated expression of genes involved in flavonoid, polyketide and other secondary metabolite biosynthesis, circadian rhythm, and environmental adaptation pathways (Figure 8C). This at least explained why the extended L treatment did not result in an increase in PA and anthocyanin.
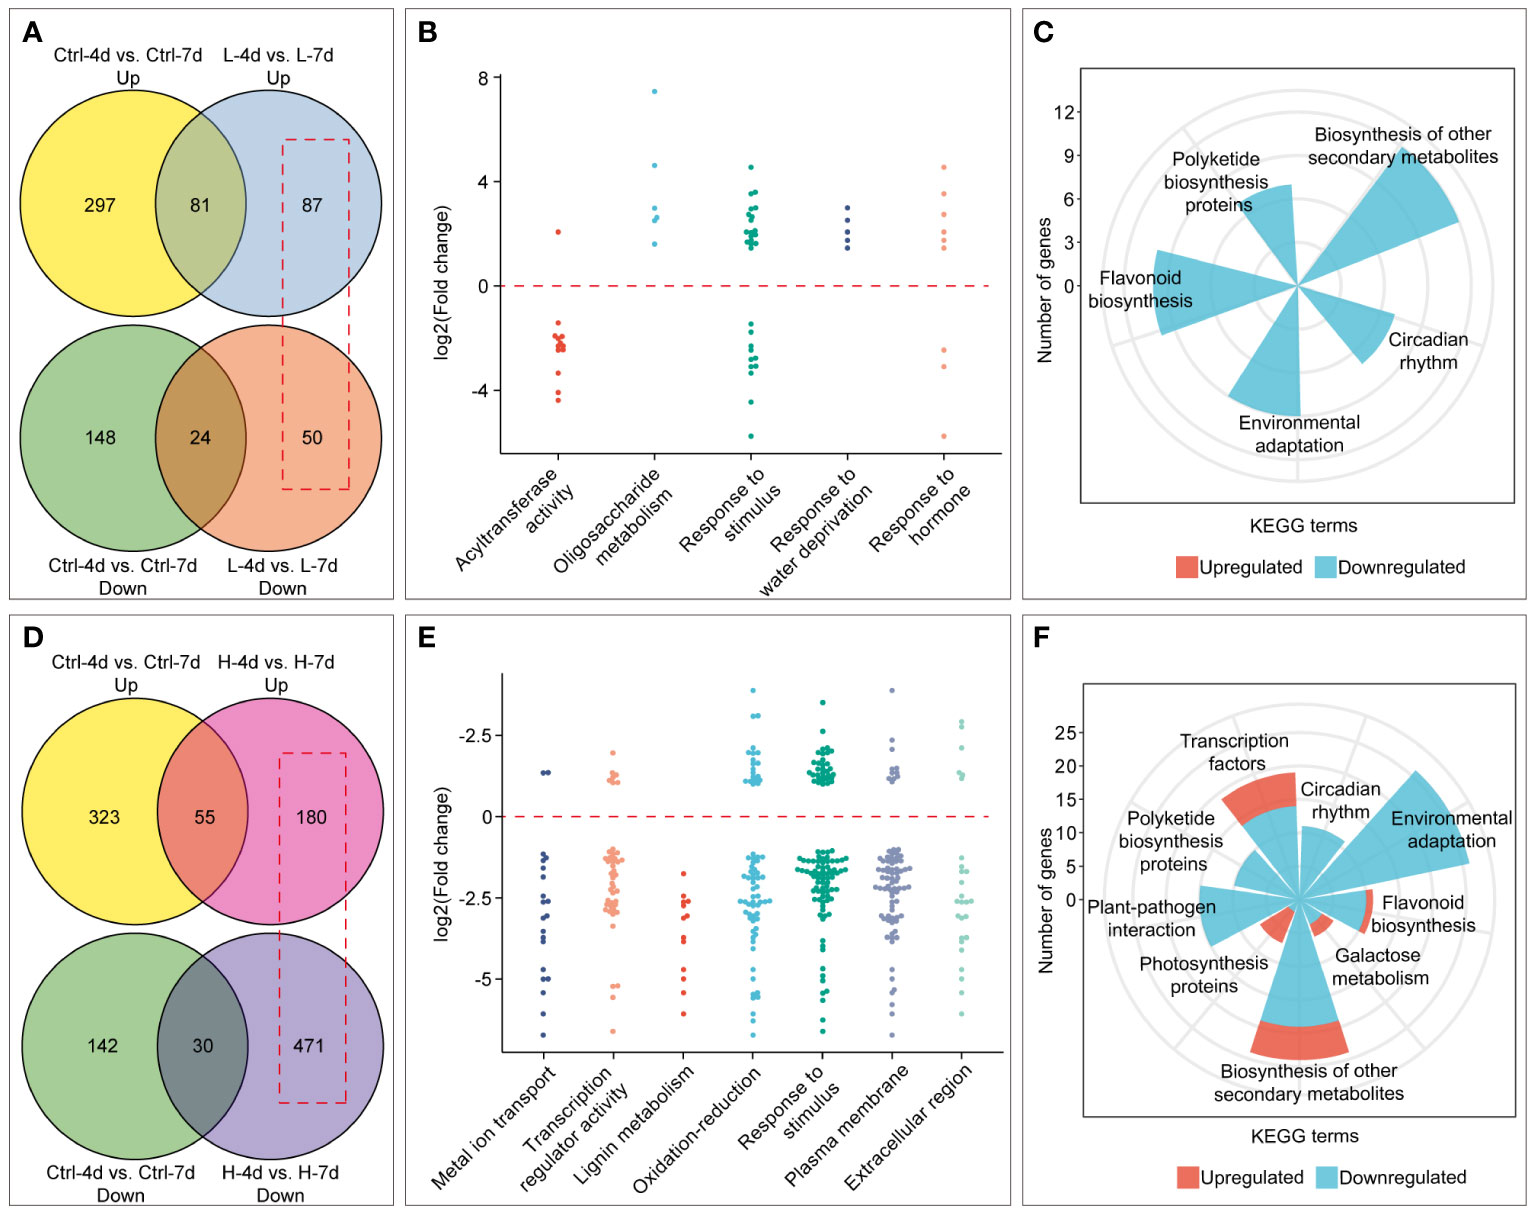
Figure 8 Identification and enrichment analysis of genes with time-dependent expression under low (L) and high (H) salinity stress. (A) and (D) Venn diagrams showing the number of genes with time-dependent expression under low and high salinity conditions, respectively, outlined in red boxes. (B) and (E) GO enrichment analysis of genes with time-dependent expression under low and high salinity conditions. Each dot represents the Log2(FC) by comparison between day 7 and day 4. (C) and (F) KEGG enrichment results of genes with time-dependent expression under low and high salinity conditions.
Compared with H-4d samples, the H-7d samples showed significant changes in gene expression patterns in grape suspension cells. A total of 651 differentially expressed genes (DEGs) were identified, of which 180 were up-regulated and 471 were down-regulated (Figure 8D). The GO enrichment analysis revealed that the extended H treatment duration may affect several biological processes or molecular functions, such as metal ion transport, lignin metabolism, response to stimulus, and oxidation-reduction (Figure 8E). These processes were likely related to the altered gene expression levels of genes associated with plasma membrane and extracellular region (Figure 8E). Moreover, KEGG pathway enrichment showed that these genes mainly involved in plant-pathogen interaction, environmental adaptation, polyketide biosynthesis, circadian rhythm, flavonoid biosynthesis, photosynthesis pathway, galactose metabolism and other secondary metabolism pathways (Figure 8F). Although flavonoid pathway was generally less active in H-7d samples compared with that of H-4d, the levels of PAs and anthocyanins were still increased as the salinity treatment prolonged (Figure 4B). This phenomenon might be partially attributed to the up-regulation of genes within the flavonoid pathway, as well as the enhanced transcription of genes related to photosynthesis, which produces precursors for flavonoids (Shao et al., 2022). In addition to the biological processes and pathways mentioned above, both GO and KEGG analyses suggested that transcription factors (TFs) were also enriched in the DEGs whose expression were affected by the duration of H stress (Figure 8E). Annotated by PlantTFDB database, there were a total of 53 TF genes (belonged to 18 protein families) differentially expressed as the H treatment time extended, with 44 being down-regulated and 9 being up-regulated (Figure 9A). Among these TFs, the proteins from ERF, MYB and WRKY families accounted for nearly a half. According to the biochemical evidence and bioinformatic prediction, 6 and 2 TF genes were classified into flavonoid activators and repressors, respectively (Figure 9A). Compared with the H-4d, the expression level of PA pathway specific activator VvMYBPA1 was increased by one-fold in the H-7d sample, while the expression of other proposed PA or anthocyanin activators, including VvHY5, VvMYBF1, and the homologs of MdWRKY40, MdERF109 and MdRAP2-4 (VIT_09s0018g00240, VIT_03s0063g00460, and VIT_18s0001g05250) (Shin et al., 2013; An et al., 2019; Li et al., 2020; Wang et al., 2020; Ma et al., 2021) was down-regulated from day 4 to day 7 under H stress (Figure 9B). This means that VvMYBPA1 is crucial for maintaining the PA accumulation as H treatment time extended, even though the general flavonoid pathway was less active. Moreover, the expression levels of the proposed flavonoid repressor VIT_01s0011g03070 and VIT_02s0025g01280 (homologs of MdRAV1 and AtWRKY41, respectively) (Ding et al., 2014; Li et al., 2020) were lower in H-7d sample than in H-4d, indicating that they might also contribute to the increased level of anthocyanin, from day 4 to day 7 under H stress.
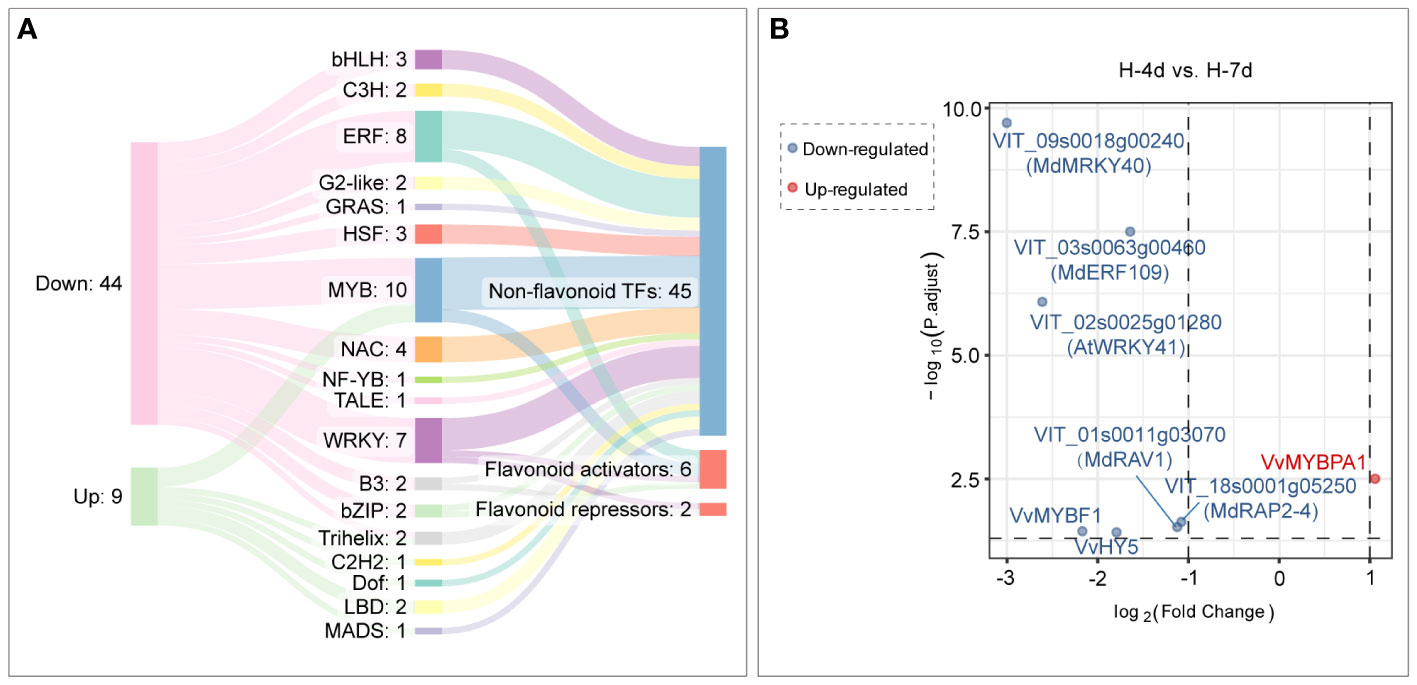
Figure 9 Transcription factor genes with time-dependent expression under high salinity stress. (A) A Sankey plot showing the expression changes, protein families, and functional annotations of transcription factor genes under high salinity stress. The left column indicates the gene expression changes, the middle column indicates the protein families that the genes encode, and the right column indicates the functional annotations of the genes. (B) Differential expression analysis of flavonoid transcription factor genes in response to durations of high salinity treatment in grape suspension cells.
4 Discussion
Plant cell suspensions offer a convenient system to study the response of secondary metabolism to stress stimuli in vivo (Onofrio et al., 2009). In this study, we used the grape berry skin-derived suspension cells to investigate the response of PA and anthocyanin metabolism to salt stress. Under both low and high levels of NaCl stress, the grape suspension cell system was able to accumulate PA and anthocyanin, to different extents. PAs and anthocyanin pathways share the common precursor leucoanthocyanidins, whose number of hydroxyl groups on the B-ring is determined by the upstream F3’H and F3’5’H. Although the levels of the five isoforms of VvF3’5’H transcripts were up-regulated by high levels of NaCl stress, the 3’5’-OH PA building blocks and anthocyanins were deficient in the present suspension cell system, which is not the case in Cabernet Sauvignon berry skins. There are more than 10 copies of VvF3’5’Hs present in the grape genome, and the variant 3’5’-OH anthocyanin profiles are associated with the pool of VvF3’5’H transcripts across different cultivars (Falginella et al., 2010). Considering this, the protein products of the detected VvF3’5’H transcripts were not catalytically efficient enough to compete for substrates with DFR and FLS. A previous study in Arabidopsis showed that distinct sets of anthocyanins can be induced by different abiotic stress conditions, and suggested that the types of decoration of anthocyanin may be used for unique purposes for stress response (Kovinich et al., 2014). Then it is possible that 3’5’-OH decoration of flavonoid backbone was not essentially required for solely responding to salt stress in grapevine, while the abundant levels of delphinidin-based anthocyanin and epi(gallo)catechin-based PAs may at least results from the interaction between temperature and light conditions in the grape berries grown in the field (Azuma et al., 2012).
Among the well characterized flavonoid regulators, VvMYB5a and VvMYB5b have been found to encode key transcription factors to activate the general flavonoid pathway in grapes (Deluc et al., 2006, 2008; Cavallini et al., 2014). However, neither of these two genes was responsive to salinity stress in the grape suspension cells. This suggests that the expression of VvMYB5a and VvMYB5b is not induced by salt stress, but might be more relevant to other environmental stimuli, e.g., light (Matus et al., 2009). VvMYBPA1 and VvMYBPA2 are the key PA specific activators in grape seeds and skins, respectively (Bogs et al., 2007; Terrier et al., 2009), while only VvMYBPA1 but not VvMYBPA2 was induced by the salt stress in grape suspension cells, which were derived from grape skins in the present study. This means that the salt stress-induced flavonoid regulation network does not essentially present in a tissue-specific manner in grape suspension cells. Moreover, VvMYBPA1 expression was enhanced by the increased salt stress level and the extended treatment time of high salinity. The genetic evidence showed that VvMYBPA1 not only activates PA branch genes, including VvLAR1 and VvANR, but also positively regulates the expression of VvCHI and VvF3’H at the upstream of flavonoid pathway (Terrier et al., 2009). Consistent with the similar expression pattern as VvMYBPA1 in response to the high salt stress, VvMYBA1, VvMYBA2 and VvNAC17 also positively target to the general flavonoid pathway (Badim et al., 2022) - this might be a strategy to compensate the absence of the functions of VvMYB5a and VvMYB5b in grape suspension cells under salinity stress. Moreover, based on homology, we identified a number of potential flavonoid transcription factors whose expressions were NaCl dose-dependent in grape suspension cells, including MYB, RAV, NAC, LBD, ERF and WRKY family proteins. Most of these transcriptional factor genes were not differentially expressed as the high salinity treatment time extended, suggesting that the regulation network they participated in might be essential for maintaining the flux channeling to PAs and anthocyanins over the time.
The expression levels of genes involved in stress response were generally decreased as the treatment duration extended, under both high and low levels of salinity stress, as shown by GO and KEGG analysis. This might indicate that grape cells were able to alleviate salinity stress over time, which was in line with the notion that PAs and anthocyanins could help plants with stress adaptation (Li and Ahammed, 2023; Yu et al., 2023). The high salinity stress also inhibited cell proliferation, resulting in no change in cell number between day 4 and day 7, whereas the low salinity stress did not severely affect cell growth, leading to an increase in cell number over time. Genetic evidence showed that high levels of PAs and anthocyanin might be cytotoxic and thus result in the high rate of the cell death (Sharma and Dixon, 2005). Recently, VvbHLH93 was identified as a flavonoid pathway suppressor in the grapevine, and its proposed biological significance is to prevent the over-accumulation of phenolic compounds that may negatively affect berry development (Cheng et al., 2022). The present study showed that VvbHLH93 expression was specifically down-regulated by the high salinity stress and remained at the same level between day 4 and day 7 in the suspension cells. Although the two PA pathway suppressors VvMYBC2-L1 and -L2 (Huang et al., 2014) were up-regulated by the salinity stress, their inhibition effects on flavonoid pathway were negligible as indicated by the metabolite data. This raises the question of whether there are any regulators can potentially balance the salinity stress response and the flavonoid production. One candidate is VvERF109, which was up-regulated by the increased level of salinity stress but down-regulated by the extended stress duration in grape suspension cells. ERF109 homologs have diverse roles: they promote anthocyanin accumulation in apple by targeting CHS, UFGT, and bHLH family regulators (Ma et al., 2021); regulate salt stress by influencing programmed cell death, ROS scavenging product biosynthesis (including phenylalanine), and hormone signal transduction in Arabidopsis (Khandelwal et al., 2008; Bahieldin et al., 2016, 2018); and respond to Noble rot infection in grape berries (Pogány et al., 2022). These studies suggest that VvERF109 might have a dual function in maintaining redox homeostasis and fine-tuning the flavonoid content to cope with the stress in grape suspension cells.
As indicated by WGCNA analysis, six out of the eight genes that consistently responded to both low and high salinity stress were present in the same module, including VvGST4, VvAOMT, VvMYBA3, VvCORA-like, and two polygalacturonase genes. Co-expression network construction showed that these six genes were associated with each other through the genes related to flavonoid and cell wall compositions. However, exactly how flavonoid pathway coordinated with the cell wall remodeling under salinity stress remains to be elucidated. The function of VvGST4 has been recently clarified to convert intermediate products of ANS into anthocyanidins (Eichenberger et al., 2023), and VvAOMT could subsequently catalyze the methylation of anthocyanins (Hugueney et al., 2009). In addition, the expression of anthocyanin activator VvMYBA2 was already induced under low salinity stress, while only at higher salt concentrations did the expression levels of PA pathway related transcription factor genes differ from the control groups. Taken together, the above evidence suggests that anthocyanin pathway is more sensitive than PA branch in response to the salinity stress in grape suspension cells. From the perspective of application, besides being the targets for enhancing salt tolerance of crops (Mansour, 2023), VvGST4 and VvAOMT might also be the potential molecular indicators of salt stress in grape cells.
Data availability statement
The datasets presented in this study can be found in online repositories. The names of the repository/repositories and accession number(s) can be found below: NCBI Sequence Read Archive, PRJNA1048521.
Author contributions
KZ: Conceptualization, Data curation, Investigation, Methodology, Writing – original draft. YL: Investigation, Methodology, Writing – review & editing. YS: Conceptualization, Writing – review & editing. CD: Conceptualization, Funding acquisition, Resources, Writing – review & editing. KY: Conceptualization, Funding acquisition, Project administration, Resources, Writing – review & editing, Writing – original draft.
Funding
The author(s) declare financial support was received for the research, authorship, and/or publication of this article. This research was supported by the National Natural Science Foundation of China (U20A2042 and 32202452), and Wine Industry Development Project of Department of Commerce of Gansu Province (GSPTJZX-2020-4).
Acknowledgments
We thank Mingyue Zhang and Jinlu Feng (China Agricultural University) for useful suggestions in grape cell suspension cultivation, and Dr. Mengyao Qi (China Agricultural University) for technical assistance in LC/MS analysis.
Conflict of interest
The authors declare that the research was conducted in the absence of any commercial or financial relationships that could be construed as a potential conflict of interest.
Publisher’s note
All claims expressed in this article are solely those of the authors and do not necessarily represent those of their affiliated organizations, or those of the publisher, the editors and the reviewers. Any product that may be evaluated in this article, or claim that may be made by its manufacturer, is not guaranteed or endorsed by the publisher.
Supplementary material
The Supplementary Material for this article can be found online at: https://www.frontiersin.org/articles/10.3389/fpls.2024.1351008/full#supplementary-material
References
Almagro, L., Carbonell-Bejerano, P., Belchí-Navarro, S., Bru, R., Martínez-Zapater, J. M., Lijavetzky, D., et al. (2014). Dissecting the transcriptional response to elicitors in Vitis vinifera cells. PloS One 9, e109777. doi: 10.1371/journal.pone.0109777
An, J. P., Zhang, X. W., You, C. X., Bi, S. Q., Wang, X. F., Hao, Y. J. (2019). MdWRKY40 promotes wounding-induced anthocyanin biosynthesis in association with MdMYB1 and undergoes MdBT2-mediated degradation. New Phytol. 224, 380–395. doi: 10.1111/nph.16008
Ayenew, B., Degu, A., Manela, N., Perl, A., Oren-Shamir, M., Fait, A. (2015). Metabolite profiling and transcript analysis reveal specificities in the response of a berry derived cell culture to abiotic stresses. Front. Plant Sci. 6. doi: 10.3389/fpls.2015.00728
Azuma, A., Yakushiji, H., Koshita, Y., Kobayashi, S. (2012). Flavonoid biosynthesis-related genes in grape skin are differentially regulated by temperature and light conditions. Planta 236, 1067–1080. doi: 10.1007/s00425-012-1650-x
Badim, H., Vale, M., Coelho, M., Granell, A., Gerós, H., Conde, A. (2022). Constitutive expression of VviNAC17 transcription factor significantly induces the synthesis of flavonoids and other phenolics in transgenic grape berry cells. Front. Plant Sci. 13. doi: 10.3389/fpls.2022.964621
Bahieldin, A., Atef, A., Edris, S., Gadalla, N. O., Ali, H. M., Hassan, S. M., et al. (2016). Ethylene responsive transcription factor ERF109 retards PCD and improves salt tolerance in plant. BMC Plant Biol. 16, 216. doi: 10.1186/s12870-016-0908-z
Bahieldin, A., Atef, A., Edris, S., Gadalla, N. O., Ramadan, A. M., Hassan, S. M., et al. (2018). Multifunctional activities of ERF109 as affected by salt stress in Arabidopsis. Sci. Rep. 8, 6403. doi: 10.1038/s41598-018-24452-6
Bindea, G., Mlecnik, B., Hackl, H., Charoentong, P., Tosolini, M., Kirilovsky, A., et al. (2009). ClueGO: a Cytoscape plug-in to decipher functionally grouped gene ontology and pathway annotation networks. Bioinformatics 25, 1091–1093. doi: 10.1093/bioinformatics/btp101
Bogs, J., Downey, M. O., Harvey, J. S., Ashton, A. R., Tanner, G. J., Robinson, S. P. (2005). Proanthocyanidin synthesis and expression of genes encoding leucoanthocyanidin reductase and anthocyanidin reductase in developing grape berries and grapevine leaves. Plant Physiol. 139, 652–663. doi: 10.1104/pp.105.064238
Bogs, J., Ebadi, A., McDavid, D., Robinson, S. P. (2006). Identification of the flavonoid hydroxylases from grapevine and their regulation during fruit development. Plant Physiol. 140, 279–291. doi: 10.1104/pp.105.073262
Bogs, J., Jaffé, F. W., Takos, A. M., Walker, A. R., Robinson, S. P. (2007). The grapevine transcription factor VvMYBPA1 regulates proanthocyanidin synthesis during fruit development. Plant Physiol. 143, 1347–1361. doi: 10.1104/pp.106.093203
Britsch, L., Grisebach, H. (1986). Purification and characterization of (2S)-flavanone 3-hydroxylase from Petunia hybrida. Eur. J. Biochem. 156, 569–577. doi: 10.1111/j.1432-1033.1986.tb09616.x
Cavallini, E., Matus, J. T., Finezzo, L., Zenoni, S., Loyola, R., Guzzo, F., et al. (2015). The phenylpropanoid pathway is controlled at different branches by a set of R2R3-MYB C2 repressors in grapevine. Plant Physiol. 167, 1448–1470. doi: 10.1104/pp.114.256172
Cavallini, E., Zenoni, S., Finezzo, L., Guzzo, F., Zamboni, A., Avesani, L., et al. (2014). Functional diversification of grapevine MYB5a and MYB5b in the control of flavonoid biosynthesis in a petunia anthocyanin regulatory mutant. Plant Cell Physiol. 55, 517–534. doi: 10.1093/pcp/pct190
Chele, K. H., Tinte, M. M., Piater, L. A., Dubery, I. A., Tugizimana, F. (2021). Soil salinity, a serious environmental issue and plant responses: A metabolomics perspective. Metabolites 11, 724. doi: 10.3390/metabo11110724
Chen, C., Chen, H., Zhang, Y., Thomas, H. R., Frank, M. H., He, Y., et al. (2020). TBtools: an integrative toolkit developed for interactive analyses of big biological data. Mol. Plant 13, 1194–1202. doi: 10.1016/j.molp.2020.06.009
Chen, Z. C., Ma, J. F. (2013). Magnesium transporters and their role in Al tolerance in plants. Plant Soil 368, 51–56. doi: 10.1007/s11104-012-1433-y
Cheng, J., Shi, Y., Wang, J., Duan, C., Yu, K. (2022). Transcription factor VvibHLH93 negatively regulates proanthocyanidin biosynthesis in grapevine. Front. Plant Sci. 13. doi: 10.3389/fpls.2022.1007895
Cheng, J., Yu, K., Shi, Y., Wang, J., Duan, C. (2021). Transcription factor VviMYB86 oppositely regulates proanthocyanidin and anthocyanin biosynthesis in grape berries. Front. Plant Sci. 11. doi: 10.3389/fpls.2020.613677
Decendit, A., Waffo-Teguo, P., Richard, T., Krisa, S., Vercauteren, J., Monti, J.-P., et al. (2002). Galloylated catechins and stilbene diglucosides in Vitis vinifera cell suspension cultures. Phytochemistry 60, 795–798. doi: 10.1016/S0031-9422(02)00149-8
Deluc, L., Barrieu, F., Marchive, C., Lauvergeat, V., Decendit, A., Richard, T., et al. (2006). Characterization of a grapevine R2R3-MYB transcription factor that regulates the phenylpropanoid pathway. Plant Physiol. 140, 499–511. doi: 10.1104/pp.105.067231
Deluc, L., Bogs, J., Walker, A. R., Ferrier, T., Decendit, A., Merillon, J.-M., et al. (2008). The transcription factor VvMYB5b contributes to the regulation of anthocyanin and proanthocyanidin biosynthesis in developing grape berries. Plant Physiol. 147, 2041–2053. doi: 10.1104/pp.108.118919
Ding, Z. J., Yan, J. Y., Li, G. X., Wu, Z. C., Zhang, S. Q., Zheng, S. J. (2014). WRKY41 controls Arabidopsis seed dormancy via direct regulation of ABI3 transcript levels not downstream of ABA. Plant J. 79, 810–823. doi: 10.1111/tpj.12597
Eichenberger, M., Schwander, T., Hüppi, S., Kreuzer, J., Mittl, P. R. E., Peccati, F., et al. (2023). The catalytic role of glutathione transferases in heterologous anthocyanin biosynthesis. Nat. Catal. 6, 927–938. doi: 10.1038/s41929-023-01018-y
Falginella, L., Castellarin, S. D., Testolin, R., Gambetta, G. A., Morgante, M., Di Gaspero, G. (2010). Expansion and subfunctionalisation of flavonoid 3’,5’-hydroxylases in the grapevine lineage. BMC Genomics 11, 1–18. doi: 10.1186/1471-2164-11-562
Fischer, D., Stich, K., Britsch, L., Grisebach, H. (1988). Purification and characterization of (+)dihydroflavonol (3-hydroxyflavanone) 4-reductase from flowers of Dahlia variabilis. Arch. Biochem. Biophys. 264, 40–47. doi: 10.1016/0003-9861(88)90567-X
Ford, C. M., Boss, P. K., Høj, P. B. (1998). Cloning and characterization of vitis viniferaUDP-Glucose: flavonoid 3-O-glucosyltransferase, a homologue of the enzyme encoded by the maize bronze-1Locus that may primarily serve to glucosylate anthocyanidins in vivo. J. Biol. Chem. 273, 9224–9233. doi: 10.1074/jbc.273.15.9224
Forkmann, G., Heller, W., Grisebach, H. (1980). Anthocyanin biosynthesis in flowers of Matthiola incana flavanone 3-and flavonoid 3′-hydroxylases. Z. Für Naturforschung C 35, 691–695. doi: 10.1515/znc-1980-9-1004
Fournier-Level, A., Le Cunff, L., Gomez, C., Doligez, A., Ageorges, A., Roux, C., et al. (2009). Quantitative genetic bases of anthocyanin variation in grape (Vitis vinifera L. ssp. sativa) berry: a quantitative trait locus to quantitative trait nucleotide integrated study. Genetics 183, 1127–1139. doi: 10.1534/genetics.109.103929
Garrido-Bañuelos, G., Buica, A., du Toit, W. (2022). Relationship between anthocyanins, proanthocyanidins, and cell wall polysaccharides in grapes and red wines. A current state-of-art review. Crit. Rev. Food Sci. Nutr. 62, 7743–7759. doi: 10.1080/10408398.2021.1918056
Geng, M., Shao, Y., Zhang, M., Zheng, X., Tan, B., Wang, W., et al. (2022). Overexpression of peach NAC25 promotes anthocyanin biosynthesis in poplar shoots. Fruit Res. 2, 1–9. doi: 10.48130/FruRes-2022-0021
Gonçalves, M. F. M., Nunes, R. B., Tilleman, L., Van de Peer, Y., Deforce, D., Van Nieuwerburgh, F., et al. (2019). Dual RNA sequencing of Vitis vinifera during Lasiodiplodia theobromae infection unveils host–pathogen interactions. Int. J. Mol. Sci. 20, 6083. doi: 10.3390/ijms20236083
Guo, D. L., Zhao, H. L., Li, Q., Zhang, G. H., Jiang, J. F., Liu, C. H., et al. (2019). Genome-wide association study of berry-related traits in grape [Vitis vinifera L.] based on genotyping-by-sequencing markers. Hortic. Res. 6, 11. doi: 10.1038/s41438-018-0089-z
Han, N., Li, L., Wang, F., Yang, Z., He, X. (2024). Moderate salt spraying on grapevine canopy induces differential modulation of anthocyanin synthesis profiles during early and late stages of berry ripening in Cabernet Sauvignon. Hortic. Environ. Biotechnol. 65, 71–81. doi: 10.1007/s13580-023-00554-7
Hrazdina, G., Lifson, E., Weeden, N. F. (1986). Isolation and characterization of buckwheat (Fagopyrum esculentum M.) chalcone synthase and its polyclonal antibodies. Arch. Biochem. Biophys. 247, 414–419. doi: 10.1016/0003-9861(86)90600-4
Huang, Y.-F., Vialet, S., Guiraud, J.-L., Torregrosa, L., Bertrand, Y., Cheynier, V., et al. (2014). A negative MYB regulator of proanthocyanidin accumulation, identified through expression quantitative locus mapping in the grape berry. New Phytol. 201, 795–809. doi: 10.1111/nph.12557
Hugueney, P., Provenzano, S., Verriès, C., Ferrandino, A., Meudec, E., Batelli, G., et al. (2009). A novel cation-dependent O-methyltransferase involved in anthocyanin methylation in grapevine. Plant Physiol. 150, 2057–2070. doi: 10.1104/pp.109.140376
Jan, R., Kim, N., Lee, S.-H., Khan, M. A., Asaf, S., Lubna, et al. (2021). Enhanced flavonoid accumulation reduces combined salt and heat stress through regulation of transcriptional and hormonal mechanisms. Front. Plant Sci. 12. doi: 10.3389/fpls.2021.796956
Jha, R. K., Patel, J., Patel, M. K., Mishra, A., Jha, B. (2021). Introgression of a novel cold and drought regulatory-protein encoding CORA-like gene, SbCDR, induced osmotic tolerance in transgenic tobacco. Physiol. Plant 172, 1170–1188. doi: 10.1111/ppl.13280
Jun, J. H., Lu, N., Docampo-Palacios, M., Wang, X., Dixon, R. A. (2021). Dual activity of anthocyanidin reductase supports the dominant plant proanthocyanidin extension unit pathway. Sci. Adv. 7, eabg4682. doi: 10.1126/sciadv.abg4682
Khandelwal, A., Elvitigala, T., Ghosh, B., Quatrano, R. S. (2008). Arabidopsis transcriptome reveals control circuits regulating redox homeostasis and the role of an AP2 transcription factor. Plant Physiol. 148, 2050–2058. doi: 10.1104/pp.108.128488
Kim, D., Jeon, S. J., Yanders, S., Park, S., Kim, H. S., Kim, S. (2022). MYB3 plays an important role in lignin and anthocyanin biosynthesis under salt stress condition in Arabidopsis. Plant Cell Rep. 41, 1549–1560. doi: 10.1007/s00299-022-02878-7
Kovinich, N., Kayanja, G., Chanoca, A., Riedl, K., Otegui, M. S., Grotewold, E. (2014). Not all anthocyanins are born equal: distinct patterns induced by stress in Arabidopsis. Planta 240, 931–940. doi: 10.1007/s00425-014-2079-1
Koyama, K., Numata, M., Nakajima, I., Goto-Yamamoto, N., Matsumura, H., Tanaka, N. (2014). Functional characterization of a new grapevine MYB transcription factor and regulation of proanthocyanidin biosynthesis in grapes. J. Exp. Bot. 65, 4433–4449. doi: 10.1093/jxb/eru213
Koyama, T., Sato, F. (2018). The function of ETHYLENE RESPONSE FACTOR genes in the light-induced anthocyanin production of Arabidopsis thaliana leaves. Plant Biotechnol. 35, 87–91. doi: 10.5511/plantbiotechnology.18.0122b
Larronde, F., Krisa, S., Decendit, A., Chèze, C., Deffieux, G., Mérillon, J. M. (1998). Regulation of polyphenol production in Vitis vinifera cell suspension cultures by sugars. Plant Cell Rep. 17, 946–950. doi: 10.1007/s002990050515
Li, Z., Ahammed, G. J. (2023). Plant stress response and adaptation via anthocyanins: A review. Plant Stress 10, 100230. doi: 10.1016/j.stress.2023.100230
Li, H., Han, M., Yu, L., Wang, S., Zhang, J., Tian, J., et al. (2020). Transcriptome analysis identifies two ethylene response factors that regulate proanthocyanidin biosynthesis during Malus Crabapple fruit development. Front. Plant Sci. 11. doi: 10.3389/fpls.2020.00076
Li, S. Y., He, F., Zhu, B. Q., Wang, J., Duan, C. Q. (2017). Comparison of phenolic and chromatic characteristics of dry red wines made from native Chinese grape species and vitis vinifera. Int. J. Food Prop. 20, 2134–2146. doi: 10.1080/10942912.2016.1233117
Li, X. L., Wang, C. R., Li, X. Y., Yao, Y. X., Hao, Y. J. (2013). Modifications of Kyoho grape berry quality under long-term NaCl treatment. Food Chem. 139, 931–937. doi: 10.1016/j.foodchem.2013.02.038
Lotkowska, M. E., Tohge, T., Fernie, A. R., Xue, G.-P., Balazadeh, S., Mueller-Roeber, B. (2015). The Arabidopsis transcription factor MYB112 promotes anthocyanin formation during salinity and under high light stress. Plant Physiol. 169, 1862–1880. doi: 10.1104/pp.15.00605
Ma, W., Guo, A., Zhang, Y., Wang, H., Liu, Y., Li, H. (2014). A review on astringency and bitterness perception of tannins in wine. Trends Food Sci. Technol. 40, 6–19. doi: 10.1016/j.tifs.2014.08.001
Ma, H., Yang, T., Li, Y., Zhang, J., Wu, T., Song, T., et al. (2021). The long noncoding RNA MdLNC499 bridges MdWRKY1 and MdERF109 function to regulate early-stage light-induced anthocyanin accumulation in apple fruit. Plant Cell 33, 3309–3330. doi: 10.1093/plcell/koab188
Mahmood, K., Xu, Z., El-Kereamy, A., Casaretto, J. A., Rothstein, S. J. (2016). The Arabidopsis transcription factor ANAC032 represses anthocyanin biosynthesis in response to high sucrose and oxidative and abiotic stresses. Front. Plant Sci. 7. doi: 10.3389/fpls.2016.01548
Mansour, M. M. F. (2023). Anthocyanins: Biotechnological targets for enhancing crop tolerance to salinity stress. Sci. Hortic. 319, 112182. doi: 10.1016/j.scienta.2023.112182
Matus, J. T., Loyola, R., Vega, A., Peña-Neira, A., Bordeu, E., Arce-Johnson, P., et al. (2009). Post-veraison sunlight exposure induces MYB-mediated transcriptional regulation of anthocyanin and flavonol synthesis in berry skins of Vitis vinifera. J. Exp. Bot. 60, 853–867. doi: 10.1093/jxb/ern336
Menting, J. G. T., Scopes, R. K., Stevenson, T. W. (1994). Characterization of flavonoid 3’,5’-hydroxylase in microsomal membrane fraction of Petunia hybrida flowers. Plant Physiol. 106, 633–642. doi: 10.1104/pp.106.2.633
Mittasch, J., Böttcher, C., Frolova, N., Bönn, M., Milkowski, C. (2014). Identification of UGT84A13 as a candidate enzyme for the first committed step of gallotannin biosynthesis in pedunculate oak (Quercus robur). Phytochemistry 99, 44–51. doi: 10.1016/j.phytochem.2013.11.023
Moustafa, E., Wong, E. (1967). Purification and properties of chalcone-flavanone isomerase from soya bean seed. Phytochemistry 6, 625–632. doi: 10.1016/S0031-9422(00)86001-X
Munns, R., Tester, M. (2008). Mechanisms of salinity tolerance. Annu. Rev. Plant Biol. 59, 651–681. doi: 10.1146/annurev.arplant.59.032607.092911
Onofrio, C. D., Cox, A., Davies, C., Boss, P. K. (2009). Induction of secondary metabolism in grape cell cultures by jasmonates. Funct. Plant Biol. 36, 323–338. doi: 10.1071/FP08280
Osuga, K., Masuda, H., Komamine, A., Geesin, J. C. (1999). Synchronization of somatic embryogenesis at high frequency using carrot suspension cultures: model systems and application in plant development. Methods Cell Sci. 21, 129–140. doi: 10.1023/A:1009884806166
Pérez-Díaz, R., Madrid-Espinoza, J., Salinas-Cornejo, J., González-Villanueva, E., Ruiz-Lara, S. (2016). Differential roles for VviGST1, VviGST3, and VviGST4 in proanthocyanidin and anthocyanin transport in Vitis vinifera. Front. Plant Sci. 7, 1166. doi: 10.3389/fpls.2016.01166
Pogány, M., Dankó, T., Hegyi-Kaló, J., Kámán-Tóth, E., Szám, D. R., Hamow, K. Á., et al. (2022). Redox and Hormonal Changes in the Transcriptome of Grape (Vitis vinifera) Berries during Natural Noble Rot Development. Plants 11, 864. doi: 10.3390/plants11070864
Rasmussen, S., Dixon, R. A. (1999). Transgene-mediated and elicitor-induced perturbation of metabolic channeling at the entry point into the phenylpropanoid pathway. Plant Cell 11, 1537–1551. doi: 10.1105/tpc.11.8.1537
Ric-Varas, P., Barceló, M., Rivera, J. A., Cerezo, S., Matas, A. J., Schückel, J., et al. (2020). Exploring the use of fruit callus culture as a model system to study color development and cell wall remodeling during strawberry fruit ripening. Plants 9, 805. doi: 10.3390/plants9070805
Rubin, G., Tohge, T., Matsuda, F., Saito, K., Scheible, W.-R. (2009). Members of the LBD family of transcription factors repress anthocyanin synthesis and affect additional nitrogen responses in Arabidopsis. Plant Cell 21, 3567–3584. doi: 10.1105/tpc.109.067041
Schilmiller, A. L., Stout, J., Weng, J.-K., Humphreys, J., Ruegger, M. O., Chapple, C. (2009). Mutations in the cinnamate 4-hydroxylase gene impact metabolism, growth and development in Arabidopsis. Plant J. 60, 771–782. doi: 10.1111/j.1365-313X.2009.03996.x
Shah, A., Smith, D. L. (2020). Flavonoids in agriculture: chemistry and roles in, biotic and abiotic stress responses, and microbial associations. Agronomy 10, 1209. doi: 10.3390/agronomy10081209
Shao, D., Zhu, Q., Liang, Q., Wang, X., Li, Y., Sun, Y., et al. (2022). Transcriptome analysis reveals differences in anthocyanin accumulation in cotton (Gossypium hirsutum L.) induced by red and blue light. Front. Plant Sci. 13. doi: 10.3389/fpls.2022.788828
Sharma, S. B., Dixon, R. A. (2005). Metabolic engineering of proanthocyanidins by ectopic expression of transcription factors in Arabidopsis thaliana. Plant J. 44, 62–75. doi: 10.1111/j.1365-313X.2005.02510.x
Shin, D. H., Choi, M., Kim, K., Bang, G., Cho, M., Choi, S.-B., et al. (2013). HY5 regulates anthocyanin biosynthesis by inducing the transcriptional activation of the MYB75/PAP1 transcription factor in Arabidopsis. FEBS Lett. 587, 1543–1547. doi: 10.1016/j.febslet.2013.03.037
Terrier, N., Torregrosa, L., Ageorges, A., Vialet, S., Verriès, C., Cheynier, V., et al. (2009). Ectopic expression of VvMybPA2 promotes proanthocyanidin biosynthesis in grapevine and suggests additional targets in the pathway. Plant Physiol. 149, 1028–1041. doi: 10.1104/pp.108.131862
Vitrac, X., Larronde, F., Krisa, S., Decendit, A., Deffieux, G., Mérillon, J.-M. (2000). Sugar sensing and Ca2+–calmodulin requirement in Vitis vinifera cells producing anthocyanins. Phytochemistry 53, 659–665. doi: 10.1016/S0031-9422(99)00620-2
Walker, A. R., Lee, E., Bogs, J., McDavid, D. A. J., Thomas, M. R., Robinson, S. P. (2007). White grapes arose through the mutation of two similar and adjacent regulatory genes. Plant J. 49, 772–785. doi: 10.1111/j.1365-313X.2006.02997.x
Walker, R. R., Read, P. E., Blackmore, D. H. (2000). Rootstock and salinity effects on rates of berry maturation, ion accumulation and colour development in Shiraz grapes. Aust. J. Grape Wine Res. 6, 227–239. doi: 10.1111/j.1755-0238.2000.tb00183.x
Wang, J., Wang, F., Jin, C., Tong, Y., Wang, T. (2020). A R2R3-MYB transcription factor VvMYBF1 from grapevine (Vitis vinifera L.) regulates flavonoids accumulation and abiotic stress tolerance in transgenic Arabidopsis. J. Hortic. Sci. Biotechnol. 95, 147–161. doi: 10.1080/14620316.2019.1665480
Wei, Y., Meng, N., Wang, Y., Cheng, J., Duan, C., Pan, Q. (2023). Transcription factor VvWRKY70 inhibits both norisoprenoid and flavonol biosynthesis in grape. Plant Physiol. 193, 2055–2070. doi: 10.1093/plphys/kiad423
Yu, K., Dixon, R. A., Duan, C. (2022). A role for ascorbate conjugates of (+)-catechin in proanthocyanidin polymerization. Nat. Commun. 13, 3425. doi: 10.1038/s41467-022-31153-2
Yu, K., Jun, J. H., Duan, C., Dixon, R. A. (2019). VvLAR1 and VvLAR2 are bifunctional enzymes for proanthocyanidin biosynthesis in grapevine. Plant Physiol. 180, 1362–1374. doi: 10.1104/pp.19.00447
Yu, K., Song, Y., Lin, J., Dixon, R. A. (2023). The complexities of proanthocyanidin biosynthesis and its regulation in plants. Plant Commun. 4, 100498. doi: 10.1016/j.xplc.2022.100498
Zhang, W., Curtin, C., Kikuchi, M., Franco, C. (2002). Integration of jasmonic acid and light irradiation for enhancement of anthocyanin biosynthesis in Vitis vinifera suspension cultures. Plant Sci. 162, 459–468. doi: 10.1016/S0168-9452(01)00586-6
Zhang, X. K., Jeffery, D. W., Li, D. M., Lan, Y., Zhao, X., Duan, C. Q. (2022). Red wine coloration: A review of pigmented molecules, reactions, and applications. Compr. Rev. Food Sci. Food Saf. 21, 3834–3866. doi: 10.1111/1541-4337.13010
Zhang, Z., Shi, Y., Ma, Y., Yang, X., Yin, X., Zhang, Y., et al. (2020). The strawberry transcription factor FaRAV1 positively regulates anthocyanin accumulation by activation of FaMYB10 and anthocyanin pathway genes. Plant Biotechnol. J. 18, 2267–2279. doi: 10.1111/pbi.13382
Zheng, J., Wu, H., Zhao, M., Yang, Z., Zhou, Z., Guo, Y., et al. (2021). OsMYB3 is a R2R3-MYB gene responsible for anthocyanin biosynthesis in black rice. Mol. Breed. 41, 51. doi: 10.1007/s11032-021-01244-x
Zhou-Tsang, A., Wu, Y., Henderson, S. W., Walker, A. R., Borneman, A. R., Walker, R. R., et al. (2021). Grapevine salt tolerance. Aust. J. Grape Wine Res. 27, 149–168. doi: 10.1111/ajgw.12487
Keywords: grape, proanthocyanidins, anthocyanins, salinity, suspension cells, flavonoid biosynthesis, transcription factors, WGCNA
Citation: Zhao K, Lan Y, Shi Y, Duan C and Yu K (2024) Metabolite and transcriptome analyses reveal the effects of salinity stress on the biosynthesis of proanthocyanidins and anthocyanins in grape suspension cells. Front. Plant Sci. 15:1351008. doi: 10.3389/fpls.2024.1351008
Received: 06 December 2023; Accepted: 07 March 2024;
Published: 21 March 2024.
Edited by:
Xiupeng Mei, Southwest University, ChinaReviewed by:
Guoxiang Jiang, Chinese Academy of Sciences (CAS), ChinaWenjian Yu, Beijing Academy of Agriculture and Forestry Sciences, China
Copyright © 2024 Zhao, Lan, Shi, Duan and Yu. This is an open-access article distributed under the terms of the Creative Commons Attribution License (CC BY). The use, distribution or reproduction in other forums is permitted, provided the original author(s) and the copyright owner(s) are credited and that the original publication in this journal is cited, in accordance with accepted academic practice. No use, distribution or reproduction is permitted which does not comply with these terms.
*Correspondence: Keji Yu, yukeji@bjfu.edu.cn