 Hui Li1,2
 Shiping Zhu
 Pei Wang
- 1College of Engineering and Technology, Key Laboratory of Agricultural Equipment for Hilly and Mountain Areas, Southwest University, Chongqing, China
- 2Key Laboratory of Modern Agricultural Equipment and Technology (Jiangsu University), Ministry of Education, School of Agricultural Engineering, Jiangsu University, Zhenjiang, China
- 3National Citrus Engineering Research Center, Chinese Academy of Agricultural Sciences & Southwest University, Chongqing, China
- 4Interdisciplinary Research Center for Agriculture Green Development in Yangtze River Basin, College of Resources and Environment, Southwest University, Chongqing, China
- 5Institute of Urban Agriculture, Chinese Academy of Agricultural Sciences, Chengdu, China
Introduction: The micronutrient deficiency of iron and boron is a common issue affecting the growth of rapeseed (Brassica napus). In this study, a non-destructive diagnosis method for iron and boron deficiency in Brassica napus (genotype: Zhongshuang 11) using hyperspectral imaging technology was established.
Methods: The recognition accuracy was compared using the Fisher Linear Discriminant Analysis (LDA) and Support Vector Machine (SVM) recognition models. Recognition results showed that Multiple Scattering Correction (MSC) could be applied for the full band hyperspectral data processing, while the LDA models presented better performance on establishing the leaf iron and boron deficiency symptom recognition than the SVM models.
Results: The recognition accuracy of the training set reached 96.67%, and the recognition rate of the prediction set could be 91.67%. To improve the model accuracy, the Competitive Adaptive Reweighted Sampling algorithm (CARS) was added to construct the MSC-CARS-LDA model. 33 featured wavelengths were selected via CARS. The recognition accuracy of the MSC-CARS-LDA training set was 100%, while the recognition accuracy of the MSC-CARS-LDA prediction set was 95.00%.
Discussion: This study indicates that, it is capable to identify the iron and boron deficiency in rapeseed using hyperspectral imaging technology.
1 Introduction
Rapeseed, rich in oil and protein, is an important oil crop and industrial raw material, as well as a potential bioenergy crop overall the world (Liu et al., 2019). According to the Rapeseed Explorer of USDA, the global production of rapeseed has reached 87.103 million metric tons, which producing 31.8 million metric rapeseed oil (USDA, 2024). With various useful compounds of fatty acids, vitamins and proteins, rapeseed oil ranks as the third most popular vegetable oil after oil palm and soybean (Friedt et al., 2018). To better manage the fertilizer supply during rapeseed cultivation, it is essential to monitoring the micronutrients status of the plants.
Appropriate application content of fertilizers will not only benefit the absorption and utilization of nutrients by the crop plants, but also contribute to plants stress tolerance (Hasanuzzaman et al., 2018; Thor, 2019). On the contrary, lacking essential nutrients could inhibit the growth of the plants, which would directly lead to the negative effect on rapeseed quality or yield (Agren et al., 2012; Johnson et al., 2022). Real-time, fast, and accurate monitoring of nutrient content would provide guidance for reasonable fertilization to increase the crop quality and production in any specific regions (Brown et al., 2022; Tian et al., 2024). Therefore, monitoring the nutrient content of plants is an important aspect in crop cultivation and management.
As two of the essential micronutrients, boron and iron play important roles in the growth and reproduction of rapeseed, especially in the southwestern region of China. Boron participates in promoting the transport of carbohydrates in vivo plants which will accelerate the growth of apical shoots and meristem. It is also conducive to the development of plant flower organs (Kalaji et al., 2018; Li et al., 2020). When the rapeseed plant is in deficiency of boron, the transportation of assimilation products in vivo plant could be interrupted. As a result, a large amount of starch would accumulate in the leaves and petioles. Furtherly, the greatly increase of phenolic compounds content would lead to necrosis of plant apical buds. Thus, the main manifestation of boron deficiency in rapeseed is the inhibition of apical buds, which would interrupt the growth of roots and shoots, ultimately leading to the issue of “blooming but not setting fruit” of rapeseed plants. Iron acts as an activator of some enzymes or enzyme cofactors in the synthesis of chlorophyll. It would indirectly affect the production process of chlorophyll, while playing an important role in electron transfer chain in various biochemical reactions in vivo plants (Takano et al., 2008; Pavlovic et al., 2021). The main manifestation of iron deficiency in rapeseed is the chlorosis and yellowing between leaf veins while the leaf veins themselves remain green, especially in the top fresh leaves (Takano et al., 2008; Merchant, 2010).
Phenotyping technology with optical sensors such as RGB camera, chlorophyll fluorescence sensors, and particularly the spectral imaging system, has been widely applied in monitoring various biotic stresses for crops. With UAV-based RGB and multi-spectral sensors, salinity stress phenotyping has been realized in tomato and quinoa plants (Johansen et al., 2019; Jiang et al., 2022). The study results provided insight into the effects of salt stress on plant area, growth and condition. Optical information like chlorophyll fluorescence can also be measured for photosystem status evaluation such as investigating herbicide stresses in soybean plants (Li et al., 2018). Meanwhile, phenotyping of stresses from over or deficient macronutrients such as nitrogen, phosphorus, and potassium have also been successfully tested in many studies using hyperspectral imaging technology (Jiang et al., 2015; Tmušić et al., 2020). However, at present, the deficiency of the micronutrients iron and boron in crops is mainly evaluated using artificial vision and empirical morphological diagnostic methods which could only be made when obvious stress symptoms have appeared, and the specific fertilization may be missed for the suitable application time window.
The objectives of this study were to, (1) investigate if it was possible to differentiate the iron and boron deficiency symptoms in rapeseed from healthy plants at early growth stage using spectral imaging technology; (2) optimize the spectral diagnostic model for a high classification accuracy. The results will provide support for the nutritional diagnosis of iron and boron content in rapeseed fields using UAV-based sensing systems and even for the potential detection of vegetation deficiency symptoms via the space-based remote sensing satellites.
2 Materials and methods
2.1 Plant materials
The cultivar of tested rapeseed (Brassica napus L.) in this study is Zhongshuang 11 (ZS11, Beijing, Chinese Academy of Agricultural Sciences), which is widely grown in the Yangtze River basin. The plants were grown in 380 mm×300 mm pots with soilless hydroponic incubator with six plants per pot. All the plants were cultivated in a greenhouse of Southwest University in Chongqing, China.
The nutrient deficient plants were cultivated as the methodology described by Han et al. (2016), in which the ZS11 genotype was also cultivated as the tested plants. The rapeseed seeds were germinated in distilled water. After germination, the seedlings were transferred to a plastic net floating on the half strength modified Hoagland solution (Table 1). Normally growth seedlings were selected for next cultivation steps of the tests. Seedlings for control treatment were kept in the half strength modified Hoagland solution with boron concentration of 20 μmol L-1 (H3BO3) and iron concentration of 80 μmol L-1 (C10H12FeN2NaO8, EDTA-Fe), which were dramatically lower than the element concentration in the Chinese State Standard of foliar microelement fertilizer (State Administration for Marker Regulation of the People’s Republic of China & Standardization Administration of the People’s Republic of China, 2020). The seedlings for nutrient deficiency treatments were then transferred to solution with iron or boron in lower concentration. Boron deficiency plants was transferred to the solution with boron concentration of 0.5 μmol L-1, while the iron deficiency plants were treated with iron concentration of 1 μmol L-1. The other nutrients of both micronutrients deficient solution were kept in same concentration as the half strength modified Hoagland solution. The solution in all treatments was replaced every two days.
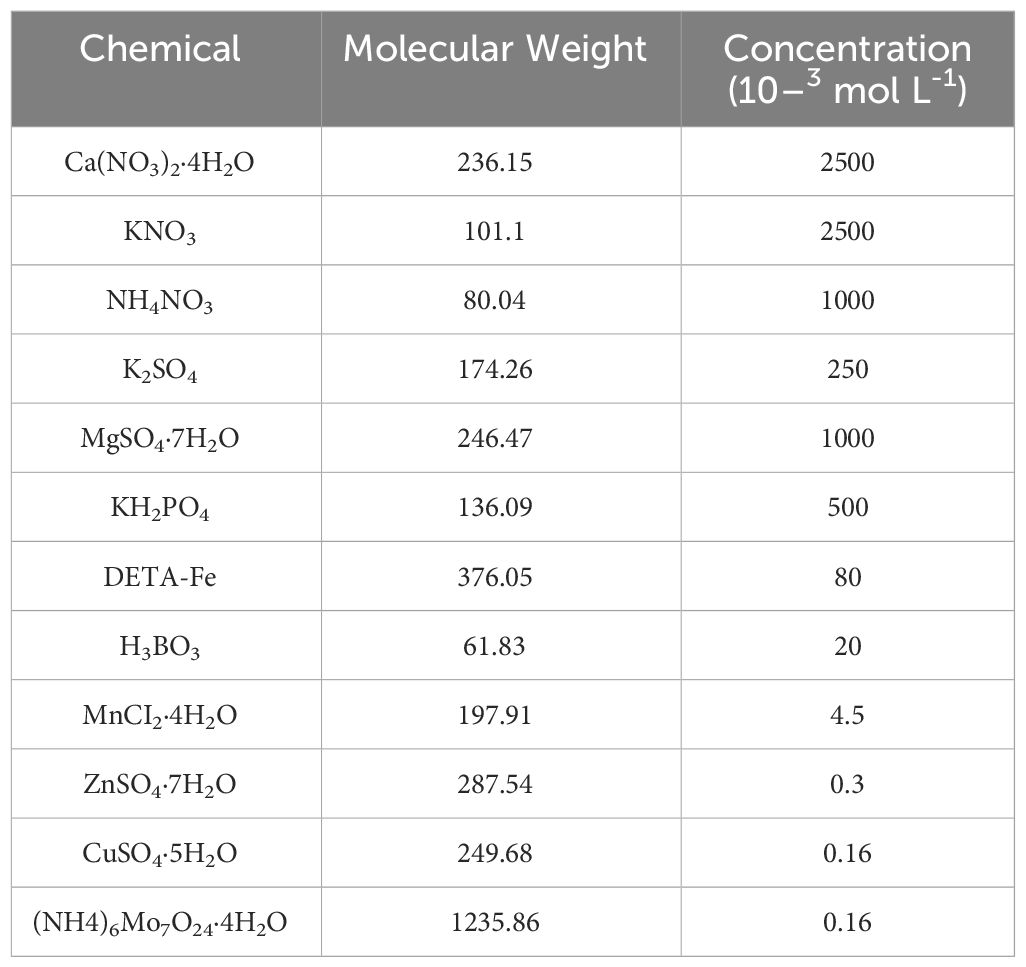
Table 1 Modified 1/2 Hoagland complete nutrient solution formula.
Germination treatment was applied to full and consistent ZS11 seeds. The seeds were soaked in distilled water for 20 minutes and disinfected with 5% NaClO solution for 20 minutes. After rinsed with distilled water repeatedly for 5–6 times, the seeds were put on gauze soaked in 1/4 strength Hoagland solution for seedling cultivation.
Seedlings with uniform growth stage were selected for transplant. The plants were transferred to plastic hydroponic tanks containing nutrient solutions (1/4 strength Hoagland solution was used for cultivation in the first week after transplanting, half strength Hoagland solution was used for cultivation since the second week after transplanting, solution for nutrient deficiency treatments were applied since the third week after transplanting). Four biological replicates were applied for each treatment with 72 plants in total. The plants were set with a Randomized Block Design. The experiment was repeated twice in 3rd March to 14th June and 7th September to 12th December in 2023.
2.2 Hyperspectral imaging system
The physical and architectural diagrams of the hyperspectral imaging system are shown in Figures 1A, B, respectively. The main hardware includes a hyperspectral camera (Raptor EM285CL, Raptor Photonics Led., UK), a spectrometer (Impector V10E, Measuring wavelength range 364~1025 nm, Spectral resolution 2.8 nm, Specim, Spectral Imaging Ltd., Finland), a zoom lens, a 150 W halogen adjustable light source, a linear photoconductor, a stepping motor mobile platform, a computer, etc. The whole set of devices is placed in the black box except the computer. The main software installed on the computer includes Spectral image, an image acquisition software provided by Wuling Optics (Taiwan, China), and HIS Analyzer, an image analysis software.
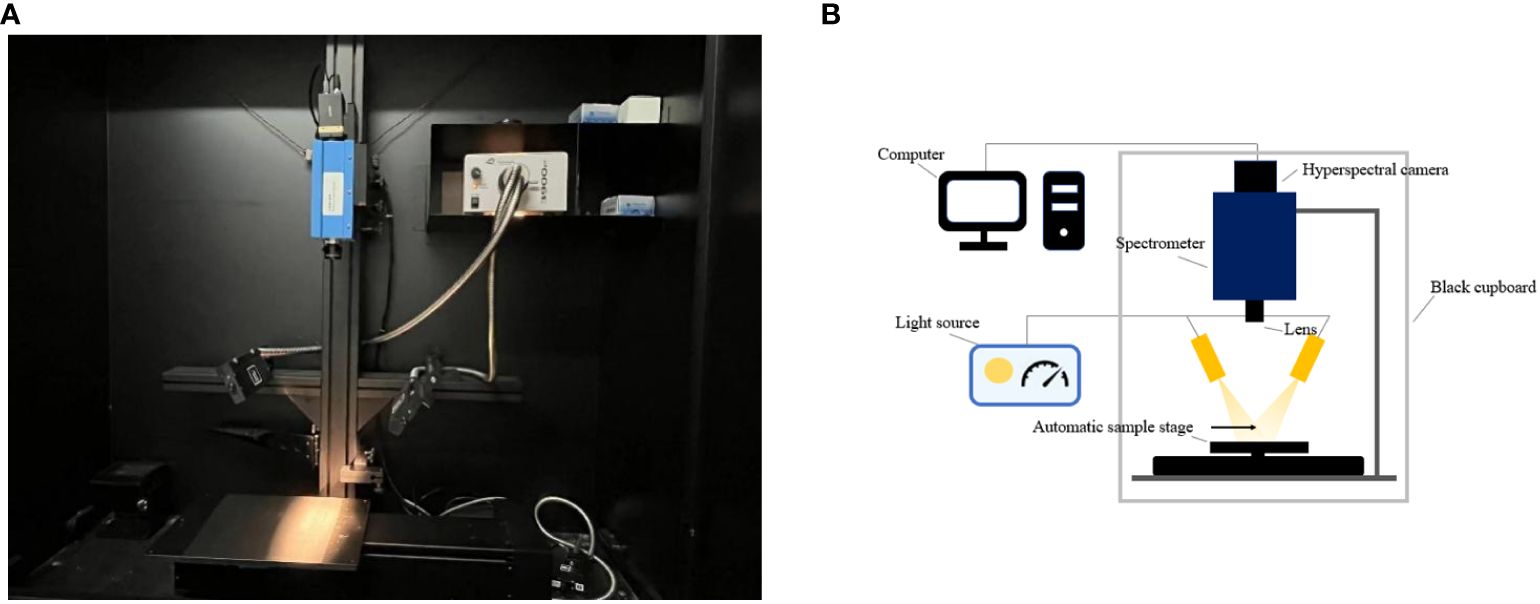
Figure 1 Hyperspectral imaging system (A) physical drawing; (B) architecture diagram.
This device was fixed on the top of a black box in a darkroom. Each plant was moved to the measuring platform out from the hydroponic incubator. The window of the black box was closed during measurement.
2.3 Data collection and calibration
After 28 days of transplanting, hyperspectral images of rapeseed leaves were collected uniformly. To ensure the representativeness of the collected data, all samples were placed horizontally under the same conditions for imaging. After pre-testing, it was ultimately determined that the exposure time of the hyperspectral imaging system camera was 48 ms, the working distance from the lens to the sample was 480 mm, and the moving platform speed was 1.12 mm s-1.
Black and white board correction was performed on the hyperspectral image data of each sample in the image analysis software HIS Analyzer. The correction formula is as follows:
where, R is the relative reflection density of the leaves, is the reflection density of the original image of the sample, is the reflection density of all the white calibration image, and is the reflection density of the all black calibration image. Black and white correction is used to eliminate the influence of camera dark current, while converting the spectral values of the original hyperspectral image into reflectance.
2.4 Data preprocessing
Due to the influence of instruments, image acquisition background, environmental lighting conditions, and other factors, there would be noise, spectral baseline drift, and translation in the obtained spectral data. To eliminate these adverse effects on classification modeling, preprocessing of spectral data is necessary. After preliminary experiments, normalization, SG convolutional smoothing, spectral differentiation, and Multiple Scattering Correction (MSC) were selected for the spectra preprocess of the leaf samples after smoothing. The preprocessing procedure is shown in Figure 2. Four types of the spectral data obtained after preprocessing are spectral sample sets 1–4, which are abbreviated as RAW, 1st Der, MSC, and 2nd Der in the following text.
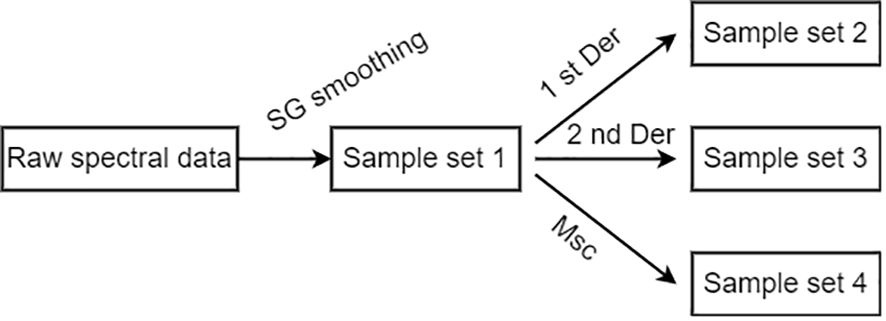
Figure 2 Flow chart of spectral data preprocessing.
Figure 3 shows four spectral samples obtained from the pre-processed spectral data of some healthy rapeseed leaves.
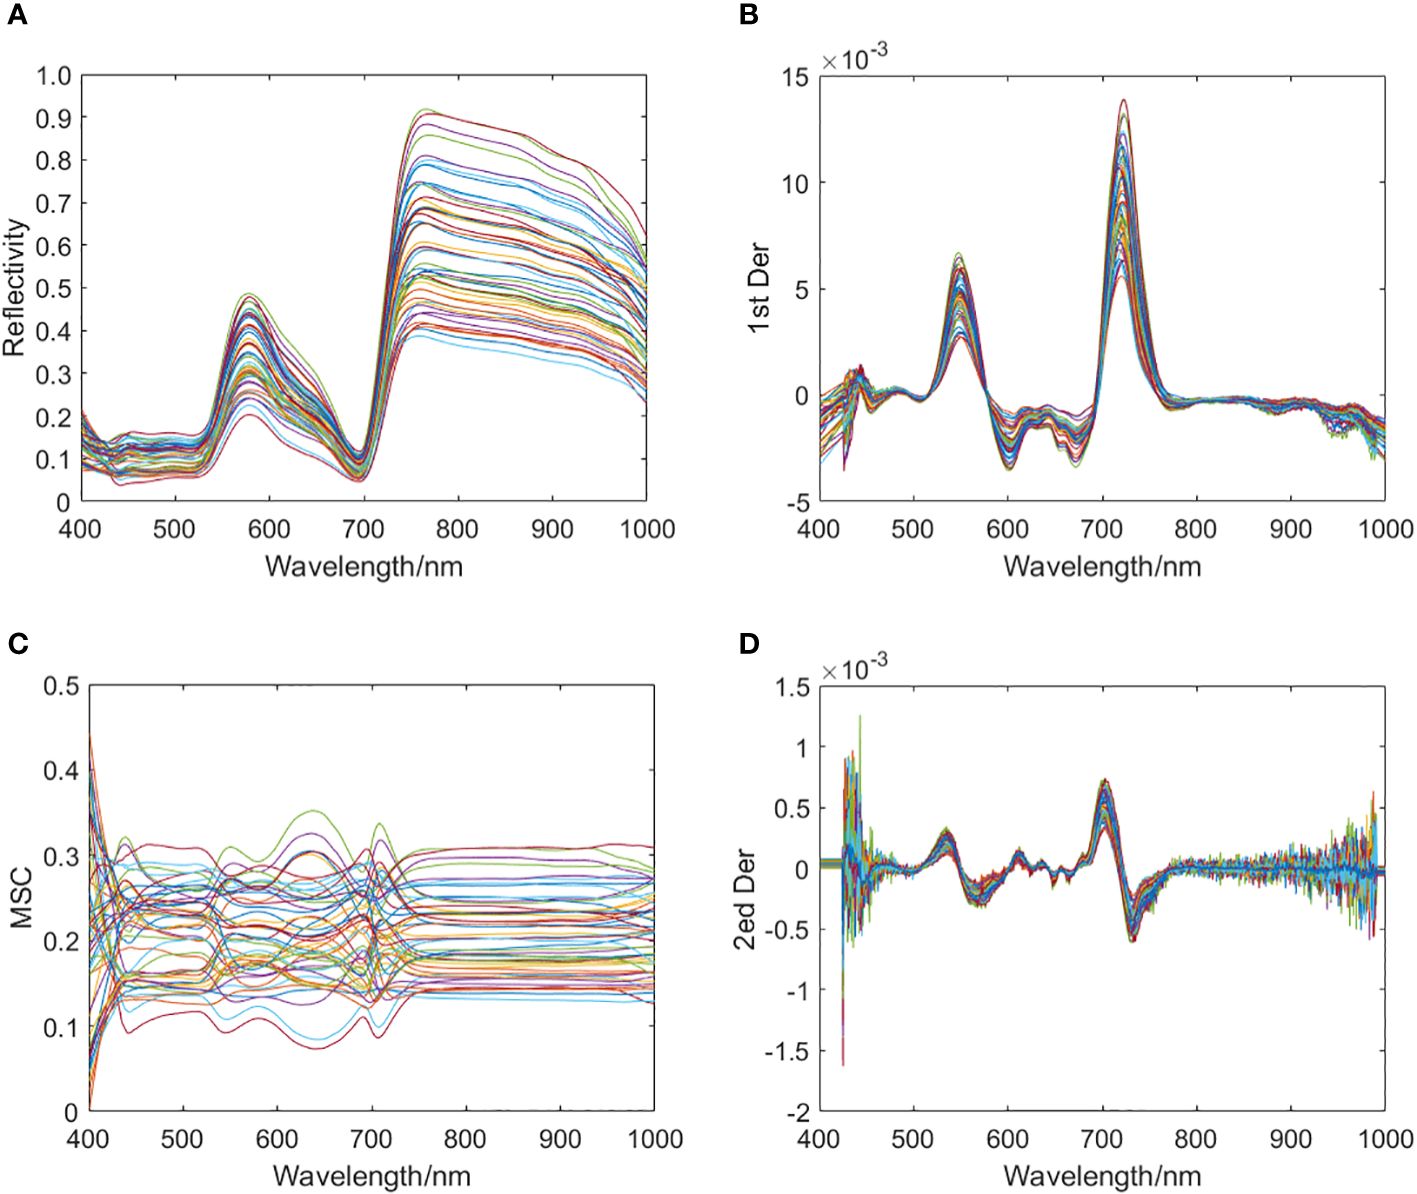
Figure 3 Four spectral samples obtained from preprocessing spectral data of some healthy rapeseed leaves. (A) Sample set 1: RAW; (B) Sample set 2: 1st Der; (C) Sample set 3: MSC; (D) Sample set 4: 2nd Der.
2.5 Band screening
Hyperspectral data often has hundreds or even thousands of wavelength points, which not only provides rich information about samples but also poses challenges for computer storage, transmission, and data processing (Arnon and Hoagland, 1938). When extracting spectral dimension information from hyperspectral data for modeling, using full band spectral information to establish the model will bring various negative impacts to the model due to the presence of uninformative variables in the data (Gruber et al., 2013). The dimension reduction algorithm can select the wavelength variables that are more meaningful to the classification results from the full wavelength range and eliminate redundant wavelengths. It could improve the prediction accuracy and modeling calculation efficiency of the model, as well as reducing the overfitting of the model and improve the generalization ability of the model (Arnon and Hoagland, 1938; Gruber et al., 2013; Khan et al., 2018).
2.5.1 Continuous projection algorithm
Successive Projections Algorithm (SPA) is a forward variable selection algorithm, which uses vector projection analysis to select the combination of many variables with the smallest collinearity. In some studies on plant spectral feature classification and regression models, continuous projection algorithms are often applied in the dimensionality reduction process of hyperspectral data, which can play a good role in improving model operation efficiency and recognition accuracy (Belgiu and Drăguţ, 2016).
2.5.2 Competitive adaptive reweighting algorithm
The Competitive Adaptive Reweighted Sampling (CARS) algorithm has also been widely applied in the recognition of plant spectral features. CARS uses the Monte Carlo sampling principle to select sample subsets for modeling, and to evaluate the importance of variables through the regression coefficients of the sub models. In each iteration, dimensionality reduction is achieved by removing variables with smaller mean regression coefficients through Exponential Decreasing Function (EDF) and Adaptive Reweighted Sampling (ARS) (Lorente et al., 2012).
2.6 Classification model
Linear Discriminant Analysis (LDA), also known as Fisher linear discriminant analysis, is a classic algorithm for pattern recognition and is widely used in multi class classification problems. Using LDA can maximize the inter class scatter matrix of the projected pattern samples and minimize the intra class scatter matrix, ensuring that the projected pattern samples have the minimum intra class distance and maximum inter class distance in a new space. Its essence lies in finding a subspace. It enables better separation of various categories in this subspace, which means that patterns have the best separability in that space (Zhang et al., 2022).
Support Vector Machine (SVM) is a supervised pattern recognition method. The original spectral data is mapped to a high-dimensional feature space, and an optimal classification hyperplane is constructed to maximize the distance between the support vectors of various samples and this hyperplane. SVM can be used for linear and nonlinear multivariate analysis problems, and the support vector can be solved by using linear equations instead of Quadratic programming. By selecting appropriate kernel functions to ensure the speed and efficiency of modeling while implementing nonlinear mapping (Yuan et al., 2020), this experiment uses Radial Basis Function (RBF) as kernel functions.
3 Results
3.1 Spectral features of nutrient deficient leaves
From the average spectra of the collected leaves of rapeseed plants (Figure 4), it presented that overall waveform of the spectral reflection curve in the wavelength range of 400–1000 nm was similar between normal plants and iron or boron deficient plants.
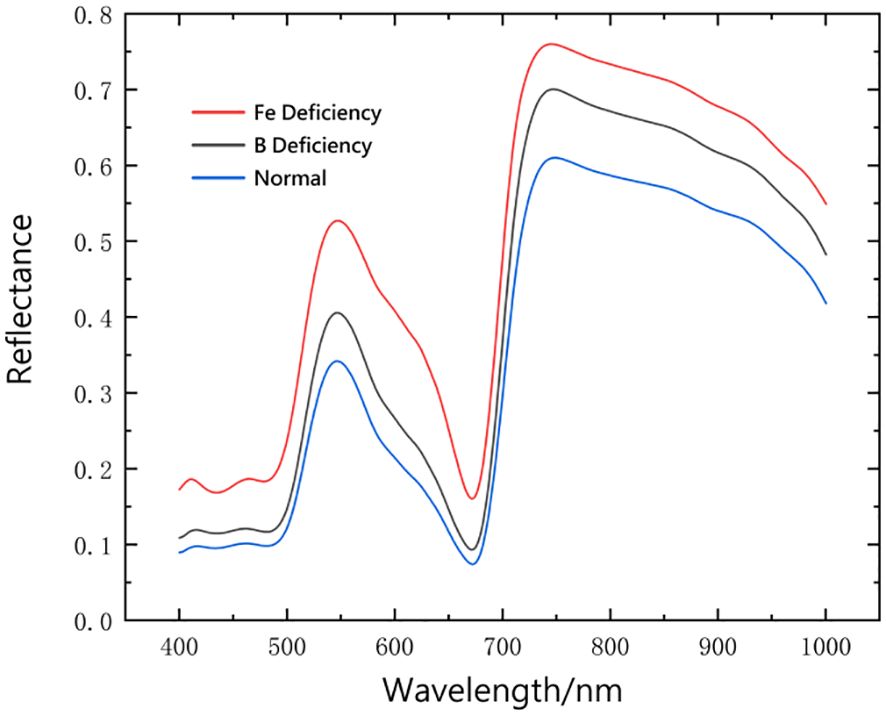
Figure 4 Comparison of average spectra between normal leaves and iron and boron deficient in Brassica napus leaves.
3.2 Deficiency recognition and classification model based on full band information
After preprocessing the 400–1000 nm full band spectral data using three preprocessing methods, known as spectral first order differential, spectral second order differential and MSC. LDA discriminative model and SVM discriminative model for identifying iron deficiency, boron deficiency and normal leaves were established respectively. LDA discriminative model is a typical Fisher linear discriminant analysis in Matlab Toolbox. When using SVM to build a discriminative model, the kernel function used when using SVM to build a discriminative model is the radial basis function (RBF) kernel function:
In the SVM modeling, the Penalty coefficient y was set as 100, and the kernel width σ was set as 0.1. The discrimination results of each model were shown in Table 2.
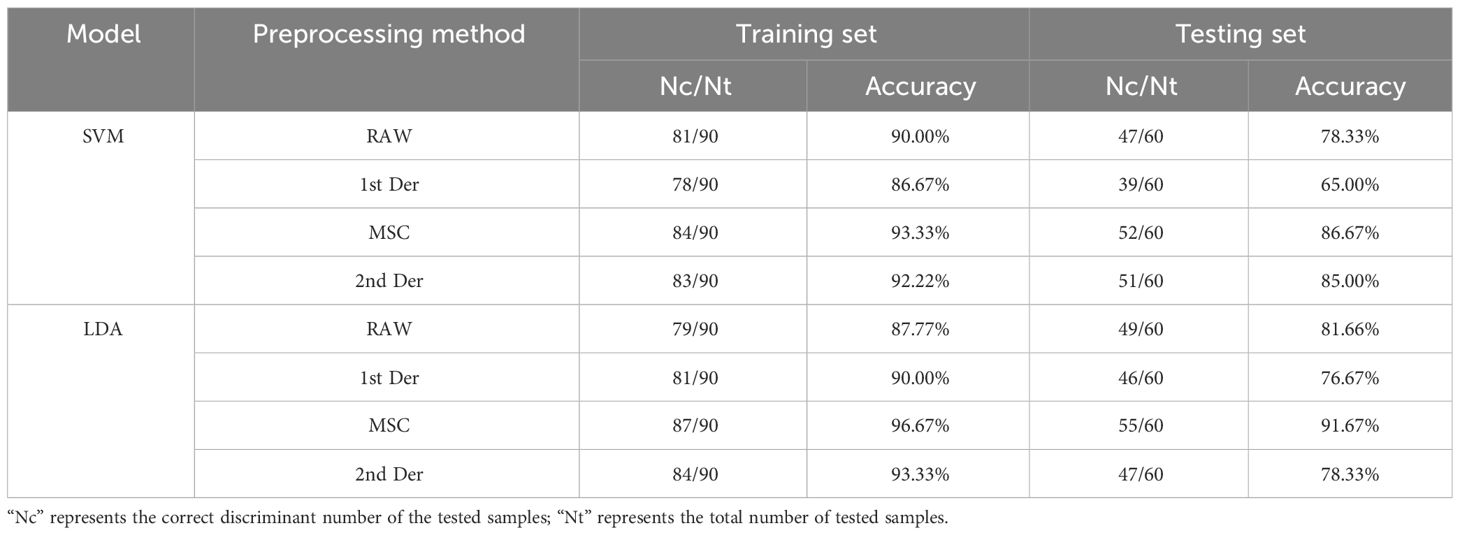
Table 2 Discrimination results of LDA and SVM discrimination models under different spectral pretreatment.
Comparing the discrimination accuracy of the two models, it presented that the LDA model had better overall discrimination performance than the SVM model. However, when using the LDA model to model the rapeseed leaf spectral dataset, the most suitable preprocessing method was MSC. When using the SVM model, the two preprocessing methods MSC and 2nd Der had better results.
By analyzing the confusion matrix of the modeling set (Figure 5) and the test set (Figure 6) based on the SVM model, it presented that the SVM model had a good spectral recognition effect for healthy and nutrient deficient rape leaves, with an accuracy rate of more than 90%. The recognition effect of iron and boron deficient rapeseed leaves is average, with the 1st Der data having the worst effect, with an accuracy rate of only 55%. The accuracy rates of RAW, MSC, and 2nd Der data are all between 70% and 85%.
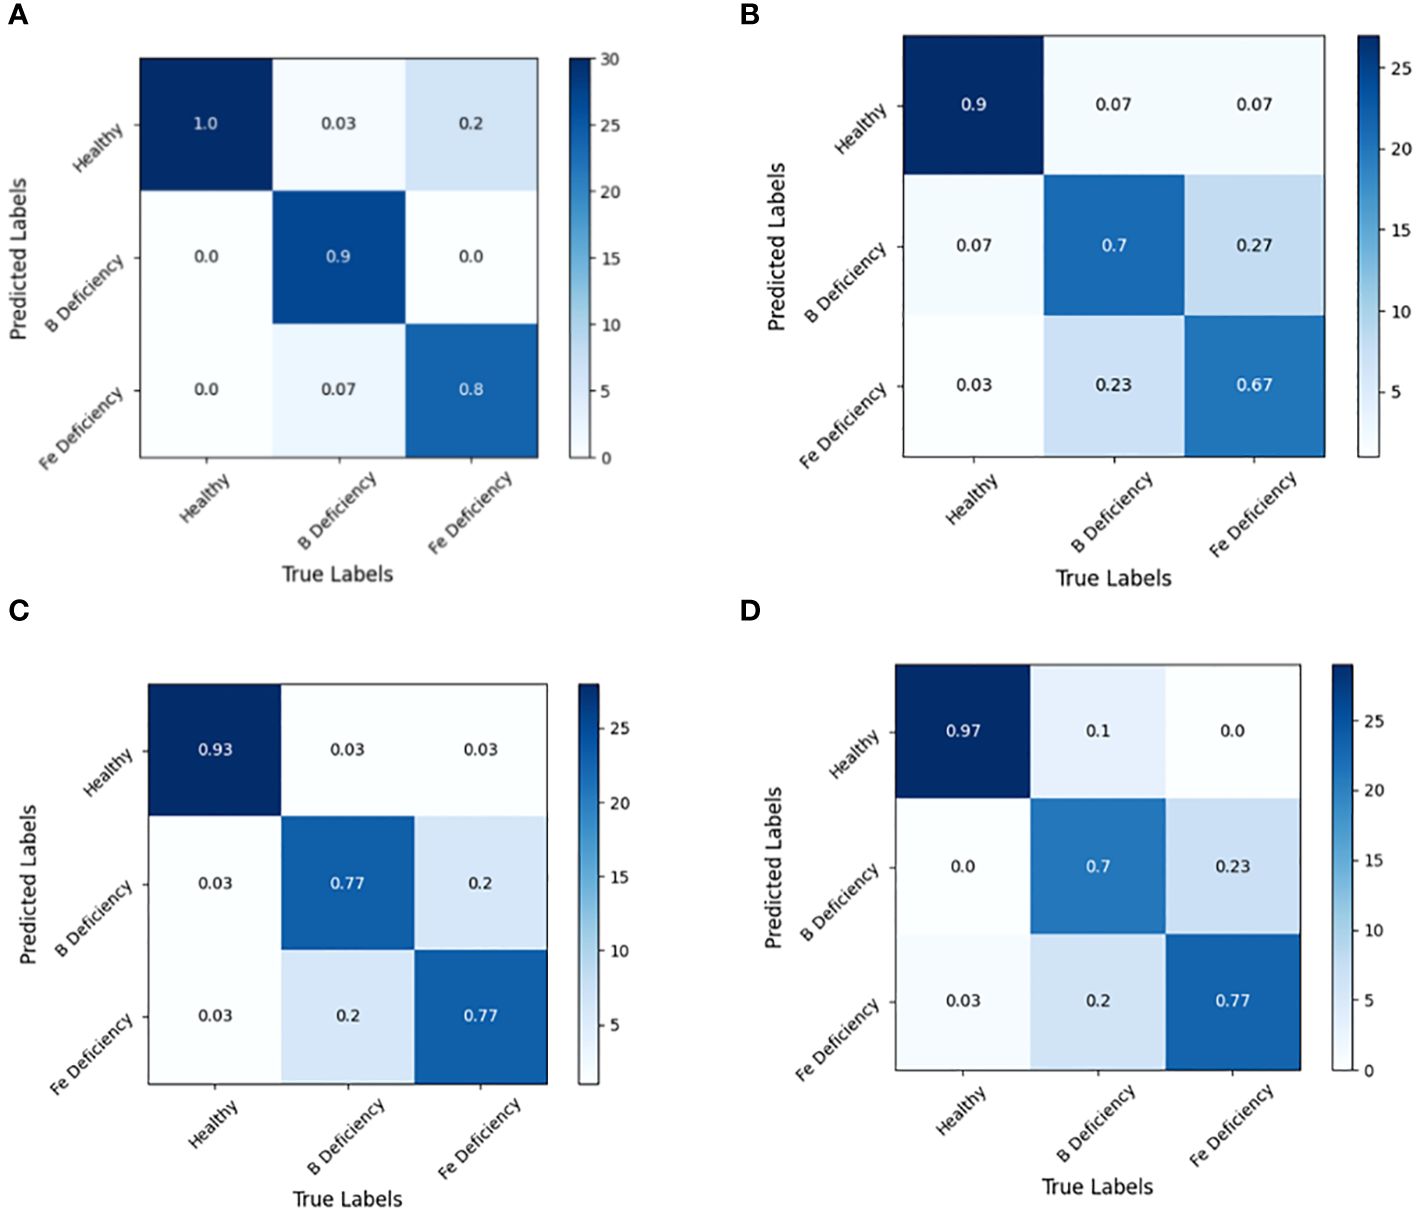
Figure 5 Discrimination results based on SVM models under different spectral pretreatments (Modeling set) for iron and boron deficiency in Brassica napus. (A) RAW, (B) 1st Der, (C) MSC, (D) 2nd Der.
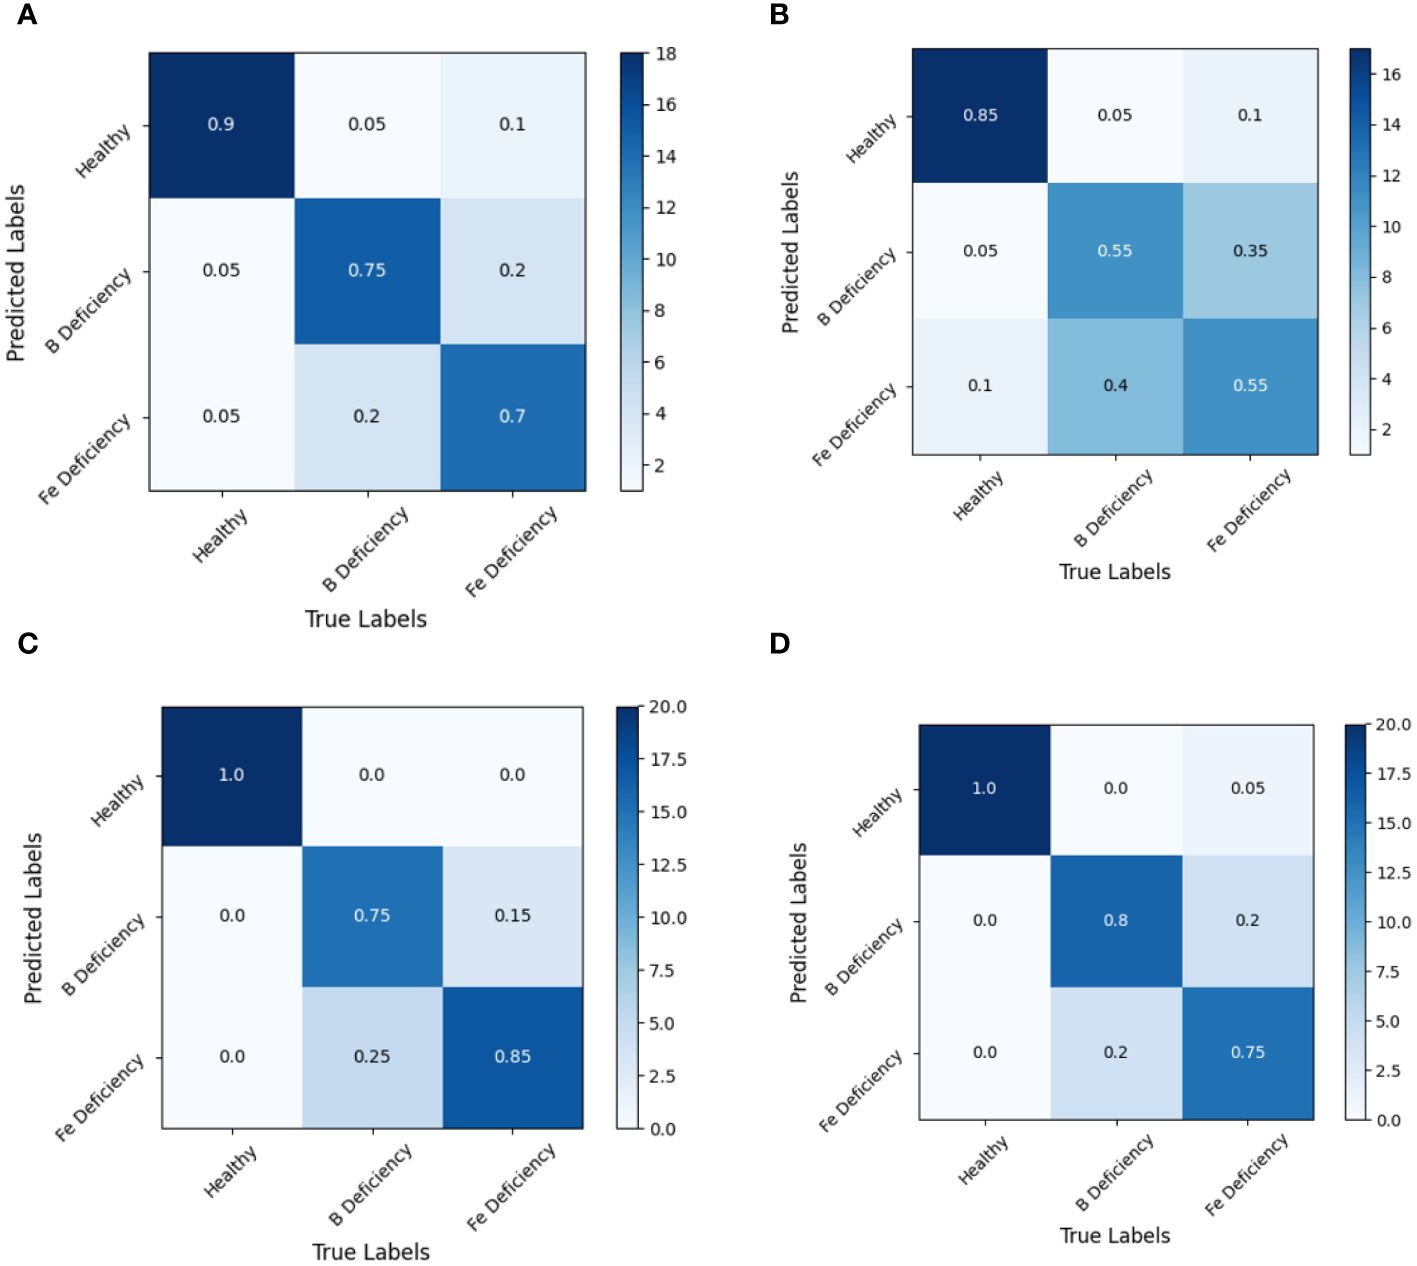
Figure 6 Discrimination results based on SVM model under different spectral pretreatments (Test set) for iron and boron deficiency in Brassica napus. (A) RAW, (B) 1st Der, (C) MSC, (D) 2nd Der.
Experiments also shown that SVM models based on full band spectral data can effectively identify healthy rapeseed leaves and rapeseed leaves lacking iron and boron elements. However, the recognition accuracy between iron deficient and boron deficient leaves still needed to be improved.
The analysis of the confusion matrix of the modeling set (Figure 7) and the test set (Figure 8) based on the LDA model showed that the LDA model was superior to the SVM model in spectral recognition of healthy and nutrient deficient rapeseed leave. Its accuracy in the test set is more than 95%. In the recognition of iron and boron deficient rapeseed leaves, MSC data showed significantly better performance than RAW, 1st Der, and 2nd Der data, with average accuracy exceeding 90% in both training and testing sets.
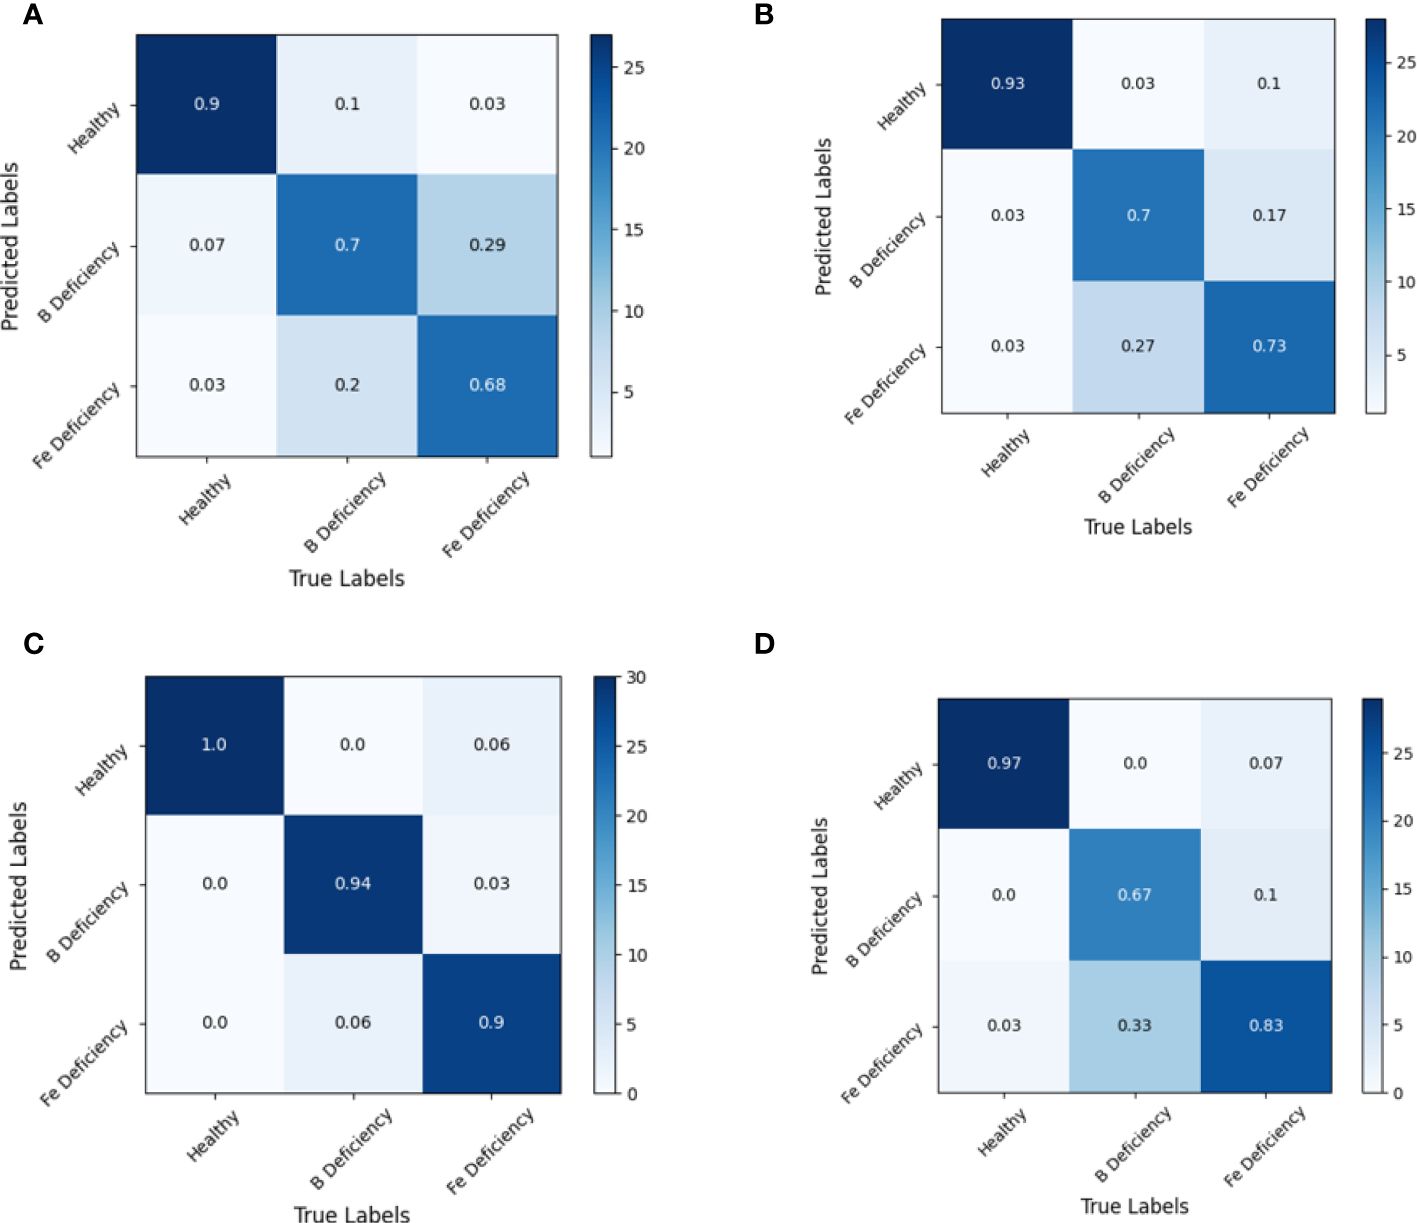
Figure 7 Discrimination results based on LDA models under different spectral pretreatments (Modeling set) for iron and boron deficiency in Brassica napus. (A) RAW, (B) 1st Der, (C) MSC, (D) 2nd Der.
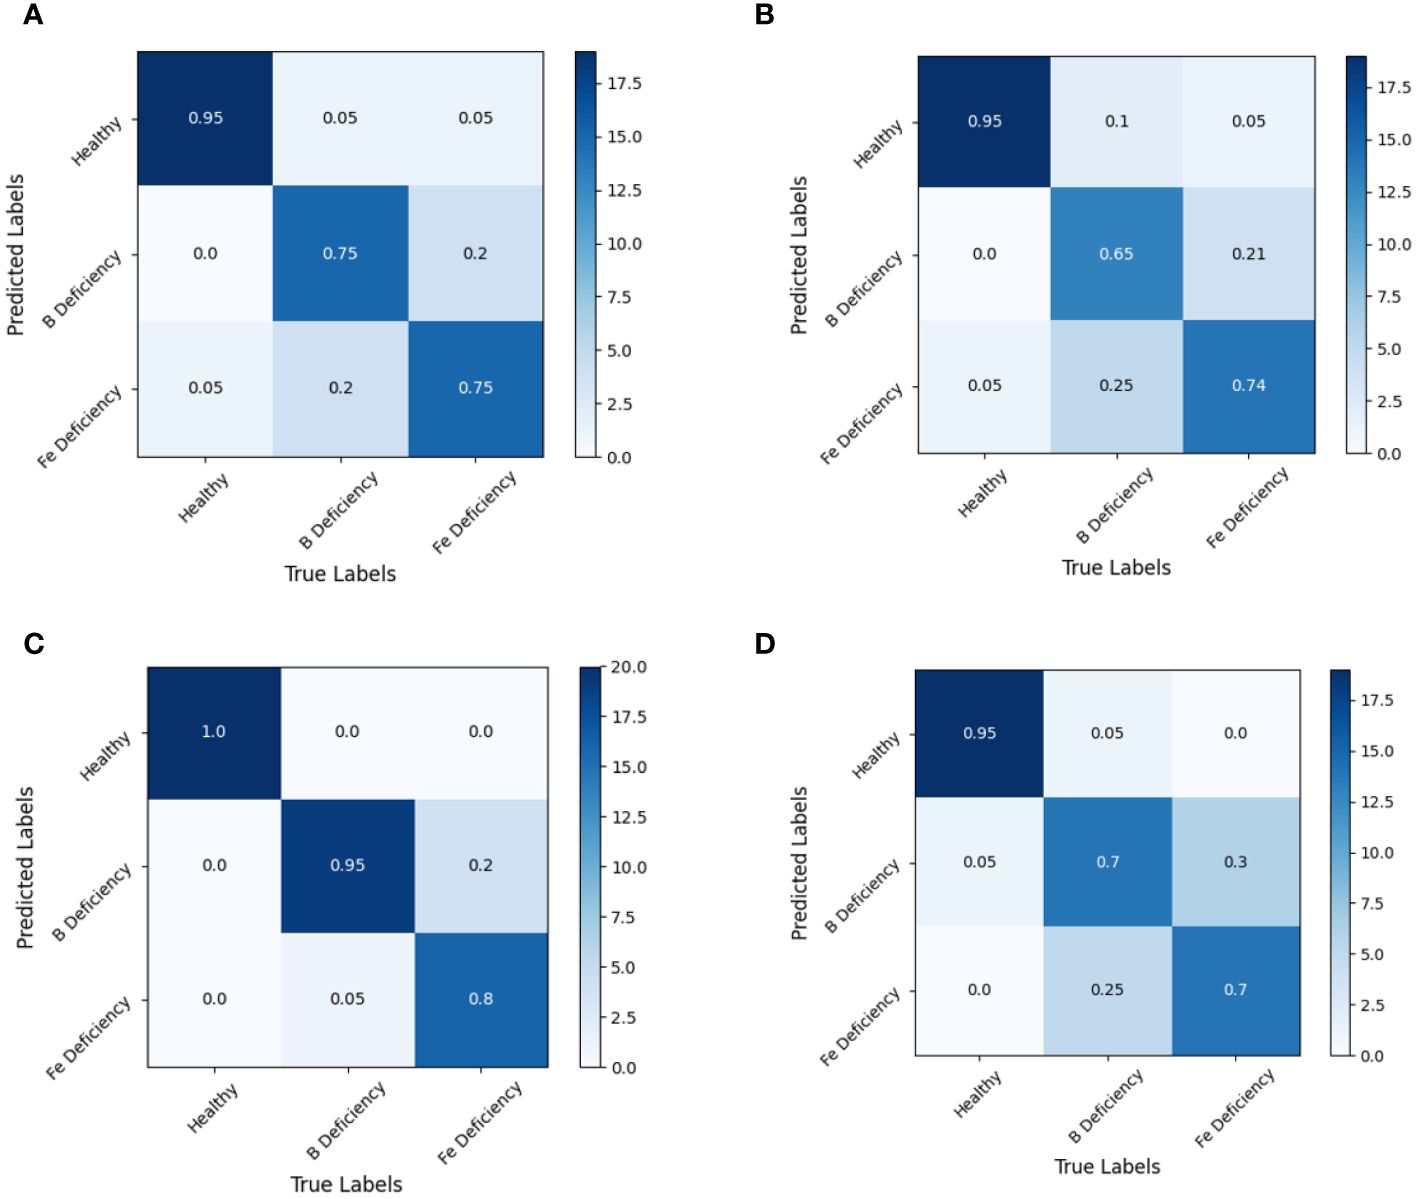
Figure 8 Discrimination results based on LDA model under different spectral pretreatment (test set). (A) RAW, (B) 1st Der, (C) MSC, (D) 2nd Der.
Further analysis of the discrimination results of the MSC-LDA model showed that both the modeling and prediction sets had a 100% accuracy in discriminating normal samples. In general, the discrimination accuracy of samples with boron deficiency was higher than that of samples with iron deficiency. From the confusion matrix, two samples with boron deficiency in the modeling set were wrongly identified as samples with iron deficiency symptoms, while one sample with iron deficiency symptoms was wrongly identified as samples with boron deficiency, and two samples are wrongly identified as healthy samples. The prediction set discrimination results also showed that one sample with boron deficiency was wrongly identified as samples with iron deficiency symptoms, and four samples with iron deficiency symptoms were wrongly identified as samples with iron deficiency.
The results of this experiment indicate that the MSC-LDA model achieved the highest accuracy in the combination of data preprocessing and modeling methods for Brassica napus iron and boron. The overall discrimination accuracy of the modeling set reached 96.67%, and the overall discrimination accuracy of the prediction set reached 91.67%.
3.3 Feature band screening results
Figure 9A shows the process of reducing the number of bands involved in modeling through 50 Monte Carlo sampling (MC) of the sample data. Figure 9B shows the cross-validation error curve of the PLS model using the Leave on One Out (LOO) method as the number of bands involved in modeling decreases. From the above two curves, it could be seen that as the number of bands involved in modeling gradually decreases, the Root Mean Square Error of Cross Validation (RMSECV) of the model first shows a slow decreasing trend. It indicated that there is indeed a lot of redundant information in the spectral raw data containing more than 600 bands. Screening out certain band data could not only reduce computational complexity, but also improve the accuracy of the model to a certain extent. When the sampling frequency starts from 24, the RMSECV of the model in the training set gradually increased as the number of modeling bands decreases, indicating that some band data useful for classification modeling begins to be eliminated.
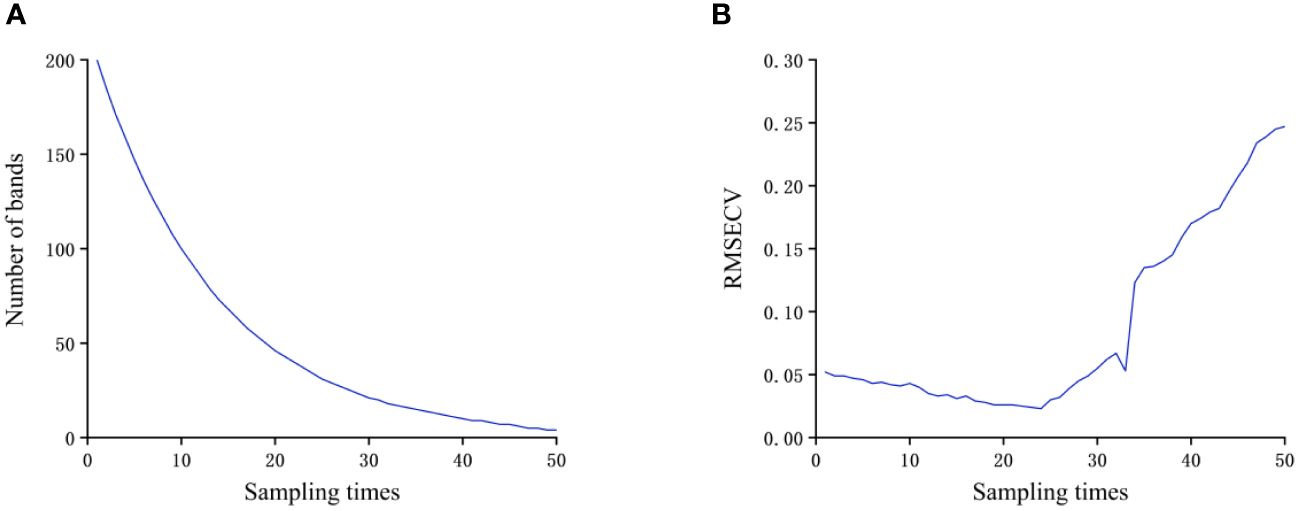
Figure 9 Impact of the number of bands involved in modeling on model accuracy. (A) Change trend of band number; (B) Model RMSECV change trend.
The above phenomenon indicates that there is indeed a large amount of redundant information in the original spectrum that is useless for the classification and recognition of iron and boron stress in rapeseed. It is meaningful to reduce the dimensionality of the original spectral data.
SPA and CARS were used to reduce the dimensionality of rapeseed leaf spectral data, as shown in Table 3. A total of 18 characteristic wavelengths were selected by SPA and defined as subset 1. CARS screened a total of 33 wavelengths and defined them as subset 2.
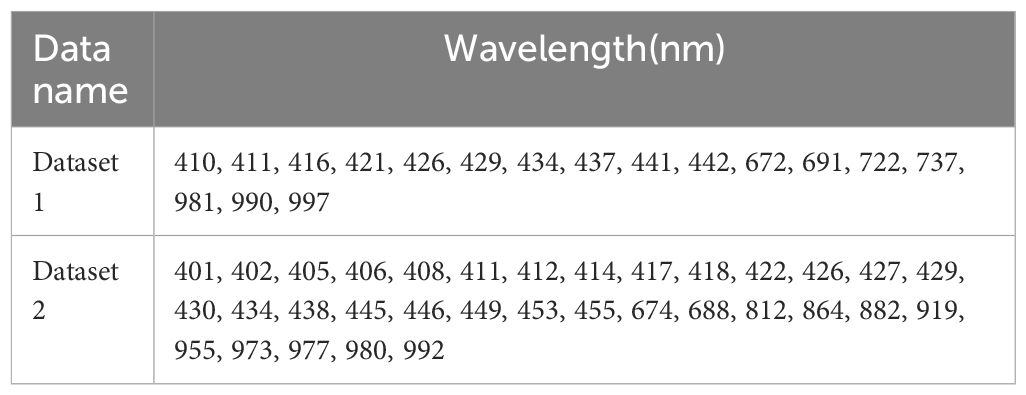
Table 3 Selected characteristic wavebands by SPA and CARS.
3.4 Establishment of a deficiency recognition and classification model based on feature band information
Since the MSC-LDA model is superior to other discriminative model when full band spectral information modeling is used, the MSC-SPA-LDA and MSC-CARS-LDA modeling and discrimination are conducted using two characteristic wavelength subsets screened according to SPA and CARS. The prediction results are shown in Table 4, and the confusion matrix is shown in Figure 10 (MSC-SPA-LDA) and Figure 11 (MSC-CARS-LDA).
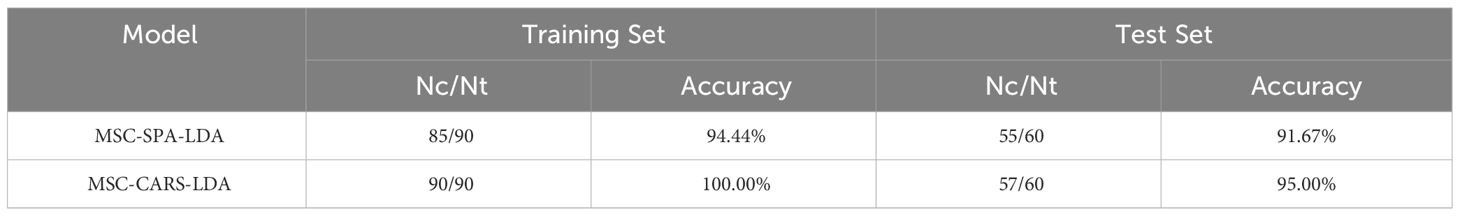
Table 4 MSC-LDA discrimination model based on characteristic wavelength.
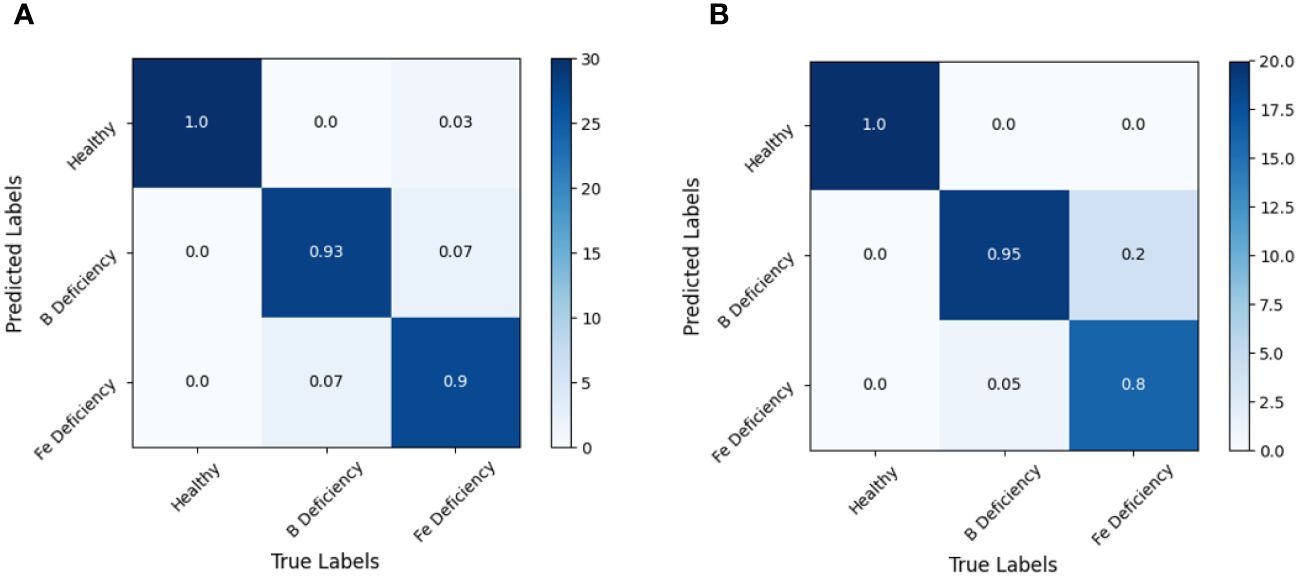
Figure 10 MSC-SPA-LDA model discrimination result confusion matrix. (A) training set, (B) test set.
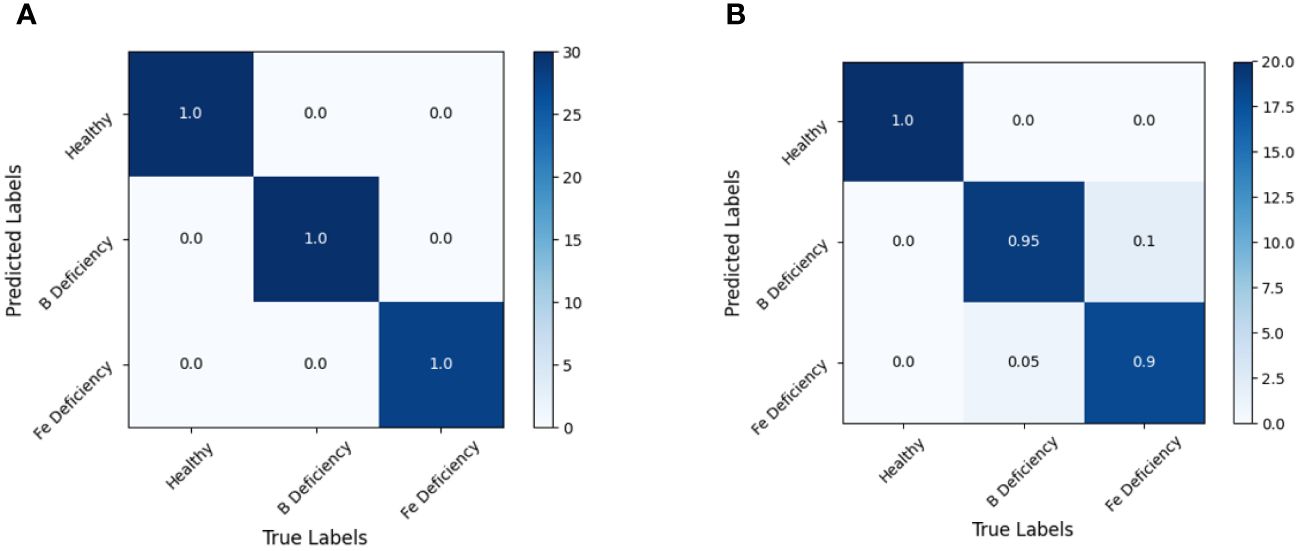
Figure 11 MSC-CARS-LDA model discrimination result confusion matrix. (A) training set, (B) test set.
Analysis of the discrimination results of the MSC-SPA-LDA model showed that the accuracy of the MSC-SPA-LDA model based on SPA feature bands is 94.44% on the training set and 91.67% on the test set, which is slightly lower than the MSC-LDA model based on full band. However, due to its significant reduction in the number of input variables in the model, the running speed of the model is significantly improved, and the accuracy is within an acceptable range, so the MSC-SPA-LDA model has better applicability than the MSC-LDA model.
By analyzing the discrimination results of the MSC-CARS-LDA model, it could be concluded that the MSC-CARS-LDA model based on CARS feature bands achieved 100% and 95% accuracy on the training and testing sets, respectively, making it the model with the highest recognition accuracy in this experiment.
The feature wavelengths of subset 2 selected based on the CARS algorithm were mainly concentrated between the regions of 400–450 nm and 800–1000 nm, especially in the blue-violet light region of 400–450 nm, which is not the green peak region with the greatest difference in the 500–650 nm spectral curve. This indicates that the degree of leaf chlorosis is not the only basis for discrimination in this recognition system.
4 Discussion
The deficiency of iron and boron could lead to a decrease in chlorophyll content in the leaves, weakening their absorption of solar radiation, and causing an overall increase in the spectral reflectance of the leaves in the wavelength range of 400–700 nm, resulting in a “blue shift” phenomenon at the “red edge” position. This was consistent with previous research results (Yang et al., 2018). Considering the “green peak” at 550 nm, the spectral reflectance difference was the largest. The increase in green peak caused by iron deficiency was more intense than that caused by boron deficiency, indicating that the level of plant nutrient element content was closely related to spectral characteristics. When the plants were in deficiency of iron or boron, the total chlorophyll content of their leaves might reduce. That would lead to weak absorption of solar radiation and an increase in the reflectance and transmittance of incident light, which has been proven in crops like sorghum and sugar beet (Teixeira et al., 2020; Wu et al., 2021). The symptoms of nutrient deficiency in rapeseed leaves appeared because of the decrease of chlorophyll content, which might cause corresponding spectral responses such as an increase in green peaks. This provides a basis for conducting spectral recognition and identification.
The spectral reflectance of plant leaves in the range of 400–1000 nm indicated spectral responses to various factors such as plant metabolites, chlorophyll, water content, internal structure of leaf surfaces, and physical properties of plant leaves. The correlation between spectral reflectance of different bands and the abundance or deficiency of iron and boron elements in rapeseed plants was comprehensive responses of the rapeseed plants to the nutrients status and environment, rather than the direct correlation between spectral values and iron and boron content. Therefore, machine learning algorithms was employed in this study for further analysis. Two pattern recognition methods, LDA and SVM, were used to identify different deficiency symptoms. The LDA algorithm achieves better recognition results, and the CARS algorithm performs better than the SPA algorithm in feature wavelength screening. Through the analysis of confusion matrix, it presented that the recognition rate of the recognition model established in this study for healthy rape leaves was always higher than 90%. The recognition of iron deficient leaves and boron deficient leaves presented some confusion of samples. From Figure 5, it could also be seen that the green peak increase response caused by iron deficiency was stronger than that caused by boron deficiency. It might suggest that the physiological response to spectral properties from iron deficiency was more sensitive than that from boron deficiency in rapeseed plants (Sarafi et al., 2018).
5 Conclusion
The spectral response of normal, iron deficient, and boron deficient rapeseed plants was investigated using hyperspectral imaging technology in this study. Thus, it could conclude that, (1) with employing spectral imaging technology, it is capable to identify the iron and boron deficiency symptoms in rapeseed from healthy plants at early growth stage based on full band and featured band; (2) the LDA discriminative model established by screening characteristic wavelengths could be optimized using CARS for further field application with lower data consumption and faster calculation, and the recognition accuracy of its modeling set and prediction set could be 92.22% and 86.67%.
Data availability statement
The original contributions presented in the study are included in the article/supplementary material. Further inquiries can be directed to the corresponding author.
Author contributions
HL: Data curation, Funding acquisition, Investigation, Software, Writing – original draft, Writing – review & editing. LW: Data curation, Investigation, Writing – original draft, Writing – review & editing. CL: Resources, Writing – review & editing. LHW: Resources, Supervision, Writing – review & editing. SZ: Methodology, Resources, Supervision, Validation, Writing – review & editing. XC: Methodology, Resources, Supervision, Writing – review & editing. PW: Data curation, Funding acquisition, Investigation, Methodology, Software, Validation, Writing – original draft, Writing – review & editing.
Funding
The author(s) declare financial support was received for the research, authorship, and/or publication of this article. This research was funded by the National Natural Science Foundation of China, grant number 32201651 and 32001425; the Fundamental Research Funds for the Central Universities (SWU-KT22024); the Natural Science Foundation of Chongqing, China, grant numbers cstc2020jcyj-msxmX0414 and cstc2020jcyj-msxmX0459; the Open Funding of the Key Laboratory of Modern Agricultural Equipment and Technology (Jiangsu University), grant numbers MAET202105; Local Financial of National Agricultural Science & Technology Center, Chengdu, grant number NASC2021KR02.
Acknowledgments
The authors would like to appreciate Prof. Dr. Shouyong Xie, Prof. Dr. Yuheng Yang, Dr. Shengling Zhou, Dr. Xiaozhong Wang, Dr. Dunyi Liu, Dr. Qi Niu, Dr. Chunlei Wang, Dr. Wei Ma and Mr. Linyun Chen for technical support.
Conflict of interest
The authors declare that the research was conducted in the absence of any commercial or financial relationships that could be construed as a potential conflict of interest.
Publisher’s note
All claims expressed in this article are solely those of the authors and do not necessarily represent those of their affiliated organizations, or those of the publisher, the editors and the reviewers. Any product that may be evaluated in this article, or claim that may be made by its manufacturer, is not guaranteed or endorsed by the publisher.
References
Agren, G. I., Wetterstedt, J. A. M., Billberger, M. F. K. (2012). Nutrient limitation on terrestrial plant growth–modeling the interaction between nitrogen and phosphorus. New Phytol. 194, 953–960. doi: 10.1111/j.1469-8137.2012.04116.x
Arnon, D. I., Hoagland, D. R. (1938). Water-culture method for growing plants without soil, California Agricultural Experiment Station. (California, USA: California Agricultural Experiment Station).
Belgiu, M., Drăguţ, L. (2016). Random forest in remote sensing: A review of applications and future directions. ISPRS J. photogrammetry Remote Sens. 114, 24–31. doi: 10.1016/j.isprsjprs.2016.01.011
Brown, P. H., Zhao, F. J., Dobermann, A. (2022). What is a plant nutrient? Changing definitions to advance science and innovation in plant nutrition. Plant Soil 476, 11–23. doi: 10.1007/s11104-021-05171-w
Friedt, W., Tu, J., Fu, T. (2018). Academic and economic importance of Brassica napus rapeseed. In: Liu, S., Snowdon, R., Chalhoub, B.. Brassica napus Genome. Cham: Springer, 1–20. doi: 10.1007/978-3-319-43694-4_1
Gruber, B. D., Giehl, R. F. H., Friedel, S., von Wirén, N. (2013). Plasticity of the Arabidopsis root system under nutrient deficiencies. Plant Physiol. 163, 161–179. doi: 10.1104/pp.113.218453
Han, P., Qin, L., Li, Y., Liao, X., Xu, Z., Yu, C., et al. (2016). Effects of different nutrient deficiencies on growth and root morphological changes of rapeseed seedlings (Brassica napus L.). Chin. J. Oil Crop Sci. 38, 88. doi: 10.7505/j.issn.1007-9084.2016.01.014
Hasanuzzaman, M., Bhuyan, M. B., Nahar, K., Hossain, M. S., Mahmud, J. A., Hossen, M. S., et al. (2018). Potassium: A vital regulator of plant responses and tolerance to abiotic stresses. Agronomy 8, 31. doi: 10.3390/agronomy8030031
Jiang, J., Johansen, K., Stanschewski, C. S., Wellman, G., Mousa, M. A., Fiene, G. M., et al. (2022). Phenotyping a diversity panel of quinoa using UAV-retrieved leaf area index, SPAD-based chlorophyll and a random forest approach. Precis. Agric. 23, 961–983. doi: 10.1007/s11119-021-09870-3
Jiang, L., He, X., Wei, J., Wang, X., Wang, F. (2015). Advances of phytochemicals in mediating micronutrients metabolisms. Chin. Bull. Life Sci. 27, 1020–1027. doi: 10.13376/j.cbls/2015141
Johansen, K., Morton, M. J., Malbeteau, Y. M., Aragon, B., Al-Mashharawi, S. K., Ziliani, M. G., et al. (2019). Unmanned aerial vehicle-based phenotyping using morphometric and spectral analysis can quantify responses of wild tomato plants to salinity stress. Front. Plant Sci. 10, 370. doi: 10.3389/fpls.2019.00370
Johnson, R., Vishwakarma, K., Hossen, M. S., Kumar, V., Shackira, A. M., Puthur, J. T., et al. (2022). Potassium in plants: Growth regulation, signaling, and environmental stress tolerance. Plant Physiol. Biochem. 172, 56–69. doi: 10.1016/j.plaphy.2022.01.001
Kalaji, H. M., Bąba, W., Gediga, K., Goltsev, V., Samborska, I. A., Cetner, M. D., et al. (2018). Chlorophyll fluorescence as a tool for nutrient status identification in rapeseed plants. Photosynthesis Res. 136, 329–343. doi: 10.1007/s11120-017-0467-7
Khan, M. J., Khan, H. S., Yousaf, A., Khurshid, K., Abbas, A. (2018). Modern trends in hyperspectral image analysis: A review. IEEE Access 6, 14118–14129. doi: 10.1109/ACCESS.2018.2812999
Li, L., Chen, B., Yan, G., Gao, G., Xu, K., Xie, T., et al. (2020). Proposed strategies and current progress of research and utilization of oilseed rape germplasm in China. J. Plant Genet. Resour. 21, 1–19. doi: 10.13430/j.cnki.jpgr.20200109005
Li, H., Wang, P., Weber, J. F., Gerhards, R. (2018). Early identification of herbicide stress on soybean (Glycine max (L.) Merr.) using chlorophyll fluorescence imaging technology in field practice. Sensors 18, 21. doi: 10.3390/s18010021
Liu, C., Feng, Z., Xiao, T., Ma, X., Zhou, G., Huang, F., et al. (2019). Development, potential and adaptation of Chinese rapeseed industry. Chin. J. Oil Crop Sci. 41, 485. doi: 10.7505/j.issn.1007-9084.2019.04.001
Lorente, D., Aleixos, N., Gómez-Sanchis, J., Cubero, S., García-Navarrete, O. L., Blasco, J. (2012). Recent advances and applications of hyperspectral imaging for fruit and vegetable quality assessment. Food Bioprocess Technol. 5, 1121–1142. doi: 10.1007/s11947-011-0725-1
Merchant, S. S. (2010). The elements of plant micronutrients. Plant Physiol. 154, 512–515. doi: 10.1104/pp.110.161810
Pavlovic, J., Kostic, L., Bosnic, P., Kirkby, E. A., Nikolic, M. (2021). Interactions of silicon with essential and beneficial elements in plants. Front. Plant Sci. 12, 697592. doi: 10.3389/fpls.2021.697592
Sarafi, E., Siomos, A., Tsouvaltzis, P., Therios, I., Chatzissavvidis, C. (2018). Boron toxicity effects on the concentration of pigments, carbohydrates and nutrient elements in six non-grafted pepper cultivars (Capsicum annuum L.). Indian J. Plant Physiol. 23, 474–485. doi: 10.1007/s40502-018-0388-2
State Administration for Marker Regulation of the People’s Republic of China & Standardization Administration of the People’s Republic of China (2020). Foliar microelement fertilizer: GB/T 17420—2020 Vol. 2020 (Beijing: Standards Press of China).
Takano, J., Miwa, K., Fujiwara, T. (2008). Boron transport mechanisms: collaboration of channels and transporters. Trends Plant Sci. 13, 451–457. doi: 10.1016/j.tplants.2008.05.007
Teixeira, G. C. M., de Mello Prado, R., Oliveira, K. S., D’Amico-Damião, V., da Silveira Sousa Junior, G. (2020). Silicon increases leaf chlorophyll content and iron nutritional efficiency and reduces iron deficiency in sorghum plants. J. Soil Sci. Plant Nutr. 20, 1311–1320. doi: 10.1007/s42729-020-00214-0
Thor, K. (2019). Calcium-nutrient and messenger. Front. Plant Sci. 10, 440. doi: 10.3389/fpls.2019.00440
Tian, X., Yao, J., Yu, H., Wang, W., Huang, W. (2024). Early contamination warning of Aflatoxin B1 in stored maize based on the dynamic change of catalase activity and data fusion of hyperspectral images. Comput. Electron. Agric. 217, 108615.
Tmušić, G., Manfreda, S., Aasen, H., James, M. R., Gonçalves, G., Ben-Dor, E., et al. (2020). Current practices in UAS-based environmental monitoring. Remote Sens. 12, 1001. doi: 10.3390/rs12061001
USDA (2024) Rapeseed Explorer. Available online at: https://ipad.fas.usda.gov/cropexplorer/cropview/commodityView.aspx?cropid=2226000.
Wu, Z., Wang, X., Song, B., Zhao, X., Du, J., Huang, W. (2021). Responses of photosynthetic performance of sugar beet varieties to foliar boron spraying. Sugar Tech 23, 1332–1339. doi: 10.1007/s12355-021-01008-z
Yang, Y., Wu, Y., Li, W., Liu, X., Zheng, J., Zhang, W., et al. (2018). Determination of geographical origin and icariin content of Herba Epimedii using near infrared spectroscopy and chemometrics. Spectrochimica Acta Part A: Mol. Biomolecular Spectrosc. 191, 233–240. doi: 10.1016/j.saa.2017.10.019
Yuan, Z., Wei, L., Zhang, Y., Yu, M., Yan, X. (2020). Hyperspectral inversion and analysis of heavy metal arsenic content in farmland soil based on optimizing cars combined with PSO-SVM algorithm. Spectrosc. Spectral Anal. 40, 567–573. doi: 10.3964/j.issn.1000-0593(2020)02-0567-07
Keywords: deficiency identification, rapeseed, iron and boron, hyperspectral imaging, MSC-CARS-LDA
Citation: Li H, Wan L, Li C, Wang L, Zhu S, Chen X and Wang P (2024) Hyperspectal imaging technology for phenotyping iron and boron deficiency in Brassica napus under greenhouse conditions. Front. Plant Sci. 15:1351301. doi: 10.3389/fpls.2024.1351301
Received: 06 December 2023; Accepted: 10 May 2024;
Published: 24 May 2024.
Edited by:
Xi Tian, Beijing Academy of Agriculture and Forestry Sciences, ChinaReviewed by:
Magdi A. A. Mousa, King Abdulaziz University, Saudi ArabiaXia Liang, The University of Melbourne, Australia
Xiaoyu Tian, Jiangsu University, China
Copyright © 2024 Li, Wan, Li, Wang, Zhu, Chen and Wang. This is an open-access article distributed under the terms of the Creative Commons Attribution License (CC BY). The use, distribution or reproduction in other forums is permitted, provided the original author(s) and the copyright owner(s) are credited and that the original publication in this journal is cited, in accordance with accepted academic practice. No use, distribution or reproduction is permitted which does not comply with these terms.
*Correspondence: Pei Wang, peiwang@swu.edu.cn