 Victor Blanco
 Lee Kalcsits
- 1Department of Horticulture, Washington State University, Pullman, WA, United States
- 2Efficient Use of Water in Agriculture Program, Institute of Agrifood Research and Technology (IRTA), Lleida, Spain
Instrumentation plays a key role in modern horticulture. Thus, the microtensiomenter, a new plant-based sensor that continuously monitors trunk water potential (Ψtrunk) can help in irrigation management decisions. To compare the response of the Ψtrunk with other continuous tree water status indicators such as the sap flow rate, the difference between canopy and air temperatures, or the variations of the trunk and fruit diameter, all the sensors were installed in 2022 in a commercial orchard of ‘Honeycrisp’ apple trees with M.9 rootstocks in Washinton State (USA). From the daily evolution of the Ψtrunk, five indicators were considered: predawn, midday, minimum, daily mean, and daily range (the difference between the daily maximum and minimum values). The daily range of Ψtrunk was the most linked to the maximum daily shrinkage (MDS; R2 = 0.42), the canopy-to-air temperature (Tc-Ta; R2 = 0.32), and the sap flow rate (SF; R2 = 0.30). On the other hand, the relative fruit growth rate (FRGR) was more related to the minimum Ψtrunk (R2 = 0.33) and the daily mean Ψtrunk (R2 = 0.32) than to the daily range of Ψtrunk. All indicators derived from Ψtrunk identified changes in tree water status after each irrigation event and had low coefficients of variation and high sensitivity. These results encourage Ψtrunk as a promising candidate for continuous monitoring of tree water status, however, more research is needed to better relate these measures with other widely studied plant-based indicators and identify good combinations of sensors and threshold values.
1 Introduction
Apples are ranked the fourth most cultivated fruit worldwide (FAOSTAT, 2022). The United States is the second most productive country, with an average annual production of 4.6 Mt. 69% of that production occurs in Washington State, where apple production entirely relies on irrigation (USDA, 2022). There, the adoption of dwarfing rootstocks, such as ‘M.9’, was important for increasing fruit yield and quality which consequently improved orchard profitability. This transition transformed traditional low-density planting orchards into modern high-density systems. Because of their smaller root biomass, dwarfing rootstocks are more vulnerable to water stress, soil water deficits and atmospheric demand (Lakso, 1994). Mild to severe uncontrolled water stress during orchard establishments in the first 2-3 years can reduce precocity and productivity, for mature trees, water stress can reduce fruit size (Robinson et al., 2013; Valverdi and Kalcsits, 2021).
Water limitations during early stages of fruit development can lead to an unbalanced fruit nutritional status which increases the occurrence of physiological disorders such as bitter pit in some cultivars like ‘Honeycrisp’ (Cheng and Sazo, 2018). On the other hand, over-irrigating can cause excessive vegetative growth, poor fruit quality such as lower firmness and soluble solids concentration, and make fruit more vulnerable to developing soggy breakdown and soft scald incidence (Robinson and Lopez, 2012). Moreover, overirrigation promotes excessively large apples for ‘Honeycrisp’ (diameter > 90 mm) which have been associated with increases in bitter pit incidence (Kalcsits et al., 2019; Lordan et al., 2019). That is why, irrigation strategies like regulated deficit irrigation that control tree vigor, and maintain optimum fruit nutritional status, size, and quality are used by growers in irrigated apple production regions (Reid and Kalcsits, 2020). However, implementation can be difficult since there is a lack of precise measures to improve irrigation management in these situations.
Precise irrigation management is needed to maximize fruit productivity and quality and save water resources. This requires careful monitoring of soil water availability and/or of tree water status. Although measuring soil water availability or estimating water-use based on environmental conditions remain the most commonly used approaches for irrigation scheduling, plant-based indicators of water status are increasingly being considered for irrigation decisions. There are many plant-based sensors that can continuously and directly measure real-time trees’ physiological responses and assess tree water status and fruit growth such as microtensiometers, sap flow sensors, thermoradiometers, and trunk and fruit dendrometers (Fernandez, 2017). All of them can be incorporated into decision-support systems for irrigation management and have shown a strong relationship with reference tree water status indicators such as the midday stem water potential measured with the Scholander pressure chamber and tree gas exchange (Fernandez, 2017; Noun et al., 2022). However, as has been previously reported by Garcia-Tejera et al. (2021), the benefits of continuously monitoring tree water status for irrigation management based on threshold values depend on the possibility of rapidly triggering irrigation when the threshold value is exceeded, which in commercial orchards is not always possible.
Microtensiometers consist of microelectromechanical pressure sensors that are embedded into the trunk (Pagay et al., 2014) and measure trunk water potential. Their measurements have been recently validated in different fruit trees and vines and under different environmental conditions and irrigation regimes with promising results (Blanco and Kalcsits, 2021; Lakso et al., 2022; Pagay, 2022; Blanco and Kalcsits, 2023; Conesa et al., 2023; Gonzalez Nieto et al., 2023a). Its continuous data acquisition may provide reliable and robust water status indicators that correspond well to commonly measured plant response traits such as the sap flow rates, the temperature of the canopy or the daily variations of the trunk and fruit diameter. These indicators may include midday, predawn, minimum, daily mean and daily range of trunk water potential. However, it must be said that these sensors are relatively expensive considering that their lifespan is not guaranteed after one season.
Sap flow sensors can estimate tree water use and consequently, irrigation doses, and have been described as a reliable tool for understanding plant hydraulic functioning (Alarcón et al., 2000; Burgess et al., 2001; Steppe et al., 2015). However, other authors have highlighted challenges associated with the installation process and wounding which can lead to different errors (Kumar et al., 2022) while others have recommended their use as a reference more than as an absolute value for calculating irrigation needs (Ballester et al., 2013).
Infrared radiometers installed above the canopy monitor canopy temperature. Increases in foliage temperature relative to air temperature can be an indicator of tree responses to water limitations (Jones, 2004; Mira-Garcia et al., 2022). Gómez-Candón et al. (2022) reported that this technology was a reliable indicator of water status in apple trees. However, the sensitivity of the indicators derived from the temperature of the canopy can be strongly affected by the age of the leaves or the development of vegetative flushes (Gonzalez-Dugo et al., 2014).
Trunk and fruit dendrometers continuously measure trunk and fruit diameters and have been extensively used by researchers to assess tree water status and fruit growth (Morandi et al., 2017; Ortuño et al., 2010). Trunk and fruit diameters increase during the night and either shrink or grow slowly during the day. Well-established indicators that use trunk diameter measurements include maximum daily shrinkage and growth rate which are sensitive to slight water deficits (De Swaef et al., 2009; Du et al., 2017; Blanco and Kalcsits, 2023). Fruit growth continuous measurements can be used to calculate growth rates which are parameters highly relevant as they are directly related to fruit yield and have shown good preliminary results for scheduling irrigation and determining water stress levels that do not penalize fruit growth (Fernandes et al., 2018). Fruit diameter is one of the most important characteristics for apples for accessing desired markets, along with fruit color. Although fruit diameter is largely determined by crop load (Serra et al., 2016; Gonzalez et al., 2020, Gonzalez et al., 2023), tree water status deeply affects fruit growth, as well as fruit quality and growers revenue (Ripoll et al., 2014). ‘Honeycrisp’ apples are within the top five most cultivated apples in the US and ‘Honeycrisp’ orchards show a much quicker investment payoff compared with other apple cultivars (Gonzalez Nieto et al., 2023b). They are the highest-priced apples in Washington State ($53.39 for a 40-pound box, 18.14 kg, Calvin et al., 2022), however, in order to reach those prices, high fruit standards regarding apple size and quality need to be met.
The aim of this work was to study the interaction, performance, and relationships of the water status indices derived from the continuous measures of the trunk water potential and compare them with other continuous, real-time, and easily automatable tree water status indicators that have been widely studied such as the sap flow rate, the canopy to air temperature, the trunk maximum daily shrinkage, the trunk growth rate, the fruit diameter variations and the relative fruit growth rate in a high-density commercial orchard of apple trees of the combination ‘Honeycrisp’/M.9.
2 Materials and methods
The experiment was conducted in a commercial apple orchard located in Grandview (Washington State, USA, 46° 18′ N, 119° 53′ W) from the end of June to the end of July 2022 spanning 31 days. The orchard (6.5 ha, elevation of 325 m, and North facing slope of 2°) was planted in 2009 with ‘Honeycrisp’/M.9 apple trees (Malus × domestica Borkh) in North-South oriented rows spaced 4.5 m and 0.8 m between trees (2778 trees ha-1) trained as a solaxe system. Trees had a crown area of 3.1 m2 at the beginning of the experiment (late June 2022). Full bloom and harvest dates were in late April and mid-September, respectively. The soil was characterized as a Hezel loamy fine sand (Sallato, 2023). Trees were drip irrigated with two drip lines per tree row with integrated emitters with a discharge rate of 3.78 L h-1 and a spacing of 45 cm.
Environmental data (air temperature, relative humidity, total solar radiation, and reference evapotranspiration) were recorded by a weather station located close to the orchard and owned by AgWeatherNet (http://www.weather.wsu.edu; “Grandview station”). Daily air vapor pressure deficit (VPD) was calculated according to Allen et al. (1998). The mean VPD during the experiment was 3.3 ± 0.5 kPa and the maximum air temperature ranged between 25 and 37°C. Soil volumetric water content was measured at 0.3 m depth every 20 min with a capacitance domain sensor (5TM, Meter Group, Pullman, WA, USA). Soil water content values at field capacity and permanent wilting point were 0.25 and 0.10 m3·m-3, respectively (Figure 1).
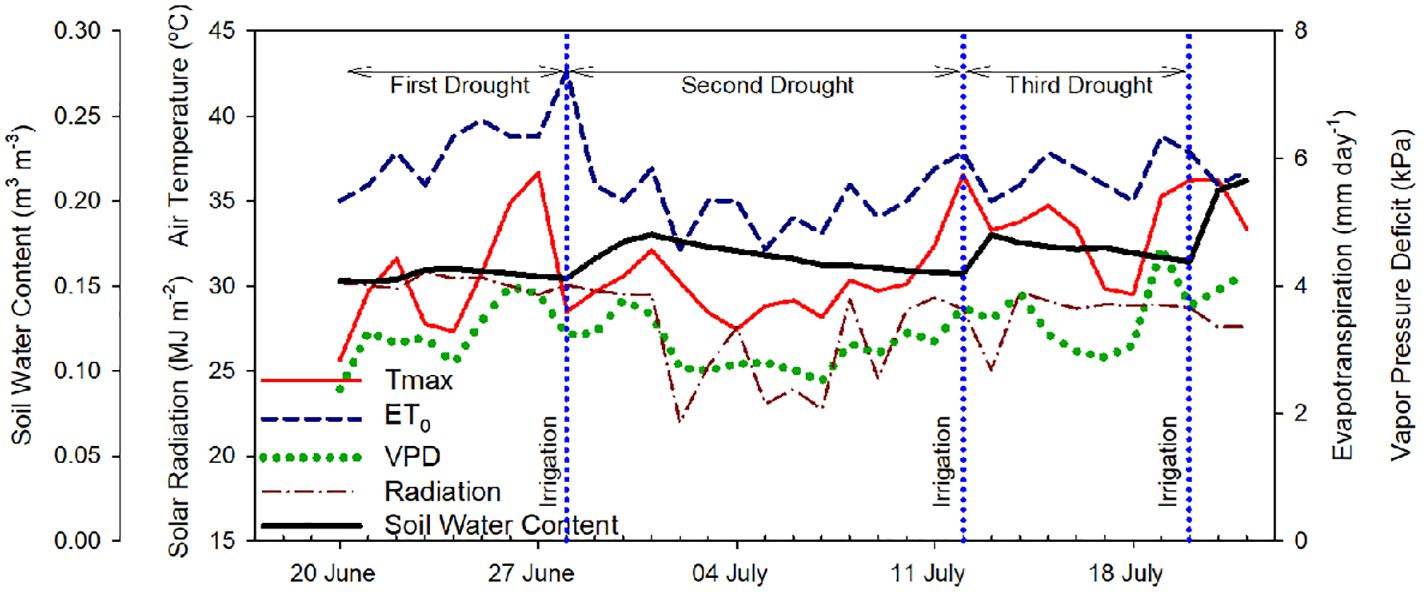
Figure 1 Evolution of the daily environmental conditions, maximum air temperature (Tmax), vapor pressure deficit (VPD), reference evapotranspiration (ET0), total solar radiation (MJ m-2), and soil water content (m3 m-3) from June 21st, 2022 to July 21st, 2022 in Grandview (Washington State, USA). Vertical blue dotted lines indicate the three irrigation events (June 28th, July 12th, and July 20th, 2022).
The trees were irrigated three times during the 31-day experiment following commercial practices and according to the environmental conditions (crop evapotranspiration). The trees were going through three irrigation-drought cycles to evaluate the sensors’ response across a range of different environmental conditions and soil water availability (first drought cycle: June 20 – June 27 (8 days); second drought cycle: June 29 - July 11 (13 days); third drought cycle: July 13 – July 19 (7 days)). Initially, it was scheduled to apply each irrigation set every 7 – 8 days. However, during the second drought cycle, there were several cloudy days with values of VPD and maximum temperature below 2.5 kPa and 30°C, respectively, which decreased the accumulated reference evapotranspiration for the week, so the grower decided to postpone that irrigation set and expand the second cycle. Irrigation doses were automatically calculated by AgWeatherNet based on the crop evapotranspiration for high-density apple orchards. The first irrigation set was 4 h, while the second and third irrigation sets were 6 h. The irrigation timing varied during the study depending on the grower’s management. The first irrigation set was applied during the morning - early afternoon, the second irrigation set was applied during predawn - morning, and the third irrigation set was applied during the afternoon.
Three homogeneous and representative trees, in terms of trunk size, canopy volume and crop load, were selected to assess trunk water potential (Ψtrunk), the sap flow rate (SF), and the variations in trunk diameter. In two of those trees, the temperature of the canopy (Tc) was also recorded. Fruit growth was measured in three apples for the same tree where all the sensors were installed. The total yield per tree, of the three trees monitored, was 55 apples of 72 mm of diameter (Sallato, 2023).
Ψtrunk was recorded every 20 minutes using microtensiometers (FloraPulse, Davis, CA, USA). The microtensiometers were embedded into the trunk of the selected trees on the North side of the tree on a flat surface of the trunk at 0.5 m from the graft union. Five variables were obtained every day from the evolution of Ψtrunk (midday, predawn, minimum, daily mean and daily range). Of those, three variables were extracted from the continuous measurements of trunk water potential: midday, predawn, and minimum trunk water potential. The daily mean was calculated as the average of all the values of Ψtrunk recorded by the microtensiometers for one day. The daily range of the Ψtrunk was calculated as the daily difference between the maximum and minimum values of Ψtrunk recorded. Sap flow rates were continuously measured every 15 minutes with an exo-skin sap flow sensor (Model SGB19-WS, Dynamax, Inc., Houston, TX, USA) installed on the trunk of the tree in a region without branches. Hourly and daily values were then calculated from the continuous measurements. Canopy temperature (Tc) was monitored every 15 minutes using infrared radiometer sensors (SPIP-IRT, Dynamax, Houston, TX, USA) with a precision of ± 0.5°C for air temperatures between 0 and 50°C. Midday Tc was compared to the air temperature (Ta) in the orchard measured with an air temperature and relative humidity sensor (ATMOS-14, METER Group Inc., Pullman, WA, USA) installed within the tree row, 1 m above the tree canopy to calculate the difference between canopy and air temperature (Tc-Ta). Trunk diameter was monitored in the same three trees every 10 minutes using linear voltage differential pressure transducer dendrometers (LVDT, model DE-1T, Implexx Sense, Melbourne, Australia) with a 0.001 mm resolution. The sensors were installed in the trunk in a position in between the microtensiometer (located below the trunk dendrometer) and the sap flow sensor (located above) and with the same North orientation. Maximum daily shrinkage (MDS) was calculated as the difference between the maximum and the minimum trunk diameter recorded on each day. Trunk growth rate (TGR) was calculated as the difference between the maximum trunk diameter for the current and previous days (Goldhamer and Fereres, 2001). Fruit diameter was measured every 10 minutes by fruit dendrometers (LVDT, model FI-LT, Implexx Sense, Melbourne, Australia) and from those measurements, the daily fruit relative growth rate (FRGR) was calculated according to Scalisi et al. (2019), and the daily variations of fruit diameter (FDV) was calculated as the difference between the daily maximum and minimum fruit diameter. The three apples selected were at the same height (1.5 m from the soil), sun-exposed in the outer part of the canopy, and had a similar diameter at the beginning of the experiment of 35 – 37 mm.
Relationships between plant water status indicators were calculated from the data of all the days of the experiment and were explored through linear and non-linear regression analyses performed with SigmaPlot 12.5 (Systat Software Inc., San Jose, CA, USA). The sensitivity analysis of the tree water status indicators was calculated according to Goldhamer and Fereres (2001). The sensitivity (S) of each indicator was calculated by dividing Signal Intensity (SI) by the coefficient of variation (CV; the ratio of the standard deviation to the mean). SI was calculated according to Conesa et al. (2023) as the ratio between the values recorded on the three days before irrigation (drought cycle), and the values of the three days after the irrigation event.
3 Results and discussion
3.1 Trunk water potential
Trunk water potential (Ψtrunk) measured using microtensiometers has been recently reported as a reliable indicator of tree water status in apples (Lakso et al., 2022). This indicator was strongly related to the stem water potential measured with the pressure chamber, the reference indicator for assessing the water status of fruit trees (McCutchan and Shackel, 1992; Naor, 2000; Shackel, 2011). However, microtensiometers are not as responsive as the pressure chamber to detect fast changes in tree water status and can show a time lag (Lakso et al., 2022; Blanco and Kalcsits, 2023). In this experiment, all the indicators derived from Ψtrunk followed a similar pattern (Figure 2A; Figure 3A; Figure 4A). Ψtrunk rapidly changed after each irrigation event and midday and minimum daily Ψtrunk increased by >0.4 MPa the next day, by 0.2 MPa for predawn Ψtrunk, and by 0.3 MPa for the daily mean. Recently, Gonzalez Nieto et al. (2023a) reported similar midday Ψtrunk for ‘Gala’ apples under water restrictions in New York State. In contrast, the predawn values reported for this study in ‘Gala’ were not as equally affected by water stress as the midday or minimum values and they were never lower than -0.4 MPa. In the present study, predawn Ψtrunk was clearly affected by the drought cycling with values lower than -1.0 MPa (Figure 2A) the days previous to the irrigation events. These differences might be attributed to the more demanding environmental conditions recorded in this experiment in the semi-arid climate of Washington State compared with more temperate conditions in New York State and to the cultivar used for this experiment. ‘Honeycrisp’ cultivar has shown lower water potentials than those reported for ‘Gala’ under water restrictions and fully irrigated (Valverdi et al., 2019).
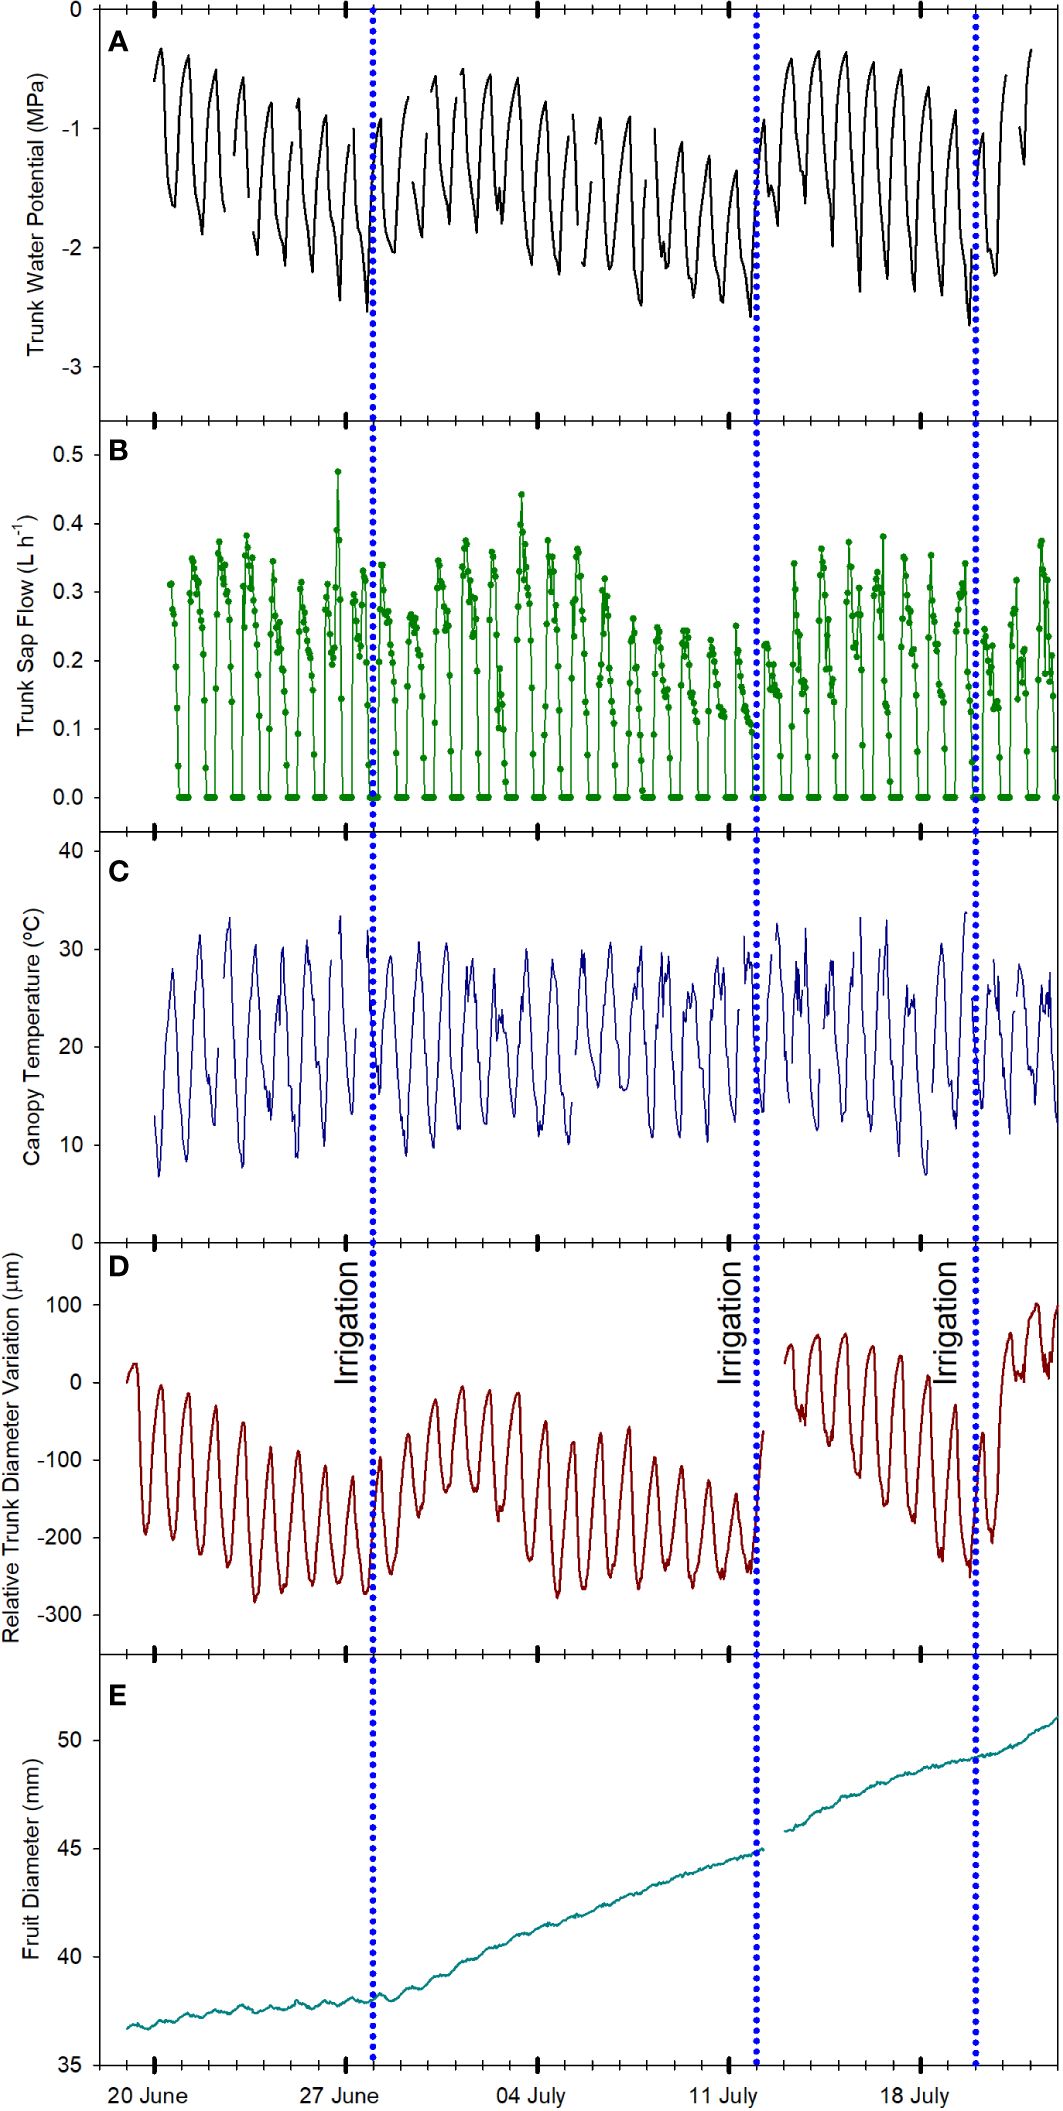
Figure 2 Evolution of the tree water status of one apple tree of the combination ‘Honeycrisp’/M.9 measured according to different physiological indicators: trunk water potential (A), sap flow rate (B), canopy temperature (C), trunk diameter fluctuations (D) and fruit diameter growth (E) from June 21st, 2022 to July 21st, 2022 in Grandview (Washington State, USA). Vertical blue dotted lines indicate the three irrigation events (June 28th, July 12th, and July 20th, 2022).
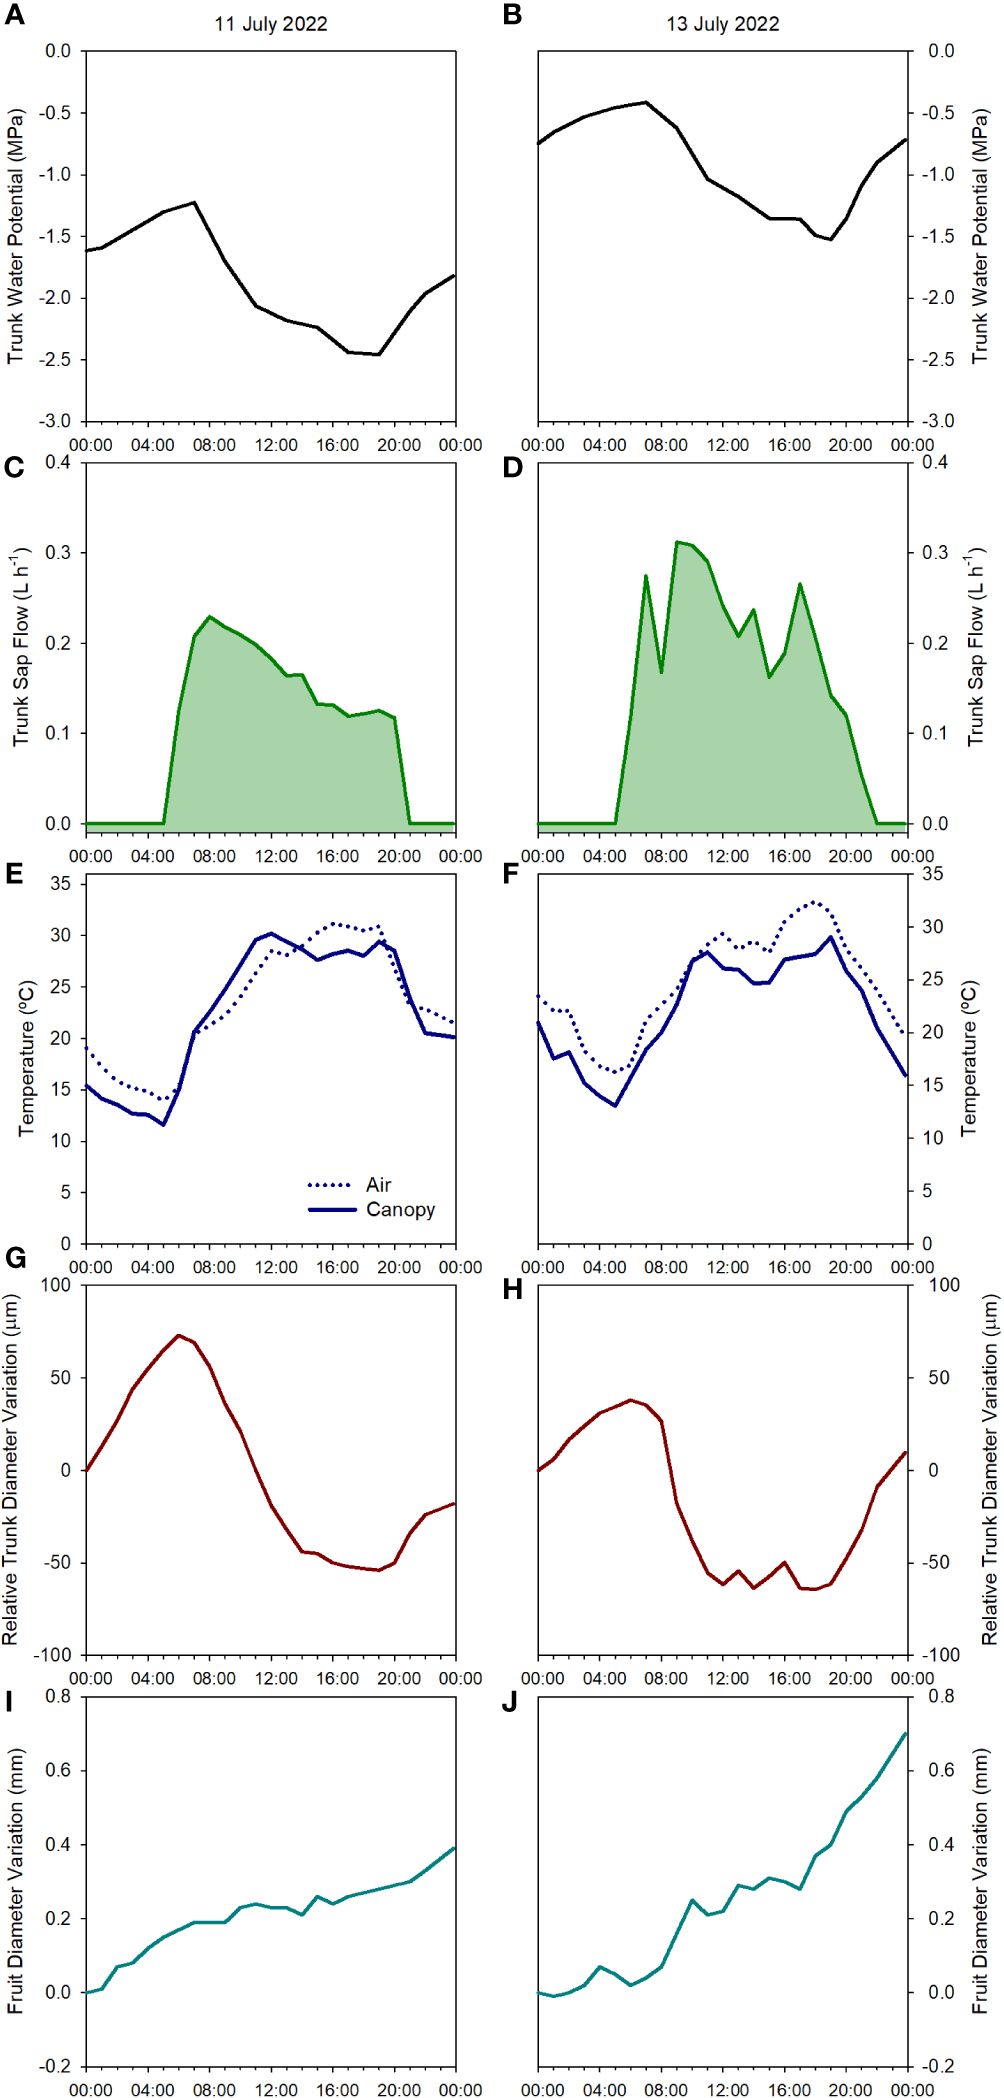
Figure 3 Diurnal evolution of the tree water status of one apple tree of the combination ‘Honeycrisp’/M.9 measured according to different physiological indicators: trunk water potential (A, B), sap flow rate (C, D), canopy and air temperature (E, F), relative trunk diameter variations (G, H) and fruit diameter variations (I, J) on July 11th, 2022 (pre-irrigation (A, C, E, G, I) and July 13th, 2022 (post-irrigation (B, D, F, H, J), in Grandview (Washington State, USA).
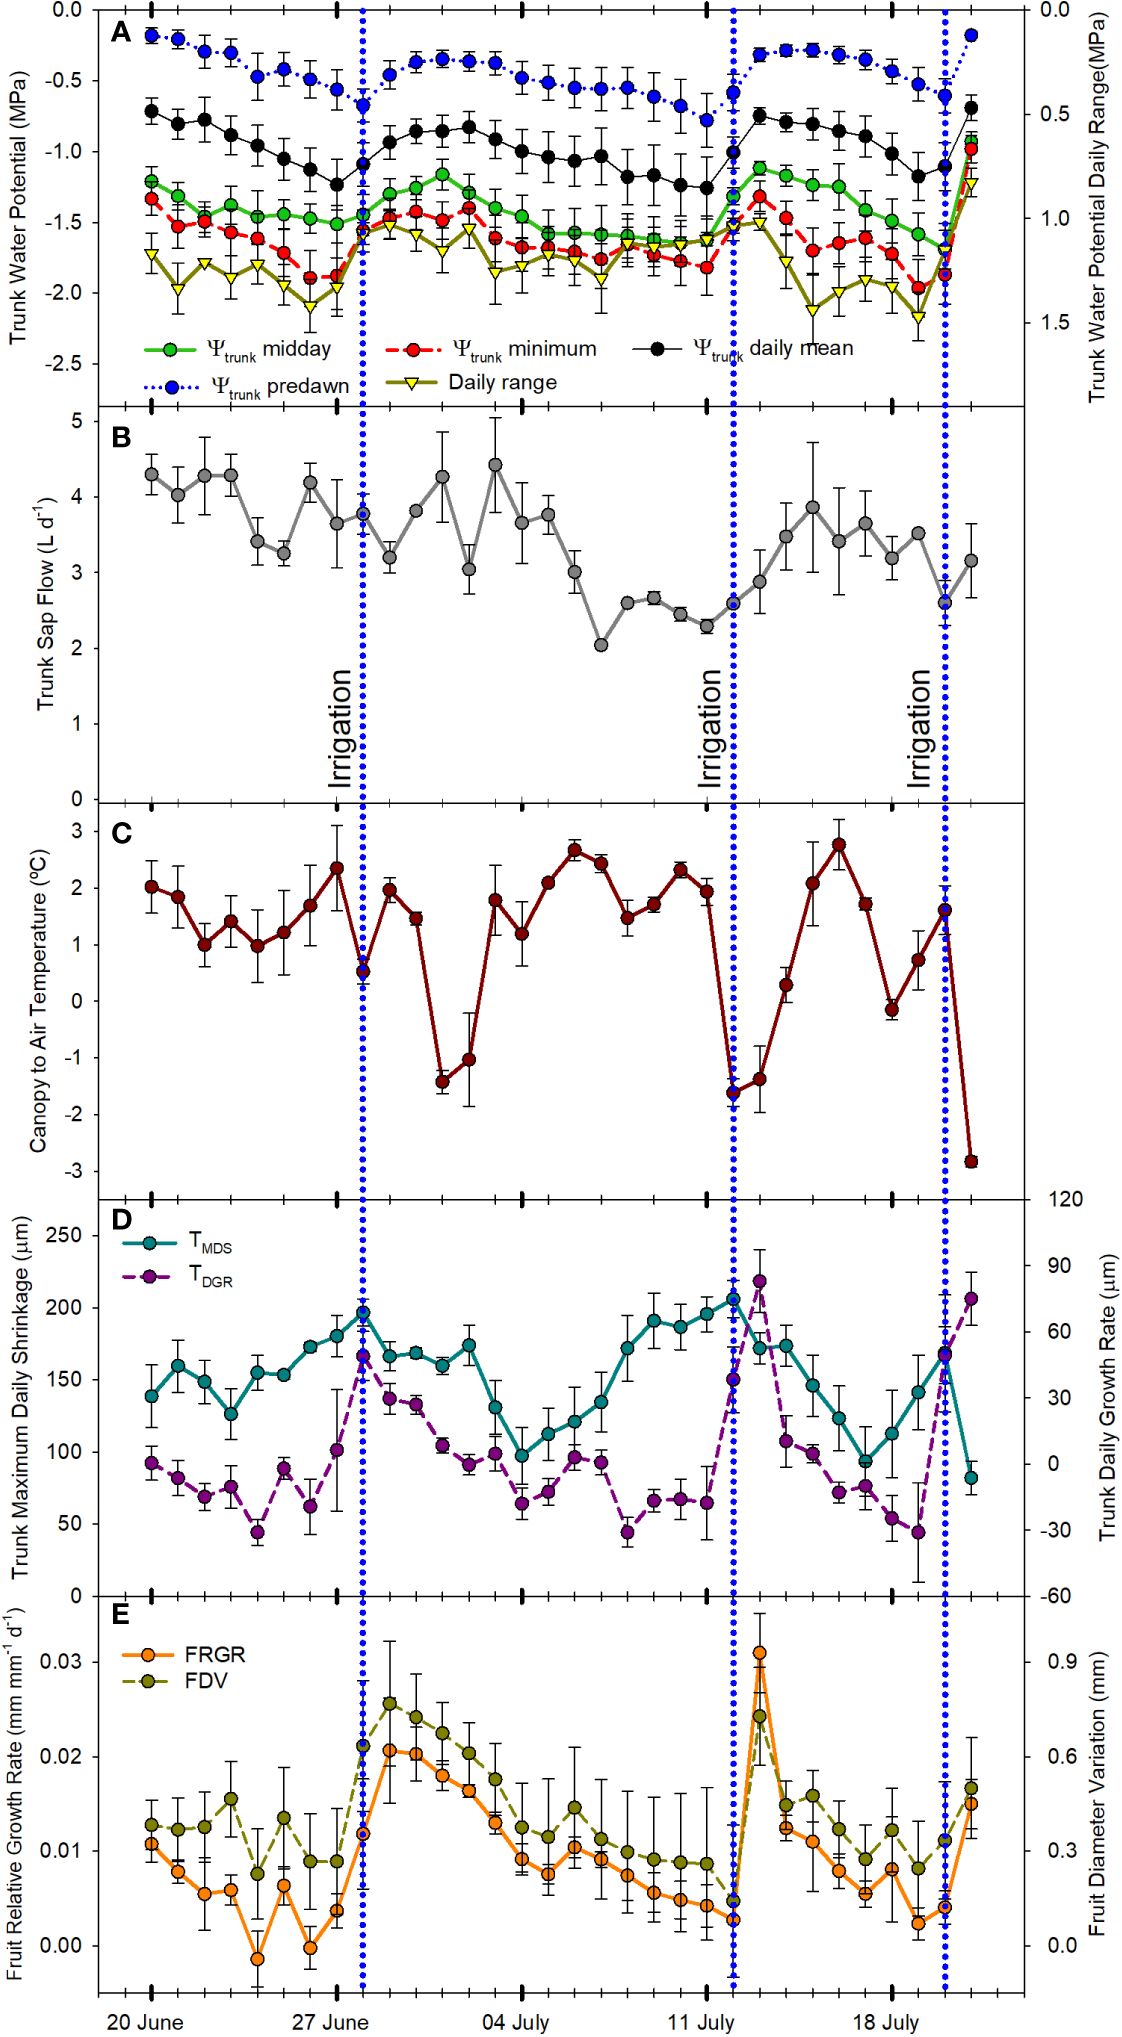
Figure 4 Mean value and standard error of midday, predawn, minimum, daily mean, and daily range trunk water potential (A) (n=3); total daily sap flow (B) (n=3); canopy to air temperature at midday (C) (n=2); trunk maximum daily shrinkage and daily trunk growth rate (D) (n=3); and fruit relative growth rate and fruit diameter variations (E) (n=3); from June 21st, 2022 to July 21st, 2022 in Grandview (Washington State, USA). Vertical blue dotted lines indicate the three irrigation events (June 28th, July 12th, and July 20th, 2022).
The minimum values for Ψtrunk on July 11th, 2022, before the irrigation was applied, were recorded during the afternoon (1700 – 1800 h, Figure 3A), a similar time of the day to those recorded in pears and vines under water stress in Washington State and Australia (Blanco and Kalcsits, 2021; Pagay, 2022) and slightly later than those recorded in nectarine trees in Spain (Conesa et al., 2023). Two days later on July 13th, 2022, the pattern was similar with maximum values at dawn and minimum values during the afternoon but with fewer negative values (Figure 3B). This rapid recovery of the trunk and stem water potential has been also observed in ‘Golden Delicious’/MM106 and ‘Gala’/G.11, with rapid changes of midday and minimum stem and trunk water potentials of more than 0.5 MPa (Doltra et al., 2007; Gonzalez Nieto et al., 2023a).
3.2 Sap flow
SF sensors recorded tree water use, with values that ranged between 2 and 4 L day-1 (Figure 4B). Similarly, Bhusal et al. (2019) reported sap flow rates for the medium maturing cultivar ‘Hongro’ on M.9 rates of 3 L day-1 for fully irrigated trees. However, they reported SF of 0.75 L day-1 for trees under no irrigation for 50 days and midday stem water potential below -2.5 MPa. In this experiment, for ‘Honeycrisp’ apples, the minimum value of SF measured was closer to 1.5 L day-1. For the days with midday trunk water potential below -1.7 MPa, it was observed a reduction in the rates of sap flow from values of 3.2 L day-1 to below 2.0 L day-1. These values were higher than those reported in ‘Fuji’ and ‘Golden Delicious’ under water restrictions (Liu et al., 2012; Bhusal et al., 2019). Moreover, it was also observed the strong effect that environmental conditions such as VPD, radiation, and air temperature had on tree transpiration rates (Liu et al., 2012). Thus, on July 2nd, 2022, although the minimum Ψtrunk was -1.5 MPa, the low solar radiation (below 23 MJ m-2) and low evaporative demand (air temperature and VPD below 30°C and 3 kPa, respectively) caused the SF to decrease below 2.0 L day-1 (Figures 1, 2B).
SF was the highest in the early morning with no differences observed at dawn on days before and after irrigation (0.2 L h-1). However, differences were first evident during the morning as the environmental conditions became more demanding. In the days before the irrigation, from dawn onwards, SF slowly decreased (Figure 3C). On the other hand, for the same tree in the days after the irrigation was applied the maximum daily values occurred between 0900 and 1100 h and then slowly decreased showing a sawtooth trend (Figure 3D). This pattern is similar to those reported in the cultivars ‘Braeburn’ (Green et al., 2003), ‘Fuji’ (Fernandez et al., 2008), ‘Nicoter’ (Ben Abdelkader et al., 2022), and ‘Mutsu’ (De Swaef et al., 2009). Rootstocks have also been reported to influence transpiration and SF (Cohen and Naor, 2002). Other apple cultivars grafted onto M.9, such as ‘Golden Delicious’ had similar SF values to those reported here, between 0.2 and 0.5 L h-1, while for the same cultivar on a more vigorous rootstock, SF was consistently higher (Li et al., 2002).
3.3 Canopy to air temperature
Canopy temperature (Tc) is strongly affected by environmental conditions, so its use as an absolute value for assessing tree water status is not recommended (Idso et al., 1981; Figure 2C). However, when accounting for ambient conditions (Ta), the use of thermal-based indices, such as the difference between canopy and air temperature (Tc-Ta) and the crop water stress index, can be reliable for assessing water stress in fruit trees (Gonzalez-Dugo et al., 2013; Ramirez-Cuesta et al., 2022; Blanco et al., 2023 The continuous monitoring of the Tc-Ta has been described as the “heartbeat” of the tree water status (Mira-Garcia et al., 2022). In apple trees, Gómez-Candón et al. (2022) stated that Tc-Ta is a sensitive indicator for many apple cultivars, and values between 1 and 2°C were related to midday stem water potentials between -1.6 and -1.8 MPa. Our results for ‘Honeycrisp’ followed a slightly different trend with Tc-Ta at midday between 0.5 and 2.5°C (Figure 4C) when the environmental conditions were highly demanding and those days previous to the irrigation events (Figure 3E) but with negative values of Tc-Ta at midday on the days after the trees were watered (Figure 3F) and on cloudy days with low evaporative demand, such as on July 2nd when total solar radiation was below 25 MJ m -2 (Figure 1). These results differ from those described for ‘Inored’ apples, in which positive values of Tc-Ta were recorded in trees with soil water content values close to field capacity and midday stem water potential of -1.2 MPa (Gómez-Candón et al., 2022). Midday Tc-Ta values higher than 2.5°C in ‘Honeycrisp’ apples occurred on days previous to the irrigation events, with minimum Ψtrunk values similar to -2 MPa, and air temperature and VPD higher than 35°C and 4 kPa, respectively (July 19th and 20th, 2022; Figure 4C). Similarly, the daily evolution of the Tc-Ta was affected by environmental demand and soil water availability. On July 11th, 2022, (the day before the second irrigation event) the maximum positive difference between the canopy and air temperature was 2.9°C at midday and the most negative difference was -3.4°C during the night (Figure 3E). On July 13th, 2022, the day after the second irrigation event, all the values of Tc-Ta recorded were negative, with the smallest difference at 1000 h, -0.4°C, and the largest at 1800h, - 5.6°C (Figure 3F). This pattern of negative Tc-Ta values during the complete day agrees with those evolutions reported in ‘Fuji’ apples under full irrigation and mild water stress by Osroosh et al. (2015) with values similar to zero at midday and a second peak during the afternoon. The difference between Tc and Ta at 1800 h should be related to Tőkei and Dunkel (2005) in apple trees, where increases in transpiration rates during the afternoon occurred as a result of the decrease of water stress and opening of stomata.
3.4 Trunk diameter variations
As expected, daily trunk diameter fluctuations followed a similar pattern to Ψtrunk and were responsive to changes in both soil water content and environmental conditions (Figure 2D). MDS increased when the trees were under water stress going from 120 µm to 250 µm during the drought cycles and decreased after each irrigation event (Figures 3C and 4D). However, after reaching midday Ψtrunk values of -1.8 MPa, MDS values did not continue to increase. Moreover, MDS values were also highly dependent on the environmental conditions so for consecutive days with similar values of minimum Ψtrunk, MDS varied by more than 25% (Figure 4D). Similarly, Du et al. (2017) reported for ‘Golden Delicious’ apple trees that MDS was strongly affected by environmental conditions. Thus, these both factors highlight the limitations of using absolute MDS values as a unique tree water status indicator. That is why, to decrease the variability of the MDS it has been recommended to express it relative to the MDS of a reference tree (non-stressed) which under commercial conditions might not be always suitable (Naor and Cohen, 2003).
For the TGR, negative values were recorded when the trees were under mild to severe water stress (Figure 2D) (midday Ψtrunk values ranging from -1.1 to -1.7 MPa) and, as such, this indicator is not suitable for quantifying water stress in mature ‘Honeycrisp’ apple trees. However, TGR was sensitive to identifying the irrigation events applied, showing increases in trunk diameter of more than 40 µm for the days following irrigation (Figure 4D). Similar results were also reported in young ‘Cox Orange Pippin’ apple trees (De Swaef et al., 2009). Blanco and Kalcsits (2023), reported that variations in trunk diameter immediately followed changes in trunk water potential in pear trees. Increases in trunk diameter observed immediately after irrigation match the results of Bonany et al. (2000) in potted trees from the combination ‘Golden Delicious’/M.9. They suggested that young trees and trees on dwarfing rootstocks rapidly use and refill water stored in the trunk as a water source to maintain transpiration and fruit growth depending on the soil water content. In contrast, mature vigorous trees with a greater root volume such as ‘Golden Delicious’/MM106 do not follow this behavior (Doltra et al., 2007). As with the MDS, TGR values also showed a high variability on days with similar values of Ψtrunk (Figure 4D), and it has been reported that TGR can vary significantly between cultivars, and rootstocks, and depend on factors such as tree vigor, crop load and age (Ortuño et al., 2010).
3.5 Fruit diameter variations
Daily FRGR was positive for most of the days of the experiment. Greater rates were recorded after irrigation, and when the evaporative demand was not excessively high (VPD < 3 kPa), while values close to 0 mm were recorded on days with ET0 values higher than 6 mm d-1. The daily FDV equaled the daily absolute growth since the maximum fruit diameter of the day generally matched the minimum fruit diameter of the next day (Figures 3I, J). Both, FRGR and FDV showed a similar trend to the TGR, emphasizing how both fruit growth and trunk water storage recovered when water supply increased (Figure 4E). The decrease in the daily FRGR and the FDV could be an early water status indicator to detect water deficit conditions for the trees (Figure 2E). Similar sensitivity of apple fruit diameter to water deficit has been reported in several cultivar and rootstock combinations as well as a range of environmental conditions (Morandi et al., 2017; Gonzalez Nieto et al., 2023a). Fruit growth occurred between evening and early morning for days before and after irrigation. No growth or a slight shrinking of the diameter was detected during midday or afternoon. These results agree with those reported by Boini et al. (2019) for ‘Imperial Gala’. When changes in fruit diameter were transformed into changes in mass (for ‘Honeycrisp’ apples, Diameter > 25 mm; Fruit Mass (g) = 0.07[Fruit Diameter (mm)]2 – 3.63[Fruit Diameter (mm)] + 59.41; Kalcsits et al., 2017), it was observed that the fruit growth was almost twice higher the day after the irrigation (0.7 mm, which equals ≈ 1.36 g fruit day-1; Figure 3J) than the day before (0.4 mm ≈ 0.69 g fruit day-1; Figure 3I).
3.6 Relations between trunk water potential and SF, Tc-Ta, MDS and TGR
For ‘Honeycrisp’ apples, Ψtrunk daily range showed the strongest and the most significant relationship with the SF, Tc-Ta, and MDS (based on a correlation analysis) of all the water stress indicators derived from Ψtrunk, followed by minimum and midday Ψtrunk which had similar results (Figure 5).
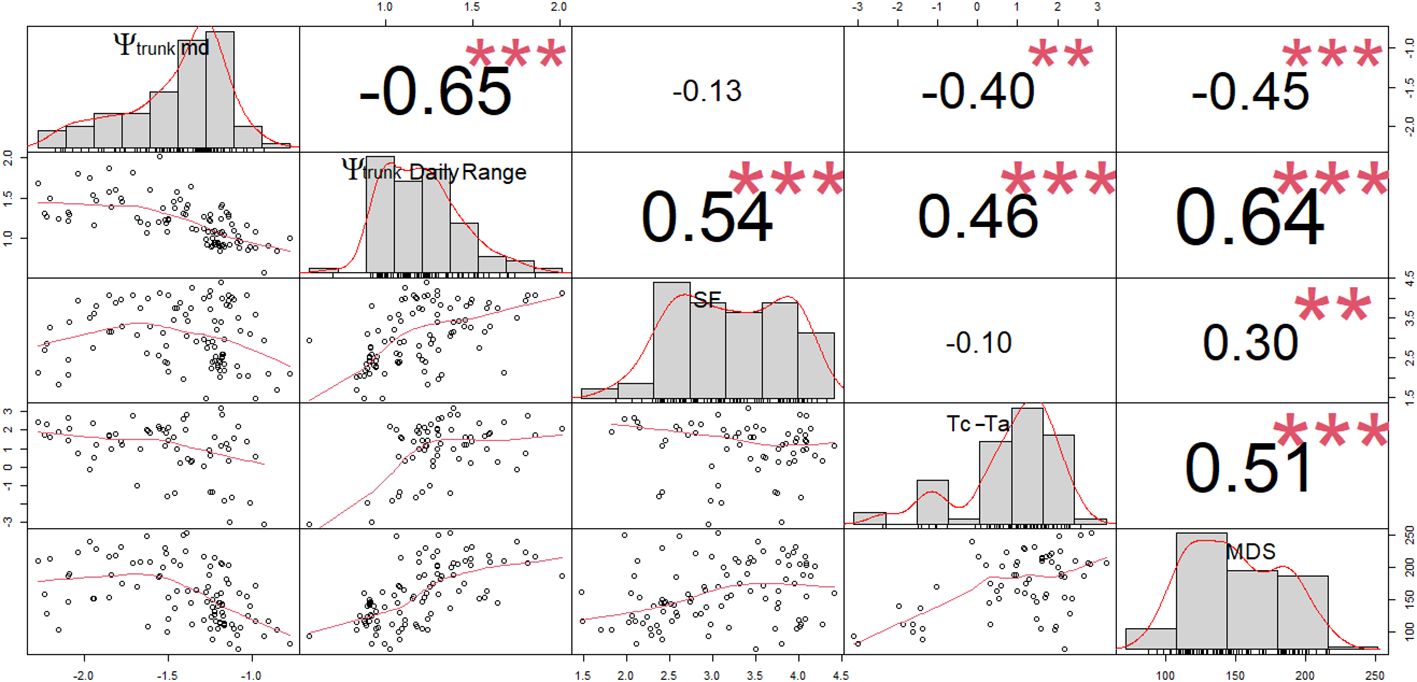
Figure 5 Correlation matrix (Pearson coefficients) for the linear regressions between midday trunk water potential (Ψtrunk md; MPa), daily range of trunk water potential (Ψtrunk Daily Range; MPa), sap flow rates (SF; L day-1), canopy to air temperature (Tc-Ta; °C) and maximum daily shrinkage of the trunk diameter (MDS; µm). ** and *** denote p-values < 0.01 and 0.001, respectively.
Predawn Ψtrunk did not show any significant relationship with SF, Tc-Ta, or MDS (p-values > 0.05). Several authors have also reported poor relationships between the predawn stem water potential and SF or MDS in apples, walnuts, and vines (Améglio et al., 1999; Intrigliolo and Castel, 2007; Liu et al., 2011). However, strong relationships have been reported in other tree fruit such as peaches and sweet cherries (Fereres et al., 1999; Livellara et al., 2011).
Based on linear regression analysis (Figure 5), the relationship between the indicators derived from the trunk water potential and MDS, SF and Tc-Ta followed a polynomial pattern (Table 1). Thus, MDS reached its maximum values when midday and minimum Ψtrunk were -1.8 and -2.0 MPa, respectively for ‘Honeycrisp’ apples. After that point, more negative tree water potentials were not related to greater MDS (Figure 5). This limitation has been previously reported in other fruit trees such as citrus, olive, stone fruits, and vines (Goldhamer et al., 1999; Ortuño et al., 2010; Blanco et al., 2018).
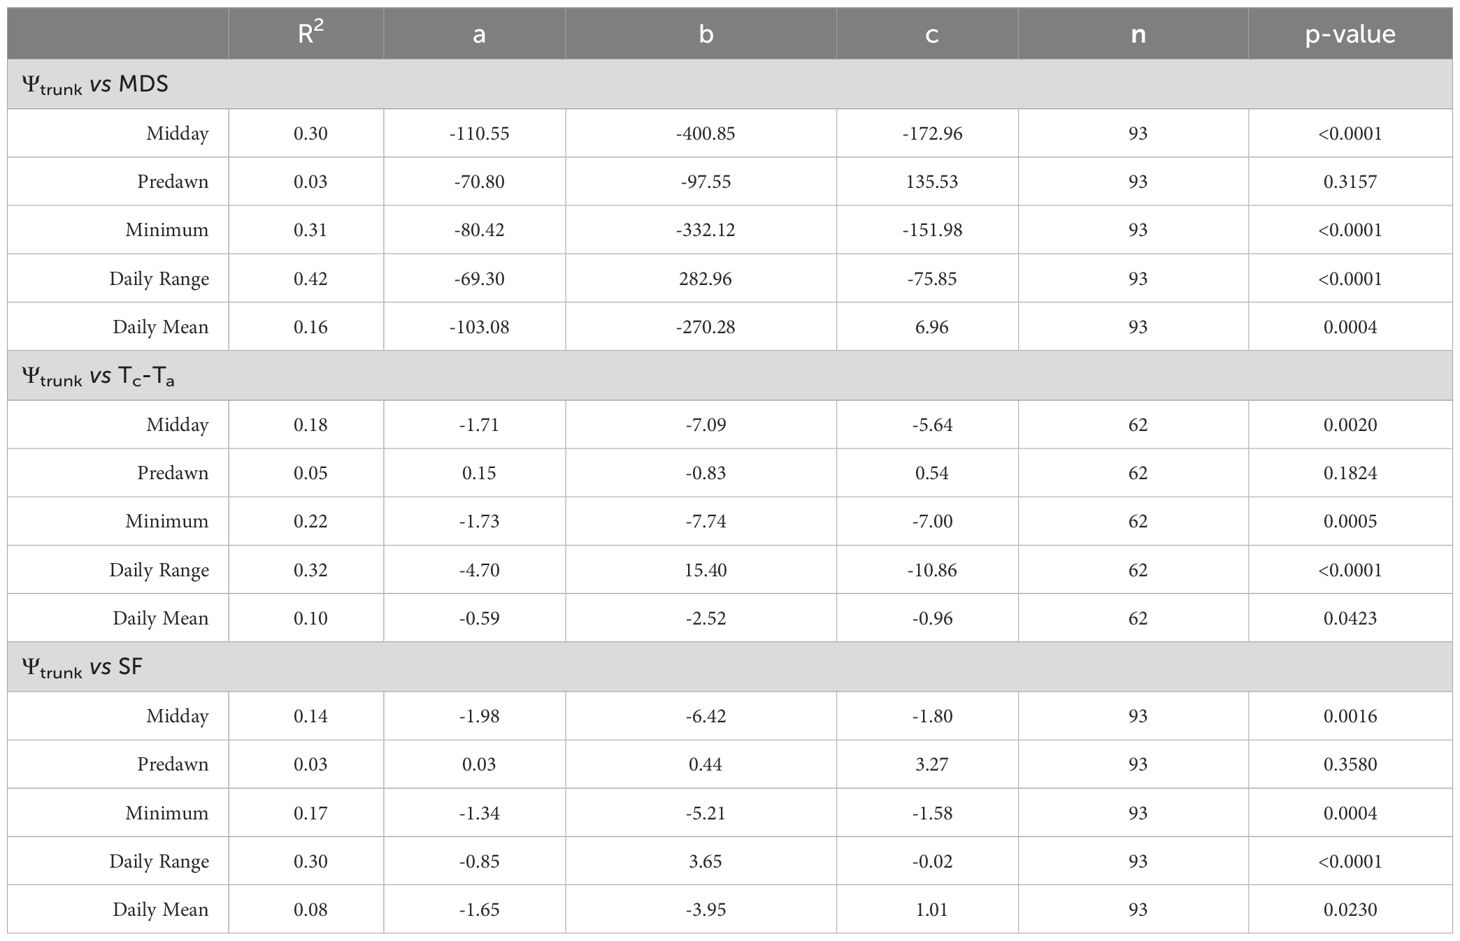
Table 1 Coefficient of determination (R2), and best fit quadratic equations [y = ax2 + bx +c] (quadratic coefficient (a), linear coefficient (b), and constant coefficient (c), number of data points (n) and p-value) between trunk water potential (midday, predawn, minimum, daily mean, daily range) measured by the microtensiometers and the maximum daily trunk shrinkage (MDS), difference between canopy and air temperature (Tc-Ta) and sap flow (SF) over the experiment.
Tc-Ta was more closely related to the daily range of Ψtrunk than to the minimum and midday Ψtrunk (Table 1). Ψtrunk was the lowest during the afternoon when Ta was the highest. However, the greatest difference between Tc and Ta was often recorded at midday. In almond trees, Gonzalez-Dugo et al. (2012) also reported a strong relationship, which followed a second-degree polynomial function, between midday stem water potential and Tc-Ta measured in the afternoon. A similar second-degree relationship between the stem water potential and thermal-based indicators has been reported in pear trees under similar environmental conditions (Blanco et al., 2023).
The relationship between midday Ψtrunk and SF was parabolic (Table 1) with maximum values, above 4 L day-1, in the range between -1.2 and -1.7 MPa, and with values below 2 L day-1 when the trees were under severe water stress (< -2.0 MPa) or under nondemanding atmospheric conditions (> -0.9 MPa). De Swaef et al. (2009) reported a similar trend for ‘Mutsu’ apples, however the threshold value observed was -1.4 MPa, higher than that in this study. In grapevines, Patakas et al. (2005) reported that SF was 50% lower when the vines were under slight water stress.
Among the widely studied continuous indicators considered, MDS showed the strongest and most statistically significant relationship with Ψtrunk, Tc-Ta ranked second, and SF was last (Figure 5). The strong relationship between Ψtrunk and MDS might be due to the ability of both indicators to rapidly detect changes in the tree water status (Conejero et al., 2007; De Swaef et al., 2009). However, when the tree was under mid- to severe water deficit (< -1.8 MPa), Ψtrunk was still able to detect and quantify water stress (until values below -2.5 MPa) while the MDS could not identify a situation of severe water stress. Ψtrunk overcame the limitations of MDS and did not show any threshold limit to detect severe water stress in the range between -0.2 and -2.5 MPa. However, some limitations that have been reported to affect MDS such as the age of the tree, the crop load, or the phenological stage of the tree (Fernandez and Cuevas, 2010), might also affect Ψtrunk. Similarly, Tc-Ta and SF have been reported to be strongly related to environmental conditions and were not recommended to detect slight water deficits or rapid physiological changes in response to water deficits (Ortuño et al., 2006; Mira-Garcia et al., 2022; Blanco et al., 2023).
The similar results obtained with the relationships between the SF, Tc-Ta, MDS, and TGR, and the midday and the minimum Ψtrunk are explained since both (midday Ψtrunk and minimum Ψtrunk) were strongly related (Ψtrunk min = 1.18Ψtrunk md + 0.06; R2 = 0.88). Predawn and midday Ψtrunk were also strongly correlated (Ψtrunk md = 1.07Ψtrunk pd - 0.94; R2 = 0.74). Daily maximum and minimum values of tree water potential, which correspond to predawn and midday -early afternoon respectively, have traditionally been used to determine tree water status in fruit trees (baselines) and threshold values to manage irrigation (Améglio et al., 1999; Naor et al, 1995; Shackel et al., 2021). However, the ability to continuously monitor Ψtrunk with the microtensiometers provides an opportunity to explore other water potential-based indicators such as the daily mean and the daily range of Ψtrunk that can integrate the tree water status for the whole day. These two indicators have not been widely explored when measuring the stem or leaf water potentials, but have the potential to be included in automated irrigation systems and are not as vulnerable as the midday Ψtrunk to be affected by time lag problems. Both indicators, the daily mean and the daily range of Ψtrunk, were more related to the midday and minimum Ψtrunk than to the predawn Ψtrunk (Figure 6). The present work is the first report that assesses their adequacy as tree water status indicators in apple trees.
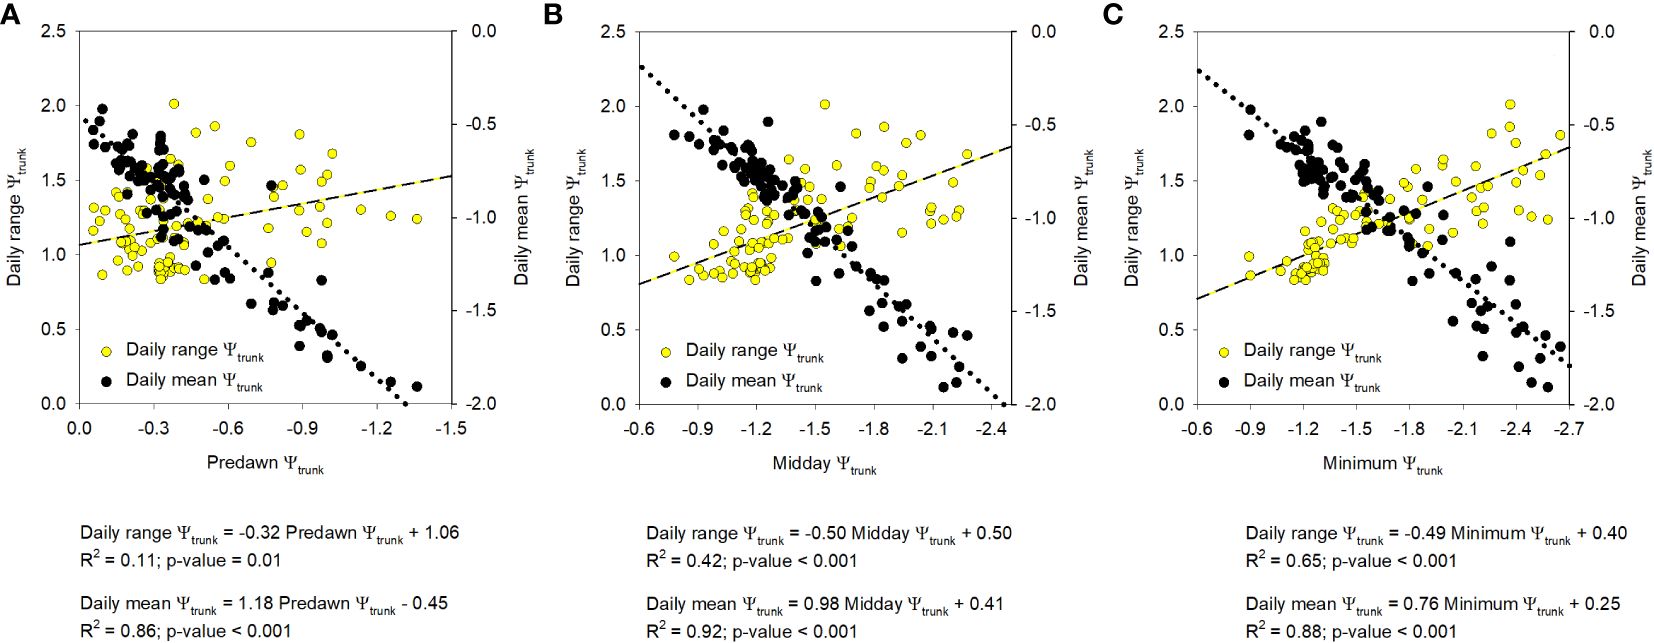
Figure 6 Relationship between the indices derived from the trunk water potential (Ψtrunk; MPa), daily range and daily mean, and the predawn (A), midday (B), and minimum (C) daily value. Each point corresponds to a specific tree and day (n=93).
3.7 Relations between fruit growth and tree water status continuous indicators (Ψtrunk, SF, Tc-Ta, MDS and TGR)
Since fruit is the real target for growers, direct, continuous monitoring of fruit growth should be compared with the proposed tree water status indicators. The variability found among fruits for FRGR and FDV was similar to the variability reported in apple size within fruits from the same tree (Kalcsits et al., 2019).
The indices derived from the fruit growth were more related to the Ψtrunk than to other tree water status indicators such as the MDS, SF, or Tc-Ta. According to our results, the daily mean of Ψtrunk followed by the midday and minimum Ψtrunk were the indicators derived from the trunk water potential that most closely corresponded to fruit growth rates (Table 2). Similarly, Boini et al. (2019) reported a strong relationship between midday stem water potential and changes in the FGR of ‘Gala’ apples. In this sense, recently, Gonzalez Nieto et al. (2023a) have developed the first logistic model that successfully relates Ψtrunk with fruit growth for the cultivar ‘Gala’ in New York State.
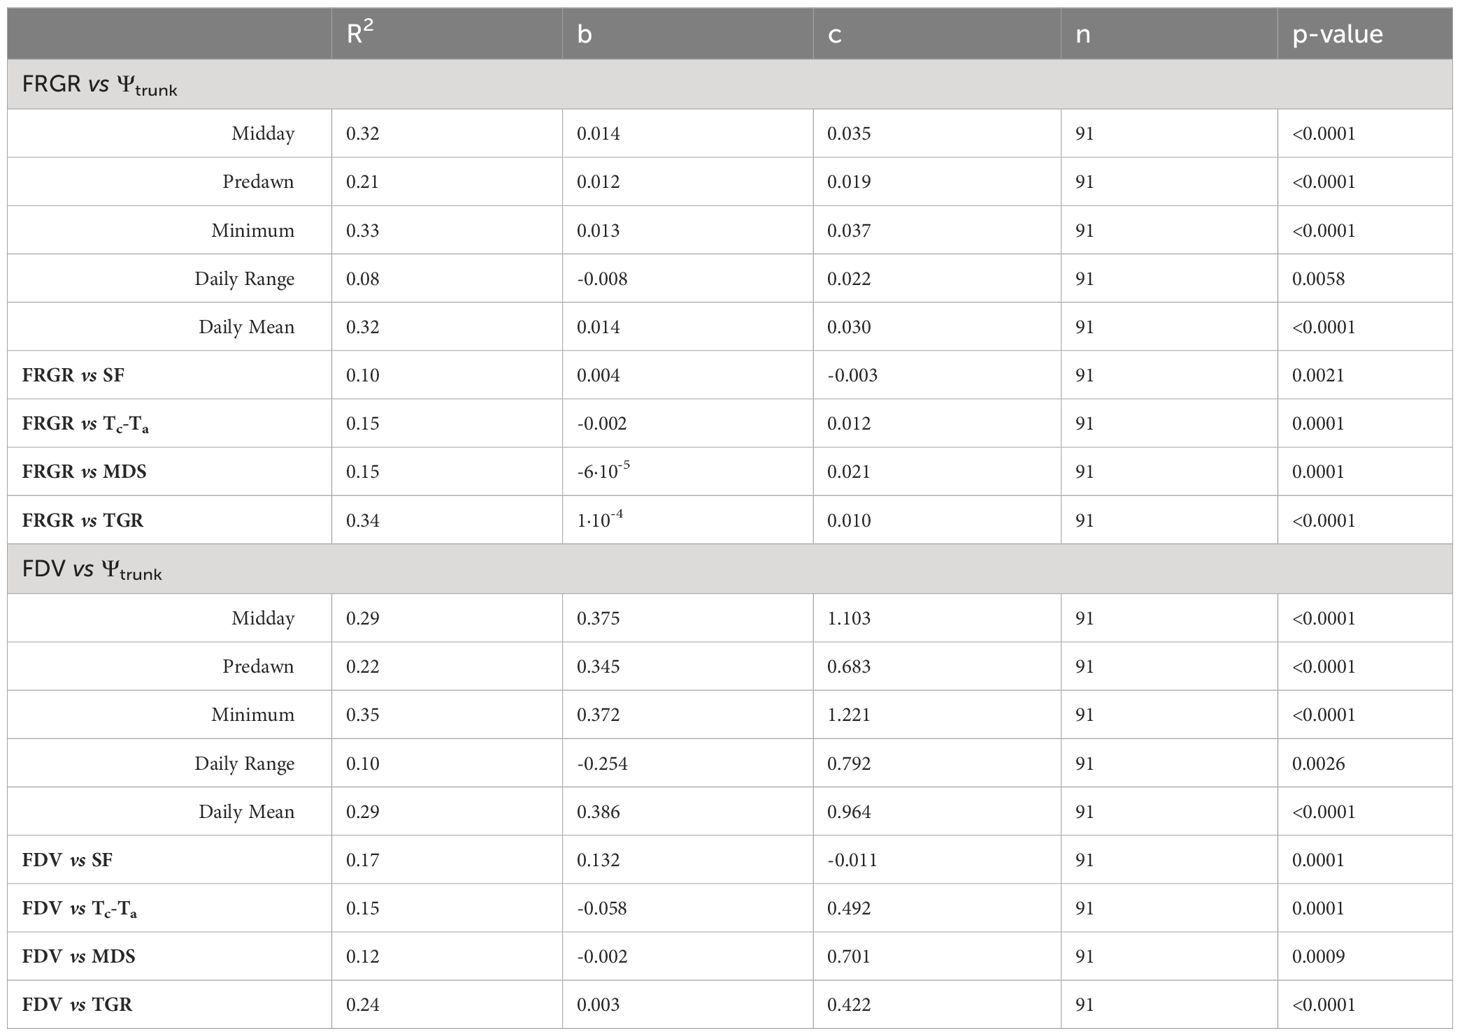
Table 2 Coefficient of determination (R2), and best fit linear equations [y = bx +c] (linear coefficient (b), and constant coefficient (c), number of data points (n) and p-value) between relative fruit growth rate (RFGR) and daily fruit diameter variation (FDV) and trunk water potential (Ψtrunk) (midday, predawn, minimum, daily mean, daily range), sap flow (SF), difference between canopy and air temperature (Tc-Ta), maximum daily trunk shrinkage (MDS) and trunk growth rate (TGR) over the experiment.
When trunk and fruit diameters were compared, there was a stronger relationship with the TGR than with the MDS, although there was a trend of lower FRGR when MDS increased. Bonany et al. (2000) described a linear relationship between MDS and FGR of young ‘Golden Delicious’ apples. However, that equation cannot be applied to our experiment because although the water potentials recorded in both experiments were similar, daily minimum values in the range between -0.7 and -2.2 MPa, MDS was larger, and RFGR were smaller. More work is needed to tune the relationship between the tree water status indicators and fruit growth during the full season and to assess for different cultivar/rootstock combinations how continuous monitoring of trunk water status can improve fruit yield and enhance fruit quality.
3.8 Sensitivity analysis
Table 3 reports the sensitivity analysis of continuous tree water status indicators that were assessed. The index with the highest SI was Tc-Ta (SI = 2.77) but the high CV decreased its sensitivity. Midday Ψtrunk and the daily range of Ψtrunk were the tree water status indicators with the highest sensitivity (S > 20) followed by the daily mean of Ψtrunk (S = 17.53). Among the indicators derived from Ψtrunk, all showed similar SI, with the highest value observed for the daily mean Ψtrunk. However, the lowest CV was observed for midday Ψtrunk which consequently increased its S. MDS had a high S, similar to the minimum Ψtrunk, while the highest CV and the lowest S were calculated for the TGR and the FRGR (S < 1). The CV values obtained for the MDS and the SF in ‘Honeycrisp’ apples were slightly lower than those reported by Wheeler et al. (2023) for the same indicators in ‘Aztec Fuji’ and ‘Escilate’, however, they followed a similar trend with the highest variability for SF, followed by the MDS and with the lowest variability for the stem water potential (0.09 – 0.11). Regarding the trunk water potential, similar results were reported by Conesa et al. (2023) who also highlighted the high sensitivity and low CV of Ψtrunk.
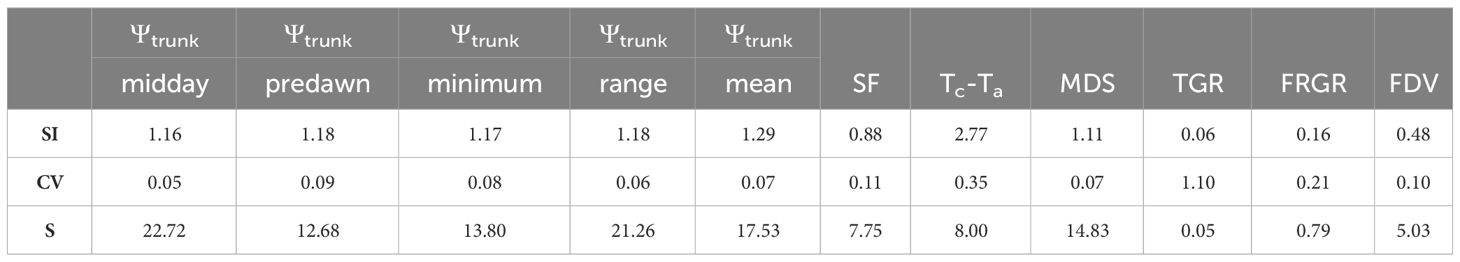
Table 3 Sensitivity analysis (Signal Intensity (SI), Coefficient of Variation (CV), and Sensitivity (S)) of trunk water potential (Ψtrunk) at midday, predawn, daily minimum, daily mean, and daily range, daily sap flow rate (SF), canopy to air temperature (Tc-Ta), maximum daily shrinkage (MDS), daily trunk growth rate (TGR), fruit relative growth rate (FRGR), and fruit diameter variations (FDV).
Therefore, the order proposed for the indicators according to their sensitivity was: midday Ψtrunk = daily range of Ψtrunk > daily mean Ψtrunk > MDS = minimum Ψtrunk > predawn Ψtrunk > Tc-Ta = SF > FDV > FRGR = TGR. Regarding the order of the indices derived from Ψtrunk based on their relationship with the widely studied, traditional, continuous indicators, the general trend followed: daily range of Ψtrunk > minimum Ψtrunk = midday Ψtrunk > daily mean Ψtrunk > predawn Ψtrunk (Figure 7). On the other hand, the daily mean Ψtrunk and the minimum value of Ψtrunk were the indicators more related to those indices derived from fruit growth.
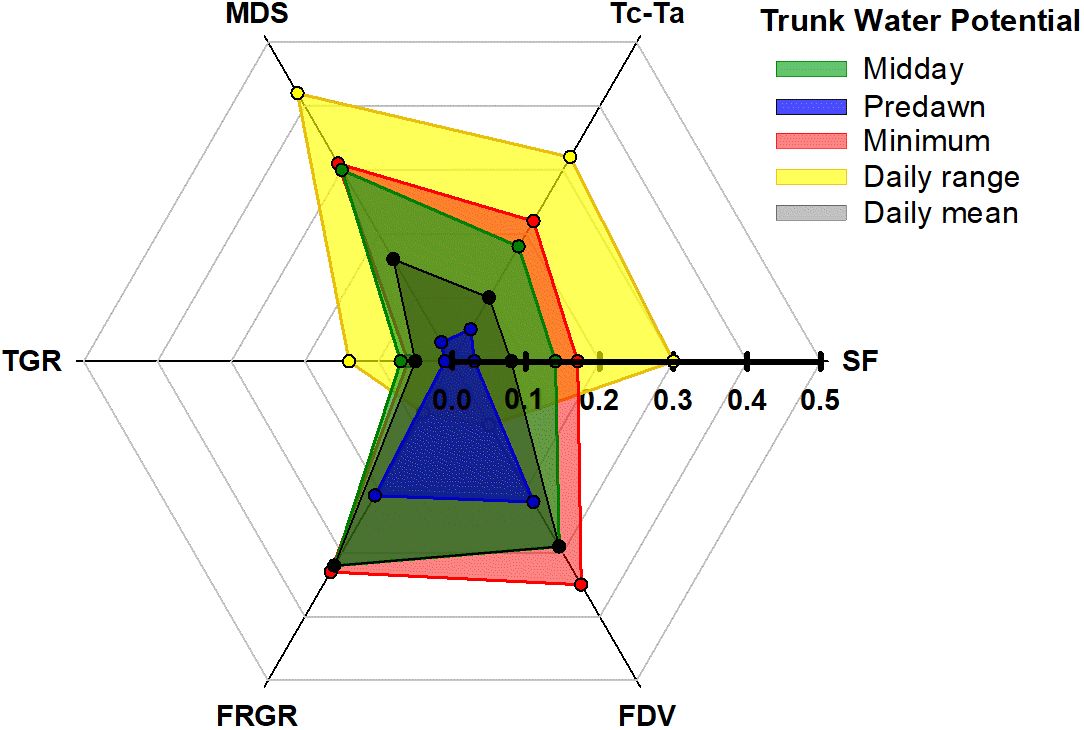
Figure 7 Coefficients of determination from the relationships between the trunk water potential indicators (midday, predawn, minimum, daily mean and daily range) and the sap flow rate (SF), the canopy to air temperature (Tc-Ta), the maximum daily shrinkage (MDS), the trunk growth rate (TGR). the fruit relative growth rate (FRGR). and the fruit diameter variations (FDV).
4 Conclusions
Ψtrunk is a reliable tree water status indicator for ‘Honeycrisp’ apple trees. Minimum Ψtrunk and the daily range of Ψtrunk were more sensitive and less variable than SF or Tc-Ta. Ψtrunk was followed closely by MDS, which also showed low variability. On the other hand, TGR, the other indicator derived from the trunk diameter fluctuations, had the highest variability and consequently, was less sensitive. Concerning the changes in fruit size TGR, minimum Ψtrunk, and the daily mean Ψtrunk were the indicators that better explained its variability, while the daily range Ψtrunk, SF, and Tc-Ta were not as related. The minimum Ψtrunk and the two new indicators derived from Ψtrunk (daily range of Ψtrunk and daily mean Ψtrunk) were able to identify the changes in tree water status and were not affected by time lags, which might affect midday Ψtrunk, so their used is preferred over it and the predawn Ψtrunk.
The close relationships found between the indicators derived from Ψtrunk and MDS, SF, and Tc-Ta, make them promising plant-based indicators for precision irrigation management and encourage researchers to continue working with Ψtrunk as a continuous indicator of tree water status. However, more work needs to be done to consider new indicators, threshold values, and cultivar-specific baselines to use Ψtrunk alone, or in combination with other tree water status indicators in an independent irrigation system.
Data availability statement
The raw data supporting the conclusions of this article will be made available by the authors, without undue reservation.
Author contributions
VB: Conceptualization, Data curation, Formal analysis, Funding acquisition, Investigation, Methodology, Project administration, Resources, Software, Supervision, Validation, Visualization, Writing – original draft, Writing – review & editing. LK: Conceptualization, Data curation, Formal analysis, Funding acquisition, Investigation, Methodology, Project administration, Resources, Software, Supervision, Validation, Visualization, Writing – original draft, Writing – review & editing.
Funding
The author(s) declare financial support was received for the research, authorship, and/or publication of this article. This research was funded by the Washington State Tree Fruit Research Committee, and the AgAID Institute. LK was partially supported by the USDA National Institute of Food and Agriculture, Hatch project 1014919. VB acknowledges the postdoctoral financial support received from the Fundación Séneca (Región de Murcia, Spain, 21261/PD/19). VB acknowledges the postdoctoral financial support received from the Fundación Séneca (Región de Murcia, Spain, 21261/PD/19).
Acknowledgments
The authors are grateful to Dynamax Inc. for providing the infrared radiometers and the sap flow sensors, the AgAID Institute, and the SMART Orchard collaborators.
Conflict of interest
The authors declare that the research was conducted in the absence of any commercial or financial relationships that could be construed as a potential conflict of interest.
Publisher’s note
All claims expressed in this article are solely those of the authors and do not necessarily represent those of their affiliated organizations, or those of the publisher, the editors and the reviewers. Any product that may be evaluated in this article, or claim that may be made by its manufacturer, is not guaranteed or endorsed by the publisher.
Abbreviations
Ψtrunk, Trunk water potential; Ψtrunk daily range, Daily range trunk water potential; Ψtrunk mean, Daily mean trunk water potential; Ψtrunk midday, Midday trunk water potential; Ψtrunk minimum, Daily minimum trunk water potential; Ψtrunk predawn, Predawn trunk water potential; FDV, Fruit diameter variations; FRGR, Fruit relative growth rate; MDS, Maximum daily shrinkage; SF, Daily sap flow rate; Tc-Ta, Canopy to air temperature; TGR, Daily trunk growth rate.
References
Alarcón, J. J., Domingo, R., Green, S. R., Sánchez-Blanco, M. J., Rodríguez, P., Torrecillas, A. (2000). Sap flow as an indicator of transpiration and the water status of young apricot trees. Plant Soil 227, 77–85. doi: 10.1023/A:1026520111166
Allen, R. G., Pereira, L., Raes, D., Smith, M. (1998). Crop evapotranspiration: guidelines for computing crop water requirements, FAO irrigation and drainage paper (Rome: Food and Agriculture Organization of the United Nations).
Améglio, T., Archer, P., Cohen, M., Valancogne, C., Daudet, F., Dayau, S., et al. (1999). Significance and limits in the use of predawn leaf water potential for tree irrigation. Plant Soil 207, 155–167. doi: 10.1023/A:1026415302759
Ballester, C., Castel, J., Testi, L., Intrigliolo, D. S., Castel, J. R. (2013). Can heat-pulse sap flow measurements be used as continuous water stress indicators of citrus trees? Irrigation Sci. 31, 1053–1063. doi: 10.1007/s00271-012-0386-5
Ben Abdelkader, A., Benyahia, F., Bastos Campos, F., Asensio, D., Andreotti, C., Tagliavini, M., et al. (2022). Apple tree transpiration during cycles of progressive drought as assessed via continuous gravimetric and xylem sap flux measurements. Italus Hortus 29, 35–46. doi: 10.26353/j.itahort/2022.2.3546
Bhusal, N., Han, S.-G., Yoon, T.-M. (2019). Impact of drought stress on photosynthetic response, leaf water potential, and stem sap flow in two cultivars of bi-leader apple trees (Malus × domestica Borkh.). Scientia Hortic. 246, 535–543. doi: 10.1016/j.scienta.2018.11.021
Blanco, V., Domingo, R., Pérez-Pastor, A., Blaya-Ros, P. J., Torres-Sánchez, R. (2018). Soil and plant water indicators for deficit irrigation management of field-grown sweet cherry trees. Agric. Water Manage. 208, 83–94. doi: 10.1016/j.agwat.2018.05.021
Blanco, V., Kalcsits, L. (2021). Microtensiometers accurately measure stem water potential in woody perennials. Plants 10, 2780. doi: 10.3390/plants10122780
Blanco, V., Kalcsits, L. (2023). Long-term validation of continuous measurements of trunk water potential and trunk diameter indicate different diurnal patterns for pear under water limitations. Agric. Water Manage. 281, 108257. doi: 10.1016/j.agwat.2023.108257
Blanco, V., Willsea, N., Campbell, T., Howe, O., Kalcsits, L. (2023). Combining thermal imaging and soil water content sensors to assess tree water status in pear trees. Front. Plant Sci. 14. doi: 10.3389/fpls.2023.1197437
Boini, A., Manfrini, L., Bortolotti, G., Corelli-Grappadelli, L., Morandi, B. (2019). Monitoring fruit daily growth indicates the onset of mild drought stress in apple. Scientia Hortic. 256, 108520. doi: 10.1016/j.scienta.2019.05.047
Bonany, J., Camps, F., Salvia, J., Cohen, M. (2000). Relationship between trunk diameter fluctuations, stem water potential and fruit growth rate in potted adult apple trees. Acta Hortic. 511, 43–50. doi: 10.17660/ActaHortic.2000.511.4
Burgess, S. S. O., Adams, M. A., Turner, N. C., Beverly, C. R., Ong, C. K., Khan, A. A. H., et al. (2001). An improved heat pulse method to measure low and reverse rates of sap flow in woody plants. Tree Physiol. 21, 589–598. doi: 10.1093/treephys/21.9.589
Calvin, L., Martin, P., Simnitt, S. (2022). Supplement to adjusting to higher labor costs in selected U.S. fresh fruit and vegetable industries: Case Studies. USDA Economic Research Service. Administrative Publication Number 103. Production volume and grower price received by Washington apple variety 2018/2019. AP-103, 4.
Cheng, L., Sazo, M. M. (2018). Why is ‘Honeycrisp’ so susceptible to bitter pit? Fruit Q. 26, 19–23.
Cohen, S., Naor, A. (2002). The effect of three rootstocks on water use, canopy conductance and hydraulic parameters of apple trees and predicting canopy from hydraulic conductance. Plant Cell Environ. 25, 17–28. doi: 10.1046/j.1365-3040.2002.00795.x
Conejero, W., Alarcon, J. J., Garcia-Orellana, Y., Nicolas, E., Torrecillas, A. (2007). Evaluation of sap flow and trunk diameter sensors for irrigation scheduling in early maturing peach trees. Tree Physiol. 27, 1753–1759. doi: 10.1093/treephys/27.12.1753
Conesa, M. R., Conejero, W., Vera, J., Ruiz-Sánchez, M. C. (2023). Assessment of trunk microtensiometer as a novel biosensor to continuously monitor plant water status in nectarine trees. Front. Plant Sci. 14. doi: 10.3389/fpls.2023.1123045
De Swaef, T., Steppe, K., Lemeur, R. (2009). Determining reference values for stem water potential and maximum daily trunk shrinkage in young apple trees based on plant responses to water deficit. Agric. Water Manage. 96, 541–550. doi: 10.1016/j.agwat.2008.09.013
Doltra, J., Oncins, J. A., Bonany, J., Cohen, M. (2007). Evaluation of plant-based water status indicators in mature apple trees under field conditions. Irrigation Sci. 25, 351–359. doi: 10.1007/s00271-006-0051-y
Du, S., Tong, L., Zhang, X., Kang, S., Du, T., Li, S., et al. (2017). Signal intensity based on maximum daily stem shrinkage can reflect the water status of apple trees under alternate partial root-zone irrigation. Agric. Water Manage. 190, 21–30. doi: 10.1016/j.agwat.2017.05.004
FAOSTAT. (2022). Available online at: https://www.fao.org/faostat/en/#data/QCL.
Fereres, E., Goldhamer, D., Cohen, M., Girona, J., Mata, M. (1999). Continuous trunk diameter recording can reveal water stress in peach trees. Cal Ag 53, 21–25. doi: 10.3733/ca.v053n04p21
Fernandes, R. D. M., Cuevas, M. V., Diaz-Espejo, A., Hernandez-Santana, V. (2018). Effects of water stress on fruit growth and water relations between fruits and leaves in a hedgerow olive orchard. Agric. Water Manage. 210, 32–40. doi: 10.1016/j.agwat.2018.07.028
Fernandez, J. (2017). Plant-based methods for irrigation scheduling of woody crops. Horticulturae 3, 35. doi: 10.3390/horticulturae3020035
Fernandez, J. E., Cuevas, M. V. (2010). Irrigation scheduling from stem diameter variations: A review. Agric. For. Meteorology 150, 135–151. doi: 10.1016/j.agrformet.2009.11.006
Fernandez, J. E., Green, S. R., Caspari, H. W., Diaz-Espejo, A., Cuevas, M. V. (2008). The use of sap flow measurements for scheduling irrigation in olive, apple and Asian pear trees and in grapevines. Plant Soil 305, 91–104. doi: 10.1007/s11104-007-9348-8
Garcia-Tejera, O., Lopez-Bernal, A., Orgaz, F., Testi, L., Villalobos, F. J. (2021). The pitfalls of water potential for irrigation scheduling. Agric. Water Manage. 243, 106522. doi: 10.1016/j.agwat.2020.106522
Goldhamer, D. A., Fereres, E. (2001). Irrigation scheduling protocols using continuously recorded trunk diameter measurements. Irrigation Sci. 20, 115–125. doi: 10.1007/s002710000034
Goldhamer, D. A., Fereres, E., Mata, M., Girona, J., Cohen, M. (1999). Sensitivity of continuous and discrete plant and soil water status monitoring in peach trees subjected to deficit irrigation. J. Am. Soc. Hortic. Sci. 124, 437–444. doi: 10.21273/JASHS.124.4.437
Gómez-Candón, D., Mathieu, V., Martinez, S., Labbé, S., Delalande, M., Regnard, J.-L. (2022). Unravelling the responses of different apple varieties to water constraints by continuous field thermal monitoring. Scientia Hortic. 299, 111013. doi: 10.1016/j.scienta.2022.111013
Gonzalez, L., Àvila, G., Carbó, J., Bonany, J., Alegre, S., Torres, E., et al. (2020). Hail nets do not affect the efficacy of metamitron for chemical thinning of apple trees. J. Hortic. Sci. Biotechnol. 95, 128–135. doi: 10.1080/14620316.2019.1631128
Gonzalez, L., Torres, E., Àvila, G., Carbó, J., Bonany, J., Alegre, S., et al. (2023). Effect of thinning with metamitron, NAA, BA and naphthenic acids on apple (Malus domestica) trees. Plant Growth Regul. 1, 39–50. doi: 10.1007/s10725-023-00976-4
Gonzalez-Dugo, V., Zarco-Tejada, P., Berni, J. A. J., Suárez, L., Goldhamer, D., Fereres, E. (2012). Almond tree canopy temperature reveals intra-crown variability that is water stress-dependent. Agric. For. Meteorology 154–155, 156–165. doi: 10.1016/j.agrformet.2011.11.004
Gonzalez-Dugo, V., Zarco-Tejada, P. J., Fereres, E. (2014). Applicability and limitations of using the crop water stress index as an indicator of water deficits in citrus orchards. Agric. For. Meteorology 198–199, 94–104. doi: 10.1016/j.agrformet.2014.08.003
Gonzalez-Dugo, V., Zarco-Tejada, P., Nicolás, E., Nortes, P., Alarcón, J. J., Intrigliolo, D., et al. (2013). Using high resolution UAV thermal imagery to assess the variability in the water status of five fruit tree species within a commercial orchard. Precis. Agric. 14, 660–678. doi: 10.1007/s11119-013-9322-9
Gonzalez Nieto, L., Huber, A., Gao, R., Biasuz, E. C., Cheng, L., Stroock, A. D., et al. (2023a). Trunk water potential measured with microtensiometers for managing water stress in “Gala”. Apple Trees Plants 12, 1912. doi: 10.3390/plants12091912
Gonzalez Nieto, L., Reig, G., Lordan, J., Miranda Sazo, M., Hoying, S. A., Fargione, M. J., et al. (2023b). Long-term effects of rootstock and tree type on the economic profitability of ‘Gala’, ‘Fuji’ and ‘Honeycrisp’ orchards performance. Scientia Hortic. 318, 112129. doi: 10.1016/j.scienta.2023.112129
Green, S., McNaughton, K., Wünsche, J. N., Clothier, B. (2003). Modeling light interception and transpiration of apple tree canopies. Agron. J. 95, 1380–1387. doi: 10.2134/agronj2003.1380
Idso, S. B., Jackson, R. D., Pinter, P. J., Reginato, R. J., Hatfield, J. L. (1981). Normalizing the stress-degree-day parameter for environmental variability. Agric. Meteorology 24, 45–55. doi: 10.1016/0002-1571(81)90032-7
Intrigliolo, D. S., Castel, J. R. (2007). Evaluation of grapevine water status from trunk diameter variations. Irrigation Sci. 26, 49–59. doi: 10.1007/s00271-007-0071-2
Jones, H. G. (2004). Irrigation scheduling: advantages and pitfalls of plant-based methods. J. Exp. Bot. 55, 2427–2436. doi: 10.1093/jxb/erh213
Kalcsits, L., Mattheis, J., Giordani, L., Reid, M., Mullin, K. (2019). Fruit canopy positioning affects fruit calcium and potassium concentrations, disorder incidence, and fruit quality for ‘Honeycrisp’ apple. Can. J. Plant Sci. 99, 761–771. doi: 10.1139/cjps-2019-0017
Kalcsits, L., van der Heijden, G., Reid, M., Mullin, K. (2017). Calcium absorption during fruit development in ‘Honeycrisp’ Apple measured using 44Ca as a stable isotope tracer. HortScience. 52, 1804–1809. doi: 10.21273/HORTSCI12408-17
Kumar, R., Hosseinzadehtaher, M., Hein, N., Shadmand, M., Jagadish, S. V. K., Ghanbarian, B. (2022). Challenges and advances in measuring sap flow in agriculture and agroforestry: A review with focus on nuclear magnetic resonance. Front. Plant Sci. 13. doi: 10.3389/fpls.2022.1036078
Lakso, A. N. (1994). “Apple, in: environmental physiology of fruit crops,” in Temperate crops. Eds. B., S., P.C., A. (CRC Press, Boca Raton, FL), 3–42.
Lakso, A. N., Santiago, M., Stroock, A. D. (2022). Monitoring stem water potential with an embedded microtensiometer to inform irrigation scheduling in fruit crops. Horticulturae 8, 1207. doi: 10.3390/horticulturae8121207
Li, F., Cohen, S., Naor, A., Shaozong, K., Erez, A. (2002). Studies of canopy structure and water use of apple trees on three rootstocks. Agric. Water Manage. 55, 1–14. doi: 10.1016/S0378-3774(01)00184-6
Liu, C., Du, T., Li, F., Kang, S., Li, S., Tong, L. (2012). Trunk sap flow characteristics during two growth stages of apple tree and its relationships with affecting factors in an arid region of northwest China. Agric. Water Manage. 104, 193–202. doi: 10.1016/j.agwat.2011.12.014
Liu, C., Kang, S., Li, F., Li, S., Du, T., Tong, L. (2011). Relationship between environmental factor and maximum daily stem shrinkage in apple tree in arid region of northwest China. Scientia Hortic. 130, 118–125. doi: 10.1016/j.scienta.2011.06.022
Livellara, N., Saavedra, F., Salgado, E. (2011). Plant based indicators for irrigation scheduling in young cherry trees. Agric. Water Manage. 98, 684–690. doi: 10.1016/j.agwat.2010.11.005
Lordan, J., Fazio, G., Francescatto, P., Robinson, T. L. (2019). II. Horticultural performance of ‘Honeycrisp’ grown on a genetically diverse set of rootstocks under Western New York climatic conditions. Scientia Hortic. 257, 108686. doi: 10.1016/j.scienta.2019.108686
McCutchan, H., Shackel, K. A. (1992). Stem-water potential as a sensitive indicator of water stress in prune trees (Prunus domestica L. cv. French). J. Am. Soc. Hortic. Sci. 117, 607–611. doi: 10.21273/JASHS.117.4.607
Mira-Garcia, A. B., Conejero, W., Vera, J., Ruiz-Sánchez, M. C. (2022). Water status and thermal response of lime trees to irrigation and shade screen. Agric. Water Manage. 272, 107843. doi: 10.1016/j.agwat.2022.107843
Morandi, B., Boselli, F., Boini, A., Manfrini, L., Corelli, L. (2017). The fruit as a potential indicator of plant water status in apple. Acta Hortic. 1150, 83–90. doi: 10.17660/ActaHortic.2017.1150.12
Naor, A. (2000). Midday stem water potential as a plant water stress indicator for irrigation scheduling in fruit trees. Acta Hortic. 537, 447–454. doi: 10.17660/ActaHortic.2000.537.52
Naor, A., Cohen, S. (2003). Sensitivity and variability of maximum trunk shrinkage, midday stem water potential, and transpiration rate in response to withholding irrigation from field-grown apple trees. HortScience 38, 547–551. doi: 10.21273/HORTSCI.38.4.547
Naor, A., Klein, I., Doron, I. (1995). Stem water potential and apple size. J. Am. Soc. Hortic. Sci. 120, 577–582. doi: 10.21273/JASHS.120.4.577
Noun, G., Lo Cascio, M., Spano, D., Marras, S., Sirca, C. (2022). Plant-based methodologies and approaches for estimating plant water status of mediterranean tree species: A semi-systematic review. Agronomy 12, 2127. doi: 10.3390/agronomy12092127
Ortuño, M. F., Conejero, W., Moreno, F., Moriana, A., Intrigliolo, D. S., Biel, C., et al. (2010). Could trunk diameter sensors be used in woody crops for irrigation scheduling? A review of current knowledge and future perspectives. Agric. Water Manage. 97, 1–11. doi: 10.1016/j.agwat.2009.09.008
Ortuño, M. F., García-Orellana, Y., Conejero, W., Ruiz-Sánchez, M. C., Alarcón, J. J., Torrecillas, A. (2006). Stem and leaf water potentials, gas exchange, sap flow, and trunk diameter fluctuations for detecting water stress in lemon trees. Trees 20, 1–8. doi: 10.1007/s00468-005-0004-8
Osroosh, Y., Troy Peters, R., Campbell, C. S., Zhang, Q. (2015). Automatic irrigation scheduling of apple trees using theoretical crop water stress index with an innovative dynamic threshold. Comput. Electron. Agric. 118, 193–203. doi: 10.1016/j.compag.2015.09.006
Pagay, V. (2022). Evaluating a novel microtensiometer for continuous trunk water potential measurements in field-grown irrigated grapevines. Irrigation Sci. 40, 45–54. doi: 10.1007/s00271-021-00758-8
Pagay, V., Santiago, M., Sessoms, D. A., Huber, E. J., Vincent, O., Pharkya, A., et al. (2014). A microtensiometer capable of measuring water potentials below –10 MPa. Lab. Chip 14, 2806–2817. doi: 10.1039/C4LC00342J
Patakas, A., Noitsakis, B., Chouzouri, A. (2005). Optimization of irrigation water use in grapevines using the relationship between transpiration and plant water status. Agriculture Ecosyst. Environ. 106, 253–259. doi: 10.1016/j.agee.2004.10.013
Ramirez-Cuesta, J. M., Ortuño, M. F., Gonzalez-Dugo, V., Zarco-Tejada, P. J., Parra, M., Rubio-Asensio, J. S., et al. (2022). Assessment of peach trees water status and leaf gas exchange using on-the-ground versus airborne-based thermal imagery. Agric. Water Manage. 267, 107628. doi: 10.1016/j.agwat.2022.107628
Reid, M., Kalcsits, L. (2020). Water deficit timing affects physiological drought response, fruit size, and bitter pit development for ‘Honeycrisp’ Apple. Plants 9, 874. doi: 10.3390/plants9070874
Ripoll, J., Urban, L., Staudt, M., Lopez-Lauri, F., Bidel, L. P. R., Bertin, N. (2014). Water shortage and quality of fleshy fruits—making the most of the unavoidable. J. Exp. Bot. 65, 4097–4117. doi: 10.1093/jxb/eru197
Robinson, T., Lakso, A., Dominguez, L. (2013). Precision irrigation management. New York Fruit Q. 21, 2, 17–20.
Robinson, T., Lopez, S. (2012). Crop load affects “Honeycrisp” fruit quality more than nitrogen, potassium, or irrigation. Acta Hortic. 940, 529–537. doi: 10.17660/ActaHortic.2012.940.76
Sallato, B. (2023). Reliable soil diagnosis technology for smart nutrient management. Final project report. Washington Tree Fruit Research Commission, 5–13.
Scalisi, A., O’Connell, M. G., Stefanelli, D., Lo Bianco, R. (2019). Fruit and leaf sensing for continuous detection of nectarine water status. Front. Plant Sci. 10. doi: 10.3389/fpls.2019.00805
Serra, S., Leisso, R., Giordani, L., Kalcsits, L., Musacchi, S. (2016). Crop load influences fruit quality, nutritional balance, and return bloom in ‘Honeycrisp’ Apple. HortScience 51, 236–244. doi: 10.21273/HORTSCI.51.3.236
Shackel, K. (2011). A plant-based approach to deficit irrigation in trees and vines. HortScience 46, 173–177. doi: 10.21273/HORTSCI.46.2.173
Shackel, K., Moriana, A., Marino, G., Corell, M., Pérez-López, D., Martin-Palomo, M. J., et al. (2021). Establishing a reference baseline for midday stem water potential in olive and its use for plant-based irrigation management. Front. Plant Sci. 12. doi: 10.3389/fpls.2021.791711
Steppe, K., Vandegehuchte, M. W., Tognetti, R., Mencuccini, M. (2015). Sap flow as a key trait in the understanding of plant hydraulic functioning. Tree Physiol. 35, 341–345. doi: 10.1093/treephys/tpv033
Tőkei, L., Dunkel, Z. (2005). Investigation of crop canopy temperature in apple orchard. Phys. Chem. Earth Parts A/B/C 30, 249–253. doi: 10.1016/j.pce.2004.08.038
USDA. (2022). NASS report. Northwest apple production, national agricultural statistics service. Press release - august 12, 2022. (Washington, DC). United States Department of Agriculture; Olympia, WA: Northwest Regional Field Office).
Valverdi, N. A., Cheng, L., Kalcsits, L. (2019). Apple scion and rootstock contribute to nutrient uptake and partitioning under different belowground environments. Agronomy 9, 415. doi: 10.3390/agronomy9080415
Valverdi, N. A., Kalcsits, L. (2021). Rootstock affects scion nutrition and fruit quality during establishment and early production of ‘Honeycrisp’ Apple. HortScience 56, 261–269. doi: 10.21273/HORTSCI15488-20
Keywords: continuous measurements, fruit growth, plant-based sensors, precision irrigation, tree water status indicators, water potential
Citation: Blanco V and Kalcsits L (2024) Relating microtensiometer-based trunk water potential with sap flow, canopy temperature, and trunk and fruit diameter variations for irrigated ‘Honeycrisp’ apple. Front. Plant Sci. 15:1393028. doi: 10.3389/fpls.2024.1393028
Received: 28 February 2024; Accepted: 07 May 2024;
Published: 24 May 2024.
Edited by:
Guo Zhao, Nanjing Agricultural University, ChinaReviewed by:
Riccardo Lo Bianco, University of Palermo, ItalyGiulio Demetrio Perulli, University of Bologna, Italy
Alexandra Boini, University of Bologna, Italy
George Nanos, University of Thessaly, Greece
Bartolomeo Dichio, University of Basilicata, Italy
Alejandro Pérez Pastor, Polytechnic University of Cartagena, Spain
Lloyd Nackley, Oregon State University, United States
Copyright © 2024 Blanco and Kalcsits. This is an open-access article distributed under the terms of the Creative Commons Attribution License (CC BY). The use, distribution or reproduction in other forums is permitted, provided the original author(s) and the copyright owner(s) are credited and that the original publication in this journal is cited, in accordance with accepted academic practice. No use, distribution or reproduction is permitted which does not comply with these terms.
*Correspondence: Victor Blanco, victor.blanco@irta.cat