 Youzhong Li
 Jincheng Zhu1,3†
- 1College of Agriculture, Shihezi University, Shihezi, Xinjiang, China
- 2Cotton Research Institute, Xinjiang Academy of Agricultural and Reclamation Science/Xinjiang Production and Construction Group Key Laboratory of Crop Germplasm Enhancement and Gene Resources Utilization, Shihezi, Xinjiang, China
- 3Xinjiang Production and Construction Group Key Laboratory of Crop Germplasm Enhancement and Gene Resources Utilization, Biotechnology Research Institute, Xinjiang Academy of Agricultural and Reclamation Sciences, Shihezi, Xinjiang, China
- 4Western Research Institute, Chinese Academy of Agricultural Sciences (CAAS), Changji, China
Low temperature and cold damage seriously hinder the growth, development, and morphogenesis of cotton seedlings. However, the response mechanism of cotton seedlings under cold stress still lacks research. In this study, transcriptome sequencing, gas exchange parameters, and rapid chlorophyll fluorescence parameters were analyzed in leaves of cold-tolerant upland cotton variety “ZM36” under different temperature stress [25°C (T25, CK), 15°C (T15), 10°C (T10), and 4°C (T4)]. The results showed that the net photosynthetic rate (Pn), stomatal conductance (Gs), transpiration rate (Tr), PSII potential maximum photochemical efficiency (Fv/Fm), and performance index (PIabs) of cotton leaves significantly decreased, and the intercellular CO2 concentration (Ci) and Fo/Fm significantly increased under cold stress. The transcriptome sequencing analysis showed that a total of 13,183 DEGs were involved in the response of cotton seedlings at each temperature point (T25, T15, T10, and T4), mainly involving five metabolic pathways—the phosphatidylinositol signaling system, photosynthesis, photosynthesis antenna protein, carbon fixation in photosynthetic organisms, and carotenoid synthesis. The 1,119 transcription factors were discovered among all the DEGs. These transcription factors involve 59 families, of which 15.8% of genes in the NAC family are upregulated. Through network regulatory analysis, the five candidate genes GhUVR8 (GH_A05G3668), GhPLATZ (GH_A09G2161), GhFAD4-1 (GH_A01G0758), GhNFYA1 (GH_A02G1336), and GhFAD4-2 (GH_D01G0766) were identified in response to cold stress. Furthermore, suppressing the expression level of GhPLATZ by virus-induced gene silencing led to the reduction of low temperature resistance, implying GhPLATZ as a positive regulator of low temperature tolerance. The findings of the study revealed a piece of the complex response mechanism of the cold-tolerant variety “ZM36” to different cold stresses and excavated key candidate genes for low temperature response, which provided support for accelerating the selection and breeding of cotton varieties with low temperature tolerance.
1 Introduction
Cotton (Gossypium hirsutum L.) is sensitive to temperature during its growth and development (Shan et al., 2007). Xinjiang is the main cotton-producing region in China. In the past 40 years, the frequency of cotton cultivation in Xinjiang has been 30% under cold stress. The frequency of “late spring cold” weather especially is very high, which leads to hindered growth, decreased uniformity, and delayed growth and development of cotton seedlings, greatly affecting the yield and quality of cotton (Rihan et al., 2017; Li et al., 2020a). Therefore, in-depth analysis of the response mechanism of cotton seedlings to low temperature cold damage is of great significance to improve their cold tolerance.
The adaptation mechanism of plants to cold stress involves complex and intricate physiological and molecular regulatory networks (Raju et al., 2018; Kidokoro et al., 2022). On the physiological level, it manifests as decreased enzyme activity, damage to the membrane system, decreased photosynthetic efficiency, and cell dehydration. At the molecular level, the most extensively studied pathway is the DREB/CBF low temperature stress regulation pathway (Chinnusamy et al., 2007), which can bind to the A/GCCGAC dehydration response element (DRE) in the low temperature response gene (COR) promoter, thereby activating the expression of the COR gene. The COR gene encodes a developmental stress protein (LEA), which can enhance plant tolerance to low temperature, dehydration, or abscisic acid stress (Yamaguchi-Shinozaki and Shinozaki, 1994; Stockinger et al., 1997). Simultaneously, some transcription factor family members also play key roles in cold stress, such as AP2/ERF, NAC, bHLH, MYB, WRKY, etc. They can also regulate plant tolerance to low temperature by binding to the promoters of related genes (Sun et al., 2018; Xie et al., 2018; Diao et al., 2020; Li et al., 2020b; Ritonga et al., 2021). In addition, hydrogen peroxide (H2O2), superoxide anion (O2-), and hydroxyl radicals (OH-) in the reactive oxygen species (ROS) signal can activate the MAPK cascade, transcription factors, and redox reactive proteins, thereby participating in plant responses to cold stress (Davletova et al., 2005; Colcombet and Hirt, 2008; Xu et al., 2019). Although the molecular mechanism of cold stress in other plants has been preliminarily analyzed, the molecular genetics analysis of cotton’s low temperature tolerance lags far behind model plants such as Arabidopsis and rice. GhNHL69 is co-expressed with various transcription factors related to cold stress, leading to the GhNHL69-silenced plants having more severe dehydration and damage. GhNHL69 may be related to the expression of abiotic stress-related genes, thereby altering cotton’s cold tolerance (Guo et al., 2023). Overexpression of GhKCS13 can alter sphingolipids and glycerides of leaves and the fluidity of cell membrane JA synthesis in chloroplasts, thereby creasing the sensitivity of cotton plants to cold stress (Wang et al., 2020a). After GhCBF4 and GhZAT10 were silenced by virus-induced gene silencing (VIGS), the silent plants exhibit significant low temperature sensitivity (Li et al., 2023a).
At present, based on a single temperature stress, researchers have discovered some genes and pathways related to cold stress in cotton (Cheng et al., 2020; Kaur Dhaliwal et al., 2021; Wang et al., 2021). However, the mechanism by which cotton perceives and transmits low temperature signals, thereby activating transcription factors and responding to low temperature, is still unclear. There is limited understanding of the functions of key genes that can respond to different cold stresses. The analysis of cotton under cold stress based on RNA seq research methods can help to explore cold resistance genes, elucidate the regulatory mechanisms of low temperature response, study cold resistance mechanisms, and select cold-resistant varieties (Wang et al., 2009; Wang et al., 2020b). Our research group has found that Zhongmian 36 (ZM36) is a cold-tolerant variety (Ma, 2023). Therefore, this study analyzed the changes in the photosynthetic physiological indicators of ZM36 and explored the regulatory pathways and key genes involved in different responses to cold stress by transcriptome sequencing technology (RNA seq). It can provide a more comprehensive understanding of the molecular mechanisms underlying cotton’s response to cold stress.
2 Materials and methods
2.1 Plant materials and experimental design
ZM36 is provided by the Cotton Molecular Breeding Laboratory of Shihezi University. Cotton seedlings are cultured in an artificial climate box. These are cotton seeds that have undergone germination in a nutrient bowl. The substrate is peat and vermiculite, with a ratio of 3:1. The plants were cultivated under 24/22°C (day/night) and a photoperiod scheme of 16/8 h of light/darkness. Seedlings at the two-leaf stage were processed at low temperature in an incubator with adjustable temperature settings.
The processing method is as follows: cotton seedlings with consistent growth are grown for 24 h at 25°C (T25, control), 15°C (T15), 10°C (T10), and 4°C (T4), then sampled, frozen, and stored at -80°C. The experiment setup had three replicates, with five identical cotton seedlings as one replicate, and each treatment setup had three biological replicates.
2.2 Photosynthetic performance index and fluorescence parameters
Portable photosynthetic instrument LI-6400XT (LI-COR, USA) is used to measure the photosynthetic performance parameters, with the instrument’s built-in red and blue light source selected and the light intensity set to 1,000 μ Mol m-2 s-1. HandyPEA-100 (UK) was used to measure the fluorescence parameters, and these were measured at the same leaf position of seedlings with similar growth. The conductivity meter method was used to measure the relative conductivity, and the acidic ninhydrin colorimetric method was employed to measure the proline content.
2.3 RNA library construction and sequencing
RNA Purification Kit (Tiangen, Beijing) was used to isolate RNA from the leaves of 12 samples (ZM36) according to the manufacturer’s instructions. The RNA isolated from each sample was then used to construct RNA-seq libraries using NEBNext Ultra RNA Library Prep Kit. RNA-seq was conducted on an Illumina Hiseq 4000 platform with 150-bp paired-end reads (Novogene, Tianjin, China).
2.4 Quantitative RT-PCR analysis
qRT-PCR was carried out by using SYBR Green (Roche, Rotkreuz, Switzerland) on Light Cycler 480II (Roche) with default parameters. All primers used for the validation experiments were designed with Primer5 software and are shown in Supplementary Table S1. The GhUBQ7 (DQ116441.1) gene served as an internal control to normalize differences between samples. The qRT-PCR conditions were as follows: initial denaturation at 96°C for 5 min, denaturation at 96°C for 15 s for a total of 41 cycles, annealing at 62°C for 16 s, and extension at 70°C for 18 s. The relative expression levels of genes from three biologically independent experiments were calculated using the 2-ΔΔCTmethod (Livak and Schmittgen, 2001).
2.5 Identification and functional annotation of DEGs
Clean reads were mapped to the reference genome of G. hirsutum (Hu et al., 2019) using TopHat (v2.0.12). The level of gene expression was measured by fragments per kilobase of exon model per million mapped fragments (FPKM) (Trapnell et al., 2010). DESeq2 (v1.18.0) (Wang et al., 2010) was used to identify differentially expressed genes (DEGs) with the criteria of an adjusted log2 (fold change) ≥3. The STEM software was used to classify the gene expression patterns at various points into differential clusters. Using the cluster Profiler package (version 3.18.1), DEG enrichment analysis was conducted using Gene Ontology (GO) and Kyoto Encyclopedia of Genes and Genomes (KEGG).
2.6 Construction of DEG PPI protein interaction network
We used Blast (blast x) for the sequences of DEGs with the genomes of related species to obtain the predicted PPI for these DEGs (the protein interactions exist in the STRING database: http://string-db.org/. Then, the PPI of these DEGs was visualized using Cytoscape (Shannon et al., 2003).
2.7 Virus-induced gene silencing
Tobacco rattle virus (TRV) vectors, pTRV1 and pTRV2, were used in the VIGS experiments, and TRV:: GhCHLI was used as a positive control as previously reported (Li et al., 2023b). A 300-bp fragment specific to GhPLATZ (GH_A09G2161) was amplified by PCR from low-resistance ZM36 with gene-specific primers (Supplementary Table S2). VIGS was performed with the same procedures as previously described (Gao et al., 2013). Approximately 12 days after infiltration, the leaves of five TRV::00 and TRV:: GhPLATZ plants were collected to analyze the expression level of GhPLATZ by qRT-PCR. A total of 60 TRV::00 and TRV:: GhPLATZ plants at the two-leaf-stage were subjected to low temperature treatment to compare their phenotypic response.
3 Results
3.1 Photosynthetic physiology of ZM36 under cold stress
ZM36 was tested for Pn, Gs, Ci, Tr, Fv/Fm, Piabs, Fv/Fo, and Fo/Fm in four different temperature points (T25, T15, T10, and T4) (Figure 1A). Pn, Gs, Tr, Fv/Fm, Fv/Fo, and Piabs significantly decreased, but Ci and Fo/Fm significantly increased under cold stress. The highest value of Pn is 12.75 at T25, the minimum is 1.18 at T4, reduced by 10.8 times; Gs decreased by 26.28 times from T25 (0.3278) to T4 (0.0124); Tr decreased by 20.75 times from T25 (4.9022) to T4 (0.2362); Fv/Fm was 0.7951 and 0.311 at T25 and at T4, respectively, reduced by 2.56 times; and Piabs decreased by 37.81 times from T25 (4.2996) to T4 (0.1137). However, Ci increased by 1.64 times from T25 to T4, and Fo/Fm also increased by 3.25 times from T25 (0.2049) to T4 (0.6659) (Figure 1B; Supplementary Table S2). This fully demonstrates that low temperature can have a significant impact on cotton growth, photosynthesis, and yield of cotton, thereby affecting its yield and quality.
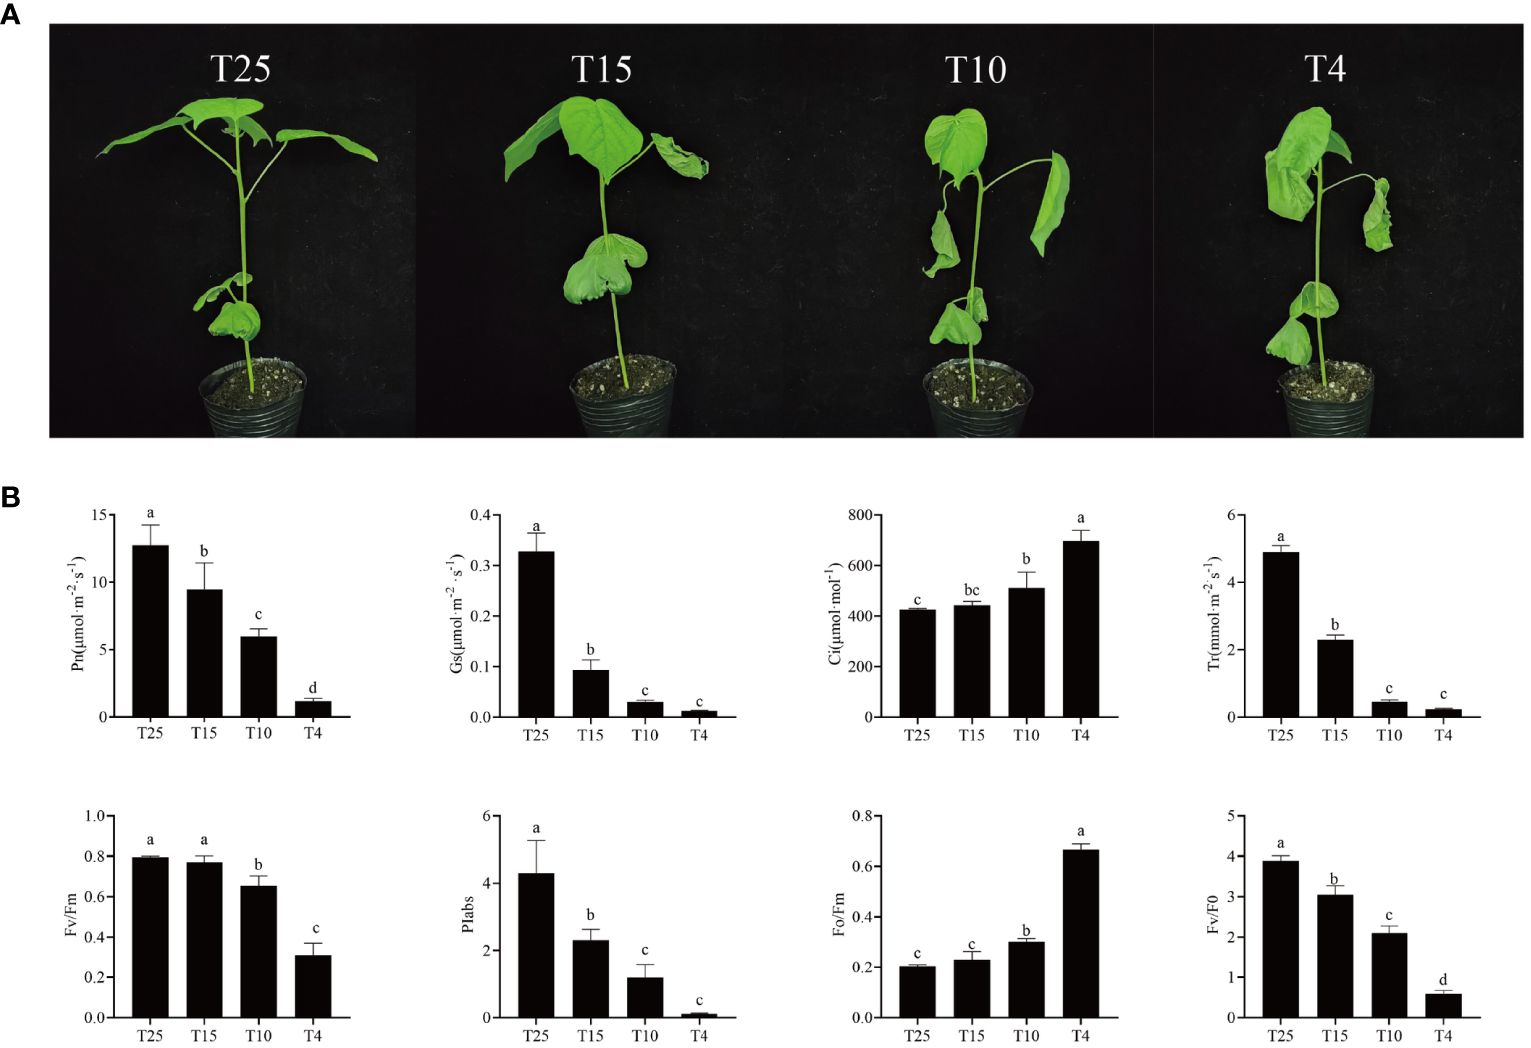
Figure 1 Phenotype and photosynthetic level of ZM36. (A) Phenotype of ZM36 in four temperature points (T25, T15, T10, and T4). (B) Photosynthetic gas exchange parameters and rapid chlorophyll fluorescence parameters of ZM36 in four temperature points (T25, T15, T10, and T4). Data are the mean ± standard error of three independent biological replicates. Different lowercase letters (a, b, c) indicate a significant difference (P < 0.05) between groups determined using Student’s t-test.
3.2 Identification of DEGs in response to cold stress
The number of raw reads of the samples was between 40,476,800 and 49,397,772, and the number of clean reads after filtering was 20,238,400–24,698,886 (Supplementary Table S3). The GC percentage of each sample was between 43.46% and 44.34%, while Q30 was between 90.16% and 95.04% (Supplementary Table S3). Pearson correlation coefficient was used to perform a correlation test on the samples, and the correlation between the three replicates was greater than 0.9, indicating the reliability of the data (Supplementary Figure S1A). Principal component analysis (PCA) was used to test the similarity between samples. The first principal component (PC1) accounted for 43%, while the second principal component (PC2) accounted for 26.3% (Supplementary Figure S1B). The volatility of log10FPKM is similar across all samples (Supplementary Figure S1C), indicating that the sequencing quality was high and suitable for subsequent analysis. Using fold change ≥3 and FDR <0.05 as the threshold, 6,096 DEGs (2,430 upregulated and 3,666 downregulated), 8,545 DEGs (4,473 upregulated and 4,072 downregulated), and 3,322 DEGs (1,659 upregulated and 1,663 downregulated) were screened in T15 vs. T25, T10 vs. T25, and T4 vs. T25, respectively, indicating that gene expression levels in cotton varied after different low temperature treatments (Figures 2A, C). Using Wayne analysis, a total of 13,183 DEGs were found, of which 2,365 DEGs were specifically responsive to 15°C, 4,600 DEGs were specifically responsive to 10°C, and 1,972 DEGs were specifically responsive to 4°C (Figure 2B). The DEGs were divided into eight significant clusters by K-means clustering analysis (Figure 2D). The genes of clusters 1, 2, and 3 showed a trend of rising first and then remaining unchanged or decreasing slightly in response to low temperature stress. However, the genes of clusters 5, 6 and 7 had an expression trend opposite to that of clusters 1, 2, and 3. The genes of cluster 4 showed a decreasing trend, and cluster 8 had an expression trend opposite to that of cluster 4 (Figure 2D). The DEGs of these clusters would be expected to be linked to the low temperature resistance of ZM36.
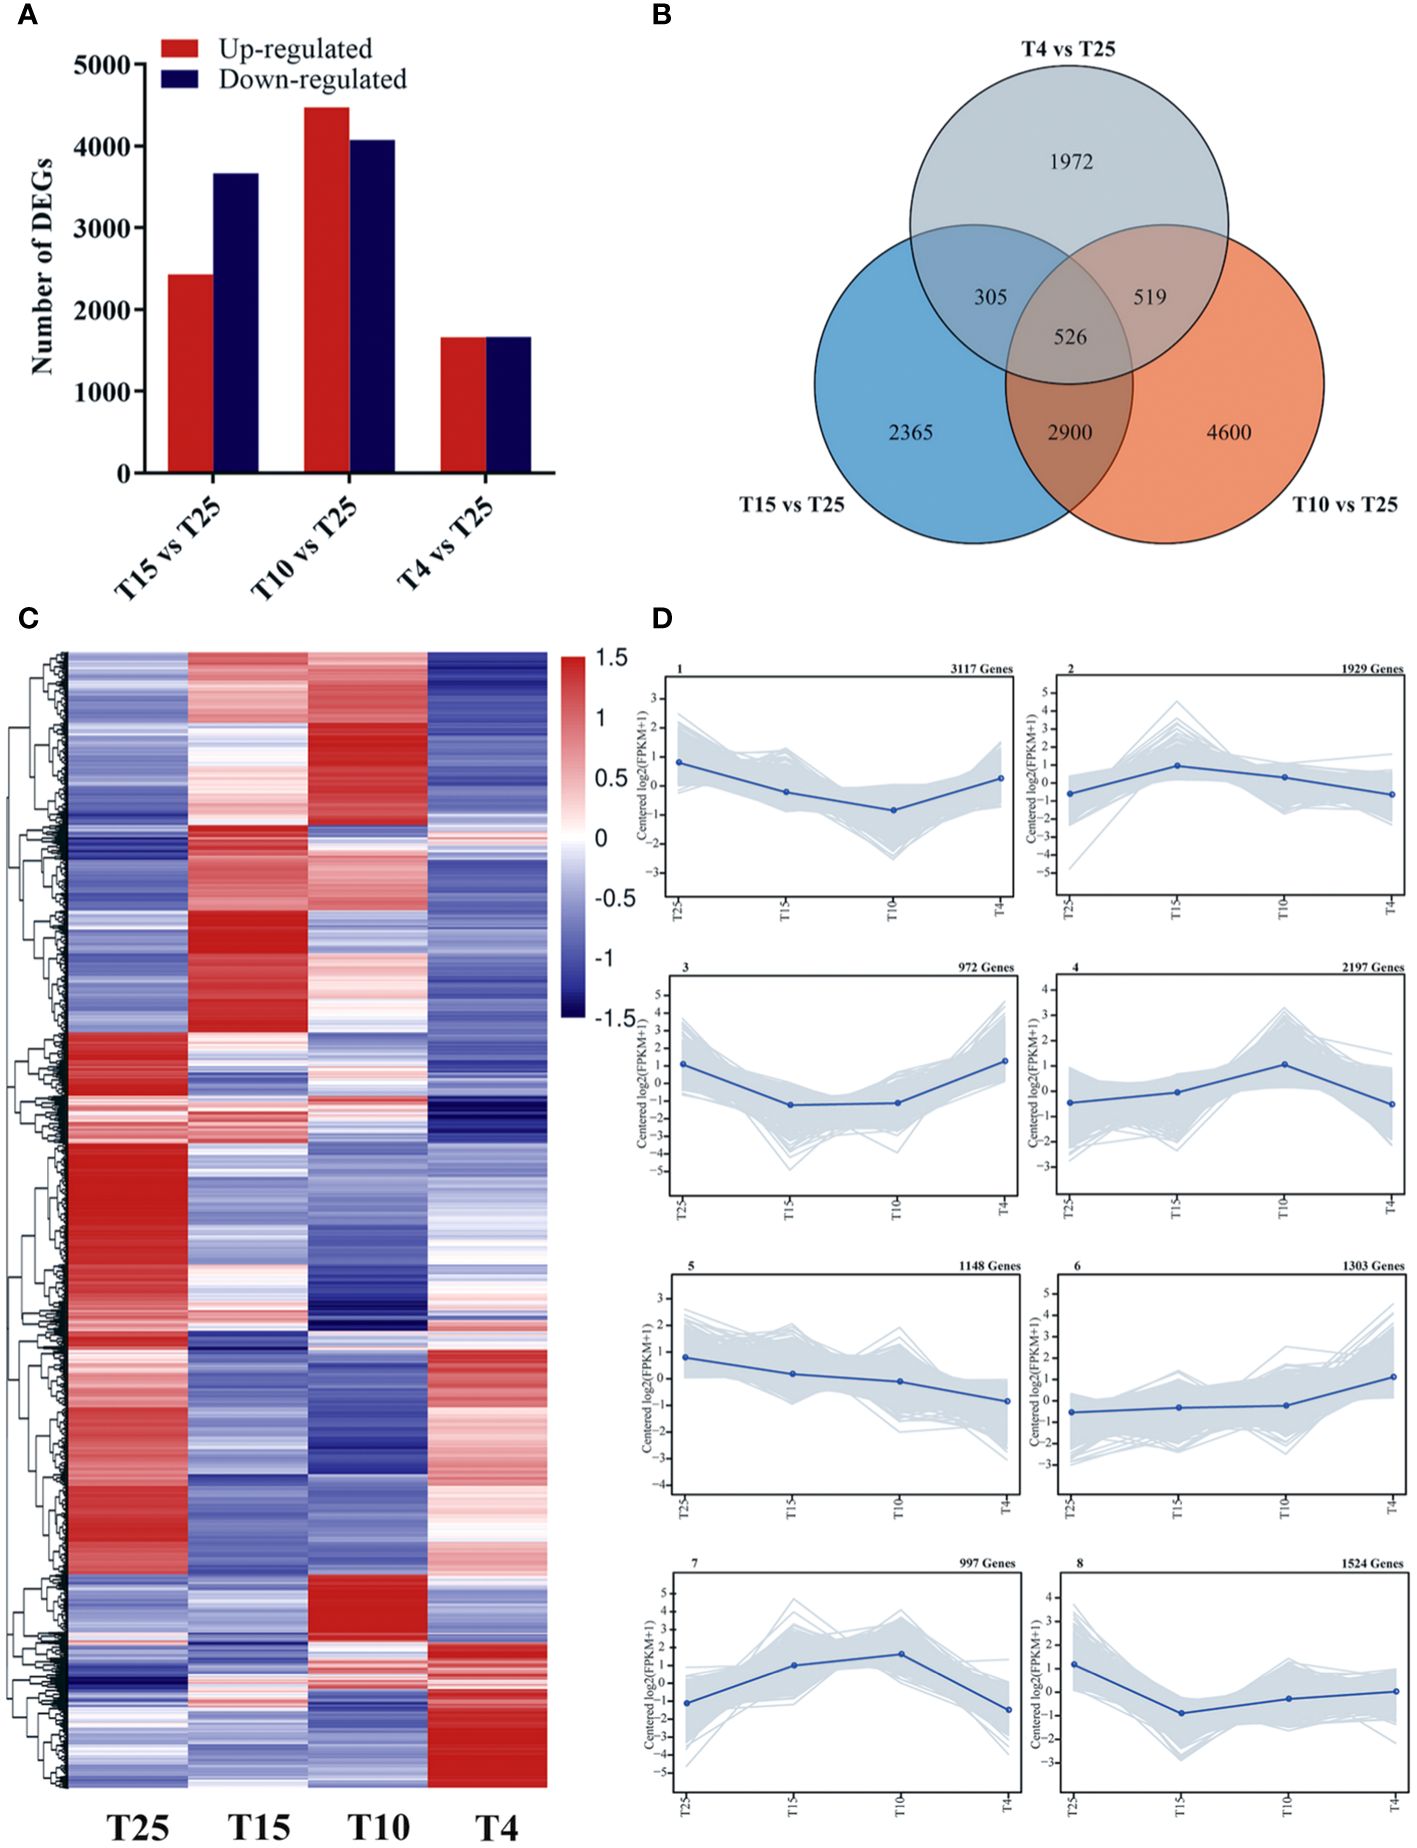
Figure 2 Number of differentially expressed genes (DEGs) upon cold stress at three temperature points (T15 vs. T25, T10 vs. T25, and T4 vs. T25). (A) Number of upregulated and downregulated genes at three temperature points (T15 vs. T25, T10 vs. T25, and T4 vs. T25). (B) Venn diagram showing the number of DEGs at three temperature points (T15 vs. T25, T10 vs. T25, and T4 vs. T25). (C) Heat map of DEGs at four temperature points (T25, T15, T10, and T4). (D) Trend analysis of the co-expression patterns of DEGs at four temperature points (T25, T15, T10, and T4).
3.3 Validation of differentially expressed genes by qRT-PCR
The expression patterns of 12 genes were validated using qRT-PCR, including six significant downregulation expressed genes (Gh_D09G2404, Gh_A02G0898, Gh_A06G0948, Gh_D10G2061, Gh_A07G1351, and Gh_D10G1486), six significant upregulation expressed genes (Gh_D05G2845, Gh_D06G1877, Gh_A12G1885, Gh_A13G1204, Gh_A01G1052, and Gh_A05G1366). All these genes showed the same expression trend between qRT-PCR (Figure 3) and RNA-Seq (Figure 3) at T25, T15, T10, and T4, confirming the reliability of the RNA-seq result.
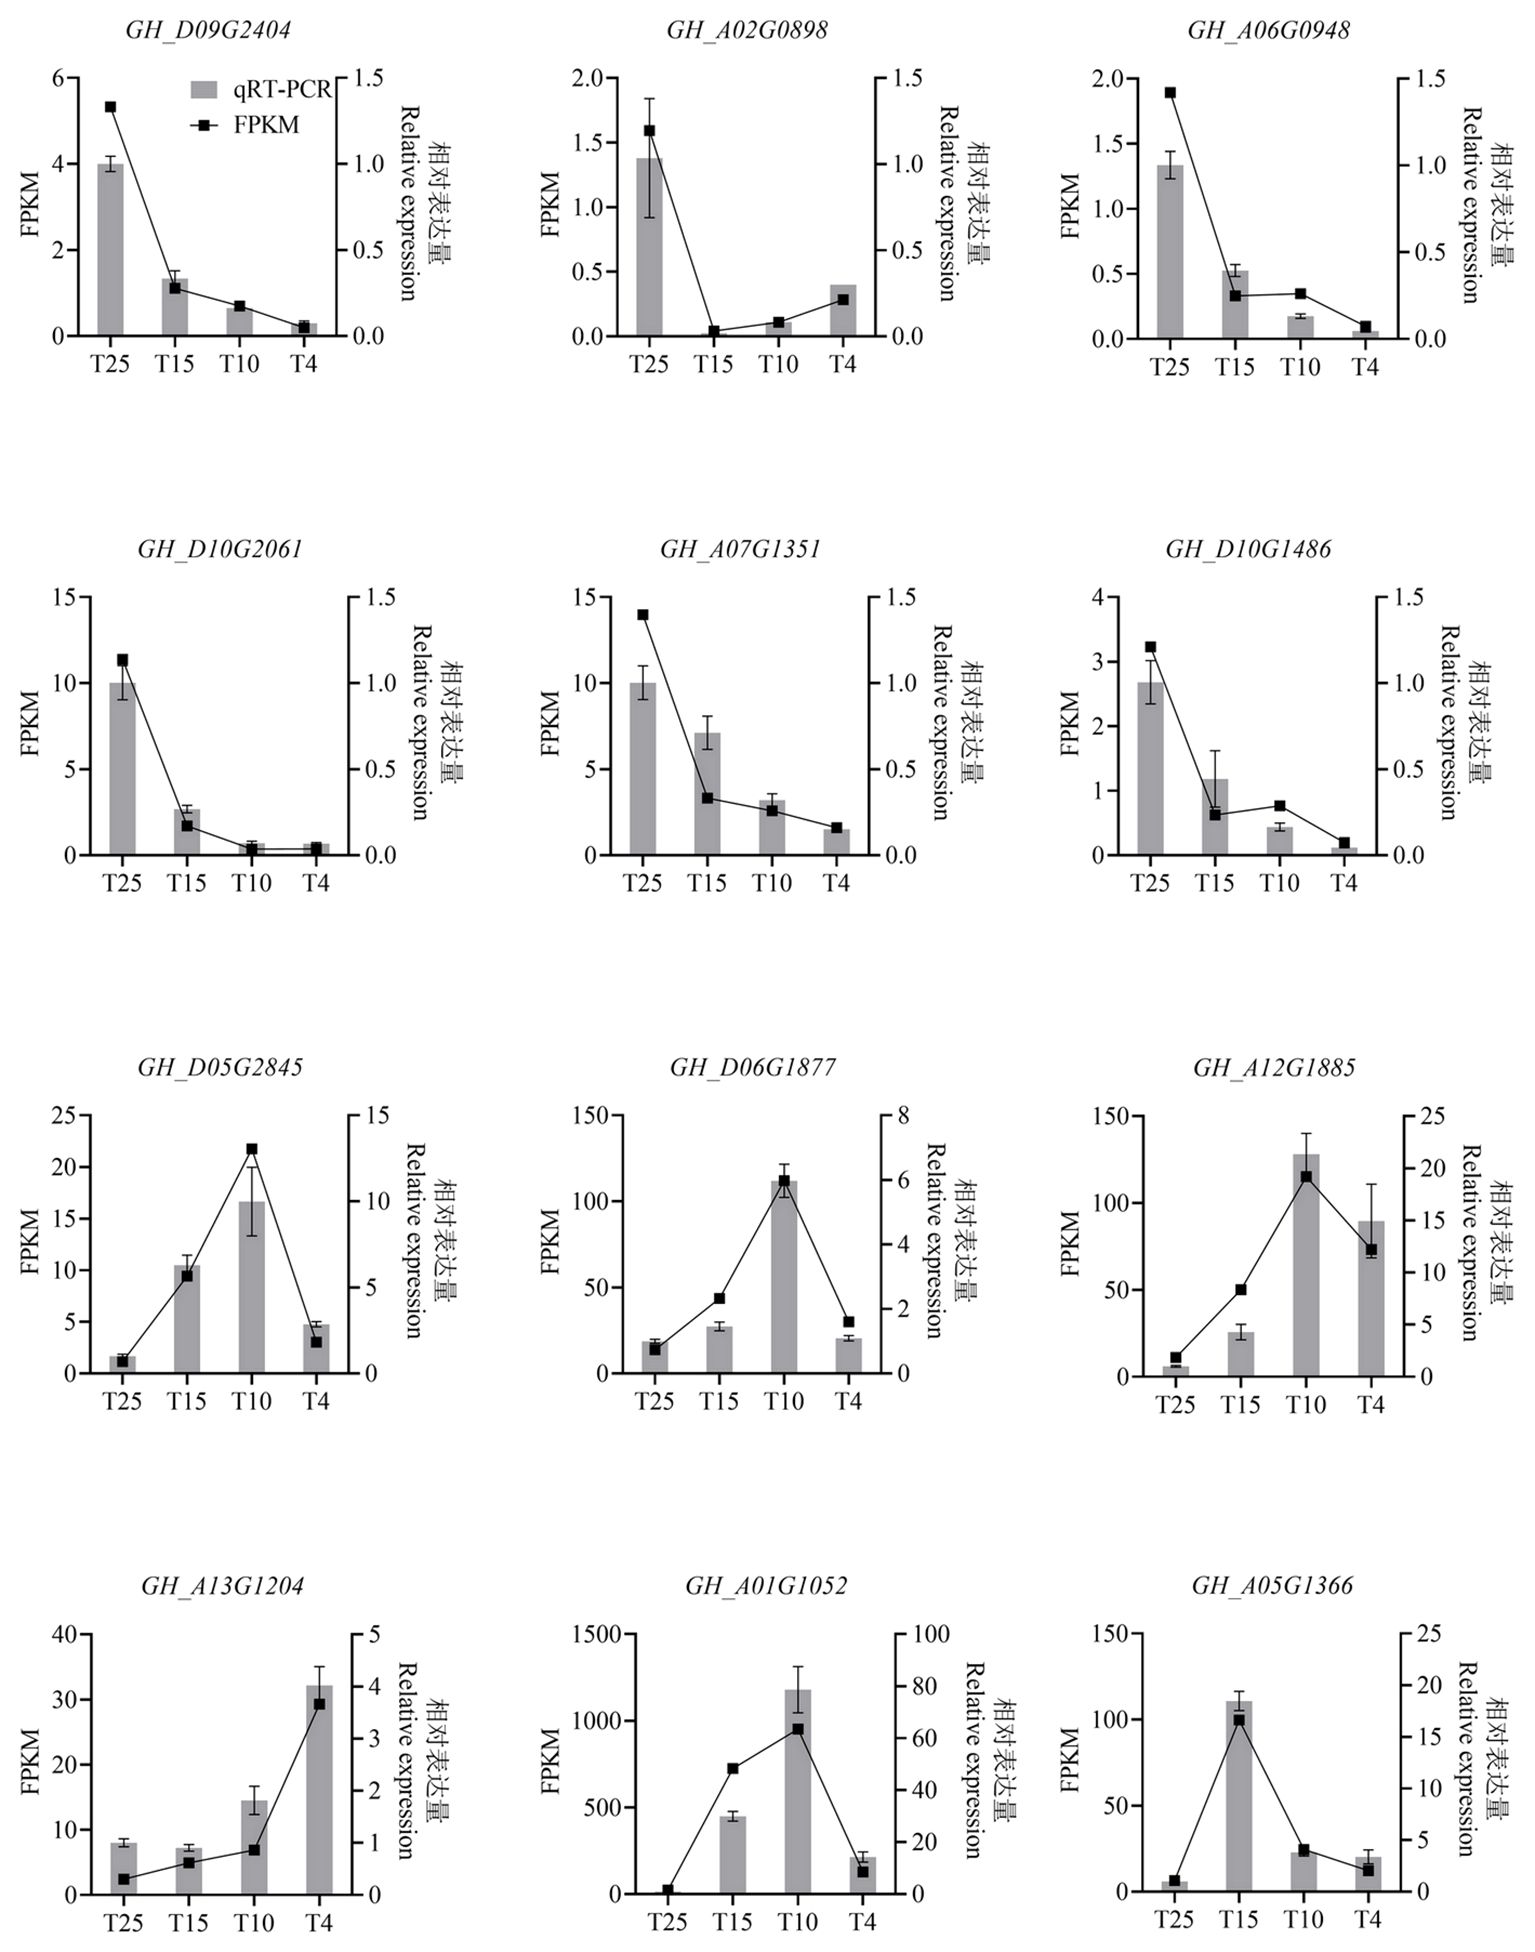
Figure 3 Histogram showing the relative expression level of the 12 selected genes in cotton leaves at the four temperature points after cold stress by qRT-PCR and RNA-seq analysis. The 12 selected genes are six significant downregulation expressed genes (Gh_D09G2404, Gh_A02G0898, Gh_A06G0948, Gh_D10G2061, Gh_A07G1351, and Gh_D10G1486), six significant upregulation expressed genes (Gh_D05G2845, Gh_D06G1877, Gh_A12G1885, Gh_A13G1204, Gh_A01G1052,and Gh_A05G1366). FPKM, fragments per kilobase of exon model per million mapped fragments.
3.4 Gene ontology analysis of DEGs
GO enrichment analysis of DEGs was performed to determine the functions of the distinct transcripts differentially expressed in ZM36 after low temperature stress. In T15 vs. T25, the GO terms such as response to ATP binding (GO:0005524), response to oxygen-containing compound (GO:1901700), cell wall organization (GO:0071555), microtubule-based process (GO:0007017) were commonly enriched (Figure 4A). The GO terms such as response to ubiquitin–protein transferase activity (GO:0004842), protein ubiquitination (GO:0016567), response to external stimulus (GO:0009605), ubiquitin protein ligase activity (GO:0061630), and response to water deprivation (GO:0009414) were commonly enriched in T10 vs. T25 (Figure 4B). In T4 vs. T25, the DEGs are mainly enriched in ATP binding (GO:0005524), plasma membrane (GO:0005886), transcription factor activity, sequence-specific DNA binding (GO:0003700), protein kinase activity (GO:0004672), and regulation of transcription, DNA-templated (GO:0006355) (Figure 4C).
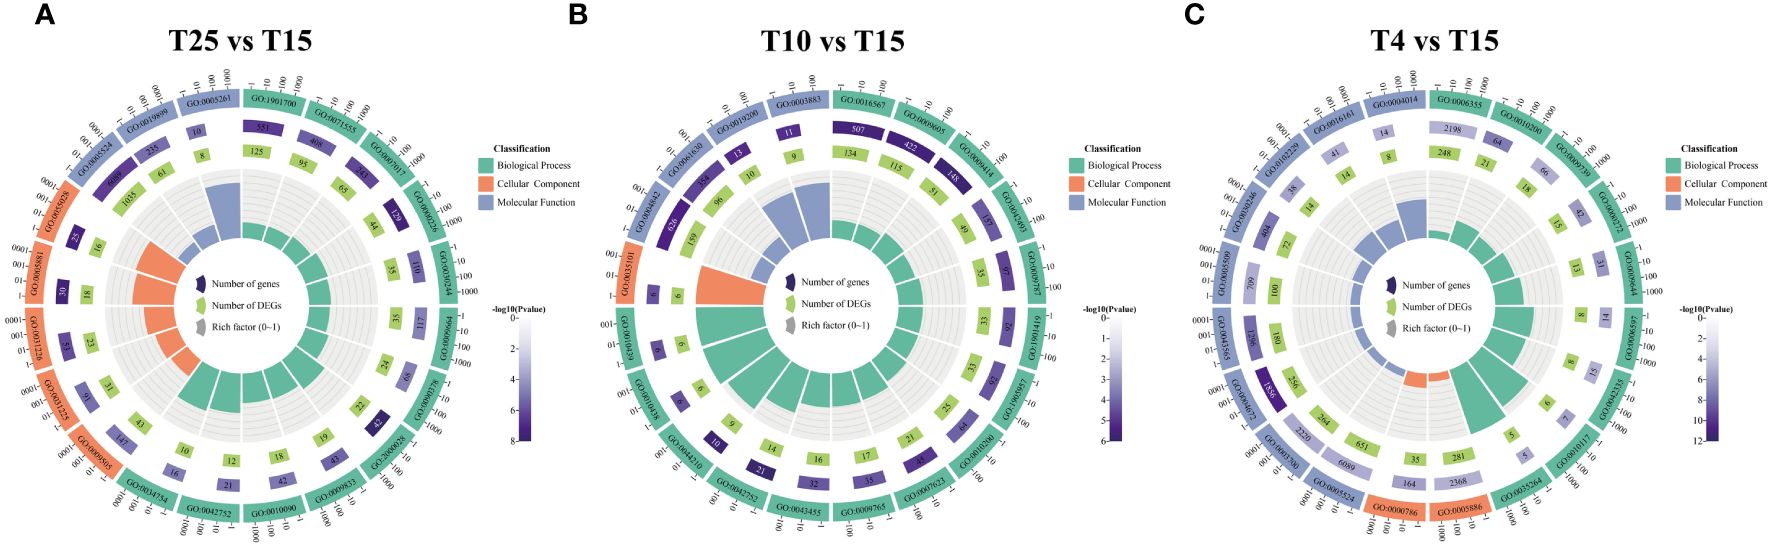
Figure 4 Gene ontology enrichment analysis for the differentially expressed genes identified in T15 vs. T25, T10 vs. T25, and T4 vs. T25. (A) Enriched GO terms at T15 vs. T25 in ZM36. (B) Enriched GO terms at T10 vs. T25 in ZM36. (C) Enriched GO terms at T4 vs. T25 in ZM36. Count means the number of genes included in the GO term.
3.5 KEGG pathway analysis of DEGs
The KEGG enrichment analysis of all the DEGs resulted in 2,454 pathways. There were many significant changes in pathways related to circadian rhythm—plants, beta-alanine metabolism, zeatin biosynthesis, fatty acid metabolism, biosynthesis of amino acids, MAPK signaling pathway–plant, glutathione metabolism, and plant–pathogen interaction (Figures 5A–C), which are mainly associated with plant growth and development and response to stresses. The KEGG pathways enriched in T4 vs. T25 included MAPK signaling pathway–plant, plant–pathogen interaction, photosynthesis–antenna proteins, photosynthesis, flavonoid biosynthesis, and plant hormone signal transduction (Figure 5C). The enriched pathways also suggested that genes related to MAPK cascade signaling might be related to the cotton response to low-temperature stress. The pathways related to MAPK signaling pathway–plant were enriched in two temperature points (T10 and T4) (Figures 5B, C). The genes involved included those encoding MAPKKK18 (GH_A03G0386), serine/threonine protein kinase OXI1 (GH_A07G2243), abscisic acid receptor PYR1 (GH_A12G2288), ultraviolet-B receptor UVR8 (GH_A05G3668), and PLATZ transcription factor family protein (GH_A09G2161). The above-mentioned results indicated that the response of cotton to low temperature stress is governed by a complex gene network that regulates multiple metabolic pathways.
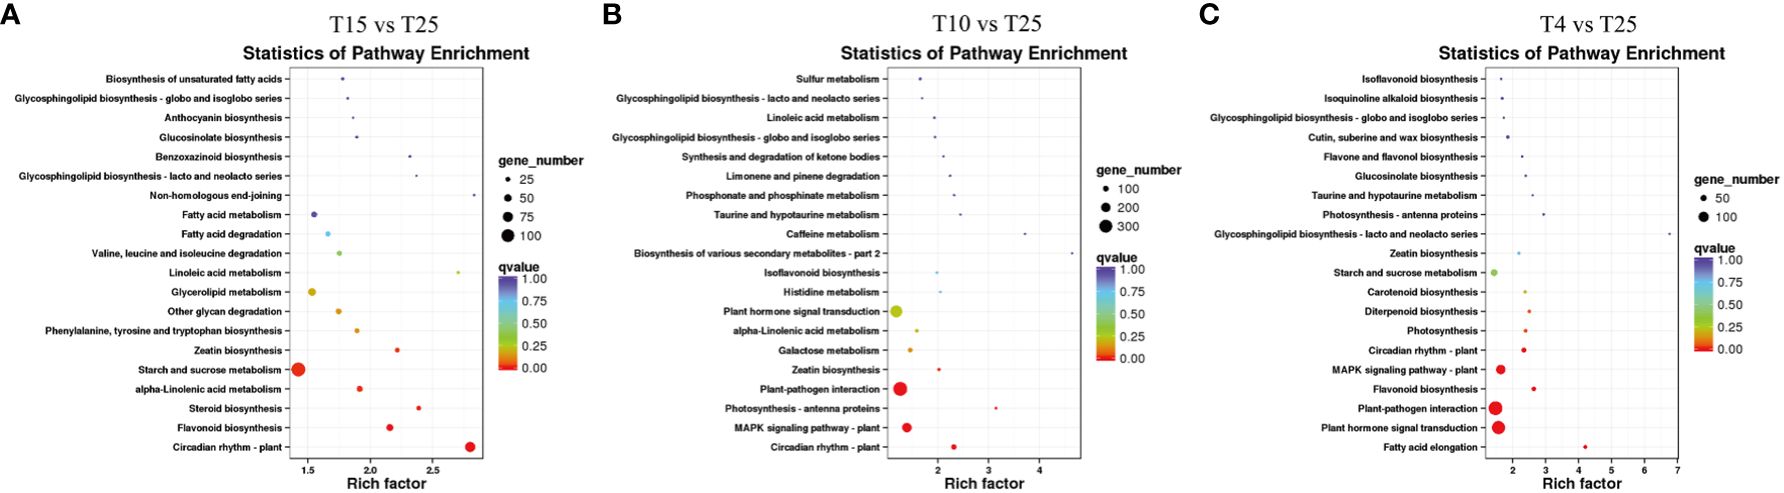
Figure 5 KEGG analysis of differentially expressed genes (DEGs) associated with the response to cold stress in T15 vs. T25, T10 vs. T25, and T4 vs. T25. (A) KEGG categories of DEGs in T15 vs. T25. (B) KEGG categories of DEGs in T10 vs. T25. (C) KEGG categories of DEGs in T4 vs. T25.
3.6 Transcription factor prediction
In T15 vs. T25, T10 vs. T25, and T4 vs. T25 groups, 471 transcription factors (49 transcription factor families), 767 transcription factors (59 transcription factor families), and 341 transcription factors (41 transcription factor families) were found to be involved in the response to different degrees of cold stress, respectively. To predict the transcription factors of all DEGs, 1,119 transcription factors were found in 59 transcription factor families (Supplementary Figure S2A). Among them, different members of major gene families such as AP2/ERF-ERF (133 genes), MYB (108 genes), bHLH (78 genes), and NAC (73 genes) were upregulated or downregulated under different cold stresses (Supplementary Figures S2B–E).
3.7 Phosphatidylinositol signaling system analysis of DEGs
The phosphatidylinositol signaling system regulates many physiological processes, such as growth, cytoskeleton rearrangement, and membrane transport. The DEGs of the phosphatidylinositol signaling system (ko04070) were identified to be 32 genes (21 upregulated, 11 downregulated), 40 genes (29 upregulated, 11 downregulated), and 22 genes (18 upregulated, four downregulated) in T15, T10, and T4, respectively (Supplementary Figure S3). Among them, all others were upregulated except for GH_D10G0541 in two 1-phosphatidylinositol-3-phosphate 5-kinase (FAB1) after cold stress (Supplementary Figure S3A). GH_A10G0515 was upregulated 4.60, 3.88, and 5.66 times after T15, T10, and T4, respectively (Supplementary Figure S3A). Six phosphatidylinositol-specific phospholipases (PLCD) were downregulated except for GH_A06G1884 (Supplementary Figure S3A). Three diacylglycerol kinases (DGK) were upregulated under different cold stresses, except for GH_A12G2233, and GH_D12G2002 was upregulated 4.40, 15.03, and 2.40 times after T15, T10, and T4, respectively (Supplementary Figure S3B). Most of the 25 calmodulin (CALM) genes were upregulated, especially GH_A04G1762 and GH_D12G1967. They were upregulated by 104.81, 17.55, 4.12 times and 74.50, 76.91, and 2.80 times after T15, T10, and T4, respectively (Supplementary Figure S3B).
3.8 Photosynthetic-related pathway analysis of DEGs
Photosynthesis is sensitive to cold stress. KEGG indicate that many DEGs are involved in photosynthesis metabolic pathways. In this study, 34 differentially expressed genes were enriched under different cold stresses in photosynthesis (ko00195) (Figure 6A). One psaA, one psaL, and one psaO gene were found in the photosystem I complex. Among them, psaA (GH_D03G0877) was upregulated 1.93, 1.20, and 2.99 times after T15, T10, and T4, respectively. Two psbA, one psbD, three psbB, and one psbH gene in the photosystem II complex were upregulated after T15, T10, and T4, while four psb27 genes were downregulated. One petB gene and one petA gene were found in the cytochrome b6-f complex, which were upregulated under T4 for 3.13, 3.52, and 4.61 times, respectively. Seven DEGs related to photosynthetic electron transfer were downregulated after T15, T10, and T4, indicating that cold stress has a significant inhibitory effect on electron transfer in photosynthesis. The 27 DEGs (five LHC I and 22 LHC II) were found in the photosynthesis antenna proteins (ko00196) (Figure 6B). Except for three Lhcb4 genes that were downregulated after T15 and T10 and upregulated after T4, most genes were upregulated after T15 and T10 and downregulated after T4. The 24 genes were upregulated after T15 and T10 and downregulated after T4, and three Lhcb4 genes were exactly the opposite. A total of 34 DEGs were found in carbon fixation in photosynthetic organisms (ko00710) pathway (Figure 6C). The C4 pathway is enriched to 15, and the Calvin cycle is enriched to 19. Among them, one ribose 5-phosphate isomerase A (GH_A01G1655) in the Calvin cycle was upregulated by 2.00, 2.75, and 6.72 times after T15, T10, and T4 stress, respectively, and one phosphoglycerate kinase (GH_A03G0406) was upregulated 2.03, 20.07, and 4.49 times after T15, T10, and T4 stress, respectively. At the same time, we also discovered 35 DEGs (Figure 6D). Six genes were in carotenoid biosynthesis (ko00906) β. Most of the beta carotene isomerase (DWARF27) was upregulated, especially GH_A07G2351 and GH_D07G2294, which were upregulated 4.99, 8.27, and 4.70 times and 4.06, 6.08, and 7.14 times after T15, T10, and T4 stress, respectively. Beta carotene 3-hydroxylase (crtZ) was upregulated in expression. Three zeaxanthin epoxidase (ZEP) genes were upregulated, with GH_D01G1934 upregulated 7.35, 40.20, and 1.51 times after T15, T10, and T4 stress, respectively. Four 9-cis-epoxycarotene dioxygenase (NCED) genes were upregulated, with GH_D13G1744 upregulated 12.84, 58.35, and 2.99 times after T15, T10, and T4 stress, respectively.
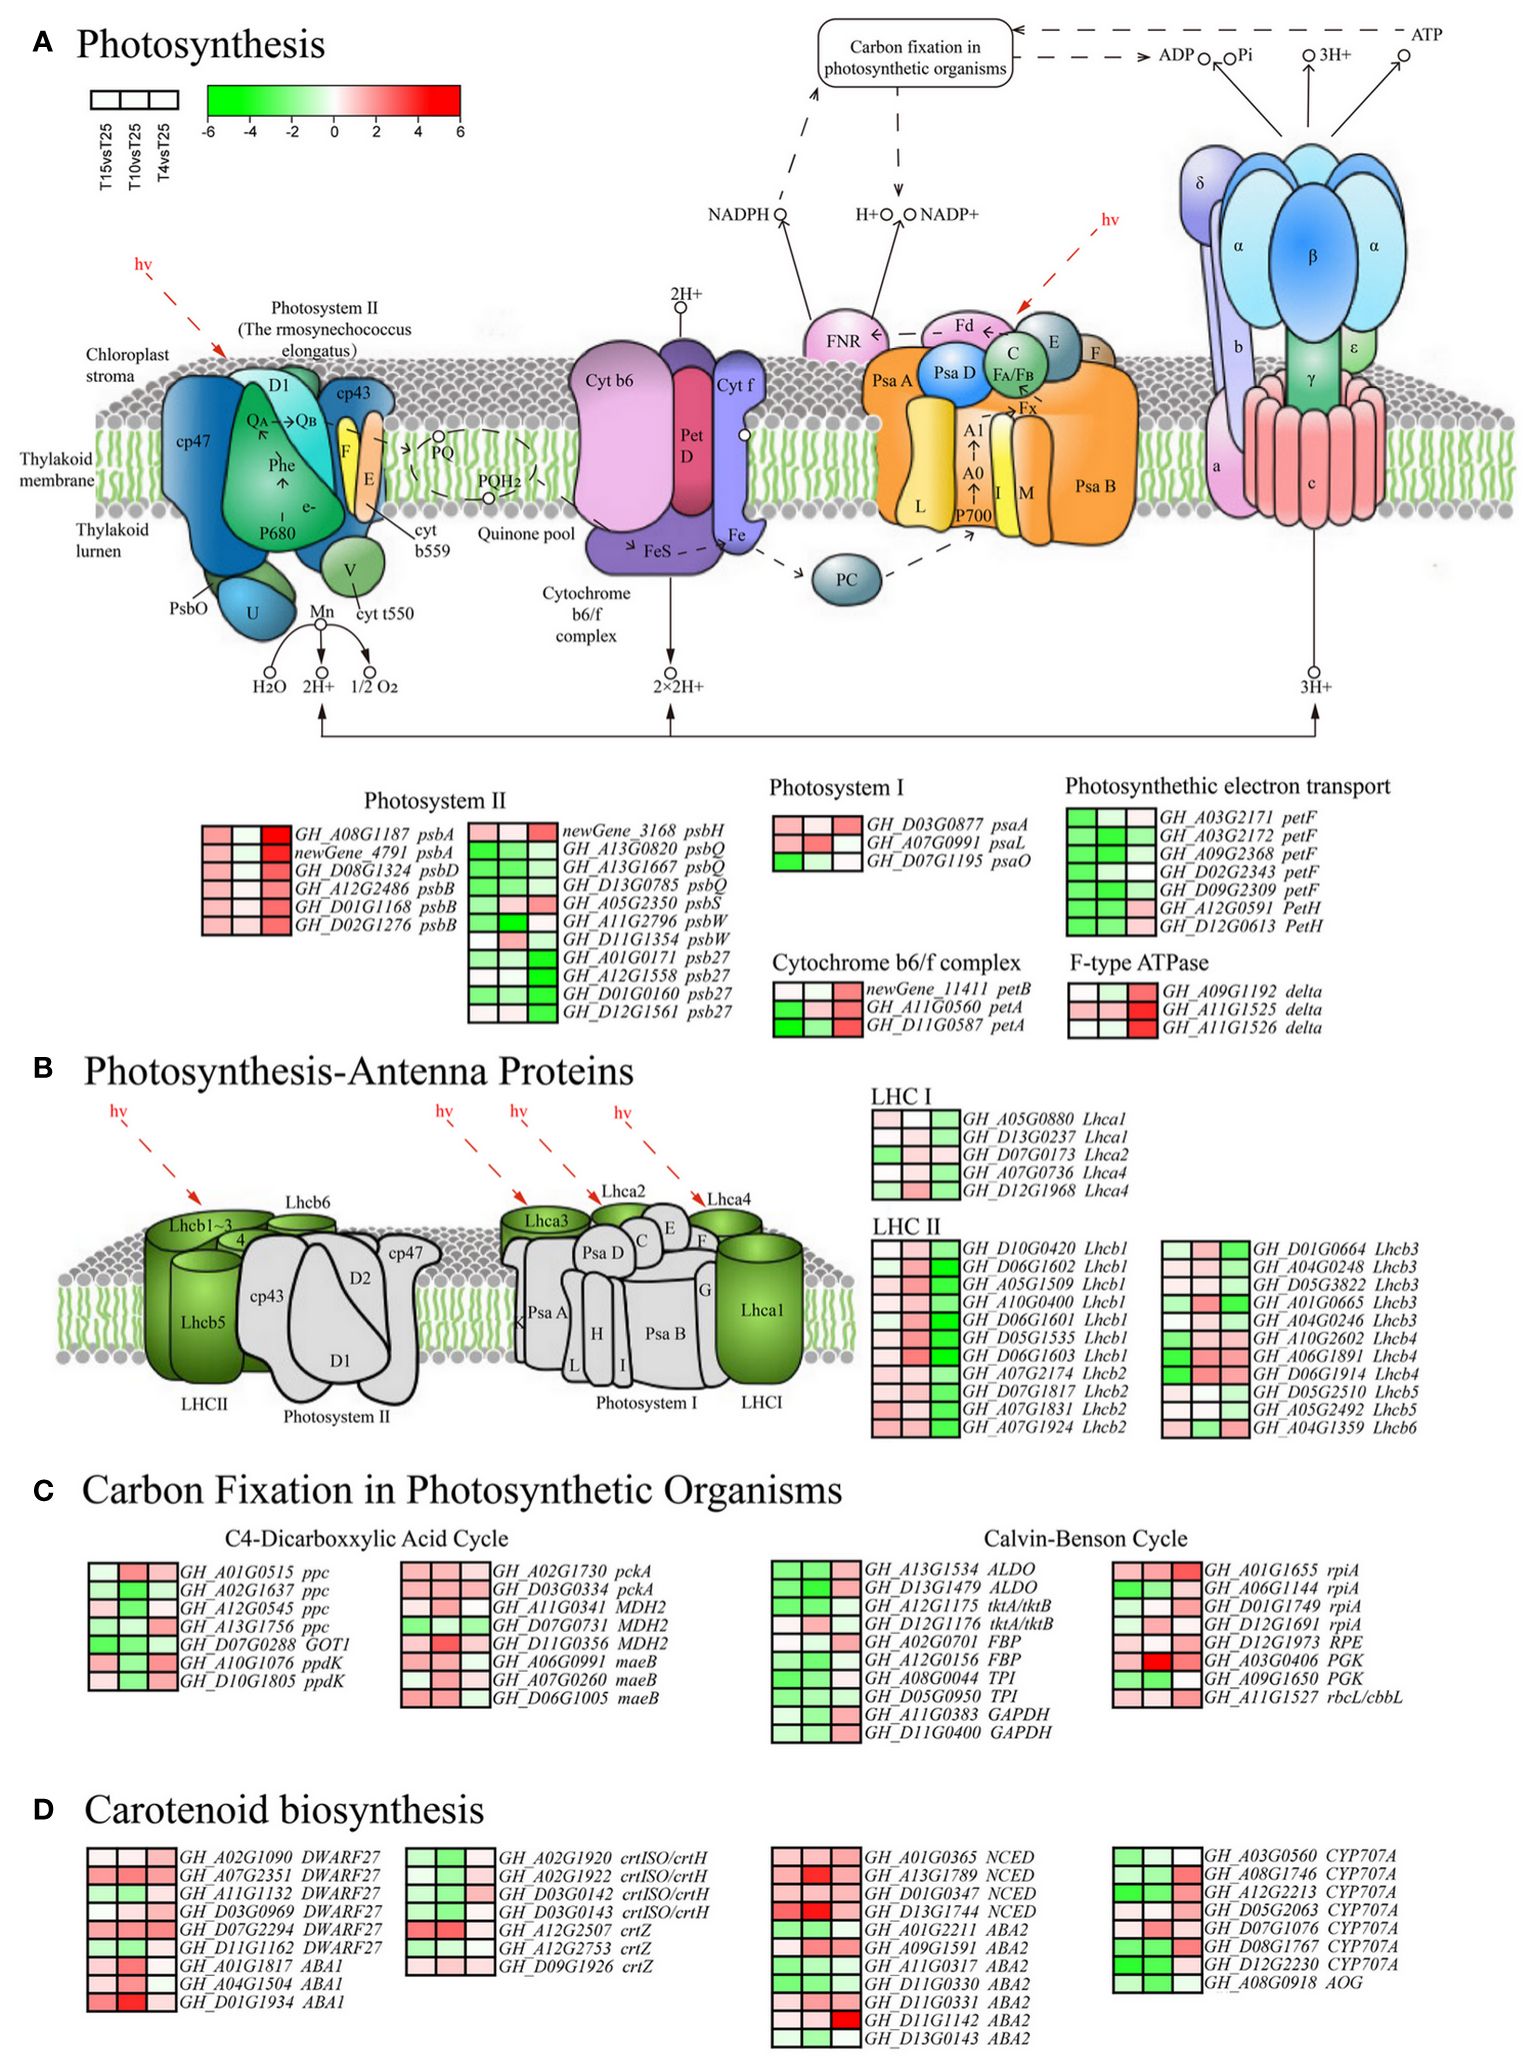
Figure 6 Photosynthetic-related pathway analysis of differentially expressed genes (DEGs). (A) Enrichment analysis of 34 DEGs related to photosynthesis (ko00195). (B) Enrichment analysis of 27 DEGs (five LHC I and 22 LHC II) related to the photosynthesis antenna proteins (ko00196). (C) Enrichment analysis of 34 DEGs related to carbon fixation in photosynthetic organisms (ko00710). (D) Enrichment analysis of 35 DEGs related to the carotenoid biosynthesis (ko00906).
3.9 Analysis of co-expressed DEG interactions
The 526 DEGs were detected under three different cold stress conditions, indicating that the DEGs may have been involved in adapting to stress at different low temperature points, and participating in the same pathway. Therefore, we defined 526 co-expressed DEGs as key cold-resistant genes. Further utilizing the STRING database to predict the interrelationships between 526 proteins, Cytoscape software was used for visualization processing, and five hub genes were identified based on the criteria of degree value ≥16 (Figure 7). Four genes were significantly upregulated under cold stress (GH_D01G0766, GH_A05G3668, GH_A01G0766, and GH_A09G2161), while one gene was significantly downregulated under cold stress (GH_A02G1336).
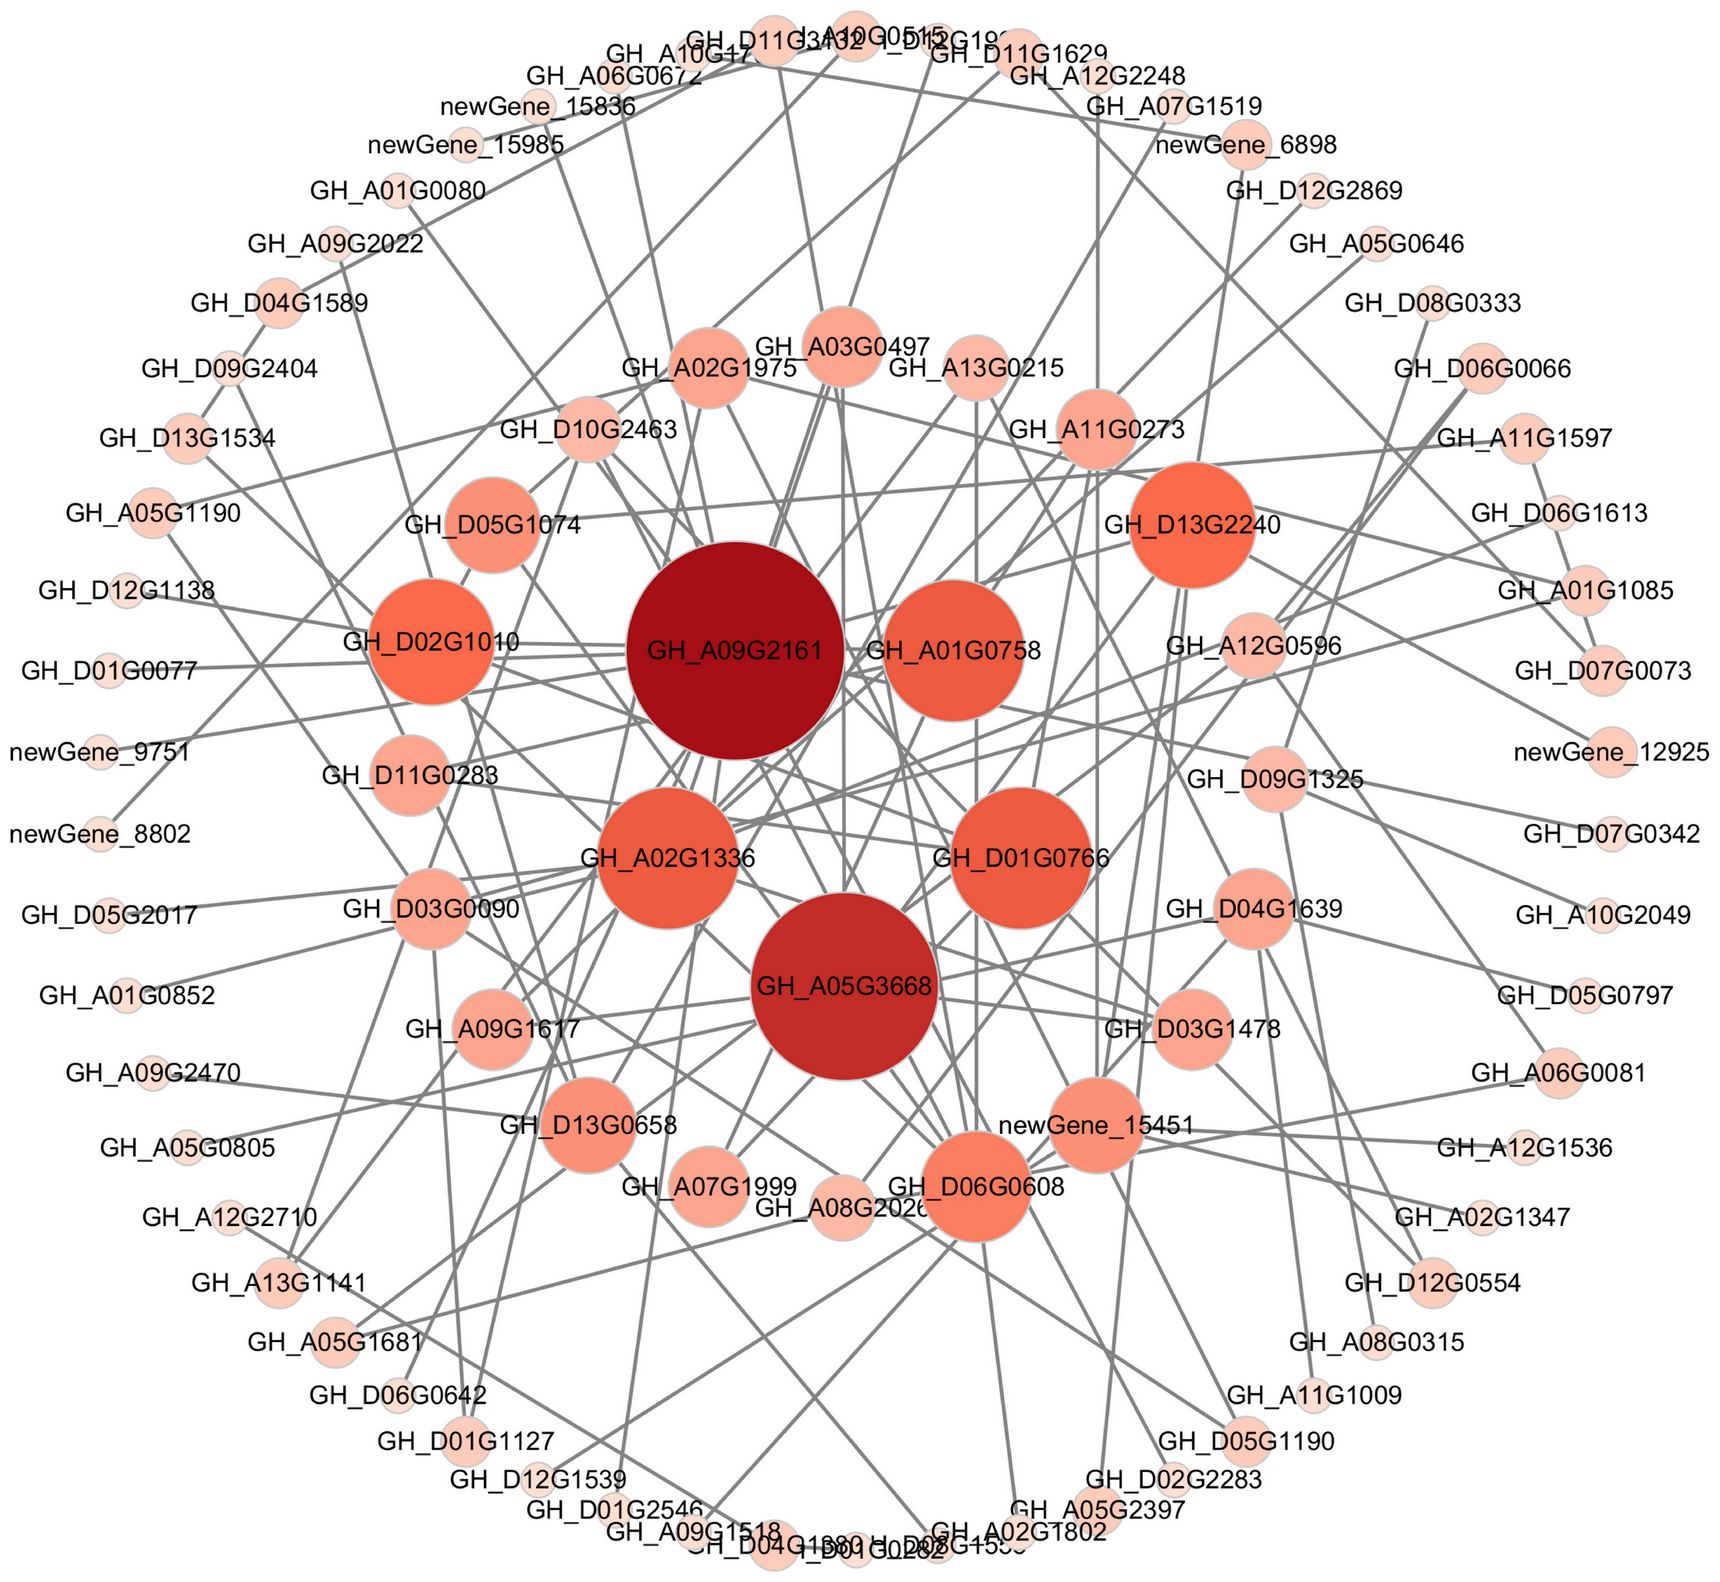
Figure 7 Co-expression network analysis results of the hub genes. Each circle represents a hub gene. Circle size and col vs. or represent the degree.
3.10 Silencing of GhPLATZ reduces the resistance of cotton to cold stress
To get insight on the potential function of GhPLATZ, we knocked down the expression level of GhPLATZ in ZM36 using VIGS with cotton seedlings treated by TRV:: GhCHLI as positive control of the VIGS experiment (Figure 8A). Compared to TRV2::00 plants, TRV:: GhPLATZ plants had a significantly low expression level of GhPLATZ (Figure 8B; Supplementary Table S4), suggesting the successful inhibition of GhPLATZ by VIGS. After about 10 days of cold stress, the TRV:: GhCHLI plants showed a yellowing phenotype (Figure 8A), indicating that the VIGS system was functioning properly. To confirm the effectiveness of the silencing system, cotton seedlings were subjected to 15°C (low temperature treatment) to verify the resistance of cotton to low temperature stress after inhibiting GhPLATZ expression. After 48 h of treatment at 15°C, it was found that TRV:: GhPLATZ plants were more sensitive to low temperature compared to TRV::00 plants, with more significant leaf wilting and dehydration (Figure 8C; Supplementary Table S4), indicating that inhibiting the expression of GhPLATZ would reduce cotton’s resistance to low temperature. The electrical conductivity of TRV : GhPLATZ plants was 49.82% ± 0.03, significantly higher than that of TRV:00 plants (Figure 8D; Supplementary Table S4). Consequently, the proline of TRV : GhPLATZ plants was higher than that of TRV:00 plants at 87 and 56 ug-1 g, respectively (Figure 8E; Supplementary Table S4).
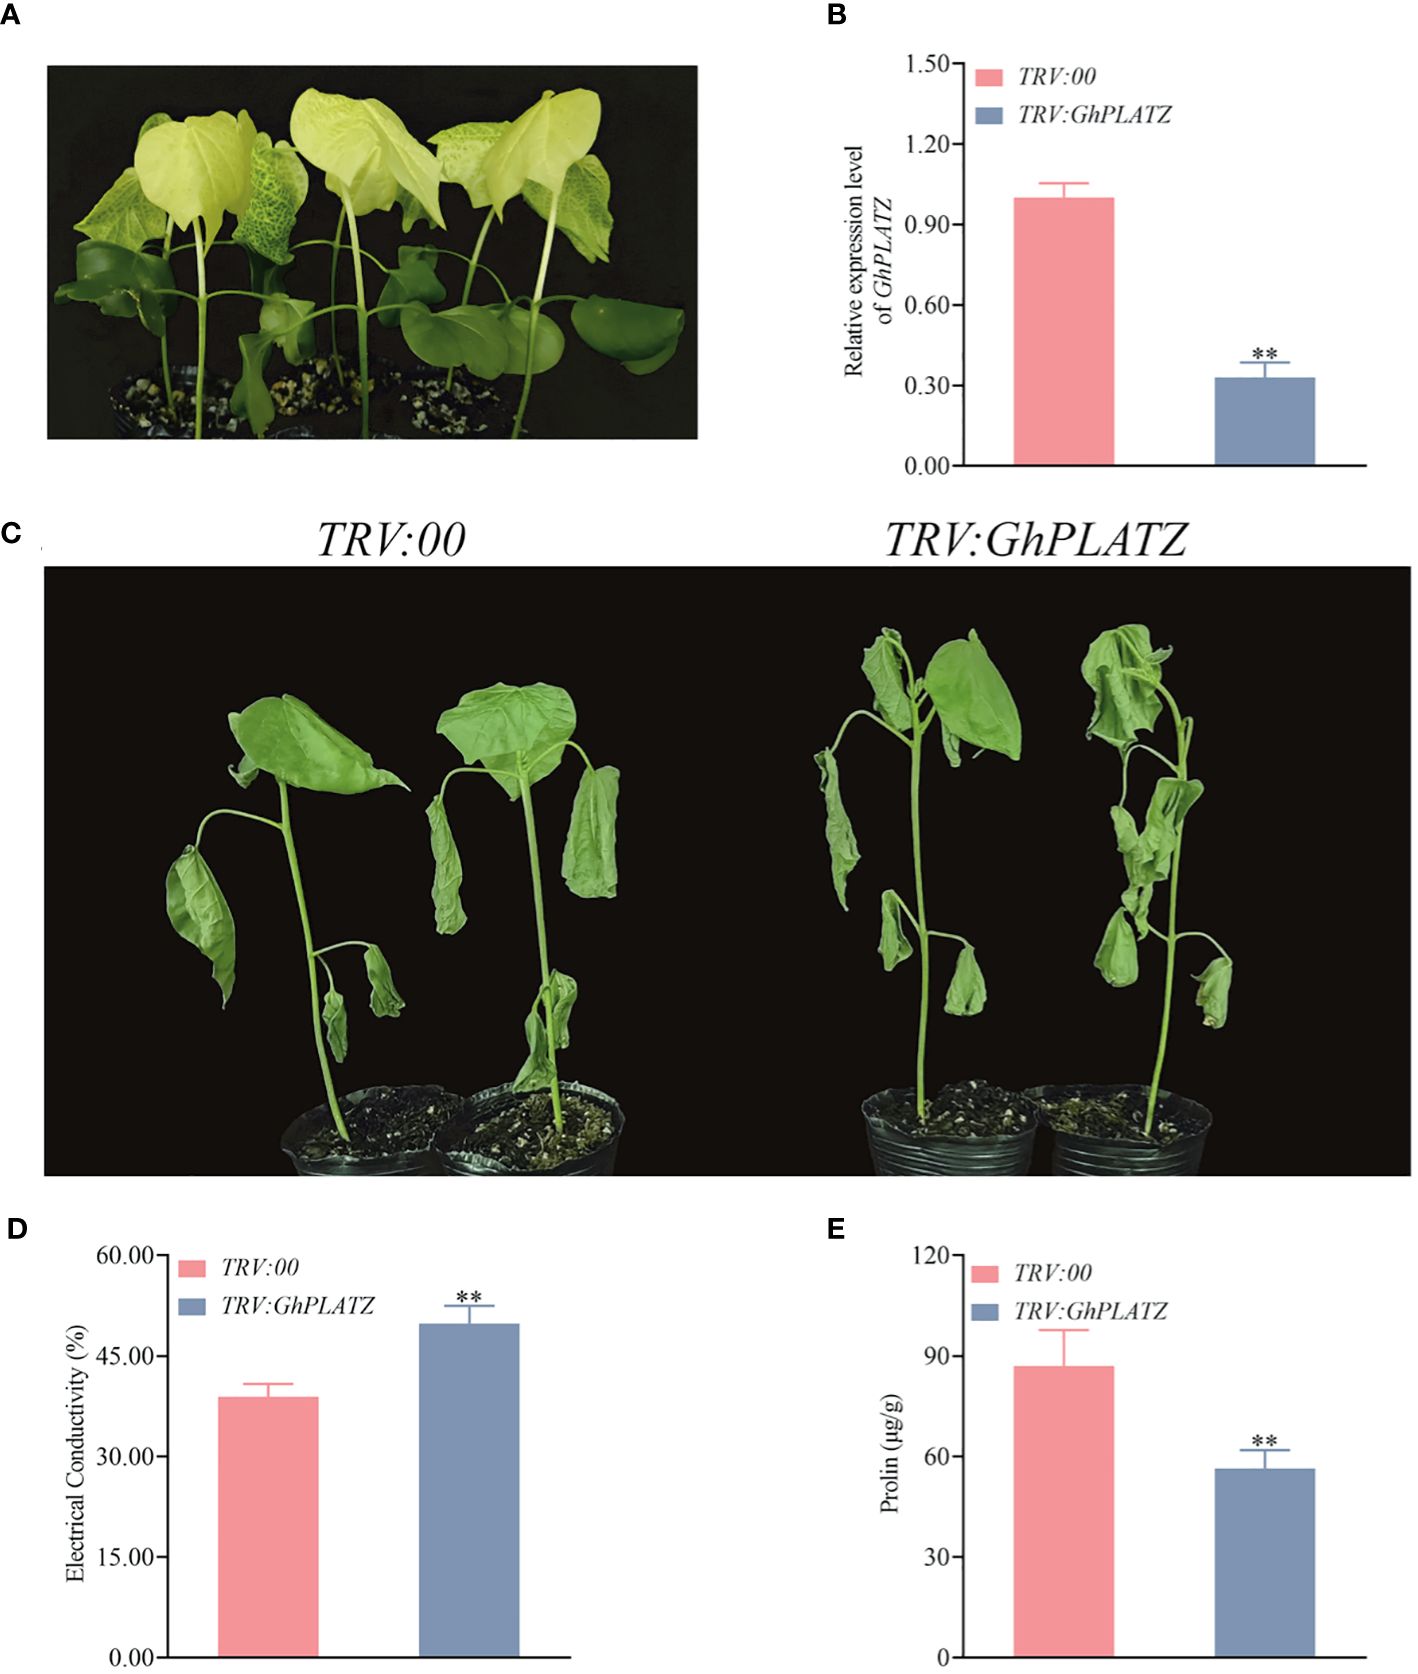
Figure 8 Knockdown of GhPLATZ in cold stress-resistant ZM36 reduced low temperature point resistance. (A) Observation of the expected yellowing leaf phenotype in TRV:: GhCHLI plants. (B) GhPLATZ expression in the TRV:00 and TRV:: GhPP2C52 plants. (C) Cold phenotypes of the TRV:: 00 and TRV:: GhPLATZ plants at 10 day. (D) Comparison of electrical conductivity from the TRV:: 00 and TRV:: GhLATZ plants at 10 day. (E) Comparison of proline between TRV:00 and TRV:: GhPLATZ plants at 10 day. The data are three independent biological replicates, Significance analysis using T test (** P < 0.01).
4 Discussion
4.1 Changes in photosynthetic characteristics under cold stress
Cold stress can induce photoinhibition, reducing the absorption and capture capacity of the light system, electron transfer efficiency, and fixed quantum efficiency of carbon dioxide. In this study, the photosynthetic system was significantly damaged, inhibiting the normal progress of photosynthesis and leading to the generation of photoinhibition effects. Especially under 4°C, the photoinhibition effect was more severe. The downregulation of LHCA and LHCB genes under cold stress reduces the ability to absorb and capture light energy (Wilson et al., 2006). The downregulation of key enzyme activity and gene transcriptional expression levels in the Calvin cycle may be the reason for the decrease in plant carbon assimilation efficiency and RuBP regeneration rate caused by low temperature (Hussain et al., 2021). In this study, 27 DEGs were enriched in the photosynthesis antenna protein pathway under cold stress, while LHCA and LHCB genes were upregulated, which may be an adaptive protective response. The 34 DEGs are involved in the carbon fixation pathway in photosynthetic organisms, of which 19 are related to the Calvin cycle. The DEGs related to photosynthetic electron transfer are downregulated, indicating severe damage to the photosynthetic system, and reduce the efficiency of carbon assimilation under cold stresses. However, some DEGs were upregulated, although the Pn and Fv/Fm values decreased in T4. It is speculated that ZM36 can resist low temperature stress and alleviate oxidative damage by regulating the expression of photosynthetic-related genes. In addition, proline is a common osmoregulatory substance in plants, which can maintain the osmotic balance between the protoplast and the environment, thereby alleviating the damage caused by low temperature. Plants accumulate higher levels of proline when subjected to stress (Charest and Ton Phan, 1990; Shen et al., 2020). This study found that the proline content in silenced plants decreased by 30.1% compared to the control plants after low temperature stress, indicating a significant decrease in the cold tolerance of silenced plants. This suggests that enhancing the expression of photosynthesis-related genes is not enough to maintain a certain level of photosynthetic ability under cold stress. The specific mechanism values need further in-depth research.
4.2 Transcription factors AP2/ERF, MYB, and NAC regulate cotton cold tolerance
When plants are subjected to cold stress, transcription factors (TFs) bind to specific cis regulatory elements in the promoter to regulate target genes related to cold resistance, thereby enhancing cold tolerance (Knight and Knight, 2012; Zhao et al., 2015). In recent years, TF families such as AP2/ERF, MYB, bHLH, and NAC have received widespread attention as key regulatory factors in plant stress response (Mehrotra et al., 2020; He et al., 2023). AP2/ERF plays a crucial regulatory role in response to low temperature stress. In addition, AtMYB15 plays a negative regulatory role in regulating cold resistance in Arabidopsis (Wang et al., 2019). The NAC family is the largest specific transcription factor family in plants, playing a crucial regulatory role in plant growth, development, and response to abiotic stress (Tran et al., 2010). In Arabidopsis, overexpression of HuNAC20 and HuNAC25 enhances tolerance to cold stress by altering the expression of cold response genes in transgenic plants (Hu et al., 2022). In this study, the number of members belonging to the AP2/ERF transcription factor family was the highest. At the same time, MYB transcription factors also play a crucial role in low temperature response. Most members of the MYB family show a downward trend under low temperature stress, and most genes in the NAC family show varying degrees of upregulation under different low temperature stress conditions, such as GH_D02G1383 and GH_A03G1198, which were upregulated hundreds of times under low temperature stress, highlighting the important role of the NAC family in cotton’s resistance to low temperature stress.
4.3 Key genes for cold resistance and functional validation of GhPLATZ
Cold resistance is a complex physiological and biochemical process involving gene regulation. Plants improve cold resistance by coordinating the expression of multiple genes (Umer et al., 2020) UVR8 is a photoreceptor that specifically absorbs UV-B light (Kliebenstein et al., 2002). The bZIP transcription factor HY5 is activated by UVR8 binding to COP1, thereby inducing the expression of multiple metabolic pathway genes (Favory et al., 2009). The tomato UVR8 gene participates in UV-B-induced cold tolerance by upregulating CuZnSOD, FeSOD, and CAT1 genes (Jiang et al., 2022). UVR8 regulates plant response to UV-B light by interacting with various transcription factors such as COP1 and HY5, including light morphogenesis, secondary metabolism, and adaptability to environmental stress. These transcription factors may affect the expression of genes related to ascorbic acid synthesis and metabolism, thereby affecting the level of ascorbic acid in plants (Lin et al., 2020; Podolec et al., 2021). The zinc finger transcription factor PLATZ is widely present in plants and plays an important role in regulating plant growth and development and responding to abiotic stress. The transgenic Arabidopsis thaliana with GhPLATZ1 may promote seed germination and seedling formation under salt stress by increasing the GA and ethylene content and reducing the ABA content (Han et al., 2022). It was found that PhePLATZ23 and PLATZ27 are highly responsive to cold stress and play an extremely important role in regulating bamboo’s response to external environmental stimuli (Zhang et al., 2022). UVR8 mainly involves the perception and transduction of light signals, while the PLATZ transcription factor is more related to plant transcriptional regulation and stress response. Although both play important roles in plant life activities, their mechanisms of action and biological functions are different, and there is currently no clear evidence to suggest a direct interaction or functional connection between them. Future research may reveal whether there are some unknown connections between them or whether they have cross-functional pathways in plant life activities. In this study, the five key candidate genes in response to cold stress were identified, including GhUVR8 (GH_A05G3668) and GhPLATZ (GH_A09G2161). Meanwhile, it was also found that GhPLATZ was subjected to low temperature treatment after transient silencing, and the silenced plants were more sensitive to low temperature and suffered more severe damage than the control plants. It is speculated that GhPLATZ is positively regulating cotton’s tolerance to low temperature.
5 Conclusions
The cold resistance of ZM36 is a complex process that involves the synergistic effects of genes, proteins, and metabolic pathways. These mechanisms interact with each other and together form the strong cold resistance of ZM36, enabling it to maintain relatively normal growth and development in low temperature conditions. In addition, network regulatory analysis identified five hub genes, including GhPLATZ (GH_A09G2161) highly related to the response of cotton plants to cold stress. GhPLATZ was demonstrated to be a positive regulator of low temperature response by VIGS. This discovery provides us with new ideas and methods for further understanding the cold resistance mechanism of plants.
Data availability statement
The original contributions presented in the study are publicly available. This data can be found at the National Center for Biotechnology Information (NCBI) using accession number PRJNA498759.
Author contributions
YL: Conceptualization, Formal analysis, Methodology, Visualization, Writing – original draft, Writing – review & editing, Data curation, Investigation, Funding acquisition, Resources. JZ: Data curation, Formal analysis, Investigation, Methodology, Visualization, Writing – original draft, Writing – review & editing. JX: Formal analysis, Writing – review & editing. XZ: Conceptualization, Writing – original draft. ZX: Conceptualization, Data curation, Formal analysis, Investigation, Methodology, Writing – original draft, Resources, Writing – review & editing. ZL: Conceptualization, Data curation, Formal analysis, Funding acquisition, Investigation, Methodology, Writing – original draft, Writing – review & editing, Project administration, Resources.
Funding
The author(s) declare financial support was received for the research, authorship, and/or publication of this article. This study was supported by grants from the STI2030- Major Projects (No.2023ZD04038-02), the National Natural Science Foundation of China (No. 31560074), the Major Science and Technology Program of Changji Hui Autonomous Prefecture (No. 2021Z01-01).
Conflict of interest
The authors declare that the research was conducted in the absence of any commercial or financial relationships that could be construed as a potential conflict of interest.
Publisher’s note
All claims expressed in this article are solely those of the authors and do not necessarily represent those of their affiliated organizations, or those of the publisher, the editors and the reviewers. Any product that may be evaluated in this article, or claim that may be made by its manufacturer, is not guaranteed or endorsed by the publisher.
Supplementary material
The Supplementary Material for this article can be found online at: https://www.frontiersin.org/articles/10.3389/fpls.2024.1396666/full#supplementary-material
Supplementary Figure 1 | Quality analysis of transcriptome sequencing. (A) Correlation analysis between 12 samples. (B) Principal component analysis between 12 samples. (C) Analysis of expression patterns between 12 samples.
Supplementary Figure 2 | (A) Predictive classification of transcription factors for DEGs. (B) Analysis of AP2/ERF-ERF transcription factor expression patterns. (C) Analysis of MYB transcription factor expression patterns. (D) Analysis of bHLH transcription factor expression patterns. (E) Analysis of NAC transcription factor expression patterns.
Supplementary Figure 3 | Phosphatidylinositol signaling system analysis of 60 DEGs (FAB1, two; PIP5K, four; PTEN, two; MIMR1_2, 10; PLCD, six; CALM, 25, etc.).
Supplementary Table 1 | Primers used for qRT-PCR and VIGS.
Supplementary Table 2 | Analysis of eight photosynthetic indicators (Pn, Gs, Ci, Tr, Fv/Fm, Piabs, Fo/Fm, and Fv/Fo) in T25, T15, T10, and T4.
Supplementary Table 3 | Transcriptome sequencing data quality and genome mapping.
Supplementary Table 4 | GhPLATZ expression in the TRV:00 and TRV:: GhPLATZ plants. Analysis of electrical conductivity of TRV:: 00 and TRV:: GhPLATZ plants. Analysis of proline of TRV::00 and TRV:: GhPLATZ plants.
References
Charest, C., Ton Phan, C. (1990). Cold acclimation of wheat (Triticum aestivum): Properties of enzymes involved in proline metabolism. Physiologia Plantarum 80, 159–168. doi: 10.1111/j.1399-3054.1990.tb04391.x
Cheng, G., Zhang, L., Wang, H., Lu, J., Wei, H., Yu, S. (2020). Transcriptomic profiling of young cotyledons response to chilling stress in two contrasting cotton (Gossypium hirsutum L.) genotypes at the seedling stage. Int. J. Mol. Sci. 21, 5095. doi: 10.3390/ijms21145095
Chinnusamy, V., Zhu, J., Zhu, J.-K. (2007). Cold stress regulation of gene expression in plants. Trends Plant science. 12, 444–451. doi: 10.1016/j.tplants.2007.07.002
Colcombet, J., Hirt, H. (2008). Arabidopsis MAPKs: a complex signalling network involved in multiple biological processes. Biochem. J. 413, 217–226. doi: 10.1042/BJ20080625
Davletova, S., Schlauch, K., Coutu, J., Mittler, R. (2005). The zinc-finger protein Zat12 plays a central role in reactive oxygen and abiotic stress signaling in Arabidopsis. Plant Physiol. 139, 847–856. doi: 10.1104/pp.105.068254
Diao, P., Chen, C., Zhang, Y., Meng, Q., Lv, W., Ma, N. (2020). The role of NAC transcription factor in plant cold response. Plant Signaling Behavior. 15, 1785668. doi: 10.1080/15592324.2020.1785668
Favory, J. J., Stec, A., Gruber, H., Rizzini, L., Oravecz, A., Funk, M., et al. (2009). Interaction of COP1 and UVR8 regulates UV-B-induced photomorphogenesis and stress acclimation in Arabidopsis. EMBO J. 28, 591–601. doi: 10.1038/emboj.2009.4
Gao, W., Long, L., Zhu, L.-F., Xu, L., Gao, W.-H., Sun, L.-Q., et al. (2013). Proteomic and virus-induced gene silencing (VIGS) analyses reveal that gossypol, brassinosteroids, and jasmonic acid contribute to the resistance of cotton to Verticillium dahliae. Mol. Cell. proteomics. 12, 3690–3703. doi: 10.1074/mcp.M113.031013
Guo, X., Wei, F., Jian, H., Lian, B., Dang, X., Yang, M., et al. (2023). Systematic analysis of the NDR1/HIN1-like (NHL) family in Gossypium hirsutum reveals a role of GhNHL69 in responding to cold stress. Ind. Crops Products. 206, 117659. doi: 10.1016/j.indcrop.2023.117659
Han, X., Rong, H., Tian, Y., Qu, Y., Xu, M., Xu, L.-A. (2022). Genome-wide identification of PLATZ transcription factors in Ginkgo biloba L. and their expression characteristics during seed development. Front. Plant Science. 13, 946194. doi: 10.3389/fpls.2022.946194
He, J., Yao, L., Pecoraro, L., Liu, C., Wang, J., Huang, L., et al. (2023). Cold stress regulates accumulation of flavonoids and terpenoids in plants by phytohormone, transcription process, functional enzyme, and epigenetics. Crit. Rev. Biotechnol. 43, 680–697. doi: 10.1080/07388551.2022.2053056
Hu, X., Xie, F., Liang, W., Liang, Y., Zhang, Z., Zhao, J., et al. (2022). HuNAC20 and HuNAC25, two novel NAC genes from pitaya, confer cold tolerance in transgenic Arabidopsis. Int. J. Mol. Sci. 23, 2189. doi: 10.3390/ijms23042189
Hu, Y., Chen, J., Fang, L., Zhang, Z., Ma, W., Niu, Y., et al. (2019). Gossypium barbadense and Gossypium hirsutum genomes provide insights into the origin and evolution of allotetraploid cotton. Nat. Genet. 51, 739–748. doi: 10.1038/s41588-019-0371-5
Hussain, S., Ulhassan, Z., Brestic, M., Zivcak, M., Zhou, W., Allakhverdiev, S. I., et al. (2021). Photosynthesis research under climate change. Photosynthesis Res. 150, 5–19. doi: 10.1007/s11120-021-00861-z
Jiang, Z., Xu, M., Dong, J., Zhu, Y., Lou, P., Han, Y., et al. (2022). UV-B pre-irradiation induces cold tolerance in tomato fruit by SlUVR8-mediated upregulation of superoxide dismutase and catalase. Postharvest Biol. Technology. 185, 111777. doi: 10.1016/j.postharvbio.2021.111777
Kaur Dhaliwal, L., Gannaban, R. B., Shrestha, A., Shim, J., Kaur Mangat, P., Singleton, J. J., et al. (2021). Integrated morpho-biochemical and transcriptome analyses reveal multidimensional response of upland cotton (Gossypium hirsutum L.) to low temperature stress during seedling establishment. Plant-Environment Interactions. 2, 290–302. doi: 10.1002/pei3.10067
Kidokoro, S., Shinozaki, K., Yamaguchi-Shinozaki, K. (2022). Transcriptional regulatory network of plant cold-stress responses. Trends Plant Sci. 27 (9), 922–935. doi: 10.1016/j.tplants.2022.01.008
Kliebenstein, D. J., Lim, J. E., Landry, L. G., Last, R. L. (2002). Arabidopsis UVR8 regulates ultraviolet-B signal transduction and tolerance and contains sequence similarity to human regulator of chromatin condensation 1. Plant Physiol. 130, 234–243. doi: 10.1104/pp.005041
Knight, M. R., Knight, H. (2012). Low-temperature perception leading to gene expression and cold tolerance in higher plants. New Phytologist. 195, 737–751. doi: 10.1111/j.1469-8137.2012.04239.x
Li, Y., Chen, H., Wang, Y., Zhu, J., Zhang, X., Sun, J., et al. (2023b). Function analysis of GhWRKY53 regulating cotton resistance to verticillium wilt by JA and SA signaling pathways. Front. Plant Science. 14, 1203695. doi: 10.3389/fpls.2023.1203695
Li, N., Lin, H., Wang, T., Li, Y., Liu, Y., Chen, X., et al. (2020a). Impact of climate change on cotton growth and yields in Xinjiang, China. Field Crops Res. 247, 107590. doi: 10.1016/j.fcr.2019.107590
Li, W., Pang, S., Lu, Z., Jin, B. (2020b). Function and mechanism of WRKY transcription factors in abiotic stress responses of plants. Plants 9, 1515. doi: 10.3390/plants9111515
Li, P., Wang, M., Zhou, Y., Wu, Q., Shen, Y., Cui, Z., et al. (2023a). Freezing transcriptome analysis showed that GhZAT10 regulates freezing tolerance through a partially CBF-dependent pathway in upland cotton (Gossypium hirsutum L.). Environ. Exp. Botany. 208, 105263. doi: 10.1016/j.envexpbot.2023.105263
Lin, L., Dong, H., Yang, G., Yin, R. (2020). The C-terminal 17 amino acids of the photoreceptor UVR8 is involved in the fine-tuning of UV-B signaling. J. Integr. Plant Biol. 62, 1327–1340. doi: 10.1111/jipb.12977
Livak, K. J., Schmittgen, T. D. (2001). Analysis of relative gene expression data using real-time quantitative PCR and the 2– ΔΔCT method. methods 25, 402–408. doi: 10.1006/meth.2001.1262
Ma, Y. Z. (2023). Cold tolerance identification and metabolic mechanism analysis of cotton germplasm at seedling stage (Xinjiang, China: Shihezi University).
Mehrotra, S., Verma, S., Kumar, S., Kumari, S., Mishra, B. N. (2020). Transcriptional regulation and signalling of cold stress response in plants: An overview of current understanding. Environ. Exp. Botany. 180, 104243. doi: 10.1016/j.envexpbot.2020.104243
Podolec, R., Lau, K., Wagnon, T. B., Hothorn, M., Ulm, R. (2021). A constitutively monomeric UVR8 photoreceptor confers enhanced UV-B photomorphogenesis. Proc. Natl. Acad. Sci. 118, e2017284118. doi: 10.1073/pnas.2017284118
Raju, S. K. K., Barnes, A. C., Schnable, J. C., Roston, R. L. (2018). Low-temperature tolerance in land plants: Are transcript and membrane responses conserved? Plant science. 276, 73–86. doi: 10.1016/j.plantsci.2018.08.002
Rihan, H. Z., Al-Issawi, M., Fuller, M. P. (2017). Advances in physiological and molecular aspects of plant cold tolerance. J. Plant Interactions. 12, 143–157. doi: 10.1080/17429145.2017.1308568
Ritonga, F. N., Ngatia, J. N., Wang, Y., Khoso, M. A., Farooq, U., Chen, S. (2021). AP2/ERF, an important cold stress-related transcription factor family in plants: A review. Physiol. Mol. Biol. Plants 27 (9), 1953–1968. doi: 10.1007/s12298-021-01061-8
Shan, D. P., Huang, J. G., Yang, Y. T., Guo, Y. H., Wu, C. A., Yang, G. D., et al. (2007). Cotton GhDREB1 increases plant tolerance to low temperature and is negatively regulated by gibberellic acid. New Phytologist. 176, 70–81. doi: 10.1111/j.1469-8137.2007.02160.x
Shannon, P., Markiel, A., Ozier, O., Baliga, N. S., Wang, J. T., Ramage, D., et al. (2003). Cytoscape: a software environment for integrated models of biomolecular interaction networks. Genome Res. 13, 2498–2504. doi: 10.1101/gr.1239303
Shen, Q., Zhang, S., Liu, S., Chen, J., Ma, H., Cui, Z. Q., et al. (2020). Comparative transcriptome analysis provides insights into the seed germination in cotton in response to chilling stress. Int. J. Mol. Sci. 21, 2067. doi: 10.3390/ijms21062067
Stockinger, E. J., Gilmour, S. J., Thomashow, M. F. (1997). Arabidopsis thaliana CBF1 encodes an AP2 domain-containing transcriptional activator that binds to the C-repeat/DRE, a cis-acting DNA regulatory element that stimulates transcription in response to low temperature and water deficit. Proc. Natl. Acad. Sci. 94, 1035–1040. doi: 10.1073/pnas.94.3.1035
Sun, X., Wang, Y., Sui, N. (2018). Transcriptional regulation of bHLH during plant response to stress. Biochem. Biophys. Res. Commun. 503, 397–401. doi: 10.1016/j.bbrc.2018.07.123
Tran, L.-S. P., Nishiyama, R., Yamaguchi-Shinozaki, K., Shinozaki, K. (2010). Potential utilization of NAC transcription factors to enhance abiotic stress tolerance in plants by biotechnological approach. GM crops. 1, 32–39. doi: 10.4161/gmcr.1.1.10569
Trapnell, C., Williams, B. A., Pertea, G., Mortazavi, A., Kwan, G., Van Baren, M. J., et al. (2010). Transcript assembly and quantification by RNA-Seq reveals unannotated transcripts and isoform switching during cell differentiation. Nat. Biotechnol. 28, 511–515. doi: 10.1038/nbt.1621
Umer, M. J., Bin Safdar, L., Gebremeskel, H., Zhao, S., Yuan, P., Zhu, H., et al. (2020). Identification of key gene networks controlling organic acid and sugar metabolism during watermelon fruit development by integrating metabolic phenotypes and gene expression profiles. Horticulture Res. 7 (1), 193. doi: 10.1038/s41438-020-00416-8
Wang, X., Ding, Y., Li, Z., Shi, Y., Wang, J., Hua, J., et al. (2019). PUB25 and PUB26 promote plant freezing tolerance by degrading the cold signaling negative regulator MYB15. Dev. Cell. 51, 222–235. e225. doi: 10.1016/j.devcel.2019.08.008
Wang, Q., Du, X., Zhou, Y., Xie, L., Bie, S., Tu, L., et al. (2020a). The β-ketoacyl-CoA synthase KCS13 regulates the cold response in cotton by modulating lipid and oxylipin biosynthesis. J. Exp. Botany. 71, 5615–5630. doi: 10.1093/jxb/eraa254
Wang, L., Feng, Z., Wang, X., Wang, X., Zhang, X. (2010). DEGseq: an R package for identifying differentially expressed genes from RNA-seq data. Bioinformatics 26, 136–138. doi: 10.1093/bioinformatics/btp612
Wang, Z., Gerstein, M., Snyder, M. (2009). RNA-Seq: a revolutionary tool for transcriptomics. Nat. Rev. Genet. 10, 57–63. doi: 10.1038/nrg2484
Wang, R., Wang, X., Liu, K., Zhang, X.-J., Zhang, L.-Y., Fan, S.-J. (2020b). Comparative transcriptome analysis of halophyte Zoysia macrostachya in response to salinity stress. Plants 9, 458. doi: 10.3390/plants9040458
Wang, X., Zeng, J., Wang, Q., Xia, S., Wang, X., Zhang, J., et al. (2021). Physiological Response and Transcriptome Analysis of Cotton Leaves under Low temperature Stress at the Two-leaf Stage. Asian Agric. Res. 13, 40–47. doi: 10.22004/ag.econ.316714
Wilson, K. E., Ivanov, A. G., Öquist, G., Grodzinski, B., Sarhan, F., Huner, N. P. (2006). Energy balance, organellar redox status, and acclimation to environmental stress. Botany 84, 1355–1370. doi: 10.1139/B06-098
Xie, Y., Chen, P., Yan, Y., Bao, C., Li, X., Wang, L., et al. (2018). An atypical R2R3 MYB transcription factor increases cold hardiness by CBF-dependent and CBF-independent pathways in apple. New Phytologist. 218, 201–218. doi: 10.1111/nph.14952
Xu, Y., Magwanga, R. O., Cai, X., Zhou, Z., Wang, X., Wang, Y., et al. (2019). Deep transcriptome analysis reveals reactive oxygen species (ROS) network evolution, response to abiotic stress, and regulation of fiber development in cotton. Int. J. Mol. Sci. 20, 1863. doi: 10.3390/ijms20081863
Yamaguchi-Shinozaki, K., Shinozaki, K. (1994). A novel cis-acting element in an Arabidopsis gene is involved in responsiveness to drought, low-temperature, or high-salt stress. Plant Cell. 6, 251–264. doi: 10.1105/tpc.6.2.251
Zhang, K., Lan, Y., Shi, Y., Gao, Y., Wu, M., Xu, Y., et al. (2022). Systematic analysis and functional characterization of the PLATZ transcription factors in Moso bamboo (Phyllostachys edulis). J. Plant Growth Regul. 42, 218–236. doi: 10.1007/s00344-021-10541-w
Keywords: cotton, low-temperature stress, photosynthetic parameters, transcriptomic analysis, DEGs, VIGS
Citation: Li Y, Zhu J, Xu J, Zhang X, Xie Z and Li Z (2024) Effect of cold stress on photosynthetic physiological characteristics and molecular mechanism analysis in cold-resistant cotton (ZM36) seedlings. Front. Plant Sci. 15:1396666. doi: 10.3389/fpls.2024.1396666
Received: 06 March 2024; Accepted: 16 April 2024;
Published: 13 May 2024.
Edited by:
Yongfu Tao, Chinese Academy of Agricultural Sciences, ChinaReviewed by:
Yogesh K. Ahlawat, University of Florida, United StatesJianwei Gao, Shandong Academy of Agricultural Sciences, China
Copyright © 2024 Li, Zhu, Xu, Zhang, Xie and Li. This is an open-access article distributed under the terms of the Creative Commons Attribution License (CC BY). The use, distribution or reproduction in other forums is permitted, provided the original author(s) and the copyright owner(s) are credited and that the original publication in this journal is cited, in accordance with accepted academic practice. No use, distribution or reproduction is permitted which does not comply with these terms.
*Correspondence: Zongming Xie, xiezmchy@163.com; Zhibo Li, lzb_oea@shzu.edu.cn
†These authors share first authorship