 Kentaro Kodama
 Daichi Shimizu
 Rick Dale
 Kazuki Sekine
- 1University Education Center, Tokyo Metropolitan University, Tokyo, Japan
- 2Department of Integrated Educational Sciences, Graduate School of Education, University of Tokyo, Tokyo, Japan
- 3Department of Communication, University of California, Los Angeles, Los Angeles, CA, United States
- 4Faculty of Human Sciences, Waseda University, Saitama, Japan
An emerging perspective on human cognition and performance sees it as a kind of self-organizing phenomenon involving dynamic coordination across the body, brain and environment. Measuring this coordination faces a major challenge. Time series obtained from such cognitive, behavioral, and physiological coordination are often complicated in terms of non-stationarity and non-linearity, and in terms of continuous vs. categorical scales. Researchers have proposed several analytical tools and frameworks. One method designed to overcome these complexities is recurrence quantification analysis, developed in the study of non-linear dynamics. It has been applied in various domains, including linguistic (categorical) data or motion (continuous) data. However, most previous studies have applied recurrence methods individually to categorical or continuous data. To understand how complex coordination works, an integration of these types of behavior is needed. We aimed to integrate these methods to investigate the relationship between language (categorical) and motion (continuous) directly. To do so, we added temporal information (a time stamp) to categorical data (i.e., language), and applied joint recurrence analysis methods to visualize and quantify speech-motion coordination coupling during a rap performance. We illustrate how new dynamic methods may capture this coordination in a small case-study design on this expert rap performance. We describe a case study suggesting this kind of dynamic analysis holds promise, and end by discussing the theoretical implications of studying complex performances of this kind as a dynamic, coordinated phenomenon.
Introduction
Recent theoretical and empirical work in cognitive science has argued that we cannot separate cognition from the body and its environment. In any complex performance, these dimensions are interdependent (e.g., Anderson et al., 2012; Riley et al., 2012). This notion is called embodiment, or situated cognition (Chemero, 2009). From the viewpoint of embodiment, cognitive processes related to language and communication interact with bodily motion and behavior (e.g., Glenberg and Kaschak, 2002; Clark, 2006; Richardson et al., 2008; Chemero, 2009; Shockley et al., 2009; Zwaan, 2014). We can thus consider language specifically, and cognition in general, as sustained by a complex pattern of interaction among brains, bodies and environments (see recent review and discussion in Favela and Chemero, 2015).
The role of gesture in communication illustrates these theoretical ideas. Research in this area has shown that the body is not only connected to cognitive processes, but also to linguistic processes (Kita and Özyürek, 2003). Since McNeill (1992) found the significant relationships between gestures and speech, both in production and comprehension, the number of studies on speech and gesture has increased. Previous research has shown that gestures facilitate the speaker’s speech process, and evidence for intrapersonal synchronization of speech rhythms and hand movements (Chui, 2005). For example, when participants were asked to not move their hands while speaking, the proportion of unfilled pauses (Graham and Heywood, 1975) or fillers (Rauscher et al., 1996) increased. These findings suggest that speech is closely linked to meaningful hand movements.
A fundamental open challenge in this area is to understand how complex human performances, such as musical or linguistic performances, involve coordination among very different measurements. For example, language is often measured at an abstract (categorical) level, focusing on verbal forms described as symbols ordered in time. Bodily movement, whether in dance or other musical performance, can often be measured using automatic tracking or analysis, granting researchers scalar (continuous) time series (for review see Richardson et al., 2014). A common technique to link these types of measurements is to aggregate movement data and superimpose them on language categories (e.g., words, sentences) to explore their relationships (a “temporally aggregative” method: Coco and Dale, 2014). An alternative approach would be to preserve the dynamic qualities of each type of measure, and use new analytic tools that can link these dynamics. But this poses a challenge—language and body are often measured at different timescales (one abstract, word based; the other with continual sampling). In this short paper, we summarize a technique that can integrate language data with continuous body motion data and shed some light on how they are coordinated. We then showcase a small-scale case study of expert lyrical performance, in particular an expert rap performance, to demonstrate the promise this method may hold for future research. We end by summarizing future applications of this method, and its promise for contributing to new theoretical developments in various domains of human performance.
We look to methodologies developed under a particular theoretical framework, one designed to embrace the dynamic nature of human cognition and performance. The dynamical systems approach (DSA) has been widely applied to human movement science, developmental psychology, and cognitive science (Chemero, 2009; Richardson et al., 2014). Compared to a traditional approach, which focuses on internalized computation in the brain, DSA focuses more on interactions among the body (including the brain), environment, and task. The DSA has provided both a theoretical framework and analytical tools based on the study of non-linear dynamical systems (e.g., Van Orden and Riley, 2005). In this domain, a particular methodology called recurrence quantification analysis (RQA) has been used to flexibly analyze dynamic measurements of all sorts. It has few statistical assumptions, and few constraints on the kind of time series that is analyzed (Zbilut and Webber, 1992). For this reason, it seems especially well suited to dynamically integrated distinct types of temporal data.
RQA is based on quantifying a visualization called the recurrence plot (RP). A RP is a two-dimensional graph visualizing recurring patterns of a dynamical system. The plot is essentially a matrix of (i, j) entries in which these matrix elements correspond to those times i and j at which a state of a dynamical system recurs in the space of its overall behaviors (Marwan et al., 2007). This recurrence (or “revisitation”) is assessed numerically by comparing a time series to itself over time. Consider the idea of human dance or other performance. At a given time i the human body will be in a particular configuration. If at time j the human body is in a similar configuration (e.g., measured with Euclidean distance), then we count (i, j) as a point on the RP. The overall RP is thus a visualization of the tendency for a system to “come back” to its various positions over time. It is an advanced technique of non-linear data analysis and was originally developed in the fields of descriptive statistics and chaos theory (Eckmann et al., 1987) and promptly thereafter applied to physiological signals (Webber and Zbilut, 1994).
RQA is a suite of tools for quantifying the extent and duration of these recurrences in the RP system (Marwan et al., 2007). It was originally developed to uncover subtle time correlations and repetitions of patterns. RQA can provide researchers with some useful measures to quantify self-organizing dynamical system behavior. For example, it can capture how deterministic or periodic a process is by the orderliness of how points (i, j) fall on straight lines. These lines reflect sequences of revisited behavior. In contrast, RPs with very little structure, and the appearance of “TV noise,” reflect a dynamical system that is behaving in a random or unstructured way.
RP and RQA have been applied to both continuous data (for example, a numeric value obtained by sensor devices) and categorical data (for example, a letter or word sequence in literature pieces) (Coco and Dale, 2014). Louwerse et al. (2012) applied Categorical RQA to both verbal and non-verbal behaviors (Louwerse et al., 2012). They categorized verbal data like dialog moves and the words they contain, and also categorized non-verbal data such as gesture and facial expression by coding them into discrete categories (e.g., iconic gesture or smile). For such categorical or coded data, they added temporal information (i.e., time stamp) at 4 Hz and applied Categorical RQA. Although they addressed with communication behavior including verbal data, they did not use continuous data or integrate categorical data with continuous data. Walton et al. (2018) applied Categorical RQA to musical performance data (Walton et al., 2018). They generated categorical time series of the key and press timing pressed by keyboard players using the MIDI device and added temporal information (i.e., time stamp) at 96 Hz. Although they applied Categorical RQA for these musical performance data and Continuous RQA for body movement data, they did not integrate them.
These previous studies are important and suggestive in terms of extending Categorical RQA by adding temporal information. However, most previous studies have applied these recurrence methods (categorical or continuous) separately. We aimed to integrate the two different types of information within the same recurrence analytical framework in order to visualize and quantify such different kind of time series data like verbal (categorical) and non-verbal (continuous) behaviors (e.g., speech-action coordination/coupling).
For this purpose, we developed the categorical recurrence analysis and applied the joint recurrence analysis methods (see “Data Analysis” section under “Materials and Methods”). If these can be integrated within the same analytical framework, recurrence analysis can be extended widely to visualize and quantify various complex phenomena in cognitive science. As a first attempt to explore such a possibility, the current pilot study focused on a speech-motion coordination/coupling during a rap performance. Because rap or hip-hop music has a relatively obvious rhythm structure, and because mind-body coordination/coupling is important in rapping behavior, we assumed that this relationship would be relatively easy to extract using recurrence methods. Our single-case study thus illustrates the feasibility of this alignment of time series types.
Materials and Methods
Participant
A professional rapper (Japanese male, 30 years old, right-handed, native language is Japanese) participated in our experiment. He has more than 15 years of rapping experience and was the champion of a national freestyle rap battle. He has also released his recordings as a professional musician. The participant signed an informed consent form, agreeing to participate in this study.
Apparatus
We used a 3D motion capture system (OptiTrackFlex13, Natural Point, Inc.) to measure the participant’s body movements (sampling frequency was 120 Hz) (Figure 1). Twelve reflective markers were attached to the participant’s body (head, both shoulders, both elbows, both wrists, hip, both knees, and both toes). We used Motive (Natural Point) to process the time series data, MATLAB (R2017b, MathWorks) and RStudio (1.1.423) to analyze the data. We also used a video camera (HDR-PJ720, Sony) (frame rate of 50 FPS) and a headset microphone (Hafone) (sampling rate of 44 kHz). To analyze the audio data, we used Audiacity (2.2.2) after down-sampling at 25 FPS.
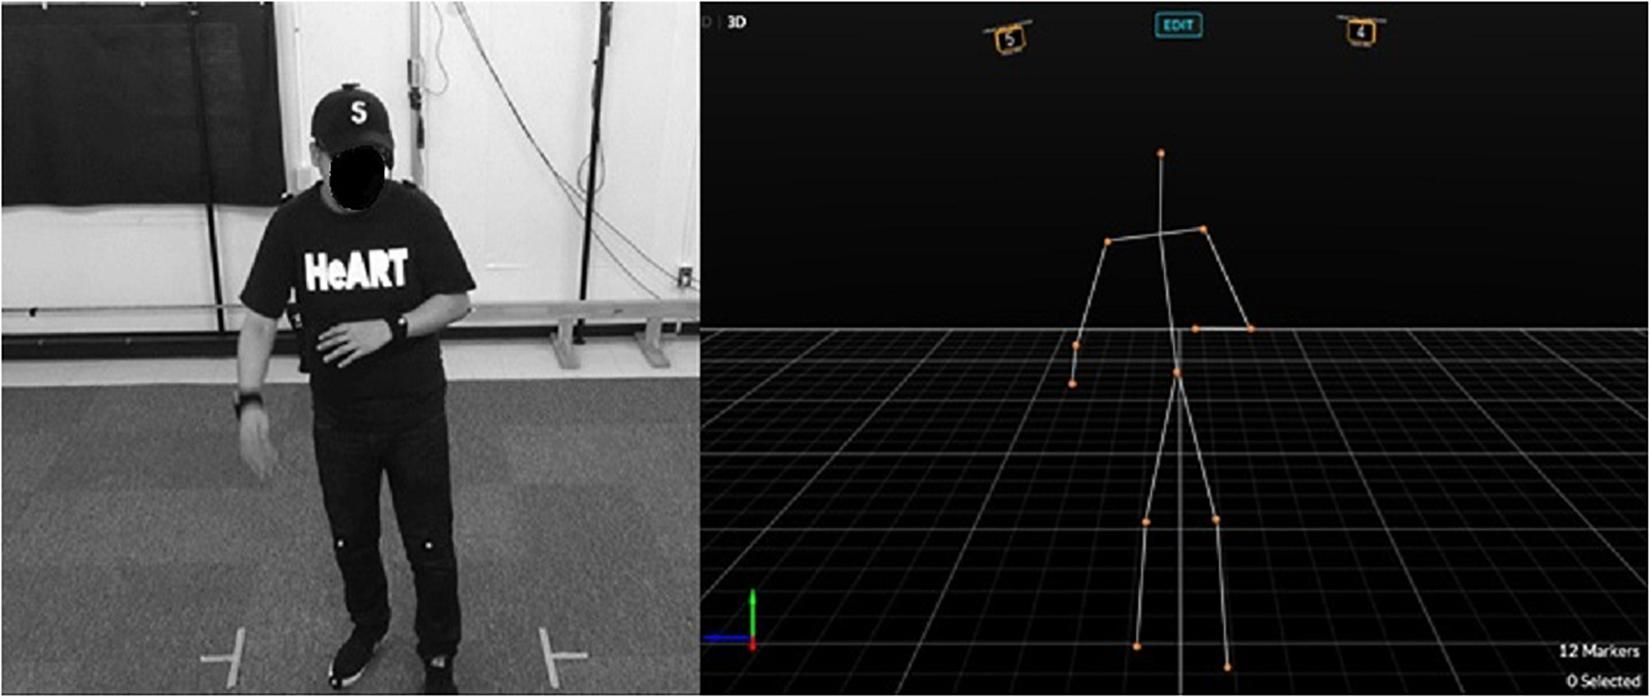
Figure 1. An experimental situation and the motion capture system (from Kodama et al., 2019).
Procedure
We required a professional rapper to perform parts of a rap song in Japanese, which included an Introduction, Verse, and Hook. This performance provided data for the analysis, and totalled approximately 1 min. Before recording, we attached 12 reflective markers and a microphone to his body, and we asked him to stand in front of the camera. We then instructed him to perform naturally, as if he were presenting a live performance. After sound checking, we started the recording. In this paper, we report the results of our analysis of part of that segment of his performance (from the first Verse and Hook).
Data Analysis
To visualize and quantify the rhythmic structure and coordinated behavior between the rap (speech) and body movement (motion), we applied recurrence analyses (for tutorials, refer to Webber and Zbilut, 2005; Wallot, 2017). We briefly describe these recurrence methods, and we introduce the joint recurrence method (Marwan et al., 2007) to integrate them as described in the following paragraph.
In the case of continuous data, time series data are embedded, their trajectory is reconstructed in a higher dimensional phase space, and the distances between all possible combinations of each vector are calculated and distributed within a distance matrix (Webber and Zbilut, 2005). All elements in the distance matrix with distances at or below a threshold (i.e., radius) are said to be recurrent (recurrence point) and are included in the recurrence matrix, while all other elements are excluded from it. Such calculations and definitions are used to construct a recurrence plot (RP), a method of visualization that shows the dynamic properties and temporal patterns of the system as a two-dimensional representation (Eckmann et al., 1987). A recurrence quantification analysis (RQA) allows researchers to quantify and assess the properties of a dynamical system, based on RP or the phase space trajectory (more detail in Webber and Zbilut, 2005). This study reported four of the most common RQA measures, namely, the recurrencerate (RR), percent determinism (DET), maxline (maxL) and mean line (L). RR is the density (percentage) of recurrence points in a RP; DET is the percentage of recurrence points forming diagonal lines in the recurrence plot given a minimal length threshold; maxL is the length of the longest diagonal line; L is the average of the diagonal line’s length (Coco and Dale, 2014). The units of these lines are indicated in time (e.g., seconds). If the length of these lines is long, it means that the system repeats the same state persistently for a long time. These measures have been interpreted as indexes related to stability or complexity of human motor/posture systems (e.g., Riley et al., 1999; Pellecchia et al., 2005).
In this study, we used only the hip and right wrist movements data in a vertical direction as continuous data, because the hip position can be considered as a collective index of whole-body movement at the macro scale (Shockley et al., 2003) and the right hand movement can be interpreted as a specific index of rap-related rhythmic movement at the micro scale (i.e., gestures: Almeida and Sousa, 2019). After each time series was smoothed, it was then downsampled at 25 Hz to integrate it with the categorical data.
In the case of categorical data, researchers generally need not embed the data in a phase space, but to define the level or unit of analysis (e.g., a word or letter). Each unit is converted into numeric categorical sequence (e.g., a→1, b→2, c→3, …). Researchers can create a recurrence point when the two series (original and self-copied sequential series) share the same state (i.e., the same word/letter) in time. Thus, the same RQA measures can be calculated and they provide meaningful indexes that can be considered dynamic natural language processing. For example, determinism (DET) reflects how sequences of behaviors are repeating, and so relates to a data set’s compressibility ratio; recurrence rate (RR) reflects how often single behaviors are repeating, and so is related to co-occurrence (see Dale et al., 2018).
We obtained sequential data by analyzing the lyrics and converting each voice unit into a Japanese vowel (a/i/u/e/o), a syllabic nasal (n), or an assimilated sound (x). We chose a vowel as a main unit of analysis, because rap lyrics tend to rhyme (match rhyming words at vowel level) more often in hip-hop music, generally. We then categorized vowels into numbers as follows: a(1), i(2), u(3), e(4), o(5), n(6), and x(7). To analyze the audio data, we imported the audio file into a software (Audacity: version 2.0, The Audacity Team), played the voice at each frame (25 FPS), judged how the voice sounded, and coded with the above categories by coders. If there was no voice, we categorized the frame into no-voice (0); if there was a voice, we categorized it according to each vowel, a syllabic nasal, or an assimilated sound as described above (1, 2, 3, 4, 5, 6, 7). After categorization, we obtained two categorical data: first, sequential data of seven categories without any time information, and, second, time series data that included temporal information (i.e., a time stamp at 25 Hz) using eight categories from 0 to 7, as shown above.
The joint recurrence analysis was used to analyze two physically different time series (Marwan et al., 2007). A joint recurrence point can be considered as joint probability in which both systems have simultaneous recurrence points (more detail in Marwan et al., 2007). A joint recurrence plot (JRP) is a graph that shows all those times at which a recurrence in one dynamical system occurs simultaneously with a recurrence in a second dynamical system. In other words, the JRP is the Hadamard product of the recurrence plot of two systems (Marwan et al., 2007). That means only recurrence points contained in both RPs keep being plotted (i.e., IfRPAi,j = 1 and RPBi,j = 1, then JRPABi,j = 1,i,j = 1,,N), but in other cases which one or none of both RPs recur, no recurrence points appear (i.e., IfRPAi,j = 1 and RPBi,j = 0, or RPAi,j = 0 and RPBi,j = 1, or RPAi,j = 0 and RPBi,j = 0, then JRPABi,j = 0, i,j = 1,,N). JRPs capture the commonalities between two systems (i.e., signals or time series) as coinciding instances of recurrence between the individual RPs of those systems (Wallot et al., 2016). First, each RP is constructed for each system, then their JRP can be computed by joining the plots together, so that common instances of recurrences are kept, but different instances between the two RPs are discarded (Wallot et al., 2016). Joint RQA (JRQA) measures such as RR and maxL as explained above (in Data Analysis) can be calculated from the JRP in the same way as auto/cross RQA. Originally, the joint method was proposed for two continuous time series, which can recur simultaneously in their individually reconstructed phase spaces, to compare two physically different systems at different units or dimensions. We extended this to compare continuous (motion) data with categorical (rap) data. Thus, the joint method extracts JRQA measures from JRPs by preserving only the points recurring in both categorical and continuous plots.
We conducted a surrogate data test using a random shuffle data set (Kantz and Schreiber, 2003), to confirm that RQA measures calculated from our original data set deviated from an underlying baseline (randomized) distribution. By comparing output measures from the original data set with those from the randomly shuffled surrogate data set under same input parameter settings, we can statistically verify that RQA measures are not consistent with the trends in this baseline (Shockley et al., 2003; Athreya et al., 2014).
We performed recurrence analyses using the MATLAB toolbox “CRP TOOLBOX,” version 5.22 (Marwan and Kurths, 2002), and the R package “crqa,” version 1.0.9 (Coco and Dale, 2014). We determined the optimal values for input parameters with reference to the standard guidelines for the RQA method (Webber and Zbilut, 2005; Marwan et al., 2007) using average mutual information (Fraser and Swinney, 1986) for determining the delay (i.e., finding the first minimum in mutual information) and false nearest neighbor method (Kennel et al., 1992) for determining the dimension by increasing it in integer steps until the recruitment of nearest neighbors becomes unchanging (Webber and Zbilut, 2005). The radius was chosen so that any RR values in the dataset should not be zero or too high percent and also should obtain robust results (for more details, see Webber and Zbilut, 2005). As a result, for continuous data, we chose parameters of 10 for time delay, 3 for embedding dimensions, and 0.75 for the radius with z-score normalization, while for categorical data, we input 1 for time delay and embedding dimensions, and 0.001 for the radius. To align the data lengths between categorical and continuous time series, we removed last 20 points from categorical data because 20 points were lost from continuous data by embedding it into the three-dimension (m = 3) phase space consisted of original and two10 delayed (d = 10) time series (i.e., (m− 1)∗d = 20).
Results
Categorical Recurrence Plot: Rap Data
Figure 2A shows the categorical RP (CaRP) of the lyrics of the current rap song generated by the standard procedure (with neither temporal information nor a time stamp). Here, we report the partial result of analysis of the tune, the first Verse and the Hook. We indicated three phases consisting of the first part of the Verse (Phase 1), the latter part of the Verse (Phase 2), and the Hook by adding two blue lines (see Figure 2A). Using vowels as a unit of analysis, the lyric consisted of 359 units (Phase 1: 124, Phase 2: 129, Hook: 106). The CaRP does not exhibit a random dot distribution, but a structured pattern across the phases.
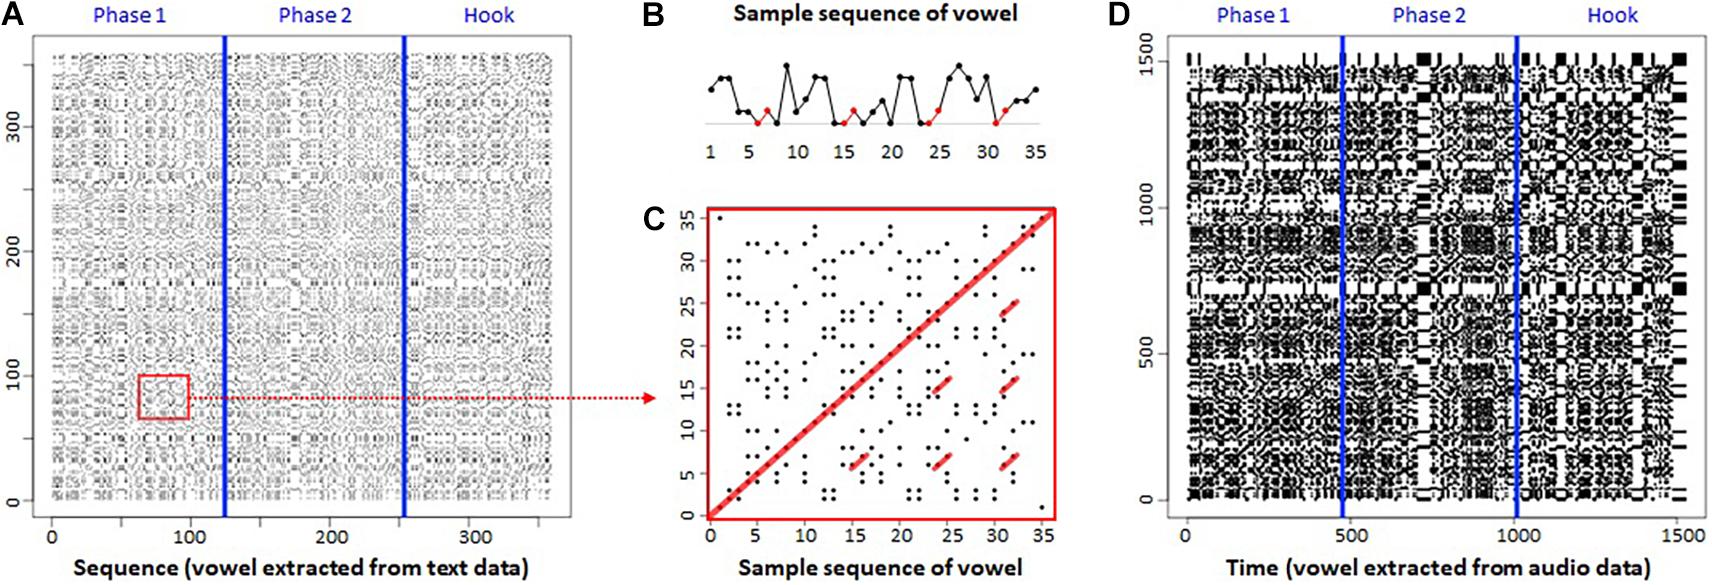
Figure 2. Categorical recurrence plot (CaRP) of rap. (A) Standard CaRP. (B) Sample sequence of vowel. (C) Part of CaRP. (D) Proposed CaRP. Both x- and y-axes represent sequence or time series.
Figure 2B presents a sample sequence of vowel units, while Figure 2C shows its CaRP, extracted from Figure 2A (red square). Red circle markers in Figure 2B indicate repetition (i.e., rhyming) of the same vowel units (i.e., a–i) four times in part of the lyric. The same part appears in Figure 2C as red lines parallel to the diagonal line in the center of CaRP. These parallel diagonal line structures can be interpreted as a rhyming structure, which appeared temporally. These results illustrate that CaRP can provide a visualization of rhyming structure in musical lyrics.
Figure 2D presents the proposed transformation on CaRP that contains temporal information (i.e., a time stamp at 25 Hz). It has 1,527 points (25 Hz, approximately 60 s) including vowels and a no-voice zero value. Accordingly, it is possible that the same value (e.g., “a”) can appear successively; for example, “a” can repeat 25 times if the voice stays for 1 s. By adding such temporal information as a time stamp, we integrated categorical data with continuous data within the same framework (joint recurrence analysis), as discussed below. At a glance, this proposed transformation appears to reveal more obvious structured patterns than the standard method, comparing Figures 2A,D. For example, the transition point where the phase changed, or which was a break and pause in the tune, can be observed as a white band that indicates a no-voice state (Figure 2D). These characteristics seem to express the original music (rap performance) and its temporal structure more clearly.
Our results show that CaRPs can extract a repetitive structure or recurrence pattern of the lyric and rap performance. The proposed method can visualize the RPs in a more informative way by including temporal information.
Continuous Recurrence Plot: Motion Data
Figure 3A represents the continuous RP (CoRP) of hip motion in the vertical direction. Blue lines separate the phases again. We assumed that the vertical hip motion could represent whole-body rhythm. The CoRP shows a recurrence pattern at the macro level, with clearly exhibited patterns that deviate from a random dot distribution of an RP based on randomized data. In each phase, recurrence points are shown as a whole-body beat rhythm repeatedly. Furthermore, a similar recurrence structure can be found in the red areas (i.e., Phase 1-Phase 2, Phase 1-Hook, and Phase 2-Hook). These results suggest that the participant beat out a rhythm with whole-body movement and that similar/common rhythm patterns can be found across the phases.
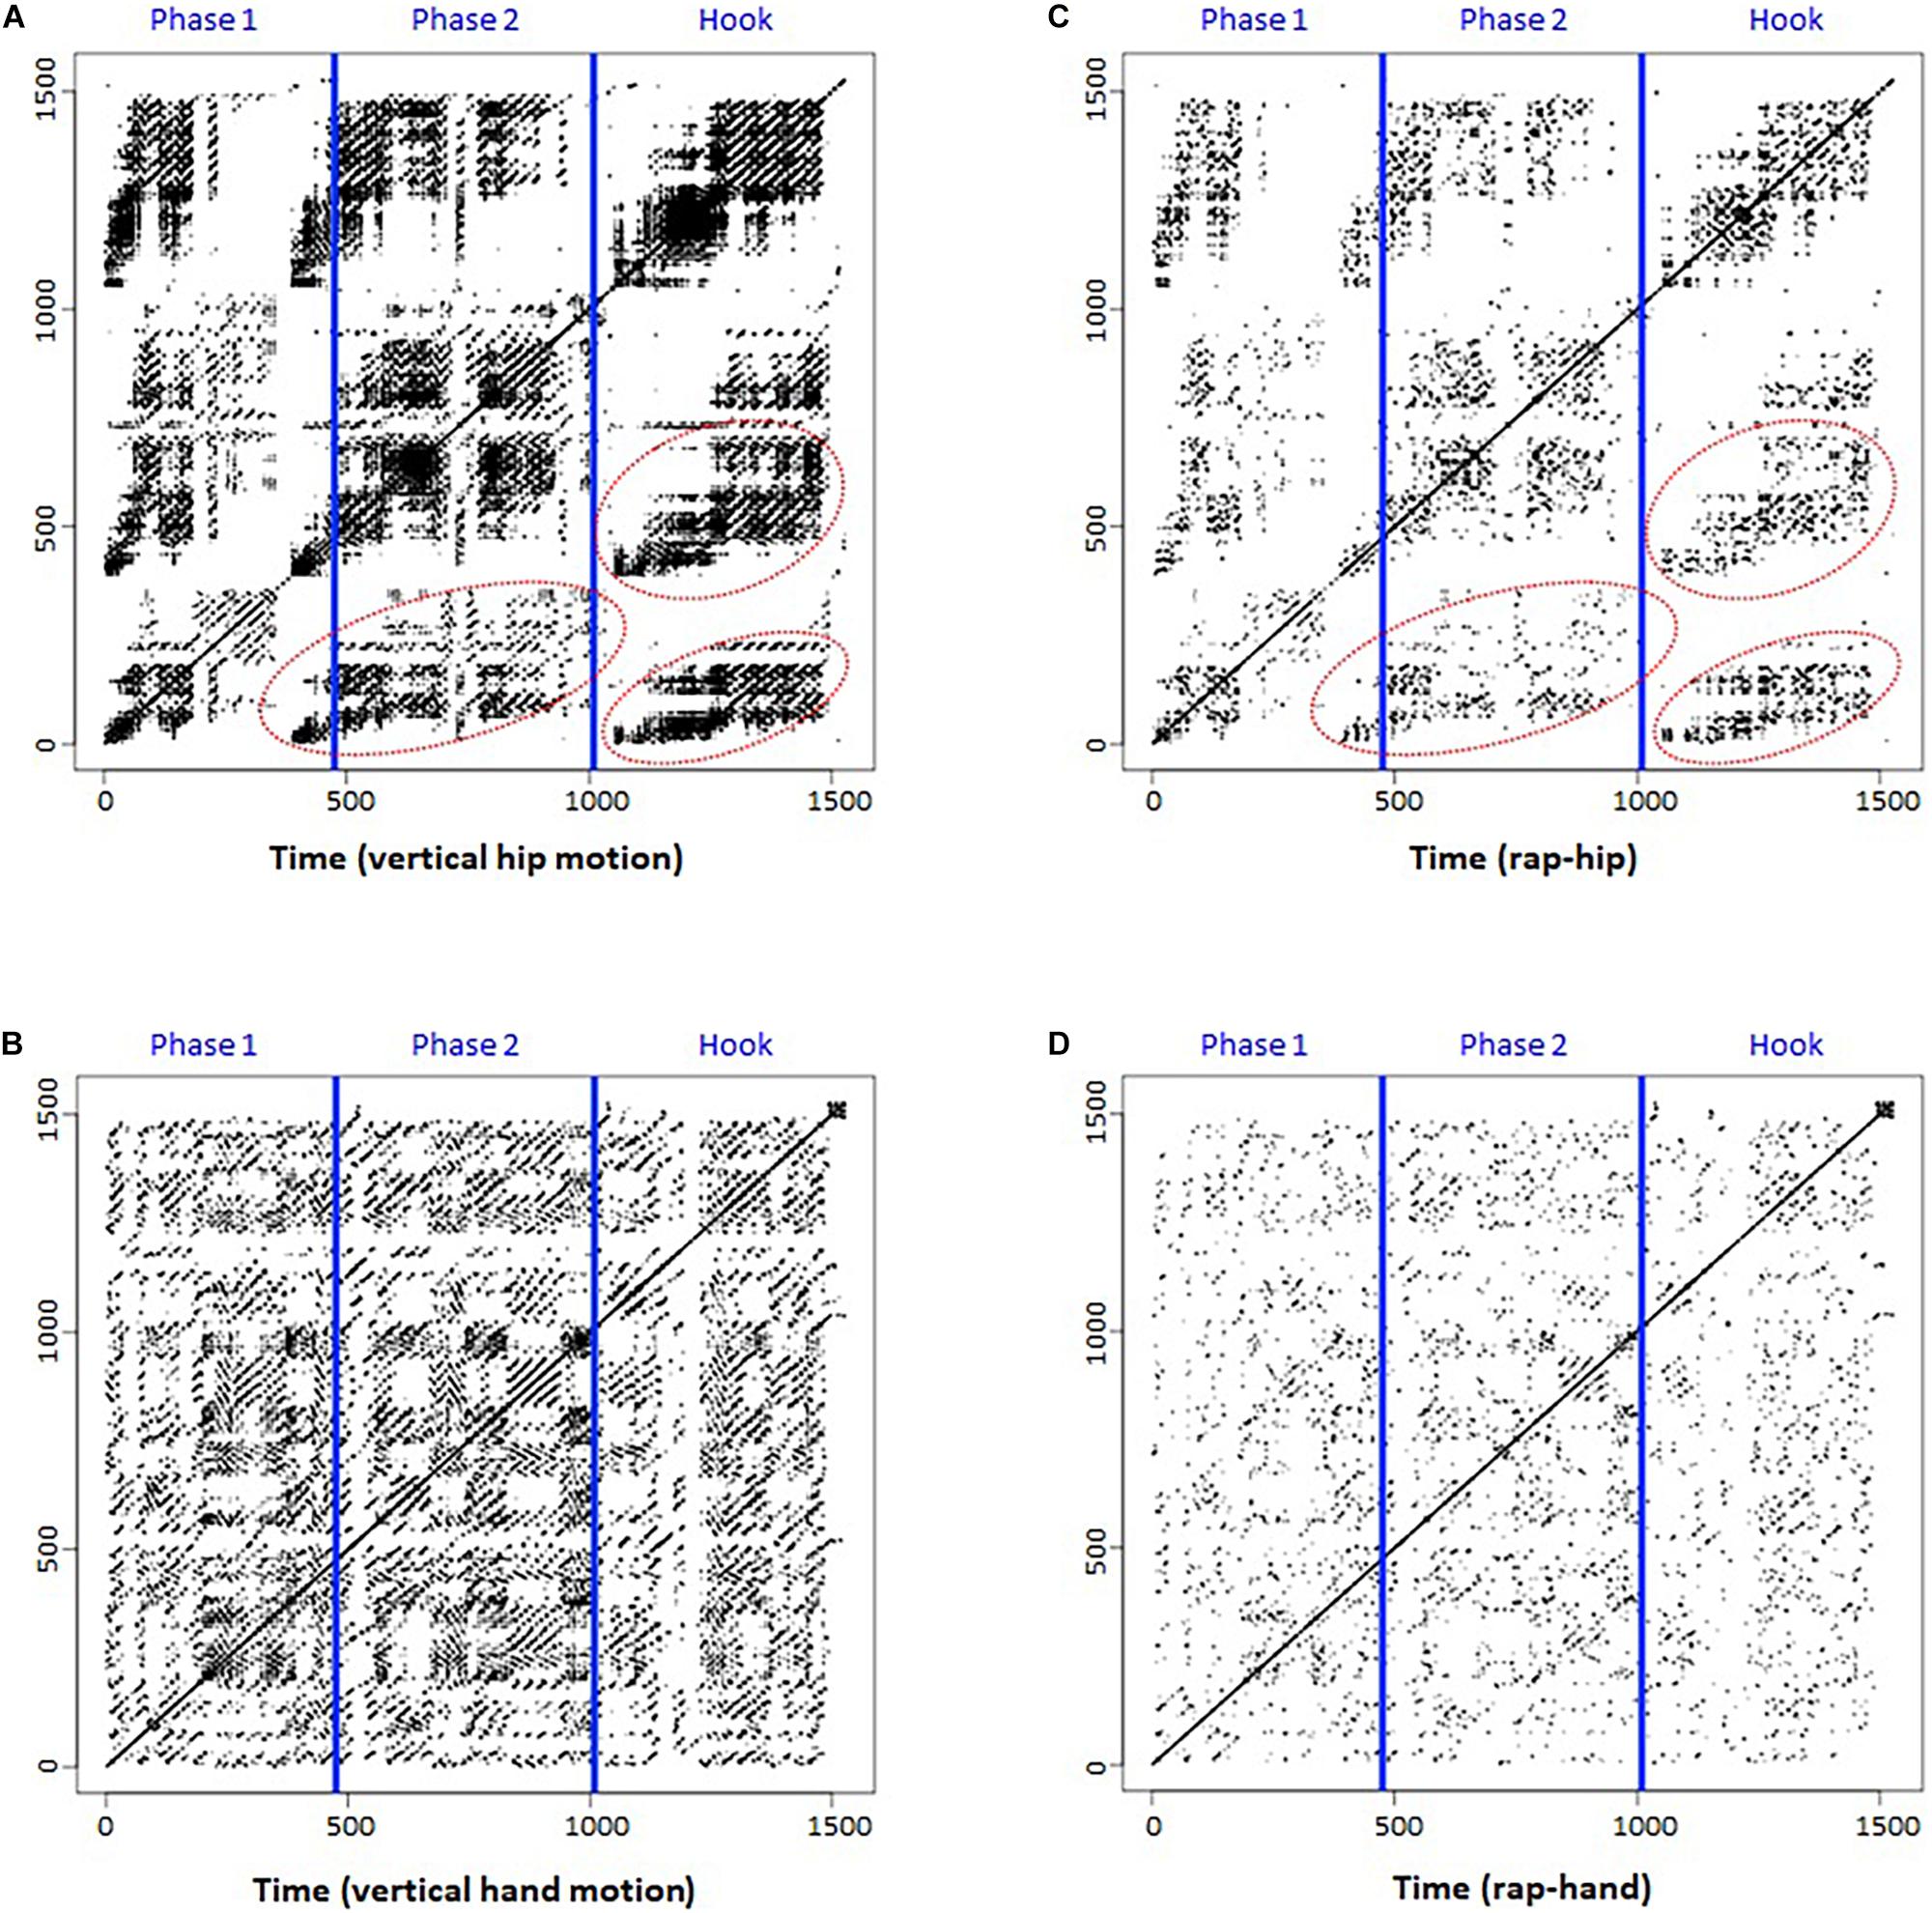
Figure 3. Continuous recurrence plot (CoRP) of rap and Joint recurrence plot (JRP). (A) CoRP of hip. (B) CoRP of hand. (C) JRP of rap-hip. (D) JRP of rap-hand. Both x- and y-axes represent time series.
Figure 3B shows the CoRP of hand (i.e., right wrist) motion in the vertical direction. Blue lines separate the phases again. We chose the right wrist marker motion for analysis, because the participant was right-handed and showed specific hand movements, such as beating or gesturing, during the rap performance. Compared with hip motion, hand motion seemed to be more closely related to rap performance and to have a high frequency. As a result, its RP (Figure 3B) shows a more detailed recurrence pattern at the micro level than that in Figure 3A.
Joint Recurrence Plot
Figures 3C,D depict the joint RP (JRP) of rap-hip coordination and rap-hand (i.e., right wrist) coordination. Blue lines separate the phases again. Compared to the CoRP of hip motion (Figure 3A), the JRP of rap-hip coordination seems to hold a common recurrence pattern at the macro level (red circles in Figure 3C). This suggests that the whole-body rhythm was coupled with rap rhythm. Similarly, the JRP of rap-hand coordination (Figure 3D) seems to hold a common recurrence pattern with the RP of hand motion at the micro level (Figure 3B). This can also be considered rap-hand coupling. Comparisons between Figures 3A,C, and between Figures 3B,D provided an impression that the latter plots (JRPs) look like the attenuated versions of the former plots (Continuous RPs). This means that the JRPs hold only the plots which both rap and motion recur and the other plots of each RP (i.e., rap and motion) disappear because the plot shown in only one of each RP is removed by conducting joint method. These results indicate that JRPs can visualize speech-motion coupling during rap performance.
Recurrence Quantification Analysis
Table 1 shows the results of RQA. It presents the RQA measures (RR, DET, maxL and L) of rap (standard and proposed), motion (hip and hand), and joint (rap-hip and rap-hand) calculated by categorical, continuous and joint RQA, respectively. It also provides RQA measures’ values (from minimum to maximum values) obtained from surrogate data test under each original measure shown in gray rows.
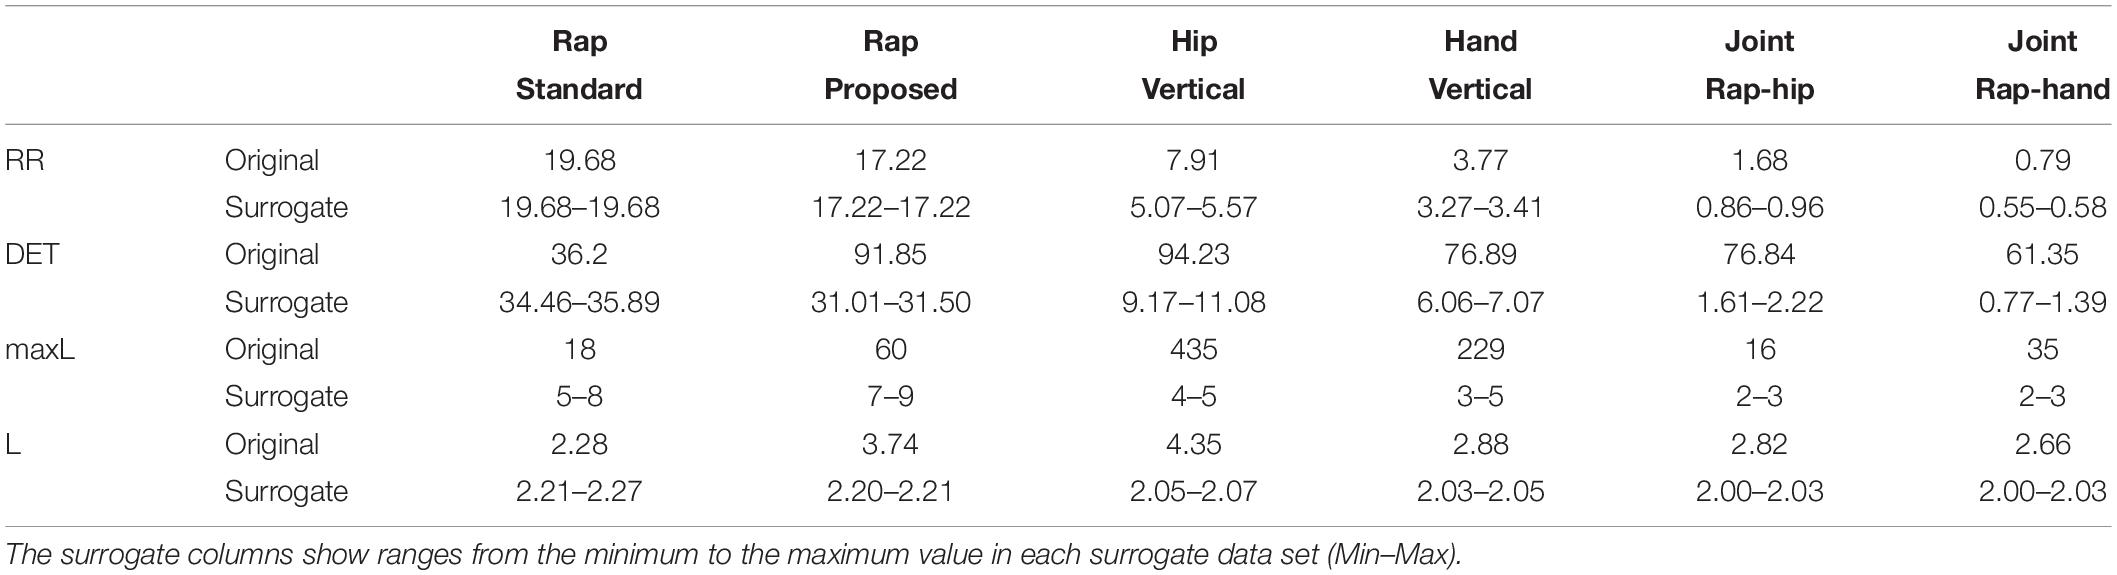
Table 1. Recurrence quantification analysis measures.
Categorical RQA
The proposed method provided higher values in DET, maxL and L than the standard method. This came as a result of adding temporal information at 25 Hz, because it can realize successive values. In particular, higher values in these diagonal-related measures (DET, maxL and L) suggest that the proposed method can extract more real temporal structure of the lyrics.
Continuous RQA
The total hip RQA measures were higher than hand RQA measures. These results suggest that the participant maintained a stable whole-body rhythm, although he moved his dominant hand rhythmically, but in a complicated manner, synchronizing with the rap lyric and beat during rap performance. To address this possibility, the relationship between hand movement (e.g., gesture) and rap lyrics can be researched in more detail in future studies of this particular kind of performance. It is added here only as an intriguing possibility.
Joint RQA
The joint method extracts JRQA measures from JRP by preserving only the points recurring in both categorical and continuous plots. Therefore, JRQA measures indicate the co-occurring or co-varying features of two fundamentally different types of data, which cannot be extracted by either individual method alone (i.e., categorical or continuous). Comparing the JRQA results with each RQA result (rap itself or motion itself) showed that the former measures were lower than the latter measures because the joint method preserve only the point where both time series recurred. The diagonal-related measures (DET, maxL and L) again remained high, suggesting that the current joint method could extract temporal structure of rap performance in terms of speech-motion coupling. While RR and DET were higher in rap-hip coordination than in rap-hand coordination, interestingly, maxL was higher in rap-hand coordination than in rap-hip coordination. This suggests that hand movement is likely to couple with rap performance more sustainably and is involved in the content of the lyrics. We found that the right hand of the participant seemed to express the lyric contents, match with the rap tempo (e.g., beating rhythm) and correlate with rapping. Again, these are only promissory observations. The main illustration with this analysis, however, is that calculating an informative JRP is possible under the proposed CaRP.
Random Shuffle Surrogate Data Test
To confirm whether observed recurrence patterns are artifacts or not, we conducted the random shuffle surrogate data test (Kantz and Schreiber, 2003). Results revealed that RQA measures of rap data without RR were significantly higher in the original data set than the randomly shuffled data set. In the case of RR, because the categorical data of both original and shuffled data preserve the same set of data (i.e., vowels in the case of our data), the values (RR) should be the same between the original and surrogate data. On the other hand, in the case of output measures of continuous motion data and joint RQA, all measures were significantly higher in the original data set than the randomly shuffled data set. This surrogate analysis verifies that input parameters of RQA were appropriate, and that observed measures of RQA from the original data were not contained inside the distribution generated from randomization (Shockley et al., 2003; Athreya et al., 2014).
Results of Joint RP and RQA showed a possibility to visualize and quantify speech-motion coupling calculated from different kinds of data, e.g., verbal (categorical) and non-verbal (continuous), by using joint recurrence analysis method to integrate categorical data with continuous data. Comparing RQA measures between original and surrogate data supports the validity of our proposed method.
Discussion
In this paper, we introduced temporal information to the standard categorical recurrence analysis. To do this, we assigned a timestamp to symbolic codes for the rap performance. Although some previous studies have applied similar methods by adding timestamps to verbal and nonverbal or musical behaviors using recurrence analysis (Louwerse et al., 2012; Walton et al., 2018), they analyzed only categorical data or analyzed categorical and continuous data separately. The present study, however, aligned categorical and continuous time series to study the dynamics of complex human behavior in an integrated way. This alignment then permits calculation of joint recurrence analyses. Our single-case illustration shows that this approach may reveal the lyrical structure and the temporal structure (i.e., rhythm) of rapping (singing) or beat (music) itself more clearly. This is may be because the proposed timestamp assignment expands or contracts meaningful variation in the performance itself. Furthermore, we applied the joint recurrence method to integrate categorical data (rap) with continuous data (bodily motion). By employing such integration, we showed the applicability of the joint recurrence method to the investigation of the speech-motion coordination/coupling and suggested the possibility of visualizing and quantifying it.
Our current pilot study focused on hip-hop music, a music genre that has a relatively obvious rhythm and a repetitive/recurring structure (i.e., rhyme) in its lyrics, which helped us to investigate speech-motion relationship. We guessed that this relationship would be relatively easy to extract using the joint RP and RQA. Some similarities between rap dynamics and motion dynamics were found because common auditory information (i.e., a musical track) might affect these dynamics. In future studies, musical data can be transferred to time series by previous study’s method which used the key or note data (Walton et al., 2018). Then researchers can investigate the coordination/coupling relationship among lyrics, body movement and music. For gestural expression, by adopting a detailed coding used in previous study (e.g., Louwerse et al., 2012), we can obtain further insights on how performers express their lyrical and artistical contents. For linguistic features, although the present study focused on temporal information (i.e., rhythmic structure of vowels), researchers might also examine contents or meanings of lyrics by applying the conceptual RQA method (Angus et al., 2012; Tolston et al., 2019).Moreover, further investigation on when JRQA measures increase (i.e., co-occurring or co-varying point) and what happens (e.g., lyrics, gesture) at the moment within both lyrical and movement domains, would be needed to cultivate a deeper understanding of the performance.
As a methodological illustration, we analyzed only one performance in this study. Follow-up analysis is thus needed to confirm whether our specific findings are robust by collecting and analyzing further data. In application of this methodology to a much larger dataset, it would be possible to compare original data to virtual pair data of rap-motion coupling generated from other rappers’ performance data. This analysis would show that the current result was not produced by an artifact or possible random matching in terms of surrogate data method (Shockley et al., 2003). It would broaden the applicability of the joint method that integrates categorical data (rap) with continuous data (motion).
Although the present study focused on an intrapersonal coordination between speech and motion, interpersonal coordination across participants can also be examined within the same framework as investigated by previous studies that have applied the recurrence analysis to various joint action tasks (e.g., Fusaroli et al., 2014; Shockley and Riley, 2015).
The proposed method could be applied to not only ready-made songs but also improvisational freestyle performance, including various music genres. Improvisational performance is more like everyday social interaction, in the sense that it also has complex aspects emerging from real-time interaction (Walton et al., 2018). The dynamical methods (e.g., recurrence analysis) are also expected to reveal the creative process in detail using more advanced techniques (e.g., the windowed sliding method; Coco and Dale, 2014; Kodama et al., 2018). We also aim to apply the framework not only to experimental situations but also to more ecological situations, such as the practical field of artistic performance, natural daily interaction (D’Ausilio et al., 2015; Dale, 2015; Sekine and Kita, 2015; Shimizu and Okada, 2018) and clinical interaction in psychological and medical fields (Zivotofsky and Hausdorff, 2007; Nagaoka and Komori, 2008; Ramseyer and Tschacher, 2011; Goldstein et al., 2020) involving speech-motion coordination in the future.
Data Availability Statement
The original contributions presented in the study are included in the article/Supplementary Material, further inquiries can be directed to the corresponding author/s.
Ethics Statement
The studies involving human participants were reviewed and approved by the Research Ethics Committee of the Kanagawa University. The patients/participants provided their written informed consent to participate in this study.
Author Contributions
KK, DS, and KS designed this study, acquired and analyzed the data, and wrote the manuscript. RD contributed to data analysis and manuscript drafting. All authors have read and approved the final manuscript.
Funding
This study was supported by the Japan Society for the Promotion of Science (JSPS), Grant-in-Aid for Scientific Research (C) No. 18KT0083.
Conflict of Interest
The authors declare that the research was conducted in the absence of any commercial or financial relationships that could be construed as a potential conflict of interest.
Acknowledgments
We would like to thank two Japanese professional rappers, Darthreider and TKdakurobuchi, for collaborating with us and participating in our experiment. This work was based on the previous presentation in the annual meeting of the cognitive science society CogSci2019.
Supplementary Material
The Supplementary Material for this article can be found online at: https://www.frontiersin.org/articles/10.3389/fpsyg.2021.614431/full#supplementary-material
References
Almeida, M., and Sousa, B. (2019). “Gestures in hip-hop video-clips: a cross-cultural approach,” in Recent Perspectives on Gesture and Multimodality, eds I. Galhano-Rodrigues, E. Z. Galvão, and A. Cruz-Santos (Newcastle upon Tyne: Cambridge Scholars Publishing), 96–112.
Anderson, M. L., Richardson, M. J., and Chemero, A. (2012). Eroding the boundaries of cognition: implications of embodiment. Top. Cogn. Sci. 4, 717–730. doi: 10.1111/j.1756-8765.2012.01211.x
Angus, D., Smith, A. E., and Wiles, J. (2012). Human communication as coupled time series: quantifying multi-participant recurrence. IEEE Trans. Audio Speech Lang. Process. 20, 1795–1807. doi: 10.1109/TASL.2012.2189566
Athreya, D. N., Riley, M. A., and Davis, T. J. (2014). Visual influences on postural and manual interpersonal coordination during a joint precision task. Exp. Brain Res. 232, 2741–2751. doi: 10.1007/s00221-014-3957-2
Chui, K. (2005). Temporal patterning of speech and iconic gestures in conversational discourse. J. Pragma. 37, 871–887. doi: 10.1016/J.PRAGMA.2004.10.016
Clark, A. (2006). Language, embodiment, and the cognitive niche. Trends Cogn. Sci. 10, 370–374. doi: 10.1016/j.tics.2006.06.012
Coco, M. I., and Dale, R. (2014). Cross-recurrence quantification analysis of categorical and continuous time series: an R package. Front. Psychol. 5:510. doi: 10.3389/fpsyg.2014.00510
Dale, R. (2015). An integrative research strategy for exploring synergies in natural language performance. Ecol. Psychol. 27, 190–201. doi: 10.1080/10407413.2015.1068649
Dale, R., Duran, N. D., and Coco, M. I. (2018). Dynamic natural language processing with recurrence quantification analysis. arXiv [Preprint]. arXiv:1803.07136.
D’Ausilio, A., Novembre, G., Fadiga, L., and Keller, P. E. (2015). What can music tell us about social interaction? Trends Cogn. Sci. 19, 111–114. doi: 10.1016/j.tics.2015.01.005
Eckmann, J.-P., Kamphorst, S. O., and Ruelle, D. (1987). Recurrence plots of dynamical systems. Europhys. Lett. 4, 973–977. doi: 10.1209/0295-5075/4/9/004
Favela, L. H., and Chemero, A. (2015). “The animal-environment system,” in Foundations of Embodied Cognition, Vol. 1, eds Y. Coello and M. H. Fischer (Milton Park: Routledge), 59–74.
Fraser, A. M., and Swinney, H. L. (1986). Independent coordinates for strange attractors from mutual information. Phys. Rev. A 33, 1134–1140. doi: 10.1103/PhysRevA.33.1134
Fusaroli, R., Konvalinka, I., and Wallot, S. (2014). “Analyzing social interactions: the promises and challenges of using cross recurrence quantification analysis,” in Translational Recurrences, eds N. Marwan, M. Riley, A. Giuliani, and C. L. Webber Jr. (Cham: Springer), 137–155. doi: 10.1007/978-3-319-09531-8_9
Glenberg, A. M., and Kaschak, M. P. (2002). Grounding language in action. Psychon. Bull. Rev. 9, 558–565. doi: 10.3758/bf03196313
Goldstein, P., Losin, E. A. R., Anderson, S. R., Schelkun, V. R., and Wager, T. D. (2020). Clinician-patient movement synchrony mediates social group effects on interpersonal trust and perceived pain. J. Pain 21, 1160–1174. doi: 10.1016/j.jpain.2020.03.001
Graham, J. A., and Heywood, S. (1975). The effects of elimination of hand gestures and of verbal codability on speech performance. Eur. J. Soc. Psychol. 5, 189–195. doi: 10.1002/ejsp.2420050204
Kantz, H., and Schreiber, T. (2003). Nonlinear Time Series Analysis. Cambridge: Cambridge university press.
Kennel, M. B., Brown, R., and Abarbanel, H. D. I. (1992). Determining embedding dimension for phase-space reconstruction using a geometrical construction. Phys. Rev. A 45, 3403–3411. doi: 10.1103/PhysRevA.45.3403
Kita, S., and Özyürek, A. (2003). What does cross-linguistic variation in semantic coordination of speech and gesture reveal?: Evidence for an interface representation of spatial thinking and speaking. J. Mem. Lang. 48, 16–32. doi: 10.1016/S0749-596X(02)00505-3
Kodama, K., Shimizu, D., and Sekine, K. (2019). “An attempt to visualize and quantify speech-motion coordination by recurrence analysis: a case study of rap performance,” in Proceedings of the annual meeting of the cognitive science society CogSci 2019 (2031–2037), Montreal, QC.
Kodama, K., Tanaka, S., Shimizu, D., Hori, K., and Matsui, H. (2018). Heart rate synchrony in psychological counseling: a case study. Psychology 9, 1858–1874. doi: 10.4236/psych.2018.97108
Louwerse, M. M., Dale, R., Bard, E. G., and Jeuniaux, P. (2012). Behavior matching in multimodal communication is synchronized. Cogn. Sci. 36, 1404–1426. doi: 10.1111/j.1551-6709.2012.01269.x
Marwan, N., Carmen Romano, M., Thiel, M., and Kurths, J. (2007). Recurrence plots for the analysis of complex systems. Phys. Rep. 438, 237–329. doi: 10.1016/j.physrep.2006.11.001
Marwan, N., and Kurths, J. (2002). Nonlinear analysis of bivariate data with cross recurrence plots. Phys. Lett. A 302, 299–307. doi: 10.1016/S0375-9601(02)01170-2
McNeill, D. (1992). Hand and Mind: What Gestures Reveal About Thought. Chicago, IL: University of Chicago Press.
Nagaoka, C., and Komori, M. (2008). Body movement synchrony in psychotherapeutic counseling: a study using the video-based quantification method. IEICE Trans. Inform. Syst. 91, 1634–1640.
Pellecchia, G. L., Shockley, K. D., and Turvey, M. T. (2005). Concurrent cognitive task modulates coordination dynamics. Cogn. Sci. 29, 531–557. doi: 10.1207/s15516709cog0000_12
Ramseyer, F., and Tschacher, W. (2011). Nonverbal synchrony in psychotherapy: coordinated body movement reflects relationship quality and outcome. J. Consult. Clin. Psychol. 79, 284–295. doi: 10.1037/a0023419
Rauscher, F. H., Krauss, R. M., and Chen, Y. (1996). Gesture, speech, and lexical access: the role of lexical movements in speech production. Psychol. Sci. 7, 226–231. doi: 10.1111/j.1467-9280.1996.tb00364.x
Richardson, D. C., Dale, R., and Shockley, K. D. (2008). “Synchrony and swing in conversation: coordination, temporal dynamics and communication,” in Embodied Communication in Humans and Machines, eds I. Wachsmuth, M. Lenzen, and G. Knoblich (Oxford: Oxford University Press), 75–94. doi: 10.1093/acprof:oso/9780199231751.003.0004
Richardson, M. J., Dale, R., and Marsh, K. L. (2014). “Complex dynamical systems in social and personality psychology: theory, modeling and analysis,” in Handbook of Research Methods in Social and Personality Psychology, eds T. Harry, Reis, M. Charles, and Judd (Cambridge: Cambridge University Press), 251–280.
Riley, M. A., Balasubramaniam, R., and Turvey, M. (1999). Recurrence quantification analysis of postural fluctuations. Gait Post. 9, 65–78. doi: 10.1016/S0966-6362(98)00044-7
Riley, M. A., Shockley, K. D., and van Orden, G. C. (2012). Learning from the body about the mind. Top. Cogn. Sci. 4, 21–34. doi: 10.1111/j.1756-8765.2011.01163.x
Sekine, K., and Kita, S. (2015). The parallel development of the form and meaning of two-handed gestures and linguistic information packaging within a clause in narrative. Open Ling. 1, 490–502. doi: 10.1515/opli-2015-0015
Shimizu, D., and Okada, T. (2018). How do creative experts practice new skills? Exploratory practice in breakdancers. Cogn. Sci. 42, 2364–2396. doi: 10.1111/cogs.12668
Shockley, K. D., Richardson, D. C., and Dale, R. (2009). Conversation and coordinative structures. Top. Cogn. Sci. 1, 305–319. doi: 10.1111/j.1756-8765.2009.01021.x
Shockley, K. D., and Riley, M. A. (2015). “Interpersonal couplings in human interactions,” in Recurrence Quantification Analysis Theory and Best Practices, eds C. L. Webber and N. Marwan (Berlin: Springer), 399–421. doi: 10.1007/978-3-319-07155-8-14
Shockley, K. D., Santana, M.-V., and Fowler, C. A. (2003). Mutual interpersonal postural constraints are involved in cooperative conversation. J. Exp. Psychol. Hum. Percept. Perform. 29, 326–332. doi: 10.1037/0096-1523.29.2.326
Tolston, M. T., Riley, M. A., Mancuso, V., Finomore, V., and Funke, G. J. (2019). Beyond frequency counts: novel conceptual recurrence analysis metrics to index semantic coordination in team communications. Behav. Res. Methods 51, 342–360. doi: 10.3758/s13428-018-1132-6
Van Orden, G. C., and Riley, M. A. (Eds) (2005). Tutorials in Contemporary Nonlinear Methods for the Behavioral Sciences. Alexandria, VA: National Science Foundation.
Wallot, S. (2017). Recurrence quantification analysis of processes and products of discourse: a tutorial in R. Discour. Process. 54, 382–405. doi: 10.1080/0163853X.2017.1297921
Wallot, S., Roepstorff, A., and Mønster, D. (2016). Multidimensional recurrence quantification analysis (MdRQA) for the analysis of multidimensional time-series: a software implementation in MATLAB and its application to group-level data in joint action. Front. Psychol. 7:1835. doi: 10.3389/fpsyg.2016.01835
Walton, A. E., Washburn, A., Langland-Hassan, P., Chemero, A., Kloos, H., and Richardson, M. J. (2018). Creating time: social collaboration in music improvisation. Top. Cogn. Sci. 10, 95–119. doi: 10.1111/tops.12306
Webber, C. L., and Zbilut, J. P. (1994). Dynamical assessment of physiological systems and states using recurrence plot strategies. J. Appl. Physiol. 76, 965–973. doi: 10.1152/jappl.1994.76.2.965
Webber, C. L., and Zbilut, J. P. (2005). “Recurrence quantification analysis of nonlinear dynamical systems,” in Tutorials in Contemporary Nonlinear Methods for the Behavioral Sciences, eds M. Riley and G. Van Orden (Alexandria, VA: National Science Foundation), 26–94.
Zbilut, J. P., and Webber, C. L. (1992). Embeddings and delays as derived from quantification of recurrence plots. Phys. Lett. A 171, 199–203. doi: 10.1016/0375-9601(92)90426-M
Zivotofsky, A. Z., and Hausdorff, J. M. (2007). The sensory feedback mechanisms enabling couples to walk synchronously: an initial investigation. J. Neuroeng. Rehabil. 4, 1–5. doi: 10.1186/1743-0003-4-28
Keywords: visualization, quantification, recurrence analysis, speech-motion coupling, rap
Citation: Kodama K, Shimizu D, Dale R and Sekine K (2021) An Approach to Aligning Categorical and Continuous Time Series for Studying the Dynamics of Complex Human Behavior. Front. Psychol. 12:614431. doi: 10.3389/fpsyg.2021.614431
Received: 06 October 2020; Accepted: 15 March 2021;
Published: 16 April 2021.
Edited by:
Jorge L. Puga, University of Granada, SpainReviewed by:
Eugene Buder, University of Memphis, United StatesAna María Ruiz-RuanoGarcía, University of Granada, Spain
Copyright © 2021 Kodama, Shimizu, Dale and Sekine. This is an open-access article distributed under the terms of the Creative Commons Attribution License (CC BY). The use, distribution or reproduction in other forums is permitted, provided the original author(s) and the copyright owner(s) are credited and that the original publication in this journal is cited, in accordance with accepted academic practice. No use, distribution or reproduction is permitted which does not comply with these terms.
*Correspondence: Kentaro Kodama, a29kYW1hX2tAdG11LmFjLmpw