 Tadamasa Sawada
Introduction
Consider randomly sampling variables from an infinite population1 and computing their normalized-sum, which is the difference between the average of the variables and the mean of the population multiplied by the square-root of the sample size. The Central-limit Theorem (CLT) assures us that this normalized-sum asymptotically follows a normal distribution when the sample size goes to positive infinity and when the population is with a finite non-zero variance (Dekking et al., 2005; Kwak and Kim, 2017; see also Cuadras, 2002).
Many statistical and analytical methods (e.g., t-test, linear-regression, and ANOVA) used in empirical Psychology studies are formulated on the basis of the CLT and some other assumptions (Lumley et al., 2002; Nikulin, 2011; Wijsman, 2011; Kim and Park, 2019). Note that the CLT assumes that the sample size goes to positive infinity but that the sample size is always finite in a real experiment. With the finite sample size, the average approximately follows the normal distribution when the sample size is sufficiently large but the “sufficiently-large” sample size depends on the shape of the distribution of the population (e.g., heavy tails, see Cuadras, 2002; Wilcox, 2012), so, the population should be close to a normal distribution especially when the sample size is small. Even if the distribution of the average of the finite samples is approximately-normal, a discrepancy of this distribution from the normal distribution can substantially affect the results of one's statistical and analytical methods (Wilcox, 2012). Note also that some other statistical and analytical methods assume that the population itself is normally distributed, e.g., some Bayesian models.
In many Psychology studies, the population represents a group of people2 and the samples represent individual participants sampled from the group and they are often the averages of the responses of the individual participants. Namely, the sampling procedure used in these studies is conducted in 2 steps: (i) it samples the participants in the group and (ii) it samples the responses of each participant. It is often believed that the population, itself, can be regarded as approximately following a normal distribution based on the CLT (Bower, 2003; Miles and Banyard, 2007; Sotos et al., 2007). The population in these studies are actually a distribution of the “averages,” which is the sum of the normalized-sum divided by the square-root of the sample size and the population mean, but these averages were computed from the responses of individual participants and this fact violates conditions in the CLT.
In this study, I describe how the conditions in the CLT are usually not satisfied in empirical Psychological studies by comparing the formulation of the CLT with a common experimental procedure used in empirical Psychological studies. This explains why the CLT cannot assure that the population follows a normal distribution no matter how large the sample size is in these studies. This applies regardless of the number of participants or the number of trials run by each participant.
The CLT and a Procedure Commonly Used in Empirical Psychological Studies
In Psychology, one specific type of the CLT is described in almost all of the Statistics textbooks and this type is referred to as the classical CLT. Consider that an arbitrary distribution with a finite non-zero variance is given, and that random variables (x11, x12, …, x1n) are sampled from this distribution for n times, and their normalized-sum (the difference between the average and the population mean multiplied by ) is computed (Figure 1A). This session is repeated for m times. This sampling is independent and the sampled variables do not depend on one another. Once this is done, the normalized-sums (, , …, ) from the m sessions can be asymptotically regarded as variables sampled from a normal distribution when n goes to infinity.3
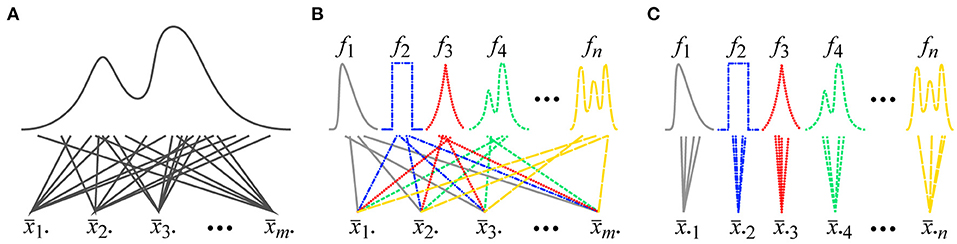
Figure 1. (A) A procedure for sampling data for the classical CLT. In a session for the classical CLT, a fixed number of variables are sampled from a single arbitrary distribution and the normalized-sum of the n sampled variables is computed. (B) A procedure for sampling data for the Lyapunov/Lindberg CLT. In a session for the Lyapunov/Lindberg CLT, a single variable is sampled from each of n arbitrary distributions and the normalized-sum of the n sampled variables is computed. (C) A procedure commonly used for sampling data in empirical Psychological studies. Individual participants can be represented by distributions f1, f2, …, fn. A fixed number of variables are sampled and the normalized-sum of the sampled variables is computed for each distribution (Note that the distributions in this figure are clearly non-normal. This violation of the assumption of normality has been exaggerated in this figure to enhance the clarity of its explanation).
Now, consider a procedure commonly used in empirical Psychological studies. Some dependent variable is measured in multiple trials and an average of the measured variable is computed for each participant (Figure 1C). These averages were collected from multiple participants. Note that the distribution of the dependent variable is different across the participants because of their individual differences (Williams, 1912). These distributions are also different from the distribution of the population of the participants. These facts violate the conditions of the identically-distributed random variables for the classical CLT.
A case in which variables are sampled from multiple distributions is discussed in the Lyapunov/Lindberg CLT (Billingsley, 1995; Petters and Dong, 2016). Consider that n arbitrary distributions (f1, f2, …, fn) with finite non-zero variances are given and that a single random variable is independently sampled from each distribution fi (i = 1, 2, …, n), and the normalized-sum of the n sampled variables (x11, x12, …, x1n) is computed (Figure 1B). This session is repeated m times. These distributions can be different from one another. This sampling is independent and the sampled variables do not depend on one another. Once this is done, the normalized-sums (, , …, ) from the m sessions can be asymptotically regarded as variables sampled from a normal distribution when n goes to infinity and when the distributions f1, f2, …, and fn satisfy Lindberg's condition about their variances:
where ε is a free parameter, xi is a random variable from the distribution fi, 𝔼(x) is an operator computing an expected value of a random variable x, μi = 𝔼(xi) is the mean of fi, and is the variance of fi. The parameter ε is an arbitrary non-zero positive number and it is fixed during the limit n → ∞. Lindberg's condition is a sufficient condition for the Lyapunov/Lindberg CLT. Lindberg's condition implies that the individual variances , , …, and of the distributions f1, f2, …, and fn become negligibly small when they are compared with the sum of these variances as n → ∞ (Petters and Dong, 2016). Note that Lindberg's condition cannot be strictly satisfied in a real experiment because n is finite, but the condition can be brought closer to being satisfied when none of the variances , , …, and is very much larger than the other variances.
The Lyapunov/Lindberg CLT also does not validate the assumption of normality using a procedure commonly used in empirical Psychological studies. Recall that some dependent variable is measured in multiple trials and an average of the measured variable is computed for each participant in the common procedure (Figure 1C). There are the participants' individual differences and the distribution of the dependent variable is different across the participants. Namely, the averages are computed within the individual distributions of the participants in the common Psychological procedure. But note that, according to the Lyapunov/Lindberg CLT, the averages should be computed across the distributions (Figure 1B). The common Psychological procedure does not follow the procedure of the Lyapunov/Lindberg CLT.
Note that the common procedure used in empirical Psychological studies can be modified so that the conditions of the classical or Lyapunov/Lindberg CLT are better satisfied (see Hoefding, 1951; Hájek, 1961). Some dependent variable is measured in multiple trials and an average of this measured variable is computed for each participant in the common procedure. Let xji be the measured variable in the j-th trial of the i-th participant. The average of the measured variables of this participant is computed as where t is the number of trials. Once this is done, the averages from the n participants were randomly categorized into s sets that have an equal number (n/s) of the averages, and the averages within each group are also averaged:
where s is one of divisors of n and Sk (k = 1, 2, …, s) is the j-th set of the averages. If the number n/s of the participants in each set is sufficiently large, this modified procedure better satisfies the conditions of the classical CLT than the common procedure used in empirical Psychological studies (see https://osf.io/kn8mh/ for a computer simulation of this modified procedure).
For the Lyapunov/Lindberg CLT, an average of the measured variables (xji in the j-th trial of the i-th participant) is computed across the participants for each order number of the trials:
This modified procedure better satisfies the conditions of the Lyapunov/Lindberg CLT than the common procedure used in empirical Psychological studies when the number of the participants n is sufficiently large, and when Lindberg's condition is satisfied (see https://osf.io/kn8mh/ for a computer simulation of this modified procedure).
Discussion
This study explained how conditions in the central-limit theorem (CLT) are usually not satisfied in empirical Psychological studies. The population usually represents a group of people in these studies and when it does, the CLT cannot assure one that that the population follows a normal distribution no matter how large the sample size is. The study also discussed two possible modifications of a procedure commonly employed in the studies to better satisfy the conditions of the CLT (see https://osf.io/kn8mh/ for computer simulations of these modified procedures).
Some commonly used parametric statistical tests, such as the t-test and the ANOVA (see also Tan and Tabatabai, 1985; Fan and Hancock, 2012; Cavus et al., 2017 for the robust-ANOVA) are robust to some extent against some types of non-normality of the population (see Lumley et al., 2002 for a review) but not against some other types of non-normality, e.g., heavy tails and outliers (Cressie and Whitford, 1986; Wilcox, 2012). Note that there are some non-parametric statistical tests that do not use a normality assumption for the population but these non-parametric tests are not universally more robust than the parametric tests. These non-parametric tests use some other assumptions about the data, such as equal variance, just as the parametric tests do. These non-parametric tests can be affected more subtlety than the parametric tests when these assumptions are violated (e.g., Fagerland, 2012, see also Algina et al., 1994).
The assumption of normality is also used in Bayesian statistics. The Bayesian alternatives used in conventional statistical tests often use Bayes factors (BFs) instead of the p-values used in the conventional tests. These BFs correlate well with the p-values (Rouder et al., 2012; Johnson, 2013; see also Francis, 2017), so the BFs can be robust to some extent just as the p-values are when the normality assumption is violated. There are studies that use Bayesian statistical models to explain their results. These models are composed of multiple parts with independent probability distributions. These distributions are often assumed to be normal. The validity of this assumption is difficult to test especially when their parts represent some variables that are not directly observable. The robustness of these models against the violation of the normality assumption should depend on the structures of the models but their structures are different from one another, so the effect of their model structure and the robustness of the model need to be studied systematically.
The assumption of normality is fundamental in many statistical analyses that are used in empirical Psychological studies but this assumption is rarely assured by the CLT. The conventional statistical analyses should be regarded as being, at best, descriptive. Experimental Psychologists should check their row data and should discuss “effects” only if the effects are clear in their data. If they want to make inferences based on the results of statistical analyses, more modern statistical methods should be considered: e.g., Robust statistics (Tan and Tabatabai, 1985; Huber and Ronchetti, 2009; Fan and Hancock, 2012; Wilcox, 2012; Cavus et al., 2017).
Author Contributions
The author confirms being the sole contributor of this work and has approved it for publication.
Conflict of Interest
The author declares that the research was conducted in the absence of any commercial or financial relationships that could be construed as a potential conflict of interest.
Publisher's Note
All claims expressed in this article are solely those of the authors and do not necessarily represent those of their affiliated organizations, or those of the publisher, the editors and the reviewers. Any product that may be evaluated in this article, or claim that may be made by its manufacturer, is not guaranteed or endorsed by the publisher.
Acknowledgments
The author thanks Drs. Gregory Francis, Lorick Huang, and Zygmunt Pizlo for helpful comments and suggestions. The author thanks Drs. Jimmy Aames and Kazuhiro Yamaguchi for suggesting relevant literatures.
Footnotes
1. ^This study, for the sake of simplicity, only the case in which the population was infinite was considered.
2. ^This group is assumed to be sufficiently large for its population to be regarded as being infinite. Otherwise, the population is finite and the participants from the group can be regarded as samples from the finite population without replacement. The CLT cannot be applied under this condition (Plane and Gordon, 1982). This happens when a study is about a small group of people, e.g., patients with a rare disease.
3. ^The asymptotic normality of the classical CLT, of the Lyapunov/Lindberg CLT, and of the two modified procedures proposed in this study are simulated computationally (https://osf.io/kn8mh/).
References
Algina, J., Oshima, T. C., and Lin, W. Y. (1994). Type I error rates for Welch's test and James's second-order test under nonnormality and inequality of variance when there are two groups. J. Educ. Stat. 19, 275–291. doi: 10.3102/10769986019003275
Bower, K. M. (2003). “Some misconceptions about the normal distribution,” in The Six Sigma Forum. Milwaukee, WI: American Society for Quality.
Cavus, M., Yazici, B., and Sezer, A. (2017). Modified tests for comparison of group means under heteroskedasticity and non-normality caused by outlier (s). Hacettepe J. Math. Stat. 46, 493–510. doi: 10.15672/HJMS.2017.417
Cressie, N. A. C., and Whitford, H. J. (1986). How to use the two sample t-test. Biom. J. 28, 131–148. doi: 10.1002/bimj.4710280202
Cuadras, C. M. (2002). Geometrical understanding of the Cauchy distribution. Qüest. Quader. d'Estadíst. Invest. Operat. 26, 283–287.
Dekking, F. M., Kraaikamp, C., Lopuha,ä, H. P., and Meester, L. E. (2005). A Modern Introduction to Probability and Statistics: Understanding Why and How. London: Springer-Verlag. doi: 10.1007/1-84628-168-7
Fagerland, M. W. (2012). t-tests, non-parametric tests, and large studies—a paradox of statistical practice? BMC Med. Res. Methodol. 12:78. doi: 10.1186/1471-2288-12-78
Fan, W., and Hancock, G. R. (2012). Robust mean modelling: An alternative for hypothesis testing of independent means under variance heterogeneity and nonnormality, J. Educ. Behav. Stat. 37, 137–156. doi: 10.3102/1076998610396897
Francis, G. (2017). Equivalent statistics and data interpretation. Behav. Res. Methods 49, 1524–1538. doi: 10.3758/s13428-016-0812-3
Hájek, J. (1961). Some extensions of the wald–wolfowitz–noether theorem. Ann. Math. Stat. 32, 506–523. doi: 10.1214/aoms/1177705057
Hoefding, W. (1951). A combinatorial central limit theorem. Ann. Math. Stat. 22, 558–566. doi: 10.1214/aoms/1177729545
Huber, P. J., and Ronchetti, E. (2009). Robust Statistics, 2nd Edn. NJ: Wiley. doi: 10.1002/9780470434697
Johnson, V. E. (2013). Revised standards for statistical evidence. Proc. Nat. Acad. Sci. U.S.A. 110, 19313–19317. doi: 10.1073/pnas.1313476110
Kim, T. K., and Park, J. H. (2019). More about the basic assumptions of t-test: normality and sample size. Kor. J. Anesth. 72, 331–335. doi: 10.4097/kja.d.18.00292
Kwak, S. G., and Kim, J. H. (2017). Central limit theorem: the cornerstone of modern statistics. Kor. J. Anesth. 70, 144–156. doi: 10.4097/kjae.2017.70.2.144
Lumley, T., Diehr, P., Emerson, S., and Chen, L. (2002). The importance of the normality assumption in large public health data sets. Annu. Rev. Public Health 23, 151–169. doi: 10.1146/annurev.publhealth.23.100901.140546
Nikulin, M. S. (2011). “Student test,” in Encyclopedia of Mathematics. Available online at: http://encyclopediaofmath.org/index.php?title=Student_test&oldid=17068
Petters, A. O., and Dong, X. (2016). An Introduction to Mathematical Finance With Applications. New York, NY: Springer. doi: 10.1007/978-1-4939-3783-7
Plane, D. R., and Gordon, K. R. (1982). A simple proof of the nonapplicability of the central limit theorem to finite populations. Am. Stat. 36, 175–176. doi: 10.1080/00031305.1982.10482823
Rouder, J. N., Morey, R. D., Speckman, P. L., and Province, J. M. (2012). Default bayes factors for ANOVA designs. J. Math. Psychol. 56, 356–374. doi: 10.1016/j.jmp.2012.08.001
Sotos, A. E. C., Vanhoof, S., Van den Noortgate, W., and Onghena, P. (2007). Students' misconceptions of statistical inference: a review of the empirical evidence from research on statistics education. Educ. Res. Rev. 2, 98–113. doi: 10.1016/j.edurev.2007.04.001
Tan, W. Y., and Tabatabai, M. A. (1985). Some robust ANOVA procedures under heteroscedasticity and nonnormality. Commun. Stat. Simul. Comput. 14, 1007–1026. doi: 10.1080/03610918508812486
Wijsman, R. A. (2011). “ANOVA,” in Encyclopedia of Mathematics. Available online at: http://encyclopediaofmath.org/index.php?title=ANOVA&oldid=14171
Wilcox, R. R. (2012). Introduction to Robust Estimation and Hypothesis Testing, 3rd Edn. Waltham, MA: Academic Press. doi: 10.1016/B978-0-12-386983-8.00010-X
Keywords: the classical central-limit theorem, the Lyapunov/Lindberg central-limit theorem, normal distribution, random sampling, parametric test
Citation: Sawada T (2021) Conditions of the Central-Limit Theorem Are Rarely Satisfied in Empirical Psychological Studies. Front. Psychol. 12:762418. doi: 10.3389/fpsyg.2021.762418
Received: 21 August 2021; Accepted: 11 October 2021;
Published: 08 November 2021.
Edited by:
Fernando Marmolejo-Ramos, University of South Australia, AustraliaReviewed by:
Raydonal Ospina, Federal University of Pernambuco, BrazilMustafa Cavus, Eskisehir Technical University, Turkey
Copyright © 2021 Sawada. This is an open-access article distributed under the terms of the Creative Commons Attribution License (CC BY). The use, distribution or reproduction in other forums is permitted, provided the original author(s) and the copyright owner(s) are credited and that the original publication in this journal is cited, in accordance with accepted academic practice. No use, distribution or reproduction is permitted which does not comply with these terms.
*Correspondence: Tadamasa Sawada, dHNhd2FkYUBoc2UucnU=; dGFkYS5tYXNhLnNhd2FkYUBnbWFpbC5jb20=