Abstract
Background:
Diabetes and depressive symptoms exhibit a high comorbidity in the older adult population, and their combined effects significantly reduce patients’ quality of life. This study aims to investigate the prevalence of depressive symptoms among older adults with diabetes in China and identify key associated factors, providing evidence-based insights for the development of targeted intervention strategies.
Methods:
This study utilizes data from the 2015, 2018, and 2020 waves of the China Health and Retirement Longitudinal Study (CHARLS), including older adults aged 60 years and above who have been diagnosed with diabetes (n = 3,609). Depressive symptoms were assessed using the simplified version of the CES-D scale, a validated tool for measuring depressive symptoms, with a score of ≥10 indicating depressive symptoms. Univariate chi-square tests and logistic regression analysis were used to examine the factors associated with depressive symptoms, with statistical significance set at p < 0.05.
Results:
The overall prevalence of depressive symptoms among older adult diabetic patients in the sample was 38.6%. Univariate chi-square analysis revealed significant differences in variables including age (χ2 = 4.048, p = 0.044), gender (χ2 = 96.725, p < 0.001), educational level (χ2 = 110.545, p < 0.001), and sleep duration (χ2 = 161.070, p < 0.001) between the groups with and without depressive symptoms. Logistic regression analysis identified lower educational level (OR = 1.26, 95% CI: 1.03–1.55, p = 0.026), female sex (OR = 1.51, 95% CI: 1.22–1.88, p < 0.001), and shorter sleep duration (OR = 1.76, 95% CI: 1.41–2.18, p < 0.001) as independent risk factors for depressive symptoms. Furthermore, patients with comorbidities had a significantly increased risk of depressive symptoms (OR = 1.35, 95% CI: 1.06–1.72, p = 0.015).
Conclusion:
The high prevalence of depressive symptoms among older adult diabetic patients is significantly associated with sociodemographic, lifestyle, and health-related factors. Personalized psychological interventions should be prioritized for high-risk groups, including individuals with low education levels, women, those experiencing insufficient sleep, and those with multiple comorbidities, in order to enhance their quality of life and reduce social burdens.
Introduction
Depressive symptoms are a highly prevalent mental disorder that profoundly impact the physical and mental health of older adults worldwide (Alexopoulos, 2005; Fiske et al., 2009; Hu et al., 2022). With the accelerating growth of the elderly population, the prevalence of depressive symptoms among older adults continues to rise, particularly among those with diabetes, where the situation is even more pronounced (Li et al., 2024; Zhang C. et al., 2023). Evidence suggests that the risk of developing depressive symptoms in diabetic patients is significantly higher than in the general population. This comorbidity not only reduces the quality of life for patients but also increases the burden on families and complicates disease management and clinical interventions (Zhang H. et al., 2023; Liu et al., 2020). Among elderly diabetic patients, the prevalence of depressive symptoms is notably higher, with approximately 30% exhibiting depressive symptoms and 12–18% meeting the diagnostic criteria for major depressive disorder, a proportion substantially higher than that in the non-diabetic population (Li et al., 2024; Soleimani et al., 2021). This high comorbidity rate presents a significant challenge to public health policymakers and healthcare providers.
The relationship between depressive symptoms and diabetes is bidirectional. On one hand, the persistent hyperglycemic burden and chronic complications in diabetic patients may trigger or exacerbate depressive symptoms (Lustman et al., 2000). On the other hand, depressive symptoms themselves negatively impact diabetes management, as individuals with depressive symptoms often neglect self-care and medication adherence, leading to fluctuations in blood glucose levels and an increased risk of complications (Varela-Moreno et al., 2022). Furthermore, depressive symptoms are a common comorbidity in elderly diabetic patients and often coexists with other chronic diseases. Studies have shown that depressive symptoms are not only prevalent in diabetes but are also closely associated with hypertension, heart disease, and stroke (Mezuk et al., 2008; Roy and Lloyd, 2012; Liu et al., 2022). The presence of these comorbidities complicates patient management, as they increase both the physical and psychological burdens.
In the United States, a significant bidirectional relationship exists between diabetes and depressive symptoms (Golden et al., 2008). Research indicates that diabetic patients are twice as likely to develop depressive symptoms as the general population, with a particularly higher incidence of depressive symptoms among those with type 2 diabetes. The need for long-term management of blood glucose, diet, and lifestyle in diabetic patients may contribute to psychological stress and emotional distress, increasing the risk of depressive symptoms. Meanwhile, depressive symptoms interfere with diabetes self-management, leading to neglect of health management, reduced physical activity, and irregular eating habits, thereby affecting blood glucose control (Anderson et al., 2001; Golden et al., 2008). In a five-year longitudinal epidemiological study conducted in Spain, depressive symptoms were considered an independent risk factor for the development of diabetes, and the study demonstrated that depressive symptoms significantly increased the risk of developing diabetes, especially in cases of non-severe depression, persistent depression, and untreated depressive symptoms (Campayo et al., 2010). In China, research on the intersection of diabetes and depressive symptoms in the elderly is still emerging. Among individuals with type 2 diabetes in China, 25.9% experience varying degrees of depressive symptoms, with significant heterogeneity across different studies. Factors such as female gender, age ≥ 60 years, low education (especially at or below elementary school level), diabetes duration ≥ 10 years, presence of complications, insulin use, and living alone are significantly associated with the occurrence of depressive symptoms (Liu et al., 2022; Ju et al., 2022).
Therefore, utilizing large-scale data from the China Health and Retirement Longitudinal Study (CHARLS), this article analyzes data from 2015, 2018, and 2020 to reveal the prevalence of depressive symptoms among elderly diabetic patients. It provides an in-depth exploration of the depressive symptoms and their influencing factors in elderly diabetic patients in China, offering important baseline data for related fields. The findings of this study will provide empirical support for the development of mental health interventions and contribute to the advancement of tailored public health policies for elderly diabetic patients.
Methods
Study design and data source
This study investigates the prevalence of depressive symptoms and their major influencing factors among Older Adults diabetic patients in China, using data from the CHARLS. CHARLS is a nationally representative longitudinal survey designed to collect high-quality microdata on individuals aged 45 years and older, focusing on issues related to population aging (Zhao et al., 2014). The baseline survey in 2011 employed a multistage probability sampling method with probability proportional to size (PPS), covering 450 villages, 150 counties, and 28 provinces, with over 17,000 individuals from approximately 10,000 households. Follow-up surveys were conducted every two to three years, with four waves released to date: 2011 (Wave 1), 2013 (Wave 2), 2015 (Wave 3), and 2018 (Wave 4). The data are publicly available at the CHARLS website1.
This study utilized data from the CHARLS for the years 2015, 2018, and 2020. The inclusion criteria were as follows: (1) age ≥ 60 years; (2) affirmative response to the question: “Have you ever been diagnosed with diabetes or elevated blood glucose (including impaired glucose tolerance and impaired fasting glucose) by a doctor?”; (3) provision of valid responses to the Center for Epidemiologic Studies Depression (CES-D) Scale. Data preprocessing excluded samples with missing information on diabetes, depression, or covariates. To ensure data quality, individuals with severe mental illnesses were also excluded. Figure 1 illustrates the detailed sample selection process.
Figure 1
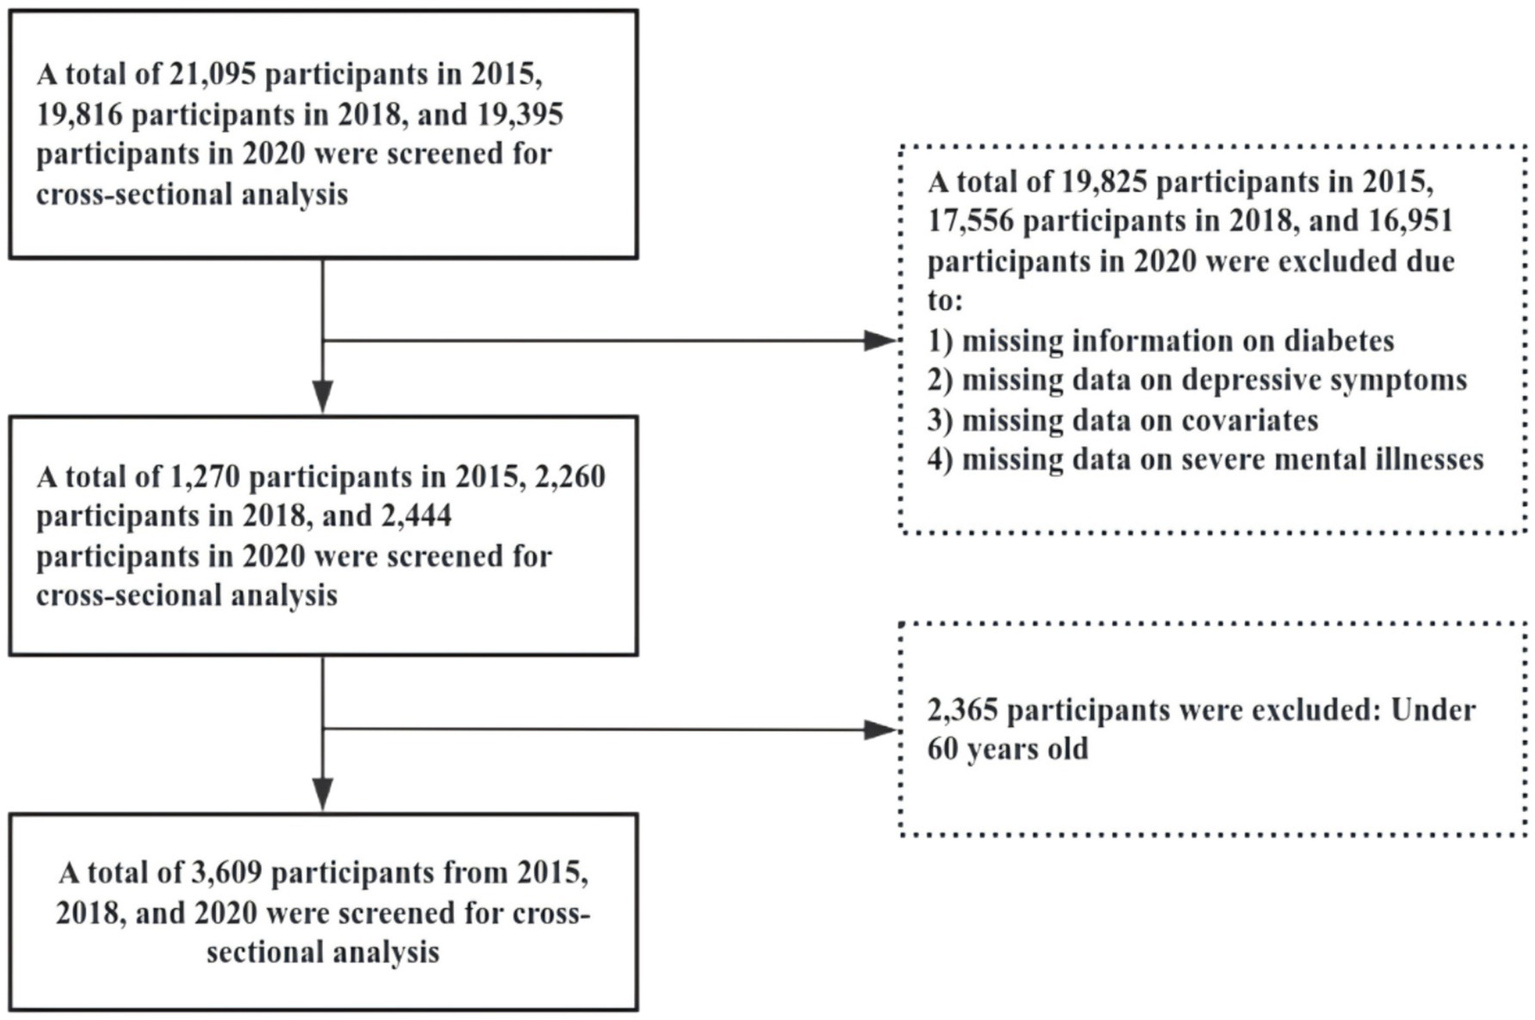
Shows a detailed flowchart of the sample selection process.
Assessment of depressive symptoms
The CHARLS study utilized the abbreviated version of the CES-D (Boey, 1999; Mohebbi et al., 2018), originally developed by Radloff. This scale has demonstrated high reliability and validity in previous studies and is widely used in older adult populations (Dye et al., 1995). The CES-D comprises 10 items (Song et al., 2023) rated on a four-point Likert scale: “3 = Always,” “2 = Often,” “1 = Sometimes or Rarely,” and “0 = Never,” with items 5 through 8 reverse scored. The total score ranges from 0 to 30. Based on prior research in older adult populations, a threshold score of ≥10 was adopted in this study to classify the presence of depressive symptoms.
Covariates
Data collected from all study participants included the following variables: age, education level, gender, marital status, region, residence area, smoking, drinking, sleep duration, and the presence of chronic conditions, such as hypertension, dyslipidemia, cancer, pulmonary disease, liver disease, heart disease, stroke, kidney disease, and asthma.
Statistical analysis
Descriptive statistics were used to analyze the distribution of the sample’s basic characteristics. Chi-square tests were applied to assess the significance of differences between the dependent variable (depressive symptoms) and explanatory variables (e.g., age, educational level, gender). For multivariate analysis, logistic regression models were employed to examine the effects of various factors on depressive symptoms, with results reported as odds ratios (OR) and 95% confidence intervals (CI). Sensitivity analyses were conducted to ensure the robustness of the model by reclassifying depressive symptoms using alternative CES-D score thresholds (e.g., scores of 8 and 12) and constructing additional regression models to verify the consistency of results. All statistical analyses were performed using Stata 16.0 software, with statistical significance set at p < 0.05. The coding scheme for the independent variables is provided in Table 1.
Table 1
| Variable type | Variable | Assignment |
|---|---|---|
| Dependent variable | Depressive | Assessed using the depression scale in CHARLS (CES-D 10 scale). If the CES-D score is greater than 10, it is assigned a value of 1; otherwise, it is assigned a value of 0. |
| Independent variable | Age | Ages 61 to 80 = 1, ages 81 and above = 2 |
| Education level | Primary school and below = 1, middle school = 2, high school and above = 3 | |
| Gender | Male = 1, Female = 0 | |
| Marital status | Married = 1, Divorced/Widowed/Separated/Single = 0 | |
| Region | Urban areas = 1, Rural areas = 0 | |
| Residence area | Eastern region = 1, Central region = 2, Western region = 3 | |
| Smoking | Yes = 1, No = 0 | |
| Drinking | Yes = 1, No = 0 | |
| Sleep duration | Short sleep duration (<6 h/day) = 1, Normal sleep duration (6–8 h/day) = 2, Long sleep duration (>8 h/day) = 3 | |
| Hypertension | Yes = 1, No = 0 | |
| Dyslipidemia | Yes = 1, No = 0 | |
| Cancer | Yes = 1, No = 0 | |
| Pulmonary disease | Yes = 1, No = 0 | |
| Liver disease | Yes = 1, No = 0 | |
| Heart disease | Yes = 1, No = 0 | |
| Stroke | Yes = 1, No = 0 | |
| Kidney disease | Yes = 1, No = 0 | |
| Asthma | Yes = 1, No = 0 |
Assignment of independent variables.
Results
Descriptive analysis
Table 2 presents the baseline characteristics of older adult diabetic patients with depressive symptoms. Among the participants, 95.15% were aged between 61 and 80 years, while 4.85% were aged 81 years or older. Most participants (70.38%) had an educational level of elementary school or below, 16.68% had attended middle school, and only 12.94% had completed high school or higher education. Women accounted for 56% of the sample, while men made up 44%. In terms of marital status, 78.69% were married, while 21.31% were divorced, widowed, separated, or single. Rural and urban areas was nearly evenly distributed, with 50.12% living in rural areas and 49.88% in urban areas. Regionally, 37.05% of participants resided in western China, 38.54% in central China, and 24.41% in eastern China. Regarding health-related behaviors, 40.51% of participants were smokers, and 26.82% reported alcohol consumption. Sleep duration was categorized into three groups: 32.06% had short sleep (<6 h/day), 44.36% had normal sleep (6–8 h/day), and 23.58% had long sleep (>8 h/day). Chronic conditions were highly prevalent, with 66.08% having hypertension and 51.07% having dyslipidemia. Other common chronic diseases included Pulmonary disease (18.43%), heart disease (37.38%), and kidney disease (17.18%).
Table 2
| Category | Subcategory | Total (n = 3,609) | |
|---|---|---|---|
| Sample size | Proportion (%) | ||
| Age | 61–80 years | 3,434 | 95.15 |
| ≥81 years | 175 | 4.85 | |
| Education level | Primary school and below | 2,540 | 70.38 |
| Middle school | 602 | 16.68 | |
| High school and above | 467 | 12.94 | |
| Gender | Female | 2,021 | 56 |
| Male | 1,588 | 44 | |
| Marital Status | Divorced/Widowed/Separated/Single | 769 | 21.31 |
| Married | 2,840 | 78.69 | |
| Region | Rural areas | 1,809 | 50.12 |
| Urban areas | 1,800 | 49.88 | |
| Residence area | Eastern region | 1,337 | 37.05 |
| Central region | 1,391 | 38.54 | |
| Western region | 881 | 24.41 | |
| Smoking | No | 2,147 | 59.49 |
| Yes | 1,462 | 40.51 | |
| Drinking | No | 2,641 | 73.18 |
| Yes | 968 | 26.82 | |
| Sleep duration | Short sleep duration | 1,157 | 32.06 |
| Normal sleep duration | 1,601 | 44.36 | |
| Long sleep duration | 851 | 23.58 | |
| Hypertension | No | 1,224 | 33.92 |
| Yes | 2,385 | 66.08 | |
| Dyslipidemia | No | 1,766 | 48.93 |
| Yes | 1,843 | 51.07 | |
| Cancer | No | 3,480 | 96.43 |
| Yes | 129 | 3.57 | |
| Pulmonary disease | No | 2,944 | 81.57 |
| Yes | 665 | 18.43 | |
| Liver disease | No | 3,271 | 90.63 |
| Yes | 338 | 9.37 | |
| Heart disease | No | 2,260 | 62.62 |
| Yes | 1,349 | 37.38 | |
| Stroke | No | 3,119 | 86.42 |
| Yes | 490 | 13.58 | |
| Kidney disease | No | 2,989 | 82.82 |
| Yes | 620 | 17.18 | |
| Asthma | No | 3,291 | 91.19 |
| Yes | 318 | 8.81 | |
Basic characteristics analysis.
Univariate analysis
Table 3 compares depressive and non-depressive cases across various demographic, behavioral, and health-related indicators. The table reports the sample size and percentage for each subgroup under the non-depressive and depressive categories, along with chi-square test results to evaluate statistical significance. Age Group: The majority of participants in both depressive and non-depressive groups were aged 61–80 years. The chi-square test for age yielded a value of 4.048 with a corresponding p-value of 0.044, indicating a statistically significant difference in age distribution between the depressive and non-depressive groups at the 5% significance level. Cancer: In both depressive and non-depressive groups, the majority of participants did not have cancer. The chi-square test for cancer yielded a value of 2.244 with a p-value of 0.134, suggesting no significant difference in cancer status between the two groups. These findings indicate that while age is significantly associated with depressive symptoms, cancer status does not appear to have a significant impact. The chi-square tests provide a robust statistical basis for identifying variables potentially associated with depressive symptoms in older adults diabetic patients.
Table 3
| Category | Subcategory | Non-depressive symptoms (n = 2,214) | Depressive symptoms (n = 1,395) | X 2 | P-values | ||
|---|---|---|---|---|---|---|---|
| Sample size | Proportion (%) | Sample size | Proportion (%) | ||||
| Age | 61–80 years | 2,094 | 94.58 | 1,340 | 96.06 | 4.048 | 0.044 |
| ≥81 years | 120 | 5.42 | 55 | 3.94 | |||
| Education level | Primary school and below | 1,423 | 64.27 | 1,117 | 80.07 | 110.545 | P < 0.001 |
| Middle school | 423 | 19.11 | 179 | 12.83 | |||
| High school and above | 368 | 16.62 | 99 | 7.1 | |||
| Gender | Female | 1,097 | 49.55 | 924 | 66.24 | 96.725 | P < 0.001 |
| Male | 1,117 | 50.45 | 471 | 33.76 | |||
| Marital Status | Divorced/Widowed/Separated/Single | 416 | 18.79 | 353 | 25.3 | 21.664 | P < 0.001 |
| Married | 1,798 | 81.21 | 1,042 | 74.7 | |||
| Region | Rural areas | 954 | 43.09 | 855 | 61.29 | 113.400 | P < 0.001 |
| Urban areas | 1,260 | 56.91 | 540 | 38.71 | |||
| Residence area | Eastern region | 918 | 41.46 | 419 | 30.04 | 53.019 | P < 0.001 |
| Central region | 819 | 36.99 | 572 | 41 | |||
| Western region | 477 | 21.54 | 404 | 28.96 | |||
| Smoking | No | 1,224 | 55.28 | 923 | 66.16 | 42.038 | P < 0.001 |
| Yes | 990 | 44.72 | 472 | 33.84 | |||
| Drinking | No | 1,550 | 70.01 | 1,091 | 78.21 | 29.309 | P < 0.001 |
| Yes | 664 | 29.99 | 304 | 21.79 | |||
| Sleep duration | Short sleep duration | 537 | 24.25 | 620 | 44.44 | 161.070 | P < 0.001 |
| Normal sleep duration | 1,084 | 48.96 | 517 | 37.06 | |||
| Long sleep duration | 593 | 26.78 | 258 | 18.49 | |||
| Hypertension | No | 796 | 35.95 | 428 | 30.68 | 10.612 | 0.001 |
| Yes | 1,418 | 64.05 | 967 | 69.32 | |||
| Dyslipidemia | No | 1,113 | 50.27 | 653 | 46.81 | 4.102 | 0.043 |
| Yes | 1,101 | 49.73 | 742 | 53.19 | |||
| Cancer | No | 2,143 | 96.79 | 1,337 | 95.84 | 2.244 | 0.134 |
| Yes | 71 | 3.21 | 58 | 4.16 | |||
| Pulmonary disease | No | 1,887 | 85.23 | 1,057 | 75.77 | 50.949 | P < 0.001 |
| Yes | 327 | 14.77 | 338 | 24.23 | |||
| Liver disease | No | 2,044 | 92.32 | 1,227 | 87.96 | 19.205 | P < 0.001 |
| Yes | 170 | 7.68 | 168 | 12.04 | |||
| Heart disease | No | 1,456 | 65.76 | 804 | 57.63 | 24.159 | P < 0.001 |
| Yes | 758 | 34.24 | 591 | 42.37 | |||
| Stroke | No | 1,964 | 88.71 | 1,155 | 82.8 | 25.496 | P < 0.001 |
| Yes | 250 | 11.29 | 240 | 17.2 | |||
| Kidney disease | No | 1,898 | 85.73 | 1,091 | 78.21 | 34.007 | P < 0.001 |
| Yes | 316 | 14.27 | 304 | 21.79 | |||
| Asthma | No | 2,067 | 93.36 | 1,224 | 87.74 | 33.622 | P < 0.001 |
| Yes | 147 | 6.64 | 171 | 12.26 | |||
Univariate analysis.
χ2 represents the Chi-square test. P-values < 0.05 are considered statistically significant.
Baseline regression analysis
Table 4 reveals several significant factors influencing the outcome. Age ≥81 years shows a lower odds ratio (OR = 0.821) compared to those aged 61–8 0, though the result is not statistically significant (p = 0.275). Higher education levels, such as middle school (OR = 0.701, p = 0.001) and high school or above (OR = 0.561, p < 0.001), are associated with significantly lower odds of the outcome, indicating a protective effect. Gender differences also emerge, with males having lower odds of the outcome (OR = 0.589, p < 0.001). Marital status is marginally significant, as married individuals show a slightly lower odds ratio (OR = 0.837, p = 0.052). Region-specific differences are notable, with urban areas exhibiting significantly lower odds (OR = 0.551, p < 0.001), while central (OR = 1.451, p < 0.001) and western regions (OR = 1.653, p < 0.001) demonstrate higher odds of the outcome. Smoking, drinking, and certain chronic health conditions such as hypertension, dyslipidemia, cancer, and asthma do not show significant associations with the outcome, as their p-values exceed 0.05. In contrast, sleep duration, with both normal (OR = 0.535, p < 0.001) and long sleep durations (OR = 0.465, p < 0.001), is a significant protective factor. Among the health conditions, pulmonary disease (OR = 1.378, p = 0.002), stroke (OR = 1.446, p = 0.001), and kidney disease (OR = 1.479, p < 0.001) are significantly associated with higher odds of the outcome.
Table 4
| Category | Subcategory | OR | Std | Z | P-values | 95%CI |
|---|---|---|---|---|---|---|
| Age | 61–80 years | 1 | – | – | – | – |
| ≥81 years | 0.821 | 0.148 | −1.090 | 0.275 | 0.576–1.170 | |
| Education level | Primary school and below | 1 | – | – | – | – |
| Middle school | 0.701 | 0.075 | −3.320 | 0.001 | 0.568–0.865 | |
| High school and above | 0.561 | 0.074 | −4.410 | P < 0.001 | 0.434–0.725 | |
| Gender | Female | 1 | – | – | – | – |
| Male | 0.589 | 0.069 | −4.540 | P < 0.001 | 0.468–0.740 | |
| Marital Status | Divorced/Widowed/Separated/Single | 1 | – | – | – | – |
| Married | 0.837 | 0.076 | −1.940 | 0.052 | 0.700–1.001 | |
| Region | Rural areas | 1 | – | – | – | – |
| Urban areas | 0.551 | 0.043 | −7.720 | P < 0.001 | 0.473–0.641 | |
| Residence area | Eastern region | 1 | – | – | – | – |
| Central region | 1.451 | 0.125 | 4.310 | P < 0.001 | 1.225–1.718 | |
| Western region | 1.653 | 0.160 | 5.180 | P < 0.001 | 1.366–1.999 | |
| Smoking | No | 1 | – | – | – | – |
| Yes | 1.026 | 0.114 | 0.230 | 0.819 | 0.825–1.275 | |
| Drinking | No | 1 | – | – | – | – |
| Yes | 0.960 | 0.089 | −0.440 | 0.659 | 0.801–1.151 | |
| Sleep duration | Short sleep duration | 1 | – | – | – | – |
| Normal sleep duration | 0.535 | 0.045 | −7.410 | P < 0.001 | 0.453–0.631 | |
| Long sleep duration | 0.465 | 0.047 | −7.590 | P < 0.001 | 0.381–0.566 | |
| Hypertension | No | 1 | – | – | – | – |
| Yes | 1.056 | 0.088 | 0.650 | 0.514 | 0.897–1.242 | |
| Dyslipidemia | No | 1 | – | – | – | – |
| Yes | 1.080 | 0.086 | 0.980 | 0.329 | 0.925–1.262 | |
| Cancer | No | 1 | – | – | – | – |
| Yes | 1.113 | 0.215 | 0.550 | 0.58 | 0.762–1.625 | |
| Pulmonary disease | No | 1 | – | – | – | – |
| Yes | 1.378 | 0.142 | 3.110 | 0.002 | 1.126–1.686 | |
| Liver disease | No | 1 | – | – | – | – |
| Yes | 1.281 | 0.163 | 1.940 | 0.052 | 0.998–1.645 | |
| Heart disease | No | 1 | – | – | – | – |
| Yes | 1.143 | 0.092 | 1.670 | 0.095 | 0.977–1.339 | |
| Stroke | No | 1 | – | – | – | – |
| Yes | 1.446 | 0.156 | 3.420 | 0.001 | 1.171–1.787 | |
| Kidney disease | No | 1 | – | – | – | – |
| Yes | 1.479 | 0.146 | 3.960 | P < 0.001 | 1.219–1.795 | |
| Asthma | No | 1 | – | – | – | – |
| Yes | 1.257 | 0.176 | 1.640 | 0.102 | 0.9563–1.652 |
Baseline regression results.
OR is the odds ratio, indicating the odds of the outcome occurring for each category relative to the reference category. Std is the standard error of the coefficient. Z is the Z-score, a statistical measure that represents the number of standard deviations an observation is from the mean. P is the p-value for the hypothesis test, indicating the statistical significance of each variable, with values less than 0.05 considered statistically significant. 95% CI is the 95% confidence interval.
The regression results comparing three different years
Regarding the potential impact of the COVID-19 pandemic on the study results, we analyzed data from the years 2015, 2018, and 2020, with particular focus on the effect of the pandemic period (2020) on depressive symptoms in older adult diabetic patients in China. It is noteworthy that although depressive symptoms increased during the pandemic, the results from 2020 did not show significant deviations in the identified risk factors compared to 2015 and 2018. However, we observed a more pronounced prevalence of depressive symptoms in the 2020 cohort, especially among patients with comorbidities and those with shorter sleep durations. A comparison of results from all 3 years is provided in Supplementary Table 1 to further highlight the observed trends. These findings suggest that while the pandemic exacerbated the burden of depressive symptoms in older diabetic patients, the identified risk factors remained consistent across the years.
Sensitivity analysis
Table 5 presents the results of the sensitivity analysis, which includes regression models using CES-D thresholds of 12 and 8 for classifying depressive symptoms. The table reports odds OR, standard errors, and p-values for both models. The findings show that the OR across different categories remain consistent with the baseline regression results, regardless of the CES-D threshold applied. This consistency demonstrates the robustness, reliability, and effectiveness of the model.
Table 5
| Category | Subcategory | CES-D score with a threshold of 12 | CES-D score with a threshold of 8 | ||||
|---|---|---|---|---|---|---|---|
| OR | Std | P | OR | Std | P | ||
| Age | 61–80 years | 1 | – | – | 1 | – | – |
| ≥81 years | 0.631 | 0.129 | 0.025 | 0.928 | 0.158 | 0.659 | |
| Education level | Primary school and below | 1 | – | – | 1 | – | – |
| Middle school | 0.732 | 0.085 | 0.007 | 0.702 | 0.071 | <0.001 | |
| High school and above | 0.615 | 0.089 | 0.001 | 0.540 | 0.064 | <0.001 | |
| Gender | Female | 1 | – | – | 1 | – | – |
| Male | 0.475 | 0.060 | <0.001 | 0.601 | 0.067 | <0.001 | |
| Marital Status | Divorced/Widowed/Separated/Single | 1 | – | – | 1 | – | – |
| Married | 0.817 | 0.077 | 0.032 | 0.871 | 0.079 | 0.126 | |
| Region | Rural areas | 1 | – | – | 1 | – | – |
| Urban areas | 0.529 | 0.043 | <0.001 | 0.606 | 0.045 | <0.001 | |
| Residence area | Eastern region | 1 | – | – | 1 | – | – |
| Central region | 1.466 | 0.135 | <0.001 | 1.338 | 0.111 | <0.001 | |
| Western region | 1.776 | 0.182 | <0.001 | 1.618 | 0.153 | <0.001 | |
| Smoking | No | 1 | – | – | 1 | – | – |
| Yes | 1.175 | 0.140 | 0.177 | 1.011 | 0.108 | 0.919 | |
| Drinking | No | 1 | – | – | 1 | – | – |
| Yes | 0.964 | 0.096 | 0.715 | 1.114 | 0.098 | 0.222 | |
| Sleep duration | Short sleep duration | 1 | – | – | 1 | – | – |
| Normal sleep duration | 0.523 | 0.046 | <0.001 | 0.530 | 0.044 | <0.001 | |
| Long sleep duration | 0.432 | 0.046 | <0.001 | 0.455 | 0.045 | <0.001 | |
| Hypertension | No | 1 | – | – | 1 | – | – |
| Yes | 1.066 | 0.094 | 0.466 | 1.111 | 0.089 | 0.187 | |
| Dyslipidemia | No | 1 | – | – | 1 | – | – |
| Yes | 1.035 | 0.087 | 0.683 | 1.064 | 0.082 | 0.417 | |
| Cancer | No | 1 | – | – | 1 | – | – |
| Yes | 1.1016 | 0.221 | 0.63 | 1.266 | 0.245 | 0.223 | |
| Pulmonary disease | No | 1 | – | – | 1 | – | – |
| Yes | 1.275 | 0.136 | 0.023 | 1.534 | 0.159 | <0.001 | |
| Liver disease | No | 1 | – | – | 1 | – | – |
| Yes | 1.304 | 0.171 | 0.043 | 1.153 | 0.147 | 0.263 | |
| Heart disease | No | 1 | – | – | 1 | – | – |
| Yes | 1.202 | 0.101 | 0.029 | 1.113 | 0.087 | 0.174 | |
| Stroke | No | 1 | – | – | 1 | – | – |
| Yes | 1.498 | 0.166 | <0.001 | 1.423 | 0.153 | 0.001 | |
| Kidney disease | No | 1 | – | – | 1 | – | – |
| Yes | 1.350 | 0.139 | 0.003 | 1.403 | 0.138 | 0.001 | |
| Asthma | No | 1 | – | – | 1 | – | – |
| Yes | 1.362 | 0.193 | 0.029 | 1.196 | 0.171 | 0.209 | |
Sensitivity analysis regression results.
OR is the odds ratio, indicating the odds of the outcome occurring for each category relative to the reference category. Std is the standard error of the coefficient. P is the p-value for the hypothesis test, indicating the statistical significance of each variable, with values less than 0.05 considered statistically significant.
Discussion
The findings of this study provide novel insights into the existing literature, particularly in the context of older adults in China. By examining the prevalence of depressive symptoms and its associated factors among elderly diabetic patients, this research highlights significant risk factors such as lower education levels, female gender, shorter sleep duration, and the presence of multiple comorbidities, which substantially increase the likelihood of depressive symptoms in this population. These results address a gap in the literature on depressive symptoms among older diabetic individuals in China, offering unique contributions within the socio-cultural and healthcare context of the country. The findings provide essential empirical data that can inform the development of targeted mental health interventions, particularly for high-risk groups within the aging population, thereby advancing public health strategies in China.
The study found that male older adult diabetic patients had a significantly lower risk of developing depressive symptoms compared to females. This finding is consistent with previous studies, which suggest that women are more susceptible to depressive symptoms due to physiological and psychological factors (Dye et al., 1995; Liu et al., 2024; Kuehner, 2017). AlOzairi et al. (2024) research indicates that female sex and microvascular complications are associated with an increased likelihood of depressive symptoms. This disparity is primarily driven by biological factors (e.g., hormonal fluctuations) and psychosocial influences (e.g., disparities in coping resources and exposure to social stress). Furthermore, with increasing gender role equality (e.g., expanded employment opportunities for women), gender differences in certain mental disorders have diminished in recent years; however, the gender disparity in depressive symptoms remains pronounced (Roy and Lloyd, 2012; Salk et al., 2017).
Regarding education level, the study consistently found that lower education levels were associated with a higher prevalence of depressive symptoms. Individuals with higher education levels (high school or above) exhibited a significantly lower risk of depressive symptoms compared to those with elementary school education or below. Lorant et al. (2003) suggested that lower education levels may increase the risk of depressive symptoms, potentially due to limited socioeconomic resources and inadequate coping strategies. Conversely, higher education levels may mitigate the risk of depression by enhancing health literacy and socioeconomic status (Moussavi et al., 2007). However, Bjelland et al. (2008) did not observe a significant association between education level and depressive symptoms, attributing the discrepancy to differences in study populations and social welfare systems.
Meng et al. (2012) demonstrated a significant association between depressive symptoms, hypertension, and dyslipidemia. These conditions may collectively contribute to cardiovascular dysfunction through mechanisms such as neuroendocrine dysregulation, autonomic nervous system dysfunction, inflammation, and oxidative stress, ultimately increasing the risk of cardiovascular disease (Meng et al., 2012; Paris et al., 2024; Jiang et al., 2020).
Additionally, studies by Fang et al. and Riemann et al. identified a bidirectional relationship between depressive symptoms and sleep disorders. Sleep disturbances, such as insomnia, are not only symptoms of depression but may also act as independent risk factors for its development. This relationship is likely mediated by mechanisms including inflammatory responses, circadian rhythm disruptions, and neurotransmitter imbalances, providing critical intervention targets for the prevention and treatment of depression (Fang et al., 2019; Riemann et al., 2020). While the study found that sleep duration and efficiency were not significantly associated with depressive symptoms, recent literature suggests that objectively measured sleep duration and sleep efficiency may not always correlate with depressive symptoms (Al-Ozairi et al., 2024). This discrepancy could arise from the differences in how sleep is measured (subjectively vs. objectively) and the complexities of depression’s relationship with sleep, which may not be directly influenced by sleep duration alone.
Chronic diseases such as stroke, kidney disease, and pulmonary disease have been identified as independent risk factors for depressive symptoms, consistent with the findings of Moussavi et al. (2007), who highlighted a strong association between multimorbidity and depressive symptoms. The negative impact of chronic diseases on patients’ quality of life, social participation, and mental health serves as a potential mechanism underlying their role as risk factors for depressive symptoms. Further analysis revealed that the effects of different chronic diseases on depressive symptoms vary. For instance, stroke patients exhibited a significantly higher prevalence of depressive symptoms compared to those with other chronic conditions. Using NHANES data and bioinformatics analysis, Yang explored the bidirectional relationship between depressive symptoms and stroke, identifying shared genetic mechanisms that suggest these conditions may influence each other through common genetic and molecular pathways, thereby uncovering the genetic basis of post-stroke depressive symptoms (Yang et al., 2024). Studies by Colita et al. (2024) and Xiao et al. (2024) further elucidated the molecular mechanisms of post-stroke depressive symptoms, including neuroinflammation, innate immune-mediated neuroinflammatory responses, and shared molecular pathways with depressive symptoms, emphasizing the central role of inflammation and immunity in the onset and progression of post-stroke depressive symptoms. Hackett et al. (2005) reported that the prevalence of depressive symptoms following a stroke ranges from 30 to 50%, which aligns with the findings of this study.
This study has several limitations. First, although the CHARLS database is nationally representative, it is subject to recall bias and inaccuracies in self-reported data, particularly for sensitive variables like depressive symptoms and chronic conditions. The duration of depressive symptoms, which could be influenced by comorbid conditions such as diabetes, was not assessed, limiting our ability to isolate the specific impact of diabetes. The cross-sectional design also prevents us from establishing causal relationships. Second, the exclusion of individuals with severe mental illness and missing data may have introduced selection bias, potentially underestimating the true prevalence of depressive symptoms. The dataset does not provide information on the timing of diabetes diagnosis, limiting our ability to assess its duration and impact on depressive symptoms. Third, while we accounted for many covariates, unmeasured variables such as genetic predisposition, life events, and access to mental health services could have influenced the results. Additionally, there may be concerns about the accuracy of depressive symptom reporting, especially among poorly educated women in rural areas. Although trained interviewers conducted the survey, misunderstanding of medical terms remains a limitation. Finally, we did not differentiate between type 1 and type 2 diabetes, which is a crucial limitation. These two types of diabetes have significant differences in their pathophysiology, management, and psychological implications. As the CHARLS dataset does not specify the type of diabetes for each participant, this omission limits the interpretability of our findings. Future studies should consider distinguishing between type 1 and type 2 diabetes to better understand their differential impacts on depressive symptoms and other related factors.
Conclusion
This study highlights that certain subgroups of older adult diabetic patients, including women, individuals with low educational levels, those who are unmarried or widowed, residents of rural areas, and those with multiple chronic conditions, are at a higher risk for depression. These findings suggest that public health interventions and mental health screening strategies in China should prioritize these high-risk groups. Tailored mental health support and comprehensive care plans should be integrated into diabetes management for these populations, with particular attention to addressing their unique psychological and social challenges. Such interventions could improve both mental and physical health outcomes, ultimately enhancing the quality of life for older adults with diabetes.
Statements
Data availability statement
The data used in this study are publicly released data by CHARLS. Permissions were obtained to access the data used in our research, which were granted by the CHARLS team. The raw data is available on the website (https://charls.pku.edu.cn/en).
Ethics statement
The study was approved by the Committee of Peking University. All participants provided written informed consent. All methods in this study adhered to relevant guidelines and regulations. Given the illiteracy of some participants, the investigator obtain informed consent by presenting and explaining its contents to them. Participants then provide their consent through handprints. The studies were conducted in accordance with the local legislation and institutional requirements. Written informed consent for participation was not required from the participants or the participants’ legal guardians/next of kin in accordance with the national legislation and institutional requirements.
Author contributions
HH: Writing – original draft, Writing – review & editing. W-xW: Writing – original draft, Writing – review & editing. TH: Writing – original draft. FW: Writing – original draft. H-tZ: Writing – review & editing.
Funding
The author(s) declare that no financial support was received for the research and/or publication of this article.
Acknowledgments
We would like to express our gratitude to the members of the CHARLS project and every respondent for the time and effort they have dedicated to the CHARLS project.
Conflict of interest
The authors declare that the research was conducted in the absence of any commercial or financial relationships that could be construed as a potential conflict of interest.
Generative AI statement
The authors declare that no Gen AI was used in the creation of this manuscript.
Publisher’s note
All claims expressed in this article are solely those of the authors and do not necessarily represent those of their affiliated organizations, or those of the publisher, the editors and the reviewers. Any product that may be evaluated in this article, or claim that may be made by its manufacturer, is not guaranteed or endorsed by the publisher.
Supplementary material
The Supplementary material for this article can be found online at: https://www.frontiersin.org/articles/10.3389/fpsyg.2025.1581603/full#supplementary-material
Footnotes
References
1
Alexopoulos G. S. (2005). Depression in the elderly. Lancet365, 1961–1970. doi: 10.1016/S0140-6736(05)66665-2
2
AlOzairi A. Irshad M. AlKandari J. AlSaraf H. Al-Ozairi E. (2024). Prevalence and predictors of diabetes distress and depressive symptoms in people with type 1 diabetes. Front. Psych.15:1367876. doi: 10.3389/fpsyt.2024.1367876
3
Al-Ozairi A. Irshad M. Alsaraf H. AlKandari J. Al-Ozairi E. Gray S. R. (2024). Association of physical activity and sleep metrics with depressive symptoms in people with type 1 diabetes. Psychol. Res. Behav. Manag.17, 2717–2725. doi: 10.2147/PRBM.S459097
4
Anderson R. J. Freedland K. E. Clouse R. E. Lustman P. J. (2001). The prevalence of comorbid depression in adults with diabetes: a meta-analysis. Diabetes Care24, 1069–1078. doi: 10.2337/diacare.24.6.1069
5
Bjelland I. Krokstad S. Mykletun A. Dahl A. A. Tell G. S. Tambs K. (2008). Does a higher educational level protect against anxiety and depression? The HUNT study. Soc. Sci. Med.66, 1334–1345. doi: 10.1016/j.socscimed.2007.12.019
6
Boey K. W. (1999). Cross-validation of a short form of the CES-D in Chinese elderly. Int. J. Geriatr. Psychiatry14, 608–617. doi: 10.1002/(SICI)1099-1166(199908)14:8<608::AID-GPS991>3.0.CO;2-Z
7
Campayo A. De Jonge P. Roy J. F. Saz P. De La Cámara C. Quintanilla M. A. et al . (2010). Depressive disorder and incident diabetes mellitus: the effect of characteristics of depression. Am. J. Psychiatry167, 580–588. doi: 10.1176/appi.ajp.2009.09010038
8
Colita D. Burdusel D. Glavan D. Hermann D. M. Colită C. I. Colita E. et al . (2024). Molecular mechanisms underlying major depressive disorder and post-stroke affective disorders. J. Affect. Disord.344, 149–158. doi: 10.1016/j.jad.2023.10.037
9
Dye L. Warner P. Bancroft J. (1995). Food craving during the menstrual cycle and its relationship to stress, happiness of relationship and depression; a preliminary enquiry. J. Affect. Disord.34, 157–164. doi: 10.1016/0165-0327(95)00013-D
10
Fang H. Tu S. Sheng J. Shao A. (2019). Depression in sleep disturbance: a review on a bidirectional relationship, mechanisms and treatment. J. Cell. Mol. Med.23, 2324–2332. doi: 10.1111/jcmm.14170
11
Fiske A. Wetherell J. L. Gatz M. (2009). Depression in older adults. Annu. Rev. Clin. Psychol.5, 363–389. doi: 10.1146/annurev.clinpsy.032408.153621
12
Golden S. H. Lazo M. Carnethon M. Bertoni A. G. Schreiner P. J. Diez A. V. et al . (2008). Examining a bidirectional association between depressive symptoms and diabetes. JAMA299, 2751–2759. doi: 10.1001/jama.299.23.2751
13
Hackett M. L. Yapa C. Parag V. Anderson C. S. (2005). Frequency of depression after stroke: a systematic review of observational studies. Stroke36, 1330–1340. doi: 10.1161/01.STR.0000165928.19135.35
14
Hu T. Zhao X. Wu M. Li Z. Luo L. Yang C. et al . (2022). Prevalence of depression in older adults: a systematic review and meta-analysis. Psychiatry Res.311:114511. doi: 10.1016/j.psychres.2022.114511
15
Jiang C. H. Zhu F. Qin T. T. (2020). Relationships between chronic diseases and depression among middle-aged and elderly people in China: a prospective study from CHARLS. Curr. Med. Sci.40, 858–870. doi: 10.1007/s11596-020-2270-5
16
Ju Y. Liu T. Zhang K. Lin X. Zheng E. Leng J. (2022). The relationship between comprehensive geriatric assessment parameters and depression in elderly patients. Front. Aging Neurosci.14:936024. doi: 10.3389/fnagi.2022.936024
17
Kuehner C. (2017). Why is depression more common among women than among men?Lancet Psychiatry4, 146–158. doi: 10.1016/S2215-0366(16)30263-2
18
Li S. Zhang L. Yang B. Huang Y. Guan Y. Huang N. et al . (2024). Development and validation of a community-based prediction model for depression in elderly patients with diabetes: a cross-sectional study. Diabetes Metab. Syndr. Obes.17, 2627–2638. doi: 10.2147/DMSO.S465052
19
Liu X. Haagsma J. Sijbrands E. Buijks H. Boogaard L. Mackenbach J. P. et al . (2020). Anxiety and depression in diabetes care: longitudinal associations with health-related quality of life. Sci. Rep.10:8307. doi: 10.1038/s41598-020-57647-x
20
Liu Y. Huang S. Y. Liu D. L. Zeng X. X. Pan X. R. Peng J. (2024). Bidirectional relationship between diabetes mellitus and depression: mechanisms and epidemiology. World J. Psychiatry14, 1429–1436. doi: 10.5498/wjp.v14.i10.1429
21
Liu X. Li Y. Guan L. He X. Zhang H. Zhang J. et al . (2022). A systematic review and meta-analysis of the prevalence and risk factors of depression in type 2 diabetes patients in China. Front. Med.9:759499. doi: 10.3389/fmed.2022.759499
22
Lorant V. Deliège D. Eaton W. Robert A. Philippot P. Ansseau M. (2003). Socioeconomic inequalities in depression: a meta-analysis. Am. J. Epidemiol.157, 98–112. doi: 10.1093/aje/kwf182
23
Lustman P. J. Anderson R. J. Freedland K. E. De Groot M. Carney R. M. Clouse R. E. (2000). Depression and poor glycemic control: a meta-analytic review of the literature. Diabetes Care23, 934–942. doi: 10.2337/diacare.23.7.934
24
Meng L. Chen D. Yang Y. Zheng Y. Hui R. (2012). Depression increases the risk of hypertension incidence: a meta-analysis of prospective cohort studies. J. Hypertens.30, 842–851. doi: 10.1097/HJH.0b013e32835080b7
25
Mezuk B. Eaton W. W. Albrecht S. Golden S. H. (2008). Depression and type 2 diabetes over the lifespan: a meta-analysis. Diabetes Care31, 2383–2390. doi: 10.2337/dc08-0985
26
Mohebbi M. Nguyen V. McNeil J. J. Woods R. L. Nelson M. R. Shah R. C. et al . (2018). Psychometric properties of a short form of the Center for Epidemiologic Studies Depression (CES-D-10) scale for screening depressive symptoms in healthy community dwelling older adults. Gen. Hosp. Psychiatry51, 118–125. doi: 10.1016/j.genhosppsych.2017.08.002
27
Moussavi S. Chatterji S. Verdes E. Tandon A. Patel V. Ustun B. (2007). Depression, chronic diseases, and decrements in health: results from the world health surveys. Lancet370, 851–858. doi: 10.1016/S0140-6736(07)61415-9
28
Paris T. Daly R. M. Abbott G. Sood S. Freer C. L. Ryan M. C. et al . (2024). Diet overall and hypocaloric diets are associated with improvements in depression but not anxiety in people with metabolic conditions: a systematic review and meta-analysis. Adv. Nutr.15:100169. doi: 10.1016/j.advnut.2024.100169
29
Riemann D. Krone L. B. Wulff K. Nissen C. (2020). Sleep, insomnia, and depression. Neuropsychopharmacology45, 74–89. doi: 10.1038/s41386-019-0411-y
30
Roy T. Lloyd C. E. (2012). Epidemiology of depression and diabetes: a systematic review. J. Affect. Disord.142, S8–S21. doi: 10.1016/S0165-0327(12)70004-6
31
Salk R. H. Hyde J. S. Abramson L. Y. (2017). Gender differences in depression in representative national samples: Meta-analyses of diagnoses and symptoms. Psychol. Bull.143, 783–822. doi: 10.1037/bul0000102
32
Soleimani L. Ravona-Springer R. Lin H. M. Liu X. Sano M. Heymann A. et al . (2021). Specific dimensions of depression have different associations with cognitive decline in older adults with type 2 diabetes. Diabetes Care44, 655–662. doi: 10.2337/dc20-2031
33
Song J. Wu X. Zhang Y. Song P. Zhao Y. (2023). Association between changes in depressive symptoms and falls: the China health and retirement longitudinal study (CHARLS). J. Affect. Disord.341, 393–400. doi: 10.1016/j.jad.2023.09.004
34
Varela-Moreno E. Carreira Soler M. Guzmán-Parra J. Jódar-Sánchez F. Mayoral-Cleries F. I. N. Anarte-Ortíz M. T. (2022). Effectiveness of eHealth-based psychological interventions for depression treatment in patients with type 1 or type 2 diabetes mellitus: a systematic review. Front. Psychol.12:746217. doi: 10.3389/fpsyg.2021.746217
35
Xiao M. Chen Y. Mu J. (2024). Innate immunity-mediated neuroinflammation promotes the onset and progression of post-stroke depression. Exp. Neurol.381:114937. doi: 10.1016/j.expneurol.2024.114937
36
Yang Z. He M. Zhang Q. Li S. Chen H. Liao D. (2024). Corrigendum: exploring the bi-directional relationship and shared genes between depression and stroke via NHANES and bioinformatic analysis. Front. Genet.15:1405696. doi: 10.3389/fgene.2024.1405696
37
Zhang C. Wu Z. Lopez E. Magboo R. G. Hou K. (2023). Symptoms of depression, perceived social support, and medical coping modes among middle-aged and elderly patients with type 2 diabetes. Front. Mol. Biosci.10:1167721. doi: 10.3389/fmolb.2023.1167721
38
Zhang H. Xing Y. Zhang Y. Sheng S. Zhang L. Dong Z. et al . (2023). Association between depression and quality of life in older adults with type 2 diabetes: a moderated mediation of cognitive impairment and sleep quality. J. Affect. Disord.340, 17–24. doi: 10.1016/j.jad.2023.07.105
39
Zhao Y. Hu Y. Smith J. P. Strauss J. Yang G. (2014). Cohort profile: the China health and retirement longitudinal study (CHARLS). Int. J. Epidemiol.43, 61–68. doi: 10.1093/ije/dys203
Summary
Keywords
older adults, diabetes, depressive symptoms, sociodemographic factors, chronic diseases, CHARLS
Citation
Huang H, Wei W-x, Huang T, Wang F and Zhang H-t (2025) Prevalence and associated factors of depressive symptoms among older adult diabetic patients in China: a nationally representative cross-sectional study. Front. Psychol. 16:1581603. doi: 10.3389/fpsyg.2025.1581603
Received
22 February 2025
Accepted
05 June 2025
Published
27 June 2025
Volume
16 - 2025
Edited by
Sharad Purohit, Augusta University, United States
Reviewed by
Mohammad Irshad, Dasman Diabetes Institute, Kuwait
Slavica Kozina, University of Split, Croatia
Updates
Copyright
© 2025 Huang, Wei, Huang, Wang and Zhang.
This is an open-access article distributed under the terms of the Creative Commons Attribution License (CC BY). The use, distribution or reproduction in other forums is permitted, provided the original author(s) and the copyright owner(s) are credited and that the original publication in this journal is cited, in accordance with accepted academic practice. No use, distribution or reproduction is permitted which does not comply with these terms.
*Correspondence: Wu-xiao Wei, 853918047@qq.comHai-tao Zhang, 251746104@qq.com
†These authors have contributed equally to this work
Disclaimer
All claims expressed in this article are solely those of the authors and do not necessarily represent those of their affiliated organizations, or those of the publisher, the editors and the reviewers. Any product that may be evaluated in this article or claim that may be made by its manufacturer is not guaranteed or endorsed by the publisher.