Abstract
Introduction:
Interlimb coordination, the synchronization of movements between limbs, is essential for efficient and stable human movement. Disruptions in coordination contribute to gait dysfunction, a common challenge for individuals with Parkinson’s disease (PD). This scoping review investigates how PD impairs interlimb coordination and influences gait adaptability, emphasizing the complexity of motor control challenges.
Methods:
This review assessed individuals with PD, focusing on spatiotemporal parameters and interlimb coordination within the Population, Concept, and Context (PCC) framework. A literature search was conducted across PubMed, Web of Science™, Scopus, SPORTDiscus, and Google Scholar™ in June 2023, following PRISMA-ScR guidelines. Risk of bias was assessed using an instrument proposed by Downs and Black (1998). Out of 710 studies, 14 met the inclusion criteria. Coordination was evaluated during treadmill or overground walking.
Results:
The review identified significant gait impairments in individuals with PD, including reduced walking velocity, step length, and range of motion. Coordination deficits were reflected in increased synchronization delays, phase shifts, and higher Phase Coordination Index values, particularly among those with freezing of gait. The findings emphasize the variability in PD’s motor effects and highlight the need for individualized assessments and targeted strategies to address gait dysfunction and coordination impairments.
Discussion:
This review highlights the critical impact of PD on gait dynamics and interlimb coordination, reinforcing the need for personalized interventions aimed at improving coordination, enhancing mobility, reducing fall risk, and improving quality of life.
1 Introduction
The successful navigation of daily life necessitates the constant adaptation of human movement to changing environments. Gait adaptability, the capacity to modify walking patterns in response to environmental demands or task constraints, is essential for safe and efficient locomotion (Hak et al., 2013; Weerdesteyn et al., 2018) and encompasses both reactive adjustments, such as recovering from a trip (Weerdesteyn et al., 2018), and proactive modifications like adapting to uneven terrain (Dixon et al., 2018; Ippersiel et al., 2021). Understanding the adaptive aspects of successful gait is crucial as it allows for examination of continuous, real-time adjustments in foot placement, step length, and interlimb coordination, which are essential for safely navigating complex environments and efficiently maintaining balance and forward progression (Caballero et al., 2019; Hafer and Boyer, 2018). Impaired adaptability observed in older adults and individuals with Parkinson’s Disease (PD) can lead to difficulties in avoiding obstacles, navigating uneven terrain, and responding to unexpected perturbations, ultimately increasing the risk of falls (Alcock et al., 2018; Blumen et al., 2020; Hak et al., 2013). For PD individuals, these challenges are particularly pronounced due to the disease’s broad impact on motor control properties that further compromises the ability to effectively adapt gait patterns (Cole et al., 2017; Huang et al., 2012; Lin and Wagenaar, 2018). Affecting 30 to 60% of individuals with PD annually, falls can result in traumatic brain injuries or hip fractures and have been associated with interlimb coordination impairments that compromise balance, recovery from perturbations, and gait adaptability (Ippersiel et al., 2021; Mainka et al., 2023; Rubenstein, 2006). Understanding how PD disrupts interlimb coordination is therefore essential for identifying the underlying mechanisms associated with fall risk and developing interventions to reduce fall risks and enhance gait adaptability.
Interlimb coordination – synchronized movement of two body segments – plays a pivotal role in enabling dynamic adjustments that ensure safe locomotion (Agurto et al., 2021; Peterson et al., 2012; Roemmich et al., 2013; Weersink et al., 2022). However, PD disrupts interlimb coordination, leading to impairments in the timing, rhythmicity, and synchronization of limb movements (Agurto et al., 2021; Arippa et al., 2022; Mainka et al., 2023; Weersink et al., 2022). These impairments are further exacerbated by the natural aging process, which also affects lower limb coordination and variability (Ippersiel et al., 2021; Mainka et al., 2023; Rodriguez et al., 2013). Thus, coordination analyses provide insight into how the nervous system regulates movement by quantifying the precision and stability of interlimb synchronization (Dietz, 2011; Hausdorff, 2007) while also helping to identify disruptions in neural control strategies associated with PD and aging (Israeli-Korn et al., 2019; Plotnik et al., 2008; Yogev et al., 2007).
Quantifying interlimb coordination in PD remains a challenge as different methodologies have been employed, leading to varying theoretical and practical insights. Previous evidence has focused primarily on spatiotemporal parameters like stride length and cadence (Agurto et al., 2021; Arippa et al., 2022; Filippin et al., 2020), while others utilize gait kinematics such as joint angles and range of motion (Agurto et al., 2021; Arippa et al., 2022; Filippin et al., 2020). Understanding the strengths and limitations of these diverse methodologies is crucial for selecting appropriate assessment tools and developing targeted interventions.
This scoping review provides a comprehensive inspection of the current evidence around how the coordination patterns of walking are impacted by PD. By synthesizing the current evidence, this review aims to: (1) examine how PD influences interlimb coordination; (2) identify the key methods used to assess interlimb coordination in individuals with PD; and (3) highlight the strengths and limitations of current assessment techniques to guide future research and clinical interventions. Ultimately, this review seeks to inform our current understanding of interlimb coordination in PD and others the potential to be incorporated into the development of effective interventions to improve gait adaptability, reduce fall risk, and enhance quality of life for individuals with this condition.
2 Methods
This scoping review was conducted in accordance with the Preferred Reporting Items for Systematic Reviewers and Meta-Analysis extension for Scoping Reviews (PRISMA-ScR) (Peters et al., 2020). Studies that focused on the impact of PD on interlimb coordination during gait were collected.
2.1 Search strategy
Electronic database searches were conducted that included Web of Science™, Scopus, PubMed, SPORTDiscus. Google Scholar served as a supplementary search platform due to its less formal application in identifying articles not retrievable through the primary four databases utilized. A comprehensive search strategy was implemented across all chosen databases using keywords and controlled vocabulary where available. The search string incorporated critical contextual terms for “Parkinson’s Disease,” “interlimb,” “coordination,” “gait,” and “gait variability” to facilitate the retrieval of relevant articles. The search was conducted in June 2023 and was limited to articles written in English but did not include limitation on publication date.
2.2 Inclusive and exclusion criteria
The eligibility criteria were predetermined and structured around the PCC (Population, Concept, Context) framework (Taylor et al., 2023). The Population of interest was individuals diagnosed with PD who were aged 55 years or older, reflecting the typical age of onset and progression of motor decline associated with the disease. The Concept under investigation was the assessment of interlimb coordination during continuous, straight-line walking, which has been identified as a critical aspect of motor control impacting individuals with PD and reflects the complexity of neurological dysfunction in gait dynamics. Lastly, the Context was defined as ‘open’, indicating a broad inclusion of settings where gait analysis might take place, encompassing both clinical and everyday environments. This approach ensured a comprehensive capture of relevant data and facilitated a nuanced understanding of interlimb coordination for individuals with neurological disorders like PD.
This review focused on observational studies, randomized controlled trials, and cross-sectional investigations that assessed gait characteristics in individuals with the neurological disorder of PD in comparison to older adults. Inclusion criteria for scoping review qualifications were studies reporting on: (1) assessments of straight-line overground walking or treadmill walking; (2) participants diagnosed with neurological disorders, specifically PD, in the “on” medication phase, irrespective of age, sex, and disease stage; (3) a comparison group of age- and sex-matched healthy individuals.
Studies were excluded that did not report on the required spatiotemporal gait variables or that lacked coordination metrics. Within the participant groups conditions such as essential tremor, postural deviations such as Pisa syndrome, individuals newly diagnosed with PD, and parkinsonism symptoms, were excluded as well as studies that report asymmetrical gait patterns or that were presenting duplicate data.
2.3 Source of evidence screening and selection
The selection process for identifying relevant evidence involved multiple stages. Two reviewers (M. F.; A. C. K.) conducted the selection of studies independently. Initially, titles and abstracts of studies identified via the search strategy were assessed against predefined eligibility criteria. In the second stage of screening, the selected studies underwent full-text evaluation by the same two independent reviewers to ensure adherence to the eligibility guidelines. Conflicts during the screening process were discussed and agreed mutually agreed upon after further discussion.
2.4 Data extraction
From the selected publications (n = 14), relevant information was extracted and categorized into data sets covering study characteristics, data collection and processing approaches, and coordination findings. Study characteristics included data related to author/year, study design, participant’s characteristics, walking conditions, while information pertaining to instruments, data processing and analysis, main spatial–temporal gait outcomes were included in the second batch of extracted data. The findings around the assessment and results of interlimb coordination were group together for table presentation. The same two reviewers who independently selected the studies undertook data extraction.
2.5 Analysis and presentation of results
The results of the screening and selection process are presented in table formation with descriptive summaries provided related to the study’s aim and questions.
The primary outcome measures were determined a priori and related to the spatiotemporal and coordination metrics of gait. Detailed measurements (i.e., means and standard deviations) of gait parameters such as spatiotemporal characteristics, walking distance, stride length, cadence, step width, phases of double and single support, swing time, and range of motion (ROM) for the hip, knee, and ankle joints during the gait cycle. The analysis of coordination offers an understanding of interlimb dynamics during gait and can be assessed using different metrics. A few of the common approaches to evaluating interlimb coordination involves examining phase shifts, synchronization delays, and phase coordination index (PCI), which collectively provide insights into the spatial–temporal organization of limb motion. For instance, Carpinella et al. (2007) and Crenna et al. (2008) discussed improvements in interlimb coordination through reduced phase shifts, indicating enhanced synchronization between limbs (Carpinella et al., 2007; Crenna et al., 2008). Similarly, Peterson et al. (2012) utilize PCI to assess the degree of bilateral coordination, revealing significant differences across PD subgroups and a correlation between freezing severity and coordination impairment (Peterson et al., 2012). Additionally, it is important to consider the plane of analysis with some studies examining multiple planes (Crenna et al., 2008; Lin and Wagenaar, 2018); however, sagittal plane analysis has been the predominantly focus when investigation gait (Carpinella et al., 2007; Crenna et al., 2008).
2.6 Risk of bias assessment
The methodological quality of the included studies was assessed using the Downs and Black checklist, a 27-item tool designed to evaluate both randomized and non-randomized studies (Downs, 1998). Other researchers have utilized this checklist with appropriately tailored questions (Hu et al., 2021; Zanardi et al., 2021). Since this review focused solely on observational studies, the checklist was adapted by removing items 22–27, as they were not applicable to this study type. The final version retained questions 1–3, 5–7, 9–21 that focused on external validity, bias, confounding, and power. All studies were independently assessed by two reviewers with conflicts resolved through discussion.
3 Results
3.1 Study characteristics
The database search initially identified 710 studies. After removing 316 duplicate records, an additional 309 studies were excluded based on title and abstract screening. Full-text reviews were conducted for the remaining 82 studies, resulting in the exclusion of 68 studies due to (i) irrelevant outcome measures, (ii) inclusion of motor tasks other than straight-line gait, and (iii) study designs that did not align with the research objectives. Ultimately, 14 studies met the inclusion criteria. All included studies were cross-sectional, observational, and analytical in nature. The flow of articles through identification to final inclusion is represented in Figure 1.
Figure 1
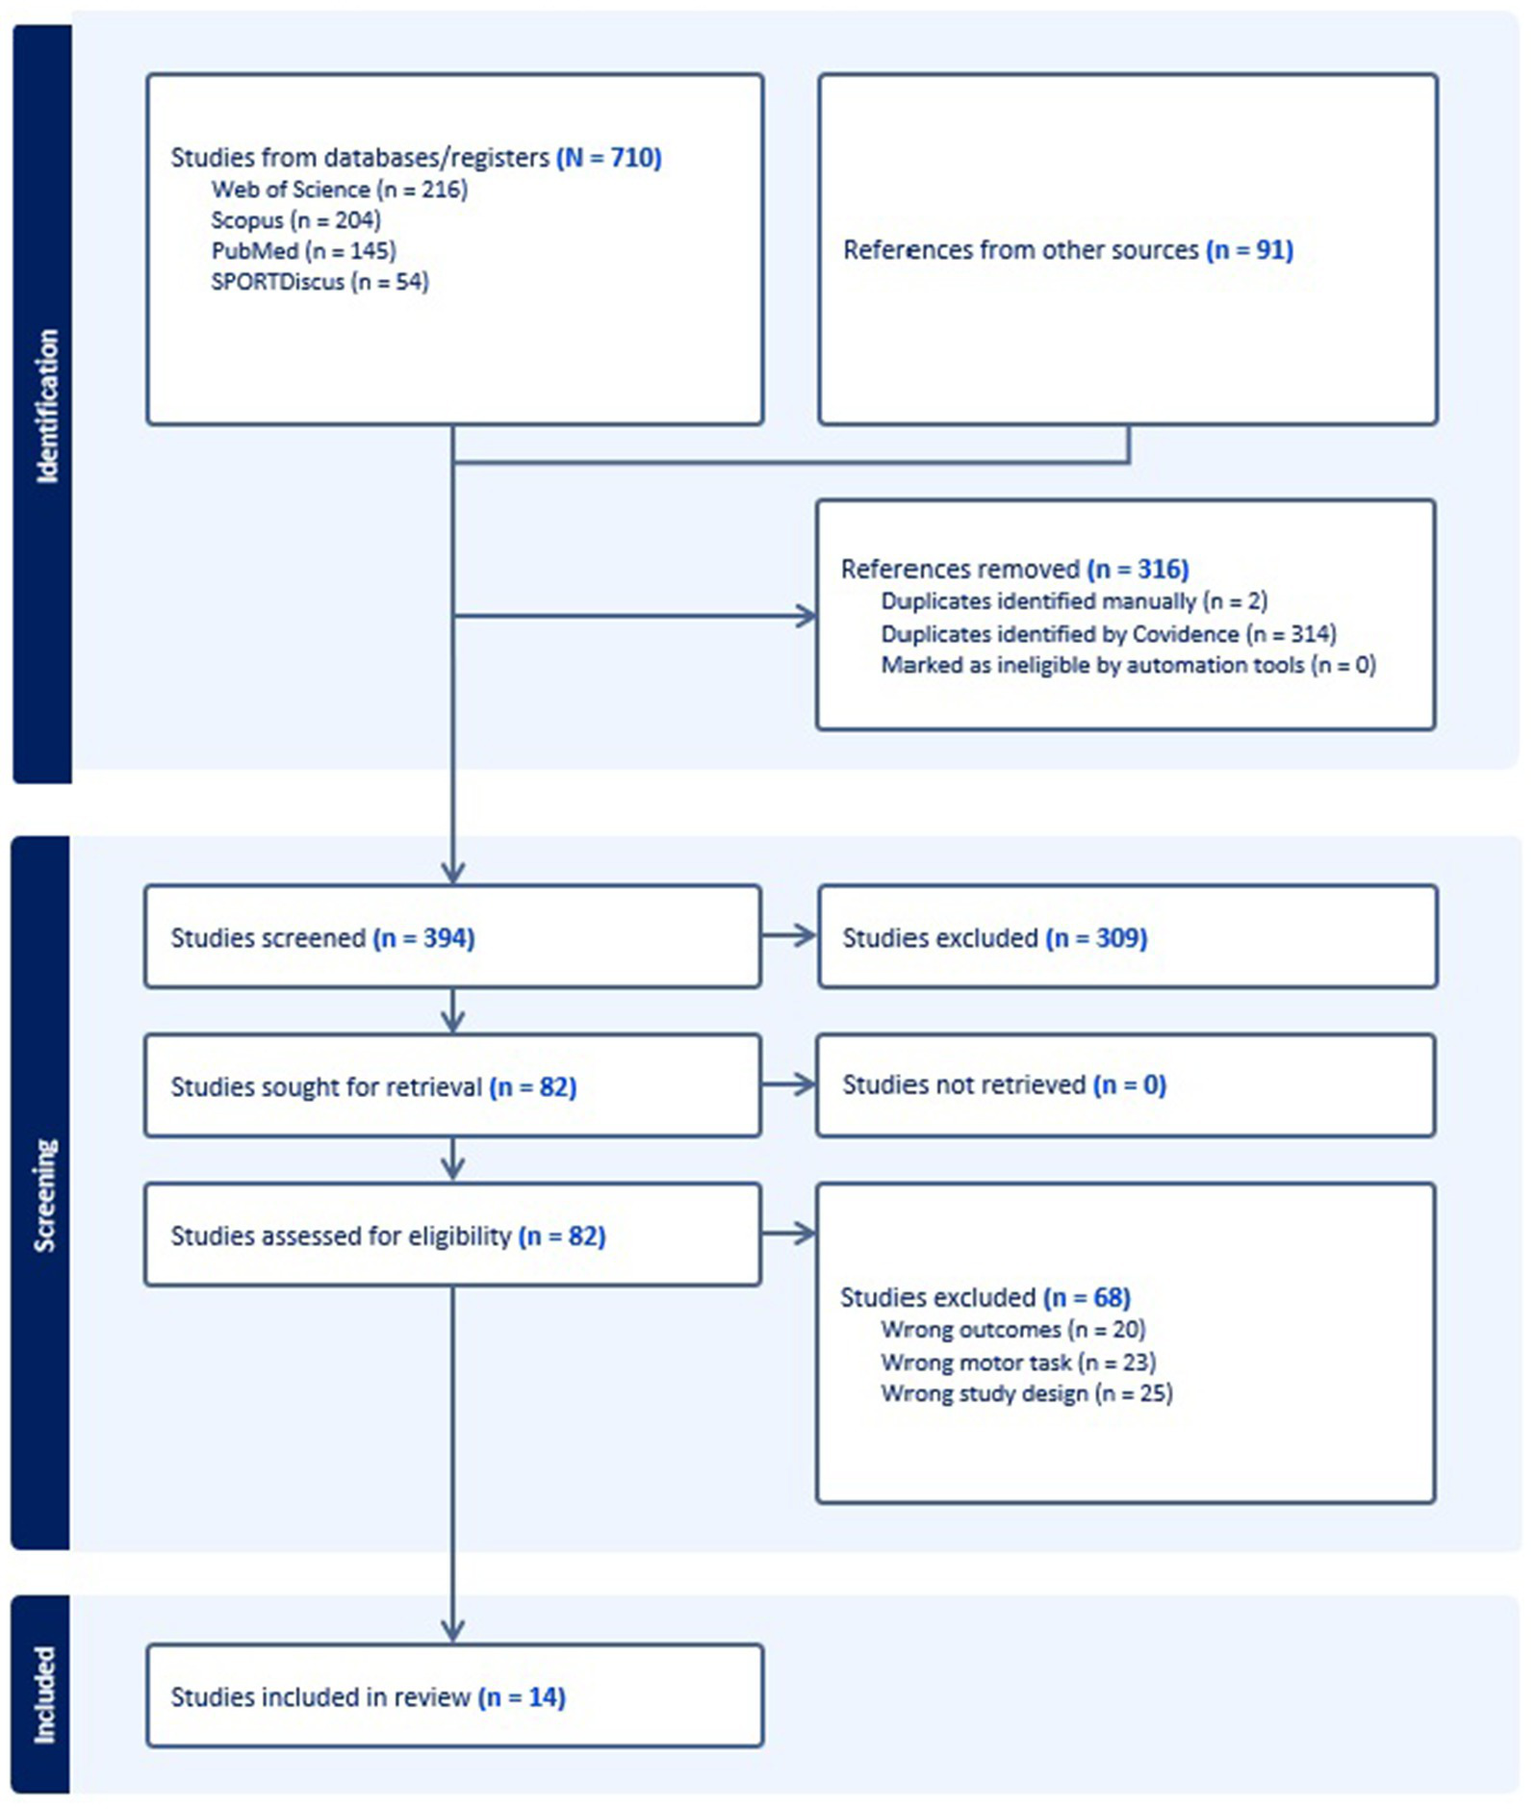
Flow diagram for the scoping review process adapted from the PRISMA statement.
3.2 Participant characteristics
Table 1 summarizes the participant characteristics across the selected studies. The sex distribution was approximately 40% female and 60% male, though three studies did not report this information. Participants’ ages ranged from the late 50s to late 70s, with an average age of 64.33 years in the PD group. Disease severity was assessed using the Hoehn & Yahr (H&Y) stage in eight studies (Agurto et al., 2021; Carpinella et al., 2007; Crenna et al., 2008; Filippin et al., 2020; Huang et al., 2012; Mainka et al., 2023; Nanhoe-Mahabier et al., 2011; Peterson et al., 2012) and the Unified Parkinson’s Disease Rating Scale (UPDRS) in nine studies (Agurto et al., 2021; Arippa et al., 2022; Huang et al., 2012; Mainka et al., 2023; Martínez et al., 2018; Nanhoe-Mahabier et al., 2011; Peterson et al., 2012; Roemmich et al., 2013; Tanahashi et al., 2013). While the H&Y stage provides a broad classification of disease progression based on motor impairment, the UPDRS offers a more detailed assessment of both motor and non-motor symptoms (Goetz et al., 2008).
Table 1
| Authors, year | Participant’s characteristics | Walking conditions | ||
|---|---|---|---|---|
| Carpinella et al. (2007) | PD group N = 10 (5F, 5 M) Age: 60.2 ± 4.8 Disease duration (years): 8–26 H&Y: 2.5–4.5 Time post-surgery: 3–28 months |
Control group N = 12 Age (years): 61.4 ± 5 |
Overground walking
|
|
| Crenna et al. (2008) | PD group N = 10 (5F, 5 M) Age (years): 60.2 ± 4.8 Disease duration (years): 8–26 H&Y: 2.5–4.5 Time post-surgery (months): 3–28 LEDD (mg): 75–500 mg/day Dopamine agonists: 0.54–15 mg/day |
Control group N = 10 (4F, 6 M) Age (years): 61.4 ± 5 |
Overground walking
|
|
| Nanhoe-Mahabier et al., 2011 | PD (Freezers) group N = 12 (4F, 8 M) Age 60.5 ± 7.9 MMSE: 29.3 ± 1.0 FAB: 16.0 ± 2.0 Disease duration (years): 9.6 ± 3.6 H&Y: 2.4 ± 0.3 UPDRS (Part III): 35.4 ± 8.9 NFOG-Q score (max. 24): 11.6 ± 5.3 |
PD (non-freezers) N = 15 (5F, 10 M) Age = 60.2 ± 9.2 MMSE: 29.1 ± 1.2 FAB: 15.7 ± 2.1 Disease duration (years): 7.7 ± 4.5 H&Y: 2.1 ± 0.3 UPDRS (Part III): 30.6 ± 7.0 |
Control group N = 15 (6F, 9 M) Age = 57.9 ± 7.3 MMSE: 29.4 ± 0.6 FAB: 17.3 ± 1.0 |
Overground and treadmill walking
|
| Huang et al. (2012) | PD group N = 8 (7F, 1 M) Age (years): 63.2 ± 8.4 UPDRS III motor score: 10.5 ± 4.5 H&Y: 1.3 ± 0.5 Disease duration (months): 15.5 ± 13.1 LED (mg): 262 ± 179 mg |
Control group N = 8 (7F, 1 M) Age (years): 62.1 ± 7.3 |
Overground walking
|
|
| Peterson et al. (2012) | PD + FOG group N = 12 Age (years): 72 ± 9 Disease duration (years): 8.0 ± 4.5 UPDRS-3: 45.5 ± 15.2 H&Y: 2.63 ± 0.8 FOG-Q total score: 12.6 ± 4.1 |
PD – FOG group N = 19 Age (years): 71 ± 9 Disease duration (years): 6.6 ± 5.1 UPDRS-3: 41.6 ± 6.4 H&Y: 2.37 ± 0.40 FOG-Q total score: 4.2 ± 3.9 |
Control group N = 10 Age (years): 69 ± 11 |
Overground walking
|
| Rodriguez et al. (2013) | PD group N = 15 Age (years): 66.6 ± 7.8 Height (cm): 172 ± 9.5 Weight (kg): 80.2 ± 13.6 |
Healthy group N = 14 Age (years): 66.2 ± 7.1 Height (cm): 166 ± 13.3 Weight (kg): 69.7 ± 17.8 |
Treadmill (split-belt) walking
|
|
| Roemmich et al. (2013) | PD group N = 18 Age (years): 63.5 ± 8.93 Weight (kg): 76.5 ± 13.7 Height (m): 1.69 ± 0.09 Overground gait speed: 1.14 ± 0.12 m/s UPDRS motor score: 22.7 ± 7.38 |
Healthy group N = 15 Age (years): 63.7 ± 8.29 Weight (kg): 74.1 ± 14.7 Height (m): 1.70 ± 0.11 Overground gait speed: 1.20 ± 0.11 m/s UPDRS motor score: 22.7 ± 7.38 |
Overground walking
|
|
| Tanahashi et al. (2013) | PD – FOG N = 11 (7F, 4 M) Age (years): 69.26 ± 6.0 Disease duration (years): 6.16 ± 5.0 UPDRS III score Total: 31.16 ± 11.1 Axial: 5.06 ± 1.5 Upper limb movement: 9.46 ± 3.7 Lower limb movement: 2.46 ± 2.0 Rigidity: 7.56 ± 4.4 Tremor: 2.56 ± 1.8 |
FOG without PD N = 9 (7F, 2 M) Age (years): 72.96 ± 5.8 Disease duration (years): 2.76 ± 0.8 FOG onset (years): 1.06 ± 1.0 UPDRS III score Total: 18.66 ± 6.8 Axial: 5.76 ± 1.7 Upper limb movement: 5.46 ± 4.3 Lower limb movement: 2.86 ± 1.5 Rigidity: 1.16 ± 0.8 Tremor: 0.36 ± 0.7 |
Overground walking
|
|
| Lin and Wagenaar (2018) | PD group N = 24 (4F, 20 M) Age (years): 62.2 ± 9.7 MMSE score: ≥24 |
Healthy group N = 26 (12F, 14 M) Age (years): 72.3 ± 5.6 |
Treadmill walking
|
|
| Martínez et al. (2018) | PD group N = 11 (1 F, 10 M) Age (years): 57 ± 7.84 Weight (kg): 81 ± 12.92 Height (m): 1.75 ± 0.09 Disease duration (years): 4 ± 1.8 UPDRS III score: 15 ± 4.28 LEDD (mg): 400 ± 327 mg MMSE: 29 ± 1.63 |
Healthy group N = 4 (4F, 0 M) Age (years): 56.5 ± 12.4 Weight (kg): 70 ± 11.03 Height (m): 1.70 ± 0.07 Young group N = 16 (7F, 9 M) Age (years): 29.5 ± 3.63 Weight (kg): 68 ± 9.28 Height (m): 1.68 ± 0.08 |
Overground walking
|
|
| Filippin et al. (2020) | PD group N = 10 (3F, 7 M) Age (years): 66.3 ± 9.37 Weight (kg): 68.65 ± 18.81 Height (m): 1.62 ± 0.09 MMSE: 27.1 ± 2.4 Disease duration (years): 6.5 ± 4.7 H&Y: 2.8 ± 0.35 Disease Rating Scale: 21.3 ± 4.19 |
Healthy group N = 10 (3F, 7 M) Age (years): 66.1 ± 9.21 years Weight (kg): 69.9 ± 9.94 Height (m): 1.65 ± 0.09 MMSE: 28.3 ± 1.8 |
Overground walking
|
|
| Agurto et al. (2021) | PD group N = 33 (17F, 16 M) Age (years): 69 ± 8 Weight (kg): 84 ± 24 Height (cm): 171 ± 9 Dominant hand (%right): 90% Disease duration (years): 6 ± 4 LEDD (mg): 380 ± 304 mg UPDRS part III (ON/OFF): 40 ± 17/54 ± 16 UPDRS Gait (ON/OFF): 1.03 ± 0.95/1.45 ± 0.97 UPDRS Posture Stability (ON/OFF): 1.36 ± 1.11/1.76 + 0.90 H&Y: 2.15 ± 0.51 Clinical symmetry (Right/Left/None): 13/18/3 Asymmetry index: |L-R|/(L + R): 0.19 ± 0.17 |
Healthy group N = 31 (10F, 21 M) Age(years): 49 ± 9 Weight (kg): 79 ± 18 Height (cm): 175 ± 10 Dominant hand (%right): 88% |
Overground walking
|
|
| Arippa et al. (2022) | PD group N = 61 (24F, 37 M) Age (years): 68.9 ± 9.3 Weight (kg): 67.1 ± 10.9 Height (cm): 164.5 ± 7.8 Disease duration (years): 7.7 ± 5.6 UPDRS III score: 19.9 ± 9.3 |
Control group N = 47 (19F, 28 M) Age (years): 66.0 ± 8.3 Weight (kg): 66.9 ± 11.1 Height (cm): 164.7 ± 6.9 |
Overground walking
|
|
| Mainka et al. (2023) | PD group N = 36 (19F, 17 M) Age (years): 61.7 ± 7.3 Weight (kg): 76.6 ± 16.2 Height (cm): 171.8 ± 10.8 Disease duration: 4.8 ± 3.4 years H&Y: 2.0 ± 0.6 UPDRS III motor score: 17.6 ± 7.7 LEDD (mg): 715.5 ± 265.6 |
Healthy group N = 36 (17F, 15 M) Age (years): 64.5 ± 9.0 Weight (kg): 78.8 ± 13.9 Height (cm): 172.1 ± 10.3: |
Overground walking
|
|
Descriptive participant’s characteristics and walking conditions descriptions.
MMSE, Mini Mental State Exam; UPDRS, Unified Parkinson’s Disease Rating Scale; H&Y, Hoehn & Yahr; FAB, Frontal Assessment Battery; NFOG-Q, New Freezing of Gait Questionnaire; LED, Levodopa Equivalent Dose; LEDD, Levodopa Equivalent Daily Dose.
Given the strong influence of dopaminergic therapy, it is also critical to consider the reporting of the medication state for PD individuals during testing when interpreting gait and coordination outcomes. Thirteen studies reported medication status, with the majority of assessments conducted in the “ON” medication state, typically between 60 min to 12 h post-medication. Only one study (Tanahashi et al., 2013) conducted assessments in the “OFF” state, allowing for a reasonably consistent interpretation of coordination metrics across medication contexts. Cognitive function was assessed using the Mini-Mental State Examination (MMSE) in three studies (Filippin et al., 2020; Martínez et al., 2018; Nanhoe-Mahabier et al., 2011) with scores ranging from 27.1 to 29.4, with an average score of 28.5, indicating relatively preserved cognitive function among participants.
3.3 Walking conditions
The walking conditions analyzed in this scoping review were selected to examine gait and mobility challenges in individuals with PD. Eleven studies assessed interlimb coordination during overground walking at self-selected gait speeds (Agurto et al., 2021; Arippa et al., 2022; Carpinella et al., 2007; Crenna et al., 2008; Filippin et al., 2020; Huang et al., 2012; Mainka et al., 2023; Martínez et al., 2018; Peterson et al., 2012; Roemmich et al., 2013; Tanahashi et al., 2013), while two studies focused on treadmill walking (Lin and Wagenaar, 2018; Rodriguez et al., 2013). One study incorporated both treadmill and overground walking, with participants walking at self-selected speeds in both conditions (Nanhoe-Mahabier et al., 2011). The walking distances for overground gait varied across studies, with most using a 10-meter walkway, some opting for an 8-meter walkway (Nanhoe-Mahabier et al., 2011), and others extending the distance beyond 20 meters (Mainka et al., 2023; Tanahashi et al., 2013).
3.4 Instruments
Table 2 presents the instruments used across studies to capture kinematic data used to examine interlimb coordination. Eight studies employed motion capture systems with a standard marker set, emphasizing kinematic analysis (Arippa et al., 2022; Carpinella et al., 2007; Crenna et al., 2008; Filippin et al., 2020; Lin and Wagenaar, 2018; Nanhoe-Mahabier et al., 2011; Rodriguez et al., 2013; Roemmich et al., 2013). In contrast, others introduced accelerometers and gyroscopes indicating a shift toward more portable and versatile measurement tools, which was complemented by the adaption of specialized like in-shoe pressure measurement system and digital cameras (Agurto et al., 2021; Huang et al., 2012; Mainka et al., 2023; Martínez et al., 2018; Tanahashi et al., 2013).
Table 2
| Author, year | Instruments (Treadmill, motion capture, markers) |
Data processing (filtering) | Data analysis | Main finding |
|---|---|---|---|---|
| Carpinella et al. (2007) | Kinematic recording: Motion Capture Marker set: 17 |
Sample Frequency: 50 Hz Filtering: low-pass filtered (cut-off frequency 3–7 Hz) |
Spatiotemporal
ROM
|
Gait Speed
ROM
|
| Crenna et al. (2008) | 3D kinematic gait analysis Marker set: 17 |
Sample Frequency: 50 Hz Filtering: low-pass filtered (cut-off frequency 3–7 Hz) |
Spatiotemporal Gait speed ROM
|
Walking Speed
Arm and Thigh ROM:
|
| Nanhoe-Mahabier et al. (2011) | Kinematic recording: Motion Capture (VICON) Marker set: NA Plug-in-Gait marker set |
Sample frequency: NA Filtering: NA |
Spatiotemporal
|
Gait velocity
Spatial step regulation
Temporal step regulation
|
| Huang et al. (2012) | Kinematic recording: Accelerometer Sensor set: 2 for each arm |
Sample frequency: 512 Hz Filtering: 50 Hz using a 3rd order Butterworth filter |
Spatiotemporal Bilateral:
|
Arm swing asymmetry in PD
Maximal cross-correlation
|
| Rodriguez et al. (2013) | Kinematic recording: Motion Capture Marker set: 35 |
Sample frequency: 120 Hz | Spatiotemporal
|
Walking speed
|
| Roemmich et al. (2013) | Kinematic recording: Motion capture Marker set: 35 |
Sample frequency: 120 Hz Filtering: NA |
Spatiotemporal
ROM
|
Walking speed
ROM
|
| Tanahashi et al. (2013) | Kinematic recording: Accelerometers/Gyroscopes Sensor set: NA |
Sampling Frequency: 100 Hz Filtering: NA |
Spatiotemporal
|
Gait parameters variability
Gait Parameter Stability
|
| Lin and Wagenaar (2018) | Kinematic recording: 3D kinematic data with Optotrak 3020 System Marker set: 19 |
Sample Frequency: 100 Hz Filtering: NA |
Spatiotemporal
|
Kinematics
|
| Martínez et al. (2018) | Kinematic and Kinetic recording: F-scan in-shoe pressure measurement system Sensor set: NA |
Sample Frequency (Kinetic): 100 Hz Filtering: NA |
Spatiotemporal
|
Kinematics
|
| Filippin et al. (2020) | Kinematic recording: digital cameras Markers set: 5 |
Sampling Frequency: 60 Hz Filtering: Fourth-order Butterworth filter with a cut-off frequency of 10 Hz |
Spatiotemporal
|
Spatiotemporal differences
Joint angle variations Smaller ROM in Study group
|
| Agurto et al. (2021) | Kinematic recording: Opal Version 1 wearable sensors (APDM Wearable Technologies) Sensor set: 6 |
Sampling Frequency: 128 Hz Filtering: 2nd order band-pass Butterworth filter with low cut-off frequency = 1 Hz and high cut-off frequency = 10 Hz |
Spatiotemporal
|
PD severity estimation
Left–Right Body Movement Symmetry in PD
Correlation with motor impairment
|
| Arippa et al. (2022) | Kinematic recording: Motion Capture Marker set: 22 |
Sample Frequency: 120 Hz Filtering: NA |
Spatiotemporal
Dynamic ROM
|
Spatiotemporal parameters of gait:
Dynamic ROM
|
| Mainka et al. (2023) | Kinematic recording: APDM Mobility Lab (ML) system (version 2) Sensor set: 6 |
Sampling Frequency: 128 Hz Filtering: NA |
Spatiotemporal:
Dynamic ROM
|
Spatiotemporal parameters of gait
Arm swing and ROM
|
Instruments, main outcomes and significant findings to assess interlimb coordination during gait.
ROM, Range of Motion; S, Stimulation; M, Medication; FOG, Freezing of Gait; RALA, Right Arm and Left Arm; LALL, Left Arm and Left Leg; HC, Health Control; AS, Arm Swing; DST, Double Support Time; CV, Coefficient of Variation; AMC, Age-Matched Control; YC, Young Control; PST, Percentage of Stance Time; PSWT, Percentage of Swing Time; CG, Control Group; SI, Symmetry Index.
3.5 Spatiotemporal variables
A synthesis of findings illustrates key differences in gait dynamics between individuals with PD and healthy controls. Five investigations have reported that gait velocity was significantly lower in PD patients compared to controls, highlighting a fundamental compromise in mobility (Arippa et al., 2022; Carpinella et al., 2007; Crenna et al., 2008; Filippin et al., 2020; Nanhoe-Mahabier et al., 2011). In contrast, three studies observed non-significant differences, suggesting variability in the disease’s progression or the influence of compensatory mechanisms in some individuals (Mainka et al., 2023; Rodriguez et al., 2013; Roemmich et al., 2013).
Additionally, Nanhoe-Mahabier et al. (2011) noted a marked reduction in step length, particularly among freezers, affecting the safety of walking (Nanhoe-Mahabier et al., 2011). This finding was further supported with additional studies reporting shorter stride lengths in PD patients that could increase the risk of falls (Arippa et al., 2022; Filippin et al., 2020). Furthermore, the same studies indicated prolonged step times during treadmill walking, possibly, as an adaptive measure to maintain balance, yet cadence was notably reduced, signaling a general slowing of movement. Lastly, Martínez et al. (2018) and Arippa et al. (2022) found no significant differences in double support time between PD and control groups but observed a higher variability in PD patients, which might reflect a more unstable gait (Arippa et al., 2022; Martínez et al., 2018). These findings related to spatial temporal characteristics collectively underscore the impact of PD-related gait impairments and the importance of individualized assessment in clinical and therapeutic settings.
The information related to the range of motion (ROM) in patients with PD, including variations in upper arm and thigh ROM, the impact of walking speed, and asymmetry in joint mobility, is summarized in Table 2.
3.6 Interlimb coordination
Research on interlimb coordination in PD populations has examined synchronization delays between limb movements using various assessment methods. This information is detailed in Table 3. Nanhoe-Mahabier et al. (2011) and Huang et al. both observed larger synchronization delays between the more affected (MA) leg versus the MA arm and the less affected (LA) leg versus the LA arm in PD patients compared to controls during treadmill walking (Huang et al., 2012; Nanhoe-Mahabier et al., 2011).
Table 3
| Author, year | Plane of movement joint/segment |
Main/significant findings to assess interlimb coordination |
|---|---|---|
| Carpinella et al. (2007) | Plane
Joint/Segment
Coordination
|
Interlimb coordination
|
| Crenna et al. (2008) | Plane
Joint/Segment
Coordination
|
Interlimb coordination
|
| Nanhoe-Mahabier et al. (2011) | Plane
Joint/Segment
Coordination
|
Interlimb coordination
Ipsilateral synchronization
Contralateral synchronization
|
| Huang et al. (2012) | Plane
Joint/Segment
Coordination
|
Interlimb coordination
|
| Peterson et al. (2012) | Plane
Joint/Segment
Coordination
|
Interlimb coordination
|
| Roemmich et al. (2013) | Plane
Joint/Segment
Coordination
|
Interlimb coordination Ipsilateral cross-correlation coefficients (CCC0 and CCC Max):
Contralateral CCC0 and CCC max:
|
| Tanahashi et al. (2013) | Plane
Joint/Segment
Coordination:
|
Interaction between group and walking condition:
|
| Lin and Wagenaar (2018) | Plane
Joint/Segment
Coordination
|
Interlimb coordination:
|
| Martínez et al. (2018) | Plane
Joint/Segment
Coordination
|
Phase coordination index (PCI)
|
| Filippin et al. (2020) | Plane
Joint/Segment
Coordination
|
Intralimb coordination similarities:
Cross-correlation and temporal coupling:
Interlimb coordination:
|
| Arippa et al. (2022) | Plane
Joint/Segment
Coordination
|
Point-by-point analysis of kinematic curves:
Waveform-based symmetry indexes:
|
| Mainka et al. (2023) | Plane
Joint/Segment
Coordination:
|
AS coordination in PWPD:
|
Summary of interlimb coordination findings categorized by joint segments, planes of movement, and corresponding coordination metrics.
AS, Arm Swing; HS, Health Subjects; DST, Double Support Time; PCI, Phase Coordination Index; AMC, Age-Matched Control; CCC0, Cross-Covariance Coefficients; FOG, freezing of gait; IRP, Instantaneous Relative Phase.
Phase shift has been used as a metric to assess interlimb coordination in PD research. Two studies have examined phase shift to quantify the timing relationships between limb movements (Carpinella et al., 2007; Crenna et al., 2008). Carpinella et al. (2007) investigated phase shift changes and reported that reductions in phase shift were associated with improved interlimb coordination (Carpinella et al., 2007). This study also examined the effects of combining sensory and motor tasks but found no additional improvements in phase shift or range of motion. Similarly, Crenna et al. (2008) assessed phase shift between the arm and ipsilateral leg motion, noting significant reductions when PD patients were on medication, suggesting that pharmacological intervention may influence coordination patterns (Crenna et al., 2008). Moreover, Crenna et al. (2008) further analyzed phase shift by examining the rhythmic oscillations of limb movements during gait cycles in individuals with PD (Crenna et al., 2008). The study reported that a significant portion of PD patients exhibited irregular or absent arm swinging. Among those who demonstrated arm swing, the movement was primarily restricted to one cycle per stride, differing from the more variable oscillations observed in control participants. The study also assessed the effects of medication on phase shift, reporting changes in coordination patterns when patients were in the medicated state.
The Phase Coordination Index (PCI) has been used to assess interlimb coordination in individuals with PD. Three studies have examined PCI as a metric for quantifying bilateral coordination deficits (Martínez et al., 2018; Nanhoe-Mahabier et al., 2011; Peterson et al., 2012). Peterson et al. (2012) investigated PCI across different gait tasks and reported that individuals with PD, particularly those with freezing of gait (FOG), exhibited higher PCI values compared to PD patients without FOG and control participants (Peterson et al., 2012). Compared to age-matched controls, PD participants showed significantly elevated PCI scores, indicating impaired synchronization and phase control. Higher PCI values were observed during more complex gait tasks, such as turning. The study also examined the relationship between PCI and freezing severity, using FOG-Q scores to assess the extent of coordination impairments. Moreover, Martínez et al. (2018) examined PCI by analyzing its relationship with clinical and demographic variables, such as disease duration, motor symptom severity, and functional mobility (Martínez et al., 2018). The study assessed how PCI measurements varied across individuals with different levels of impairment, providing additional context for its use as a coordination metric. Their findings highlighted associations between PCI and multiple factors related to gait and mobility in PD.
3.7 Methodological quality assessment
The results of the risk of bias assessment are presented in Table 4. Overall, the methodological quality of the included studies was moderate to high with all studies providing clearly statements of the research objectives, outcome measures, and participant characteristics. Most studies provided estimates of random variability and reported appropriate use of statistical tests, supporting the reliability of their findings. However, important limitations were revealed from the Downs and Black checklist in that 10 of the 14 studies did not adequately describe the distribution of potential confounders, and 13 failed to report on adverse events (Downs and Black, 1998). Additionally, no study reported blinding of participants and outcome assessor blinding was unclear in 13 studies, leading to an increased risk of reporting and selection biases. Additionally, while probability values were consistently reported, adjustments for differences in follow-up durations were universally absent. Recruitment procedures were inconsistently reported with 7 out of the 14 studies marked as ‘unclear’ regarding whether samples were representative of the target population, and two studies were explicitly marked as ‘not representative.’ These findings highlight areas for improvement in methodological reporting (particularly regarding confounders, blinding, and adverse event disclosure) while also recognizing that many studies demonstrated strengths in outcome reporting and statistical analysis.
Table 4
| Assessment criteria | Carpinella et al. (2007) | Crenna et al. (2008) | Nanhoe-Mahabier et al. (2011) | Huang et al. (2012) | Peterson et al. (2012) | Rodriguez et al. (2013) | Roemmich et al. (2013) | Tanahashi et al. (2013) | Lin and Wagenaar (2018) | Martínez et al. (2018) | Filippin et al. (2020) | Agurto et al. (2021) | Arippa et al. (2022) | Mainka et al. (2023) |
|---|---|---|---|---|---|---|---|---|---|---|---|---|---|---|
| Clear hypothesis/ aim/objective |
+ | + | + | + | + | + | + | + | + | + | + | + | + | + |
| Clear outcome measures |
+ | + | + | + | + | + | + | + | + | + | + | + | + | + |
| Patient characteristics described |
+ | + | + | + | + | + | + | + | + | + | + | + | + | + |
| Interventions clearly described |
+ | + | + | + | + | + | + | + | + | + | + | + | + | + |
| Distributions of confounders described |
− | ? | ? | + | + | − | + | + | + | + | + | ? | + | − |
| Findings clearly described |
+ | + | + | + | + | + | + | + | + | + | + | + | + | + |
| Estimates given of random variability |
+ | + | + | + | + | + | + | + | + | + | + | + | + | + |
| Adverse events reported |
− | − | + | − | − | − | − | − | − | − | − | − | − | − |
| Patients lost to follow-up described |
× | × | × | × | × | × | × | × | × | × | × | × | × | × |
| Probability values reported |
+ | + | + | + | + | + | + | + | + | + | + | + | + | + |
| Recruitment pool represents population |
− | ? | ? | ? | ? | ? | + | + | + | + | + | + | ? | ? |
| Participants represent population |
− | ? | ? | ? | ? | ? | + | + | + | + | + | + | ? | ? |
| Staff/places/ facilities match standard treatment |
− | − | − | − | − | − | − | + | − | + | − | + | ? | + |
| Participants blinded to intervention |
× | × | × | × | × | × | × | × | × | × | × | × | × | × |
| Those measuring outcomes blinded |
? | ? | ? | ? | ? | ? | ? | ? | ? | ? | ? | − | ? | ? |
| Data dredging reported |
− | − | − | + | − | + | + | − | − | + | − | ? | − | ? |
| Adjusted for different lengths of follow-up |
× | × | × | × | × | × | × | × | × | × | × | × | × | × |
| Appropriate statistical tests |
+ | + | + | + | + | + | + | + | + | + | + | + | + | + |
| Reliable compliance with intervention |
× | × | × | × | × | × | × | × | × | × | × | × | × | × |
| Main outcome measures used accurate | + | + | + | + | + | + | + | + | + | + | + | + | + | + |
| Patients in different intervention groups | + | + | + | + | + | + | + | + | + | + | + | + | + | + |
Appraisal of studies using downs and black risk of bias assessment.
Table format modified from Diment et al. (2018). “+” Yes; “₋” No; “?” Unsure; “×” Not applicable.
4 Discussion
This scoping review examined the impact of PD on interlimb coordination during gait and observed key differences between PD and older adults, highlighting the critical alterations associated with PD-related motor control impairments. Notably, gait dysfunction in PD manifests not only in variations of self-selected walking speed and spatiotemporal parameters, but also with altered interlimb coordination. One limitation identified from the findings is the lack of consistency in the methodological approaches across studies, particularly in terms of specific interlimb coordination metrics and varying protocols associated with to data collections. By synthesizing current evidence, this review clarifies the distinct interlimb coordination impairments associated with PD and highlights critical methodological gaps—laying the groundwork for future research to develop targeted, coordination-focused interventions that enhance mobility and reduce fall risk in this population.
4.1 Gait parameters
Spatiotemporal gait parameters in PD reflect fundamental impairments in locomotor control with key deficits in walking speed, stride length, cadence, and variability. These abnormalities stem from basal ganglia dysfunction, leading to impaired motor planning, execution, and adaptability (Huang et al., 2012; Nanhoe-Mahabier et al., 2011). Notably, reduced walking speed and stride length, commonly observed in PD, correlate with diminished ROM in the hip, knee, and upper limb joints, emphasizing the interconnected nature of spatiotemporal and ROM deficits in gait dysfunction. For instance, Carpinella et al. (2007) and Crenna et al. (2008) reported that PD patients exhibit significantly lower arm and thigh ROM, which worsens at higher walking speeds, suggesting that motor stiffness and rigidity restrict movement adaptability.
Building on the association between reduced walking speed and limited joint motion, subsequent research has shown that these restrictive movement patterns are further provoked under increased task demands. Specifically, studies have demonstrated that individuals with PD exhibit progressively reduced ROM as walking speed increases—suggesting a compounding effect of motor rigidity and impaired adaptability (Arippa et al., 2022; Carpinella et al., 2007; Filippin et al., 2020; Mainka et al., 2023; Roemmich et al., 2013). These limitations are primarily attributed to cardinal PD symptoms such as axial rigidity and bradykinesia. Axial rigidity restricts normal segmental rotations and leads to stiffness in the torso and hips, thereby reducing the natural range of motion during gait. Bradykinesia further exacerbates ROM restrictions by limiting the amplitude and fluidity of limb swings, especially at faster walking speeds (Lin and Wagenaar, 2018). While pharmacological treatments like L-DOPA and surgical interventions may partially improve these impairments, they often fail to restore ROM to normative levels (Buckley et al., 2017). In addition to these changes, some ROM reductions reflect compensatory strategies aimed at increasing postural stability and minimizing tremor or freezing episodes (Arippa et al., 2022; Carpinella et al., 2007; Crenna et al., 2008; Mainka et al., 2023; Roemmich et al., 2013). Although such adaptations may facilitate basic mobility, they often introduce increased gait asymmetries that, over time, undermine functional independence and elevate fall risk (Mainka et al., 2023; Plotnik et al., 2007). Overall, these findings underscore the importance of combining pharmacological and rehabilitative strategies to address both the primary motor impairments and the maladaptive compensations that limit ROM.
4.2 Coordination
The impact of PD on interlimb coordination profoundly influences gait adaptability, reflecting the complex interplay of neural and biomechanical impairments that disrupt the spatial and temporal organization of movement. Individuals with PD demonstrate significant alterations in interlimb coordination that includes phase shifts and synchronization delays as compared to young, healthy individuals (Carpinella et al., 2007; Crenna et al., 2008; Lin and Wagenaar, 2018; Martínez et al., 2018). These disruptions signify PD-related motor dysfunction, where impairments in neuromuscular control and motor planning lead to reduced gait stability and increased fall risks.
Several interconnected mechanisms likely underlie the coordination deficits observed in PD. The degeneration of the basal ganglia disrupts the central locomotor pattern generator, impairing the automatic, rhythmic control of gait and leading to irregular timing of strides (Huang et al., 2012; Martínez et al., 2018; Nanhoe-Mahabier et al., 2011). Additionally, typical PD symptoms restrict trunk rotation and slow movement execution, thereby further exacerbating phase shifts and synchronization delays during walking (Cole et al., 2017; Crenna et al., 2008; Dietz, 2011). Reduced sensitivity of leg extensor load receptors impairs the detection of ground reaction forces necessary for smooth gait cycles, likely also contributing to deficits (Martínez et al., 2018). Together, the disrupted phase relationships between arm and leg movements shifts individuals away from the desired anti-phase patterns observed in healthy individuals (Carpinella et al., 2007; Huang et al., 2012).
Environmental context also significantly impacts interlimb coordination in PD. For example, treadmill walking—by providing consistent rhythmic pacing and continuous visual flow—offers external cues that may help bypass impaired internal timing mechanisms associated with basal ganglia dysfunction, thereby supporting more consistent stride timing and enhanced interlimb synchronization (Lin and Wagenaar, 2018; Nanhoe-Mahabier et al., 2011). In contrast, overground walking demands greater adaptability and supraspinal control due to the absence of external pacing and the need for continuous self-regulation, which may reveal coordination impairments that are otherwise masked during treadmill walking. This was evident in studies where PD individuals demonstrated greater stride time asymmetry and increased PCI values during overground walking compared to treadmill conditions, particularly in those with freezing of gait (Nanhoe-Mahabier et al., 2011; Peterson et al., 2012). Thus, treadmill-based assessments may underestimate the severity of coordination deficits and lack the necessary ecological validity to capture the extent of motor dysfunction found with PD (Hafer and Boyer, 2018; Nanhoe-Mahabier et al., 2011).
Various coordination metrics—such as phase shift, synchronization delays, cross-correlation, and PCI—have been used to assess interlimb coordination deficits in Parkinson’s disease. Alterations in these metrics reflect impaired temporal coupling between limbs, which can manifest as difficulty executing complex gait tasks including turning, obstacle avoidance, and adapting to dynamic environments (Peterson et al., 2012). These coordination deficits are critically significant, as they contribute to increased fall risk, reduced mobility, and limited participation in daily activities (Kraan et al., 2017; Nanhoe-Mahabier et al., 2011). Some coordination metrics have also demonstrated sensitivity to dopaminergic therapy, with improvements observed following levodopa administration (Martínez et al., 2018), suggesting their potential utility in monitoring treatment effects (Figure 1).
To evaluate the ability of particular coordination metrics to distinguish between PD individuals and OA, we computed the overall mean and range of each coordination metric captured within the 14 studies of the scoping review. Figure 2 shows the effect size magnitude between PD and OA for individual coordination metrics. The majority of metrics exhibit large effects, although the range of values need to be noted as some metrics (synchronization, stepping phase, and cross-correlation) span across medium to large effect sizes. Conversely, the metric of relative phase showed small to medium effect sizes, suggesting limited sensitivity to differentiate PD and OA individuals. This comparative analysis needs to be viewed with caution due to the sample sizes used with the studies as well as with the limited number of data used to compute the mean effect sizes of the different coordination metrics. Future work that incorporates these variables can provide further insights when determining which coordination measures are most sensitive to disease-related changes and functional decline in PD.
Figure 2
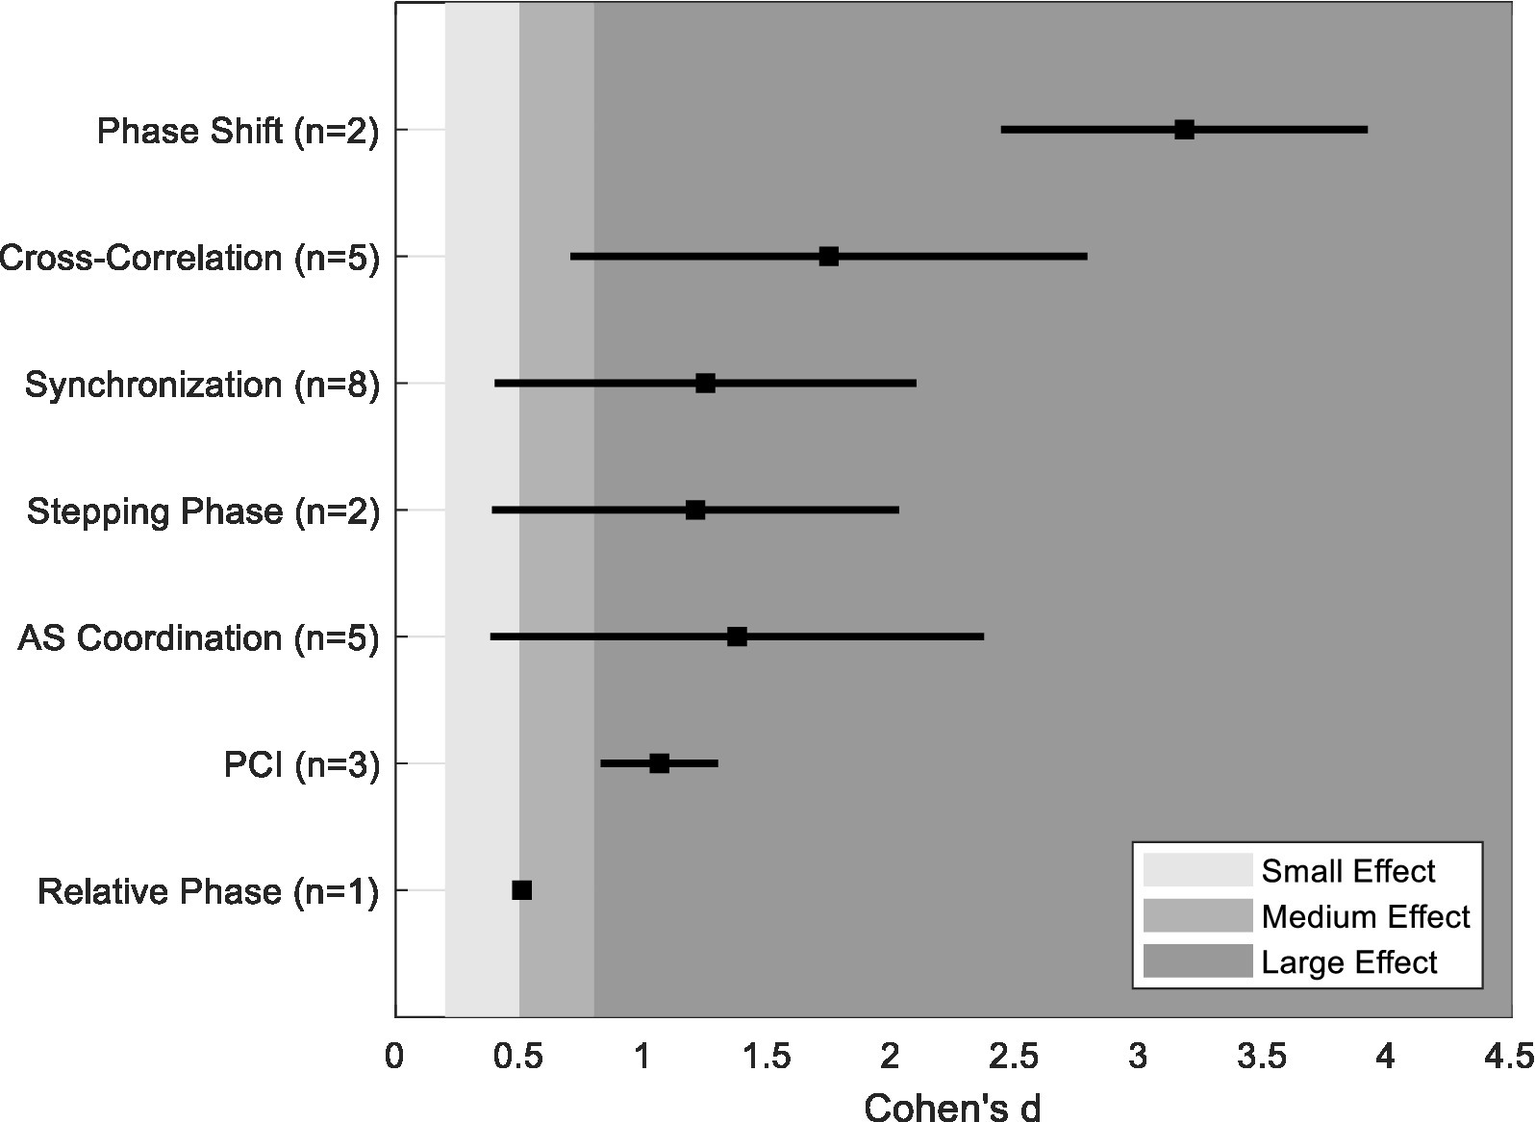
Computed mean and range of effects size (Cohen’s d) for each coordination metric.
4.3 Methodology
Assessing interlimb coordination and gait adaptability in individuals with PD relies on motion capture systems, accelerometers, and gyroscopes, with motion capture considered the gold standard (Carpinella et al., 2007; Crenna et al., 2008). However, the lack of standardized protocols across studies presents numerous challenges. The clinical heterogeneity associated with PD symptom severity, medication effects, and motor impairments necessitates stratification based on disease stage to enable meaningful comparisons (Agurto et al., 2021; Lin and Wagenaar, 2018).
Among the included studies, 13 out of 14 explicitly reported participants’ dopaminergic medication status. Most assessments were conducted in the “ON” medication state, typically 60 min to 12 h post-medication intake, while only one study (Tanahashi et al., 2013) assessed participants in the “OFF” state. In addition, clinical scores such as the Unified Parkinson’s Disease Rating Scale (UPDRS), Hoehn & Yahr (H&Y) staging, and the Mini-Mental State Examination (MMSE) were frequently used to contextualize participant status.
While the consistent reporting of medication status and clinical scores is a notable strength, the diversity of coordination metrics and limited sample sizes across studies remain major limitations, precluding subgroup analyses based on medication or disease severity. Future research should adopt standardized coordination metrics and larger, stratified samples to better elucidate how pharmacological status and disease progression influence coordination deficits in PD.
Environmental context also significantly influences gait outcomes. For instance, treadmill walking introduces rhythmic external cues that differ from the demands of overground walking (Caballero et al., 2019; Nanhoe-Mahabier et al., 2011). Moreover, the lack of consensus on key coordination metrics—such as phase shifts, synchronization delays, and PCI—complicates cross-study comparisons (Peterson et al., 2012; Roemmich et al., 2013). Varied marker sets, different approaches to data filtering, and lack of clarity around gait cycle definitions further contribute to reporting inconsistency (Carpinella et al., 2007; Mancini et al., 2021; Visscher et al., 2021). For example, the reviewed studies employed a range of motion capture systems (e.g., Vicon, Optotrak, inertial sensors), marker sets (ranging from 5 to 22 markers), and sampling frequencies (50–128 Hz). Filtering protocols also varied widely, with some studies applying low-pass Butterworth filters (cut-off frequencies between 3 and 10 Hz), while others did not report filtering parameters at all (Carpinella et al., 2007; Crenna et al., 2008; Filippin et al., 2020). Additionally, outcome measures were inconsistently defined, with studies reporting PCI, synchronization delays, and spatiotemporal parameters using non-unified analytical frameworks. These inconsistencies highlight the urgent need for standardized terminology, acquisition protocols, and processing pipelines to improve reproducibility and advance coordination research in PD.
4.4 Recommendations
To enhance the reliability and reproducibility of studies on PD and interlimb coordination, researchers should adopt standardized methodologies and detailed reporting. This approach would help address key sources of bias identified in the included studies (Table 4), such as insufficient documentation of confounding variables, lack of adverse event reporting, and absence of blinding procedures. Transparent reporting of these methodological aspects is critical to reducing inconsistencies and improving cross-study comparability.
Standardization of data acquisition procedures and signal processing protocols represent the strongest area of improvement for future studies on PD and coordination. Many studies used non-uniform pipelines for marker placement, filtering techniques, and gait event detection, which restricts reproducibility (Carpinella et al., 2007; Crenna et al., 2008; Filippin et al., 2020). Future work should prioritize the adoption of validated frameworks, which ensure consistency in motion capture and coordination quantification (Fukuchi et al., 2018). For example, adopting open-source toolkits such as the Gait and Balance Toolbox (Mancini et al., 2021) or validated protocols like those in the Brain Electrophysiological recording & Stimulation (BEST) toolbox (Hassan et al., 2022) can further strengthen reproducibility in coordination research.
Wearable sensors (e.g., IMUs, accelerometers) and machine learning algorithms represent emerging technologies that offer opportunities to evaluate interlimb coordination in both laboratory and naturalistic settings (Agurto et al., 2021). While traditional motion capture systems remain the gold standard due to their high spatial accuracy, they are limited to controlled environments. In contrast, wearable sensors enable gait monitoring in real-world contexts, but pose limitations due to the vulnerability to signal noise, placement variability, and calibration challenges. This trade-off between laboratory-based precision and ecological validity underscores the need to validate wearable technology against motion capture benchmarks and to develop standardized algorithms for extracting coordination metrics.
Additionally, future studies should address the ecological limitations of current research. Most assessments focus on straight-line walking in constrained laboratory environments (e.g., treadmill or overground), which do not capture the full complexity of everyday mobility. Researchers should incorporate more ecologically valid tasks—such as turning, dual tasking, and navigating environmental obstacles—to better characterize coordination deficits in PD. Additionally, longitudinal studies are also limited, yet essential insights can be obtained for tracking disease progression, identifying early indicators of gait deterioration, and developing preemptive interventions.
5 Conclusion
This scoping review underscores the significant impact of Parkinson’s disease (PD) on interlimb coordination, characterized by disrupted rhythmicity, synchronization, and motor adaptability—factors that contribute to gait instability. Despite consistent findings, methodological heterogeneity in measurement techniques, outcome metrics, and medication status reporting limits cross-study comparability. While treadmill-based assessments offer controlled conditions, the lack of ecological validity in real-world settings remains a critical gap. Advancing coordination research in PD requires the adoption of standardized metrics, longitudinal designs, and validated wearable sensors to enhance clinical relevance. These insights can guide personalized gait interventions and support the development of rehabilitation strategies aimed at improving mobility and monitoring disease progression in PD.
Statements
Author contributions
MF: Conceptualization, Formal analysis, Investigation, Methodology, Visualization, Writing – original draft, Writing – review & editing. BH: Methodology, Writing – review & editing. AK: Conceptualization, Formal analysis, Methodology, Supervision, Visualization, Writing – original draft, Writing – review & editing.
Funding
The author(s) declare that financial support was received for the research and/or publication of this article. Publication Charges for this article were supported by the TCU Library Open Access Fund.
Conflict of interest
The authors declare that the research was conducted in the absence of any commercial or financial relationships that could be construed as a potential conflict of interest.
Generative AI statement
The authors declare that no Gen AI was used in the creation of this manuscript.
Publisher’s note
All claims expressed in this article are solely those of the authors and do not necessarily represent those of their affiliated organizations, or those of the publisher, the editors and the reviewers. Any product that may be evaluated in this article, or claim that may be made by its manufacturer, is not guaranteed or endorsed by the publisher.
References
1
Agurto C. Heisig S. Abrami A. Ho B. K. Caggiano V. (2021). Parkinson’s disease medication state and severity assessment based oncoordination during walking. PLoS One16:842. doi: 10.1371/journal.pone.0244842
2
Alcock L. Galna B. Hausdorff J. M. Lord S. Rochester L. (2018). Gait & Posture Special Issue: gait adaptations in response to obstacle type in fallers with Parkinson’s disease. Gait Posture61, 368–374. doi: 10.1016/j.gaitpost.2018.01.030
3
Arippa F. Leban B. Monticone M. Cossu G. Casula C. Pau M. (2022). A study on lower limb asymmetries in Parkinson’s disease during gait assessed through kinematic-derived parameters. Bioengineering (Basel)9:120. doi: 10.3390/bioengineering9030120
4
Blumen H. M. Cavallari P. Mourey F. Yiou E. (2020). Editorial: adaptive gait and postural control: from physiological to pathological mechanisms, towards prevention and rehabilitation. Front. Aging Neurosci.12:45. doi: 10.3389/fnagi.2020.00045
5
Buckley C. Galna B. Rochester L. Mazzà C. (2017). Quantification of upper body movements during gait in older adults and in those with Parkinson’s disease: impact of acceleration realignment methodologies. Gait Posture52, 265–271. doi: 10.1016/j.gaitpost.2016.11.047
6
Caballero C. Davids K. Heller B. Wheat J. Moreno F. J. (2019). Movement variability emerges in gait as adaptation to task constraints in dynamic environments. Gait Posture70, 1–5. doi: 10.1016/j.gaitpost.2019.02.002
7
Carpinella I. Crenna P. Marzegan A. Rabuffetti M. Rizzone M. Lopiano L. et al . (2007). Effect of L-dopa and subthalamic nucleus stimulation on arm and leg swing during gait in Parkinson’s disease. in: 2007 29th annual international conference of the IEEE engineering in medicine and biology society. Presented at the 2007 29th annual international conference of the IEEE engineering in medicine and biology society, IEEE, Lyon, France, pp. 6664–6667.
8
Cole M. H. Naughton G. A. Silburn P. A. (2017). Neuromuscular impairments are associated with impaired head and trunk stability during gait in Parkinson fallers. Neurorehabil. Neural Repair31, 34–47. doi: 10.1177/1545968316656057
9
Crenna P. Carpinella I. Lopiano L. Marzegan A. Rabuffetti M. Rizzone M. et al . (2008). Influence of basal ganglia on upper limb locomotor synergies. Evidence from deep brain stimulation and L-DOPA treatment in Parkinson’s disease. Brain131, 3410–3420. doi: 10.1093/brain/awn272
10
Dietz V. (2011). Quadrupedal coordination of bipedal gait: implications for movement disorders. J. Neurol.258, 1406–1412. doi: 10.1007/s00415-011-6063-4
11
Diment L. E. Thompson M. S. Bergmann J. H. (2018). Three-dimensional printed upper-limb prostheses lack randomised controlled trials: A systematic review. Prosthetics & Orthotics International42, 7–13. doi: 10.1177/0309364617704803
12
Dixon P. C. Schütte K. H. Vanwanseele B. Jacobs J. V. Dennerlein J. T. Schiffman J. M. (2018). Gait adaptations of older adults on an uneven brick surface can be predicted by age-related physiological changes in strength. Gait Posture61, 257–262. doi: 10.1016/j.gaitpost.2018.01.027
13
Downs S. H. Black N. (1998). The feasibility of creating a checklist for the assessment of the methodological quality both of randomised and non-randomised studies of health care interventions. J. Epidemiol. Community Health52, 377. doi: 10.1136/jech.52.6.377
14
Filippin N. T. Martins K. C. Narimoto L. R. Da Costa P. H. Mattioli R. (2020). Lower limb coordination during gait in people with moderate Parkinson’s disease. Int. J. Ther. Rehabil.27, 1–11. doi: 10.12968/ijtr.2017.0173
15
Fukuchi C. A. Fukuchi R. K. Duarte M. (2018). A public dataset of overground and treadmill walking kinematics and kinetics in healthy individuals. PeerJ6, e4640. doi: 10.7717/peerj.4640
16
Goetz C. G. Tilley B. C. Shaftman S. R. Stebbins G. T. Fahn S. Martinez-Martin P. et al . (2008). Movement Disorder Society-sponsored revision of the unified Parkinson’s disease rating scale (MDS-UPDRS): scale presentation and clinimetric testing results. Mov. Disord.23, 2129–2170. doi: 10.1002/mds.22340
17
Hafer J. F. Boyer K. A. (2018). Age related differences in segment coordination and its variability during gait. Gait Posture62, 92–98. doi: 10.1016/j.gaitpost.2018.02.021
18
Hak L. Houdijk H. Steenbrink F. Mert A. Van Der Wurff P. Beek P. J. et al . (2013). Stepping strategies for regulating gait adaptability and stability. J. Biomech.46, 905–911. doi: 10.1016/j.jbiomech.2012.12.017
19
Hassan U. Pillen S. Zrenner C. Bergmann T. O. (2022). The brain electrophysiological recording & STimulation (BEST) toolbox. Brain Stimul.15, 109–115. doi: 10.1016/j.brs.2021.11.017
20
Hausdorff J. M. (2007). Gait dynamics, fractals and falls: finding meaning in the stride-to-stride fluctuations of human walking. Hum. Mov. Sci.26, 555–589. doi: 10.1016/j.humov.2007.05.003
21
Hu M. Kobayashi T. Zhou J. Lam W.-K. (2021). Current application of continuous relative phase in running and jumping studies: a systematic review. Gait Posture90, 215–233. doi: 10.1016/j.gaitpost.2021.08.014
22
Huang X. Mahoney J. M. Lewis M. M. Guangwei D. Piazza S. J. Cusumano J. P. (2012). Both coordination and symmetry of arm swing are reduced in Parkinson’s disease. Gait Posture35, 373–377. doi: 10.1016/j.gaitpost.2011.10.180
23
Ippersiel P. Robbins S. M. Dixon P. C. (2021). Lower-limb coordination and variability during gait: the effects of age and walking surface. Gait Posture85, 251–257. doi: 10.1016/j.gaitpost.2021.02.009
24
Israeli-Korn S. D. Barliya A. Paquette C. Franzén E. Inzelberg R. Horak F. B. et al . (2019). Intersegmental coordination patterns are differently affected in Parkinson’s disease and cerebellar ataxia. J. Neurophysiol.121, 672–689. doi: 10.1152/jn.00788.2017
25
Kraan C. M. Tan A. H. J. Cornish K. M. (2017). The developmental dynamics of gait maturation with a focus on spatiotemporal measures. Gait Posture51, 208–217. doi: 10.1016/j.gaitpost.2016.10.021
26
Lin C.-C. Wagenaar R. C. (2018). The impact of walking speed on interlimb coordination in individuals with Parkinson’s disease. J. Phys. Ther. Sci.30, 658–662. doi: 10.1589/jpts.30.658
27
Mainka S. Lauermann M. Ebersbach G. (2023). Correction to: arm swing deviations in patients with Parkinson’s disease at different gait velocities. J. Neural Transm.130:1319. doi: 10.1007/s00702-023-02646-1
28
Mancini M. Shah V. V. Stuart S. Curtze C. Horak F. B. Safarpour D. et al . (2021). Measuring freezing of gait during daily-life: an open-source, wearable sensors approach. J. Neuroeng. Rehabil.18:1. doi: 10.1186/s12984-020-00774-3
29
Martínez M. Villagra F. Castellote J. Pastor M. (2018). Kinematic and kinetic patterns related to free-walking in Parkinson’s disease. Sensors18:4224. doi: 10.3390/s18124224
30
Nanhoe-Mahabier W. Snijders A. H. Delval A. Weerdesteyn V. Duysens J. Overeem S. et al . (2011). Walking patterns in Parkinson’s disease with and without freezing of gait. Neuroscience182, 217–224. doi: 10.1016/j.neuroscience.2011.02.061
31
Peters M. D. J. Marnie C. Tricco A. C. Pollock D. Munn Z. Alexander L. et al . (2020). Updated methodological guidance for the conduct of scoping reviews. JBI Evid. Synth.18, 2119–2126. doi: 10.11124/JBIES-20-00167
32
Peterson D. S. Plotnik M. Hausdorff J. M. Earhart G. M. (2012). Evidence for a relationship between bilateral coordination during complex gait tasks and freezing of gait in Parkinson’s disease. Parkinsonism Relat. Disord.18, 1022–1026. doi: 10.1016/j.parkreldis.2012.05.019
33
Plotnik M. Giladi N. Hausdorff J. M. (2007). A new measure for quantifying the bilateral coordination of human gait: effects of aging and Parkinson’s disease. Exp. Brain Res.181, 561–570. doi: 10.1007/s00221-007-0955-7
34
Plotnik M. Giladi N. Hausdorff J. M. (2008). Bilateral coordination of walking and freezing of gait in Parkinson’s disease. Eur. J. Neurosci.27, 1999–2006. doi: 10.1111/j.1460-9568.2008.06167.x
35
Rodriguez K. L. Roemmich R. T. Cam B. Fregly B. J. Hass C. J. (2013). Persons with Parkinson’s disease exhibit decreased neuromuscular complexity during gait. Clin. Neurophysiol.124, 1390–1397. doi: 10.1016/j.clinph.2013.02.006
36
Roemmich R. T. Field A. M. Elrod J. M. Stegemöller E. L. Okun M. S. Hass C. J. (2013). Interlimb coordination is impaired during walking in persons with Parkinson’s disease. Clin. Biomech.28, 93–97. doi: 10.1016/j.clinbiomech.2012.09.005
37
Rubenstein L. Z. (2006). Falls in older people: epidemiology, risk factors and strategies for prevention. Age Ageing35:ii37–ii41. doi: 10.1093/ageing/afl084
38
Tanahashi T. Yamamoto T. Endo T. Fujimura H. Yokoe M. Mochizuki H. et al . (2013). Noisy interlimb coordination can be a Main cause of freezing of gait in patients with little to no parkinsonism. PLoS One8:e84423. doi: 10.1371/journal.pone.0084423
39
Taylor R. Sullivan D. Reeves P. Kerr N. Sawyer A. Schwartzkoff E. et al . (2023). A scoping review of economic evaluations to inform the reorientation of preventive health services in Australia. Int. J. Environ. Res. Public Health20:6139. doi: 10.3390/ijerph20126139
40
Visscher R. M. S. Freslier M. Moissenet F. Sansgiri S. Singh N. B. Viehweger E. et al . (2021). Impact of the marker set configuration on the accuracy of gait event detection in healthy and pathological subjects. Front. Hum. Neurosci.15:720699. doi: 10.3389/fnhum.2021.720699
41
Weerdesteyn V. Hollands K. L. Hollands M. A. (2018). “Gait adaptability” in Handbook of clinical neurology. ed. WeerdesteynV. (Amsterdam, Netherlands: Elsevier), 135–146.
42
Weersink J. B. De Jong B. M. Maurits N. M. (2022). Neural coupling between upper and lower limb muscles in parkinsonian gait. Clin. Neurophysiol.134, 65–72. doi: 10.1016/j.clinph.2021.11.072
43
Yogev G. Plotnik M. Peretz C. Giladi N. Hausdorff J. M. (2007). Gait asymmetry in patients with Parkinson’s disease and elderly fallers: when does the bilateral coordination of gait require attention?Exp. Brain Res.177, 336–346. doi: 10.1007/s00221-006-0676-3
44
Zanardi A. P. J. Da Silva E. S. Costa R. R. Passos-Monteiro E. Dos Santos I. O. Kruel L. F. M. et al . (2021). Gait parameters of Parkinson’s disease compared with healthy controls: a systematic review and meta-analysis. Sci. Rep.11:752. doi: 10.1038/s41598-020-80768-2
Summary
Keywords
gait adaptability, Parkinson’s Disease, gait analysis, motor dysfunction, interlimb coordination, phase coordination index
Citation
Farivar M, Huddleston BS and King AC (2025) The impact of Parkinson’s Disease on interlimb coordination: a scoping review of gait adaptability. Front. Psychol. 16:1621770. doi: 10.3389/fpsyg.2025.1621770
Received
01 May 2025
Accepted
31 July 2025
Published
14 August 2025
Volume
16 - 2025
Edited by
Guy Cheron, Université Libre de Bruxelles, Belgium
Reviewed by
Umair Hassan, Stanford University, United States
Ayoub Asadi, Iowa State University, United States
Updates
Copyright
© 2025 Farivar, Huddleston and King.
This is an open-access article distributed under the terms of the Creative Commons Attribution License (CC BY). The use, distribution or reproduction in other forums is permitted, provided the original author(s) and the copyright owner(s) are credited and that the original publication in this journal is cited, in accordance with accepted academic practice. No use, distribution or reproduction is permitted which does not comply with these terms.
*Correspondence: Morteza Farivar, morteza.farivar@tcu.edu
Disclaimer
All claims expressed in this article are solely those of the authors and do not necessarily represent those of their affiliated organizations, or those of the publisher, the editors and the reviewers. Any product that may be evaluated in this article or claim that may be made by its manufacturer is not guaranteed or endorsed by the publisher.