In the published article, there was an error in the author list.
Author Benjamin Tari was erroneously assigned as corresponding author. The correct corresponding author is Flaminia Ronca.
There was a mistake in Tables 3, 4 as published. Both tables are missing the columns for estimates and confidence intervals. There was a mistake in the captions of Tables 3, 4 as published. A clarification has been added. The corrected Tables 3, 4, along with their updated captions appear below.
Table 3
| Estimate | 95% CI [LL, UL] | p | df | F | R2 | ||
|---|---|---|---|---|---|---|---|
| DV: VO2peak | |||||||
| Extraversion | 1.15 | [0.36, 1.93] | 0.006 | ||||
| Sex (male) | 6.83 | [3.60, 10.10] | < 0.001 | ||||
| Regression | < 0.001 | 2, 120 | 13.38 | 0.15 | 0.13 | ||
| DV: anaerobic threshold | |||||||
| Extraversion | 1.40 | [0.74, 2.05] | < 0.001 | ||||
| Sex (male) | 4.57 | [1.84, 7.30] | 0.002 | ||||
| Regression | < 0.001 | 2, 120 | 11.33 | 0.16 | 0.14 | ||
| DV: peak power output | |||||||
| Extraversion | 8.06 | [3.01, 13.11] | 0.003 | ||||
| Age | 0.98 | [0.18, 1.78] | 0.018 | ||||
| Sex (male) | 99.56 | [79.70, 120.40] | < 0.001 | ||||
| Regression | < 0.001 | 3, 119 | 35.4 | 0.47 | 0.46 | ||
| DV: heart rate recovery | |||||||
| Neuroticism | −2.19 | [−3.58, −0.81] | 0.003 | 1, 66 | 9.54 | 0.13 | 0.12 |
| DV: press-ups | |||||||
| Conscientiousness | 2.17 | [0.91, 3.36] | < 0.001 | ||||
| Age | −0.29 | [−0.47, −0.11] | 0.001 | ||||
| Sex (male) | 23.32 | [18.74, 27.90] | < 0.001 | ||||
| Regression | < 0.001 | 3, 118 | 33.13 | 0.48 | 0.44 | ||
| DV: plank time | |||||||
| Conscientiousness | 3.97 | [0.06, 7.89] | 0.046 | 1, 122 | 4.06 | 0.03 | 0.02 |
| DV: PA weekly hours | |||||||
| Conscientiousness | 0.62 | [0.22, 1.22] | 0.002 | ||||
| Sex (male) | 2.15 | [0.64, 3.66] | 0.014 | ||||
| Regression | 0.001 | 2, 106 | 7.20 | 0.12 | 0.11 | ||
| DV: body fat % | |||||||
| Conscientiousness | −0.56 | [−1.10, −0.01] | 0.039 | ||||
| Age | 0.20 | [.12, 0.28] | < 0.001 | ||||
| Sex (male) | −7.76 | [−9.80, −5.62] | < 0.001 | ||||
| Regression | < 0.001 | 3, 124 | 23.43 | 0.36 | 0.35 | ||
| DV: muscle mass | |||||||
| Age | 0.18 | [.09, 0.27] | < 0.001 | ||||
| Sex (male) | 17.96 | [15.61, 20.30] | < 0.001 | ||||
| Regression | < 0.001 | 2, 125 | 128.8 | 0.67 | 0.67 | ||
Multiple linear regression output for each component of baseline physical fitness following backward elimination.
The full models included all Big Five personality traits, age and sex.
Full models included all Big Five personality traits + Sex + Age, predictors were removed via backward elimination until all variables were significant (p < 0.05).
Table 4
| Estimate | CI [LL, UL] | p | df | F | R2 | ||
|---|---|---|---|---|---|---|---|
| DV: enjoyed stretching | |||||||
| Neuroticism | 0.18 | [0.03, 0.33] | 0.023 | 1, 32 | 5.58 | 0.15 | 0.12 |
| DV: enjoyed strength session | |||||||
| Sex (male) | 0.10 | [−0.04, 0.24] | 0.18 | 1, 50 | 1.99 | 0.04 | 0.03 |
| DV: enjoyed lab low intensity session | |||||||
| Neuroticism | −0.25 | [−0.42, −0.08] | 0.005 | 1, 43 | 8.74 | 0.17 | 0.15 |
| DV: enjoyed easy long ride | |||||||
| Agreeableness | 0.24 | [0.01, 0.27] | 0.049 | 1, 42 | 4.11 | 0.09 | 0.07 |
| DV: enjoyed threshold ride | |||||||
| Neuroticism | −0.19 | [−0.35, −0.03] | 0.024 | 1 | 1.29 | ||
| Openness | −0.25 | [−0.40, −0.09 | 0.005 | 1 | 5.13 | ||
| Sex (male) | −0.63 | [−1.21, −0.05] | 0.031 | 1 | 4.73 | ||
| Regression | 0.015 | 3, 51 | 3.85 | 0.18 | 0.14 | ||
| DV: enjoyed high intensity interval ride | |||||||
| Extraversion | 0.21 | [0.01, 0.43] | 0.031 | 1 | 0.68 | ||
| Openness | −0.40 | [−0.65, −0.15] | 0.004 | 1 | 9.10 | ||
| Regression | 0.012 | 1, 46 | 4.89 | 0.18 | 0.14 | ||
| DV: enjoyed lab VO2peaktest | |||||||
| Extraversion | 0.13 | [0.02, 0.25] | 0.039 | 1, 117 | 4.32 | 0.04 | 0.03 |
Multiple linear regression outputs predicting enjoyment of each exercise session with personality traits following backward elimination.
The full models included all Big Five personality traits, age and sex.
There was an error in the Results section: Figure 4 was omitted. Figure 4 and its corresponding information are provided below.
Figure 4 should be cited in the following sentence, at the end of the Results section, under “Intervention Outcomes”.
Furthermore, participants who scored high on neuroticism reported a greater decrease in stress after the intervention, F(1, 49) = 9.94, p = 0.003, = 0.15 (Figure 4).
Figure 4 and its caption appear below.
Figure 4
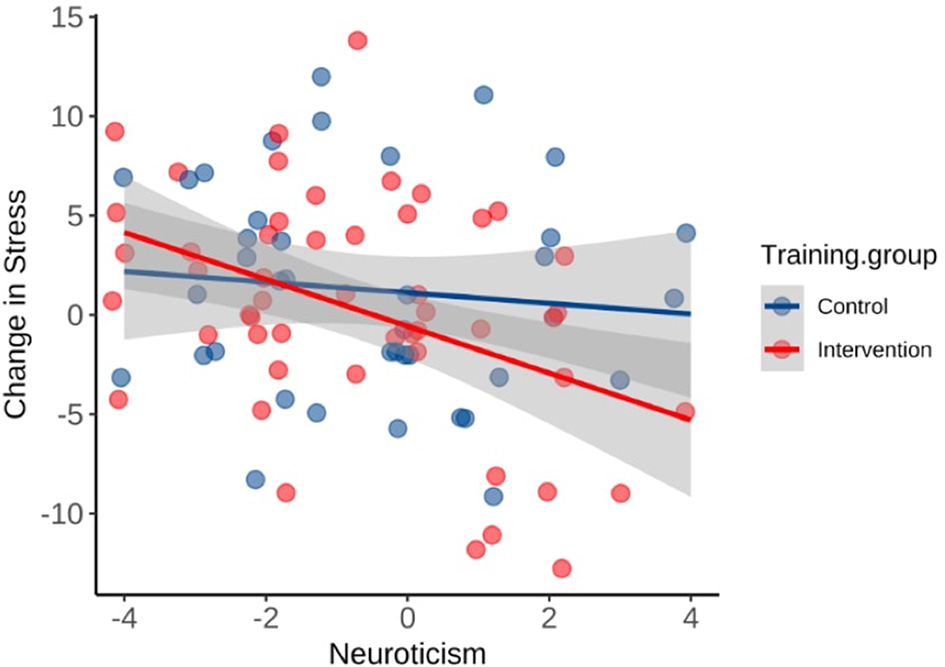
Relationship between neuroticism scores and changes in stress after the 8-week period. The prediction was significant in the intervention group only (R2 = 0.17, p = 0.003).
The original version of this article has been updated.
Statements
Publisher’s note
All claims expressed in this article are solely those of the authors and do not necessarily represent those of their affiliated organizations, or those of the publisher, the editors and the reviewers. Any product that may be evaluated in this article, or claim that may be made by its manufacturer, is not guaranteed or endorsed by the publisher.
Summary
Keywords
Big Five, physical activity, neuroticism, exercise tailoring, fitness
Citation
Ronca F, Tari B, Xu C and Burgess PW (2025) Correction: Personality traits can predict which exercise intensities we enjoy most, and the magnitude of stress reduction experienced following a training program. Front. Psychol. 16:1663653. doi: 10.3389/fpsyg.2025.1663653
Received
10 July 2025
Accepted
17 July 2025
Published
08 August 2025
Volume
16 - 2025
Edited and reviewed by
Aleksandra Maria Rogowska, University of Opole, Poland
Updates
Copyright
© 2025 Ronca, Tari, Xu and Burgess.
This is an open-access article distributed under the terms of the Creative Commons Attribution License (CC BY). The use, distribution or reproduction in other forums is permitted, provided the original author(s) and the copyright owner(s) are credited and that the original publication in this journal is cited, in accordance with accepted academic practice. No use, distribution or reproduction is permitted which does not comply with these terms.
*Correspondence: Flaminia Ronca f.ronca@ucl.ac.uk
†ORCID: Flaminia Ronca orcid.org/0000-0001-7423-1088
Benjamin Tari orcid.org/0000-0003-3751-3179
Paul W. Burgess orcid.org/0000-0002-6894-6658
Disclaimer
All claims expressed in this article are solely those of the authors and do not necessarily represent those of their affiliated organizations, or those of the publisher, the editors and the reviewers. Any product that may be evaluated in this article or claim that may be made by its manufacturer is not guaranteed or endorsed by the publisher.