 Cecilie Bay Wirenfeldt1,2*†
 Jonas Steenholdt Sørensen1*†
 Katharina Johanna Kreissig1‡Grethe Hyldig1
 Susan Løvstad Holdt1
 Lisbeth Truelstrup Hansen1
- 1The National Food Institute, Technical University of Denmark, Kongens Lyngby, Denmark
- 2Department of Biotechnology and Food Science, Norwegian University of Science and Technology, Trondheim, Norway
Sugar kelp (Saccharina latissima) is a native European brown macroalga with the potential to become a vital part of the green transition of the food industry. Knowledge of the sugar kelp shelf-life is essential to designing the food supply chain to ensure safe and high-quality food. Establishing a single-compound quality index (SCQI) of freshness would be useful for the industry. However, information is currently lacking on how different post-harvest treatments affect the shelf-life of sugar kelp, even though it is important knowledge for manufacturers, authorities and consumers. The objective of this study was to establish the shelf-life of refrigerated sugar kelp following five post-harvest treatments and evaluate the effect of these treatments on changes in quality attributes (sensory, microbial, chemical and physical) during storage to select the SCQI. The post-harvest treatments included washing in sea water, washing in potable water, blanching for 2 min in sea water or potable water and untreated sugar kelp. Based on sensory analysis, the refrigerated (+ 2.8°C) shelf-lives for sugar kelp from all treatments were seven to 9 days. The end of the sensory shelf-life correlated with the development of >7 log (CFU g−1) aerobic viable counts, suggesting this attribute can be used as a SCQI to evaluate the shelf-life of sugar kelp. The microbiota was dominated by putative spoilage organisms from the Pseudoalteromonadaceae and Psychromonadaceae families. Untreated and washed sugar kelp continued to respire and consume carbohydrates up to 5 days post-harvest, indicating respiration rates may be used to determine freshness of non-blanched kelp. Favorable organoleptic properties, e.g., sweetness and umami, decreased during storage and coincided with a reduction in water-soluble mannitol and free glutamic acid. Both blanching treatments changed texture and color and reduced iodine and vitamin C contents while retaining components such as fucoxanthin, chlorophyll a and β-carotene. This study provides crucial documentation of quality changes during the post-harvest storage period of sugar kelp, including information about sugar kelp spoilage and nutrient changes, which would facilitate the development of best practices for manufacturers using sugar kelp in their production of food.
1 Introduction
Macroalgal production in Europe is limited, as it only contributes to 0.8% or 0.3 million metric tons of the global output (Cai et al., 2021). Wild harvest currently dominates European macroalgal production with just 3.9% of the produced biomass originating from macroalgal farms (Cai et al., 2021). The low share of cultivated macroalgae in Europe is unusual compared to the global dominance of cultivated macroalgae with an estimated total cultivated market share of 97.0% of the total production (Cai et al., 2021). Sugar kelp (Saccharina latissima) is a brown macroalga native to Europe, which grows from the Iberian Peninsula in the South (Peteiro et al., 2016) to Tromsø in the North (Matsson et al., 2019). It has been identified as a cultivable species with the potential to increase its annual production rapidly (Olafsen et al., 2012). Sugar kelp is thought to represent the future of European macroalgal production because of its many potential uses in human consumption (Mahadevan, 2015), food additives (Bixler and Porse, 2011), animal feed (Rajauria, 2015) and biofuels (Marquez et al., 2015).
Several studies imply the importance of extending the shelf-life of sugar kelp (Sappati et al., 2017; Akomea-Frempong et al., 2021b, 2021a; Skonberg et al., 2021). However, only a few studies have conducted storage trials to determine sugar kelp’s shelf-life or post-harvest quality changes. Løvdal et al. (2021) reviewed the microbial food safety of macroalgae and recommended further research into the impact of processing technologies on pathogenic microorganisms and product shelf-life. To our knowledge, data on the shelf-life of sugar kelp has so far only been reported in a master thesis (Nayyar, 2016), while there are several published reports on the shelf-life of fresh or lightly processed products made from green and red macroalgae (Liot et al., 1993; Paull and Chen, 2008; Nayyar and Skonberg, 2019). However, direct comparison of shelf-lives of different macroalgae should be done with caution or not at all. The reason for the caution is the extreme taxonomical differences between brown, red and green algae, i.e., green macroalgae (Chlorophyta) and red macroalgae (Rhodophyta) belong to the Viridiplantae and Biliphyta subkingdoms, respectively, located within the Plantae kingdom. In contrast, brown macroalgae (Phaeophyceae) belong to the Ochrophyta phylum in the Chromista kingdom (Ruggiero et al., 2015).
Shelf-life is defined as the period after harvest, where the sugar kelp under the given storage conditions remains safe to consume and unspoiled, i.e., it retains desirable qualities in terms of sensory, chemical, physical, microbiological and functional characteristics (Man, 2016). Storage at temperatures above freezing will cause the sugar kelp to spoil over time due to non-microbial and microbial changes, which can coincide. Since knowledge about shelf-lives is limited for macroalgae, inspiration for determination of post-harvest quality changes may be taken from research on vegetables. For example, respiration rate has been shown to be associated with the shelf-life of horticultural products, leading to its use as an indicator of deterioration rate and freshness. Harvested products are still alive, and the cells will be metabolic active and respire (Watada and Qi, 1999). The shelf-life of plant products can generally be correlated to the CO2 production rate (Robinson et al., 1975). Another method to determine the shelf-life of horticultural products uses the total viable count of microbes. A maximum acceptable contamination level of 7.7 log (CFU g−1) has been proposed (Corbo et al., 2006). However, establishing an inaccurate or too conservative shelf-life can lead to increased food waste (Man, 2016). It is believed that the level of food waste for macroalgae is high and in the same range as fruits and vegetables, as a single annual harvest characterizes both commodities. Here large biomasses with a relatively short shelf-life become available over a short period. Taken together, this has been estimated to lead to 22–49% losses during the post-harvest stage of the value chain (FAO, 2022).
Suitable post-harvest treatments have not been thoroughly investigated for sugar kelp. Food manufacturers and authorities need to understand how different post-harvest treatments changes the quality of sugar kelp. Washing of the sugar kelp is commonly applied as a first step post-harvest process to remove contaminants, e.g., sand, mud, stones, and small crustaceans (Liot et al., 1993). Blanching is a common food processing method used for multiple purposes. Nielsen et al. (2020) showed that blanching of sugar kelp in potable water decreases the iodine content, leading to compliance with the recommended iodine threshold level (2,000 mg kg−1 (ANSES, 2018)) while retaining the desirable total phenolic content (TPC) and the radical scavenging activity. Blanching can also remove undesirable substances and microorganisms (Dagostin, 2016) or be used industrially as a pre-treatment before a fermentation process (Bruhn et al., 2019). Suitable post-harvest treatments with control of temperature and respiration rates can delay microbial spoilage and potentially extend the product’s shelf-life (ICMSF, 2011). Potable water is a costly resource, which is limited in some coastal regions. The macroalgal industry is therefore looking at ways to reduce potable water utilization, including the use of sea water during post-harvest treatments. However, more information is needed on whether this can be done without negative quality changes. In addition, there is a knowledge gap on potential post-harvest treatment-induced changes in other quality parameters, such as vitamin C, organic acids, fucoxanthin, chlorophyll a and beta-carotene.
The objective of this study was to determine the sensory shelf-life of sugar kelp and evaluate post-harvest quality parameters to establish a single-compound quality index for spoilage. In addition, the study aimed to investigate if potable and sea water usage during sugar kelp washing and blanching affected the quality and shelf-life. A single batch of freshly harvested sugar kelp was processed, analyzed and evaluated to achieve these aims. First, we studied the sensory, physical, chemical, and microbial changes in a 16-days storage trial. Second, we identified potential single-compound quality indices and studied their treatment-related quality changes during refrigerated storage of sugar kelp from the different treatment methods. This study will aid food manufacturers and food authorities working with sugar kelp to establish best practices for post-harvest treatments and aid in shelf-life determination for the industry to provide safe and high-quality sugar kelp.
2 Material and methods
2.1 Harvest of sugar kelp, processing, packing and storage
Sugar kelp (Saccharina latissima) was harvested from the cultivation site of the company Dansk Tang Aps in Isefjord South of Rørvig, Denmark (N55°56′ E11°46′) during the commercial harvest in May 2020. The salinity at the site was 22 PSU. A total of 16 kg (400 individual blades) of sugar kelp were harvested by hand-cutting the blades just above the growth zone, leaving the holdfast and growth zone of the blade for re-growth. The blades were approximately 80 cm long. The sugar kelp was gently packed in food-grade plastic containers and transported by car from the harvest site to our laboratories in Kgs. Lyngby, Denmark (110 km). During the transportation and storage, the temperature was logged every 30 min with four loggers (TinyTag Plus, Gemini Data Loggers Ltd., Chichester, United Kingdom) and remained at an average of 17 ± 5 C during the 2.5 h of transportation. Upon arrival at the laboratory, the sugar kelp was placed in a cold room (2.8 ± 0.4°C) until the sugar kelp was processed later the same day (less than 12 h after harvest).
A storage trial with five treatments was carried out by randomly dividing the harvested sugar kelp into five sub-samples. The treatments included Untreated (Un), packed directly from the plastic containers. Washed in potable water (WP), comprised of washing the sugar kelp for 5 min in 16°C potable tap water (Lyngby-Taarbæk Forsyning A/S, Denmark) followed by transfer to a tray for drip-drying for 5 min. Washed in sea water (WS), comprised of washing for 5 min in 4.0°C UV-treated sea water with a PSU of 35 (DTU Aqua, Kgs. Lyngby, Denmark), followed by transfer to a tray for drip-drying for 5 min. Blanched in potable water (BP), where the sugar kelp was submerged for 2 min in hot potable water (76°C), followed by rapid cooling for 3 min in potable water (16°C) and drip-drying for 5 min. Blanched in sea water (BS), where the sugar kelp was submerged for 2 min in hot (80°C) treated sea water followed by rapid cooling in chilled treated sea water (4.2°C) for 3 min and drip-drying for 5 min. All treatments were carried out in the ratio of 50 g sugar kelp to 1 L water. Aliquots of approximately 45–55 g (1-2 individuals) were placed in plastic trays (71–51A hvid/PS, Færch Plast, Holstebro, Denmark). The tray and sugar kelp were placed in thick (70 μm) polyethene (PE) plastic bags with a high permeability of >6 g m−2 d−1 for water vapor, >3,000 cm3 m−2 d−1 atm−1 for O2 and >14,000 cm3 m−2 d−1 atm−1 for CO2 (H902, Topiplast A/S, Greve, Denmark) and sealed. However, the samples (five bags from each treatment) intended for the determination of respiration rates were packed in multiple barrier (MB) bags made from a 117 ± 6 μm laminate film with low gas permeability of 0.45 cm3 m−2 d−1 atm−1 for O2 and 1.8 cm3 m−2 d−1 atm−1 for CO2 (NEN 40 HOB/LLPDE 75, Amcore, Horsens, Denmark) and sealed. All packaged samples were stored at an average product temperature of 2.8 ± 0.4°C during the storage trial.
2.2 Sampling plan
In order to determine the shelf-life of sugar kelp and post-harvest quality changes, a storage trial was designed following the ISO standard (ISO, 2015). A descriptive profile analysis (Section 2.3) was used to determine a sensory shelf-life, with the harvest as the starting point and a test period of 16 days. The test period was chosen based on the reported estimated shelf-life of six to 12 days (Nayyar, 2016). The test steps (sampling days) were set to the following intervals on days: 1, 3, 5, 7, 9, 13 and 16. On each sampling day, 45 bags were randomly selected from the five treatments, nine from each, and analyzed as described in Figure 1A. Three biological replicates were evaluated in all cases, with technical replicates ranging from one to three depending on the analysis (Figure 1A). Five biological replicates were used for gas analysis for the respiration rates of the harvested and processed sugar kelps (Figure 1B).
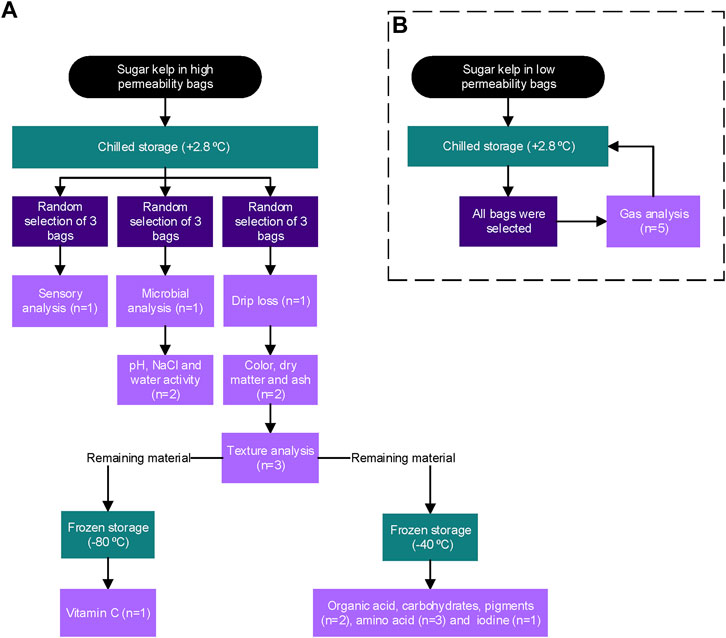
FIGURE 1. Overview of the sensory, microbial, and physicochemical analyses performed on stored sugar kelp on each sampling day. (A) Sugar kelp packed in high permeability polyethylene bags were analyzed for all variables except respiration. Nine bags were randomly withdrawn from each treatment and analyzed. (B) Sugar kelp packaged in low permeability multiple barrier bags were analyzed for respiration rates, all bags were selected, the gas composition was analyzed, and the bags were placed in the chilled storage room again. The number of technical replicates is indicated in the boxes (n) for each variable.
2.3 Sensory evaluation
The sensory evaluation was performed as a descriptive profile analysis. The first session was used to set up the vocabulary, and the next session was used to train the judges in using the scale for the 13 attributes (Table 1). On each day of analysis, 15 bags of sugar kelp were evaluated by an internal panel consisting of five judges. Each bag was given a random three-digit code and placed on cooling plates with moist clean linens on top to avoid changing sensory scores during the session. Samples were presented under artificial daylight (6500 K, L 36W 965 Lumilux De Luxe, Osram, Germany). The individual judge assessed samples individually, and the judges came to a consensus on the intensity of the attributes under the guidance of the panel leader. Off-odors and new characteristics were also noted down. The attributes were evaluated on a 15 cm unstructured line scale with two anchors placed 1.5 cm from each end. All attributes had the scale anchor words “little” (left side) and “a lot” (right side), apart from the texture attribute “leather”, which had the anchor words “leather” and “parchment".
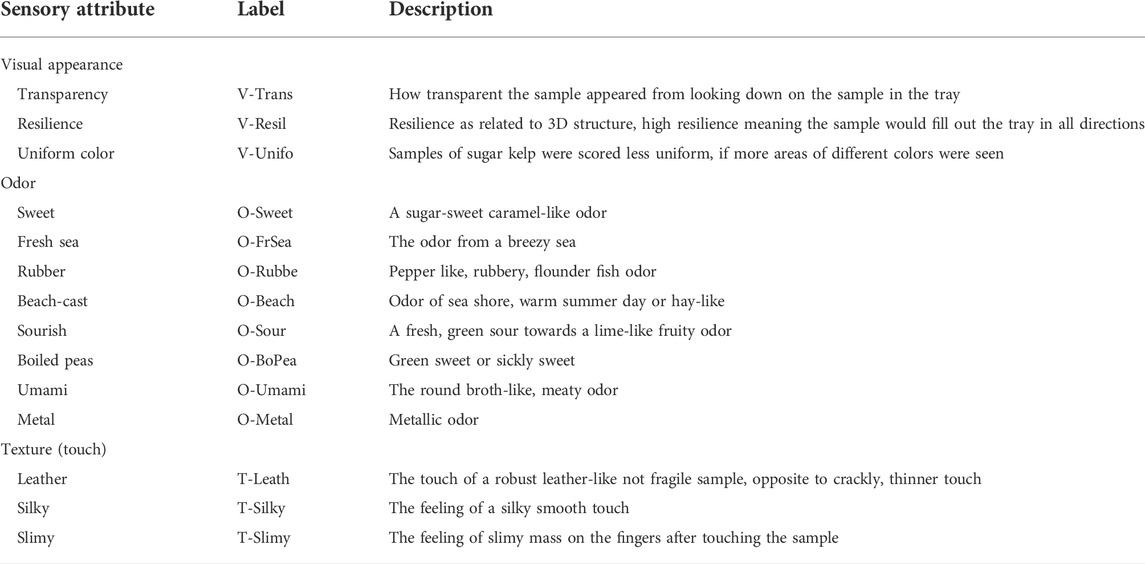
TABLE 1. Sensory attributes used for the descriptive profile analysis of the seaweed samples together with the corresponding label used for the PCA bi-plot and the description of the attributes.
2.4 Physical changes during storage
Drip loss, color, and texture were the parameters analyzed to determine physical changes during storage. Drip loss was measured by gravity draining of liquid in each bag (n = 3) for 1 min and calculated as the percentage loss of the total weight (Guldager et al., 1998). Color was measured by a Chroma meter (CR-200, Konica Minolta, Tokyo, Japan) recording the CIE L* a* b* color scale. From each bag (n = 3), two pieces (Ø = 8 cm) of sugar kelp were cut out. The two pieces were measured three times each by the Chroma meter. The samples were put on a white surface (L* = 91.5, a* = -4.26, b* = 3.33). Texture analyses were performed at three sites of the sugar kelp blade, i.e., one site close to the harvest cut, one at the middle of the blade and the last site at the top section of the blade. The texture analysis was run on TA. XTplus Texture Analyser (Stable Micro Systems, Surrey, United Kingdom) equipped with a 5 kg load cell, with a Warner Bratzler Blade Set with “V” slot blade (HDP/WBV) running at a speed of 5 mm s−1. The texture curve was recorded with a resolution of 500 points s−1 and analyzed by the instrumental software (Texture Exponent, Version 6.1.15, Stable Micro System, Surry, England). From the time-force graphs, the firmness (g) and toughness (g s−1) were calculated by the instrument’s software. The remaining sample material in the three bags from each treatment was frozen at −40 C and freeze-dried (Christ beta one to eight, Merck) for further analyses. However, for vitamin C analysis, an aliquot was frozen and ground with liquid nitrogen before analysis.
The content of water, ash, and NaCl, as well as the pH level and water activity (aw) in the sugar kelp samples, were analyzed on days 0 and 16 of the storage experiment. The water (100—dry matter (DM) (%)) and ash concentration were determined gravimetrically according to AOAC 938.08. aw was measured using a water activity meter (Aqua Lab model 4TE, Decagon devices Inc., Pullman, US). pH was measured by placing a PHC805 universal electrode probe (HQ411D Benchtop Meter, HACH Company, Loveland, United States) in the sample solution consisting of 5 g of minced sugar kelp mixed with 25 ml of distilled water and stirred for 1 h. NaCl concentration was quantified by automated potentiometric titration (785 DMP Titrino, Metrohm, Hesisau, Switzerland) of a sugar kelp-distilled water mix (1:5).
2.5 Respiration rate of sugar kelp
Five bags of sugar kelp for each treatment were packed in low gas permeability bags (see Section 2.1) and evaluated based on changes in the headspace gas composition to determine the respiration rate. The bags represented a closed system. CO2 and O2 concentrations were determined using a gas analyzer (Checkmate3, MOCON Dansensor∗, Ringsted, Denmark) twice daily. The respiration rates were calculated by Eq. 1, 2, and the respiration quotient (RQ) was the ratio of CO2 produced to O2 consumed (Fonseca et al., 2002).
The free volume was measured by submerging the entire bag at the end of the storage trial in water to determine the volume displacement in mL.
2.6 Culture-dependent microbial changes during storage
Triplicate bags were used on each sampling day to enumerate bacterial concentrations. Each bag’s sugar kelp was aseptically cut into smaller pieces using a sterile blade. A random sample of 15.0 g was mixed with 135.0 g of chilled physiological saline (0.85% NaCl) with 0.1% peptone (PSP) (NMKL, 2006). The mixture was homogenized for 60 s in a Stomacher 400 (Seward Medical, London, United Kingdom). Further 10-fold dilutions with PSP were performed as required. Aerobic viable counts (AVC) were determined by spread plating on Marine agar (MA, PanReac AppliChem GmbH, Darmstadt, Germany) and enumeration after incubation for 7 days at 15 C. The lower temperature and longer incubation time regime was chosen over standard incubation conditions to allow the detection of psychrotrophic and psychrophilic microorganisms (Broekaert et al., 2011). Presumptive Pseudomonas spp. was determined by spread plating on Pseudomonas agar (CM0559, Oxoid, Basingstoke, United Kingdom) with CFC selective supplement (SR0103, Oxoid, Basingstoke, United Kingdom) and incubation for 2 days at 25°C. H2S-producing Shewanella spp. was determined as black colonies by pour plating in Iron Agar Lyngby (CM0964, Oxoid, Basingstoke, United Kingdom) with L-cysteine hydrochloride and incubation for 3 days at 25 C (NMKL, 2006). Actinomycetes were enumerated by spread plating on Actinomycete Isolation Agar (17117, Sigma-Aldrich, Merch, Darmstadt, Germany) after incubation for 2 days at 37 C. Yeast was determined by spread plating on Oxytetracycline Glucose Yeast Extract agar (CM0545, Oxoid, Basingstoke, United Kingdom) with oxytetracycline supplement (SR0073A, Oxoid, Basingstoke, United Kingdom) and incubated for 3 days at 25 C.
The composition of the dominant culture-dependent microbiota was determined by isolation of 12–14 colonies from MA plates from each treatment on the day of spoilage (day 9) as determined by sensory evaluation. Selection, handling and identification of the bacteria were performed as described in Sørensen et al. (2020), except DNA from the isolates was extracted using a boiling method. Briefly, 1 mL from an overnight culture was centrifuged (5,000 × g) to harvest cells. The resulting pellet was resuspended in TE buffer (1×) and boiled for 10 min to lyse cells (Fachmann et al., 2017). This crude DNA extract was subsequently used in Sanger sequencing of the 16S rRNA gene as detailed in Sørensen et al. (2020).
2.7 Culture-independent microbial changes during storage
Culture-independent analysis of the microbiota of the fresh sugar kelp (day 1) and spoiled sugar kelp (day 13) were conducted using DNA extracts prepared from the stomacher bags using the protocol described in Sørensen et al. (2021). Briefly, the V3-V4 region of the 16S rRNA gene was targeted in an amplicon sequencing (Illumina, 2021). The resulting sequences were analyzed using the QIIME2 pipeline (Bolyen et al., 2019) with the SILVA 138.1 SSU Ref NR 99 database (Quast et al., 2013), following filtration and trimming of the reads with the amplicon region primers using RESCRIPt (Robeson et al., 2020). Reads were deposited at the NIH NCBI Sequence Read Archive with the accession number PRJNA788340.
2.8 Chemical changes during storage
Water-soluble carbohydrates and organic acids were determined by preparing 0.2 g of homogenized freeze-dried sugar kelp mixed with 12 ml of 5 mM sulphuric acid. The samples were mixed by vortexing, followed by removal of impurities by centrifugation at 5,000 g for 5 min and filtration of the supernatant through a 0.22 µm syringe filter (Labsolute, Th. Geyer GmbH & Co. KG, Germany). Construction of standard curves and the HPLC protocol were carried out as described in Sørensen et al. (2021).
To determine the free glutamic and aspartic acid levels, approximately 50 mg of freeze-dried sugar kelp was vortexed with 1 ml 5% trichloroacetic acid and kept at 5 C overnight. On the following day, the samples were centrifuged for 5 min at 5,000 × g. Derivatization and chromatography were performed as described by Bak et al. (2019).
Pigments (fucoxanthin, chlorophyll a and beta-carotene) were determined by HPLC on methanolic extracts. The procedure followed the protocol by Safafar et al. (2015), with three technical replicates on each sample. The extracts were run on an HPLC-DAD system (Agilent 1,100 Liquid Chromatograph) equipped with a Zorbax Eclipse C8 column 150 mm × 46 mm x 3.5 µm (Phenomenex Inc. CA, United States). The mobile phase consisted of 75% methanol and 25% 0.028 M tert-butyl acetoacetate at a flow rate of 0.9 ml min−1 and an acquisition time of 40 min. A standard pigment mix (DHI, Hørsholm, Denmark) was used to produce a standard curve. The detection of the pigments was at 440 nm.
Vitamin C was determined by adding aliquots of 1.4 g sugar kelp frozen in liquid nitrogen to 5 ml of 2% metaphosphoric acid with 20 mM Tris (2-carboxyethyl)-phosphine hydrochloride. The samples were shaken for 2 min (Multi Rex, Heidolph Instruments, Germany) and rested for 13 min. Five millilitres of Milli-Q∗ (Merck, NJ, United States) water were added and sample mixed by inverting five times followed by 10 min centrifugation at 3,000 g and 4 C. The supernatant was filtered on a 0.2 µm filter. Vitamin C was quantified by UPLC with a C18 Acquity BEH column (s100 mm × 2.1 mm x 1.7 µm, Waters, MA, United States) at 25 C and detected at 265 nm. The mobile phase consisted of a gradient comprised of two eluents. Eluent 1: A filtered buffer made of 600 mg dodecyl trimethylammonium chloride, 10 ml acetonitrile and 100 ml of 0.5 M acetate buffer (pH 5.4) filled with Milli-Q∗ water with a total volume of 1 L. Eluent 2: Acetonitrile:Milli-Q∗ in a ratio of 1:1. The injection intervals were 5 min with a flow rate of 0.35 ml min−1. The gradient consisted of the following steps: 0–2 min: 100% eluent 1; 2–3 min: 50% eluent 1 and 50% eluent 2; 3–5 min: 100% eluent 1. L-ascorbic acid in concentrations of 2, 4, 6, 8 and 10 μg ml−1 were used to construct a standard curve. An in-house reference (broccoli, Brassica oleracea var. italica) was included in each analytical run. The limit of detection was 1 mg 100 g−1 ww.
The iodine content was analyzed as described by Jerše et al. (2021) according to the CEN standard (EN 17050:2017).
2.9 Statistical analyses
The data software R (R-Core-Team, 2020) was used for data analyses and statistics. The following packages were used: “stats”, “GGally” (Schloerke et al., 2021), “dplyr” (Wickham et al., 2021), “car” (Fox and Weisberg, 2019), and “multcompView” (Graves et al., 2019). A two-way analysis of variance (ANOVA) was used with the two factors (storage time and treatment) to test for differences among treatments and storage time and potential interactions. A Levene’s test was used to test the homogeneity of variance. In case of significant differences within or among factors, a Tukey’s post hoc test was performed to find the significant differences between samples at the 5% level (p ≤ 0.05). The sensory descriptive profile analysis data were first analyzed by calculating Pearson’s correlation coefficients of the sensory attributes. The attributes were assumed fully correlating when the specific coefficient was >0.90. Then a principal component analysis (PCA) was performed on standardized data with 105 observations and 11 non-correlating attributes. Three principal components explaining 70% of the variance were chosen, as they had an eigenvalue above one as indicated by a Screen-plot. The PCA is illustrated by a bi-plot, including the PC scores and loadings. Beta diversity was calculated with Bray-Curtis dissimilarity distances (Sørensen, 1948). The alpha diversities were determined by species richness (DeSantis et al., 2006) and Shannon entropy (Shannon, 1948) and analyzed with ANOVA and Kruskal–Wallis pairwise analysis (Kruskal and Wallis, 1952), respectively. The linear regressions were calculated in GraphPad Prims 9.3.1 (GraphPad Software Inc., CA, United States).
3 Results
3.1 Changes in the organoleptic and physical properties
3.1.1 Determination of shelf-life based on sensory evaluation
Based on the descriptive profile analysis as well as the appearance of off-odors, the shelf-life of sugar kelp from all treatments was determined to seven to 9 days when stored at +2.8°C. On day nine, off-odors were noted in a minimum of two out of three bags from all treatments. The off-odors were described as vinegar, acetic acid, old flower water, fermented, rotten, old hay, chlorine, or sulfuric. A Pearson’s correlation analysis showed that some attributes correlated (ρ > 0.90) (data not shown), i.e., the terms Umami and Boiled Peas as well as Fresh Sea and Rubber correlated with each other. In the principal component analysis (PCA) of results from the sensory evaluation, the correlating attributes were regarded as redundant and only data for Boiled Peas and Fresh Sea were used for the PCA. The PCA bi-plot showed two notable patterns in the scores and loadings; a correlation between PC1 (explaining 38.8% of variation in the data) and storage time and PC3 (11.9%) and treatments (Figure 2). Following the PC1 of the PCA bi-plot, sugar kelp stored for 7 days or less was in the II and III quadrants (Figure 2), while spoiled sugar kelp (>7°days) was in the I and IV quadrants. The positive odor attributes, Fresh Sea, Sweet, Sourish, and Boiled Peas, correlated with the fresh sugar kelp (PC1 < 0). In contrast, the negative attributes, Transparency, Slimy and Beach-cast, correlated with spoiled sugar kelp (PC1 > 0). The panel did not identify the Beach-cast odor until day 13, and only for the samples blanched in sea water.
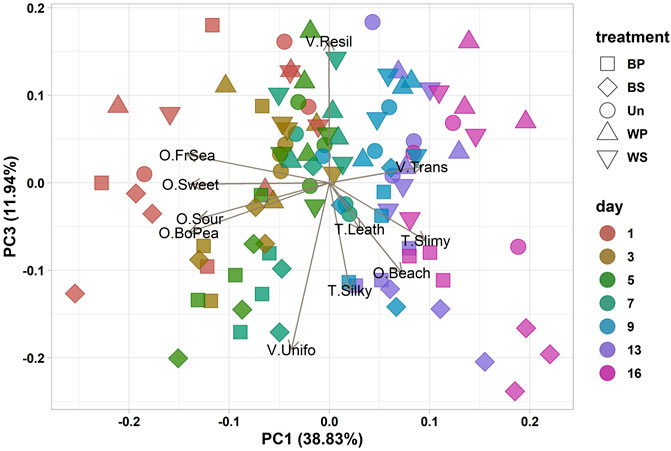
FIGURE 2. Principal Component Analysis bi-plot with PC scores for component 1 and 3 and loadings of the variables with the labels from the descriptive profile analysis (Table 1). Each data point represent the consensus judgement of the five sensory evaluators of each sample, the form of the data point represent the treatment (blanched in potable water (BP), blanched in sea water (BS), untreated (Un), washed in potable water (WP) and washed in sea water (WS)) and the color of the data point represents the storage period from day 1 to day 16.
3.1.2 Changes in color, pigments and texture
The color of the sugar kelp was analyzed both physically and chemically. The results of the physical measures in CIE L* a* b* color space are shown in Figure 3. Two groups appeared, where blanching gave a green hue with an average a* = −10.4. In contrast, washing did not affect the color, which remained at an average a* = 6.47. The blanched samples did not change color over time, while the variability of the color of spoiled washed sugar kelp (days 13 and 16) increased without forming a second cluster.
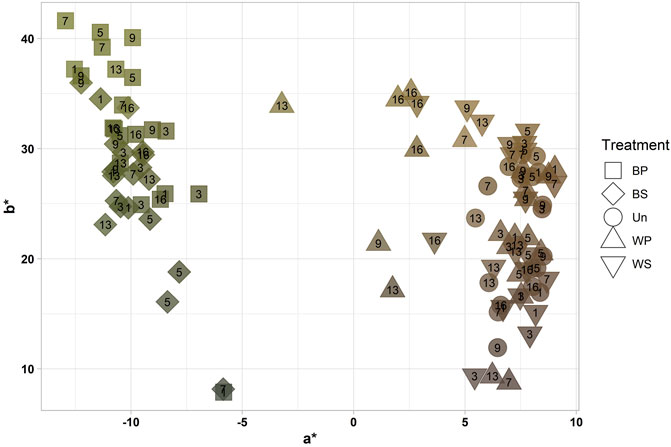
FIGURE 3. CIE L* a* b* color measurements showing the relationship between a* and b* of each sample measurement of untreated, washed and blanched sugar kelp during refrigerated storage (2.8°C) for 16 days. The treatments were blanched in potable water (BP), blanched in sea water (BS), untreated (Un), washed in potable water (WP) and washed in sea water (WS) with the storage days (1–16) indicated by the number within the data points. The color of the data points visualizes the actual CIE L* a* b* color. For a* < 0 the blanched samples dominate.
No significant differences (p > 0.05) were found for the content of chlorophyll a (807 ± 362 μg g−1) or β-carotene (23.7 ± 10.7 μg g−1), regardless of the treatment or length of storage (Table 2). There was no significant difference in concentration on day 1 compared to day 13 for any treatments for the pigment fucoxanthin. A significantly higher fucoxanthin content (p < 0.001, F = 8.95) was found in sugar kelp blanched in sea water (1,189–1,192 μg g−1) in comparison with sugar kelp from all other treatments and the untreated control (453–885 μg g−1).
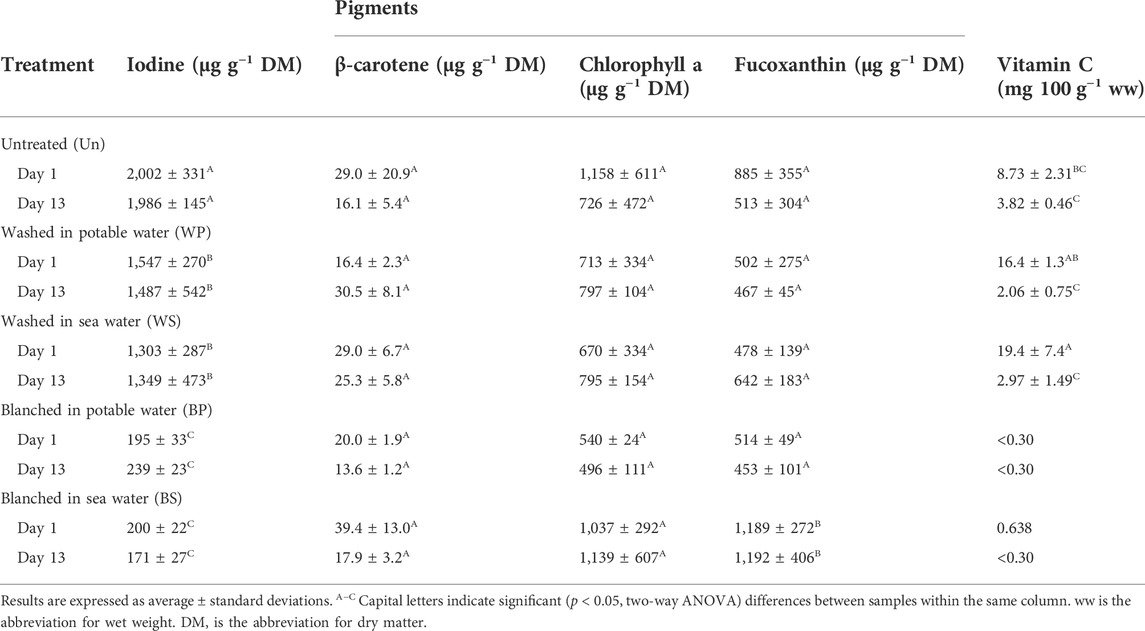
TABLE 2. Changes in vitamin C, pigments and iodine content of untreated, washed and blanched sugar kelp during refrigerated storage (2.8°C) for day 1 and 13.
The textural property, firmness (i.e., the sampling point at which the sugar kelp ruptured) was significantly higher (p < 0.001, F = 10.2) for the untreated and washed sugar kelp, followed by sugar kelp blanched in sea water and lastly the sugar kelp blanched in potable water (Table 3). The order of firmness for the different treatments agreed with observations for the textural attributes Leather and Silky in the PCA biplot from the sensory analysis (Figure 2). Storage time did not influence firmness; toughness was also unchanged among treatments and storage time (Table 3).
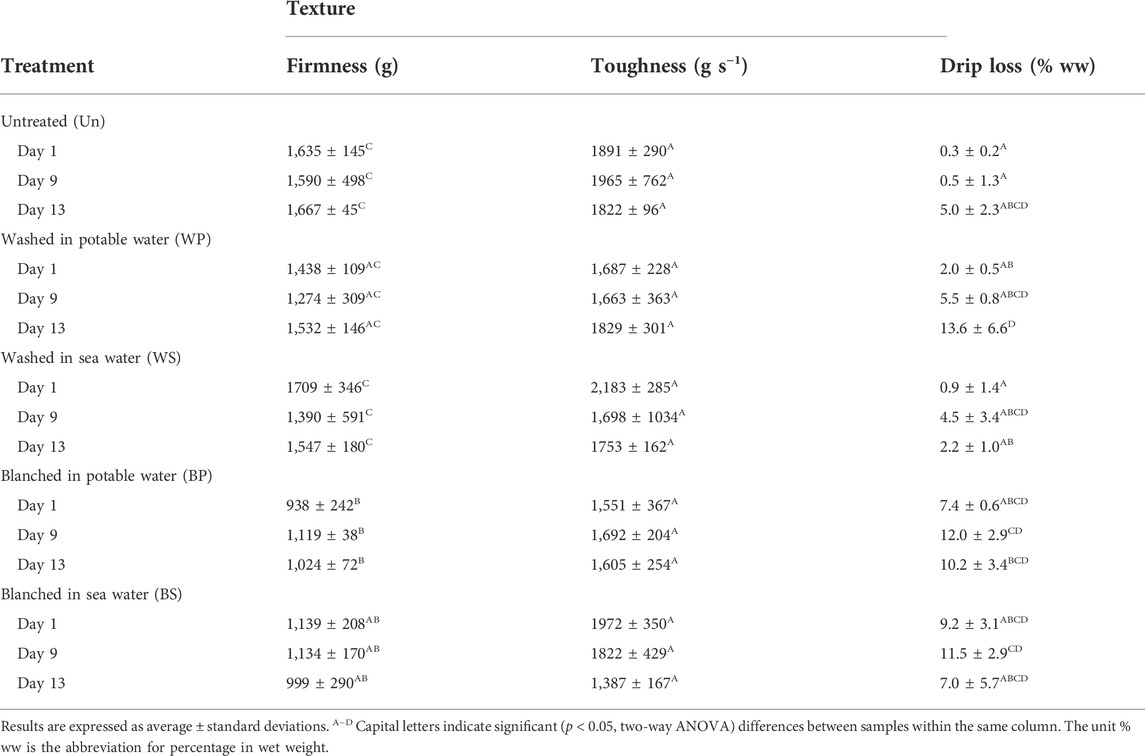
TABLE 3. Texture properties and drip loss of untreated, washed and blanched sugar kelp during refrigerated storage (2.8°C) for day 1, 9 and 13.
3.1.3 Changes in water, water activity, ash, drip loss, pH and NaCl
The treatments influenced the water activity, water and ash content of the sugar kelp, where blanching in potable water led to significantly higher (p < 0.05) contents of water, higher water activity and lower ash content. Washing of sugar kelp in potable water also resulted in reduction in ash content (Table 4). None of the parameters were affected by the storage period. In contrast, NaCl content depended significantly on both storage time (p = 0.003, F = 9.55) and treatment (p < 0.001, F = 280) with interactions observed among the independent factors (p < 0.001, F = 7.97) (Table 4). The lowest NaCl content was found in the sugar kelp blanched in potable water (0.09% ww), and the highest in the sugar kelp blanched in sea water (2.19% ww). Regarding the storage period, the untreated sugar kelp, and the sugar kelp blanched in sea water, showed significant increases in NaCl (p = 0.027 (Un), p = 0.033 (BS)) over time. Initial pH values differed significantly (p < 0.001, F = 368) between 6.2–6.3 and 7.6–8.7 for untreated/washed and blanched sugar kelp, respectively, and decreased significantly (p < 0.001, F = 207) over time for all treatments to final values of 5.6–5.9 and 6.8–7.7 for the unheated and heated samples, respectively (Table 4).
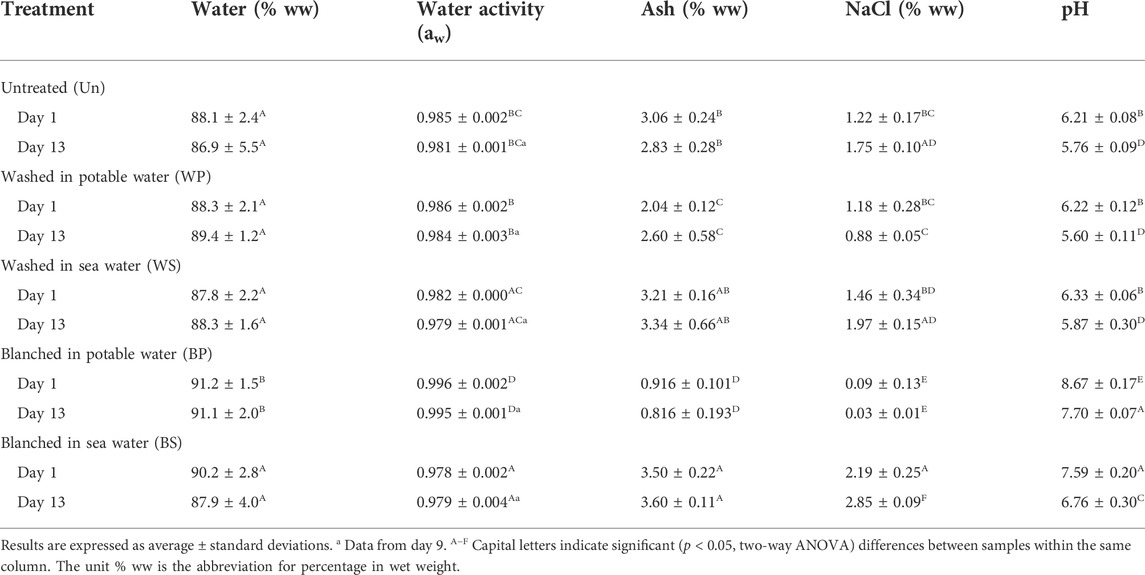
TABLE 4. Physicochemical properties and factors affecting microbial growth of untreated, washed and blanched sugar kelp during 2.8°C refrigerated storage at day 1, 9 and 13.
The observed drip losses of untreated or washed sugar kelp were minimal within the sensory shelf-life, ranging from 0.3 to 5.5% (Table 3). After spoilage, the sugar kelp washed in potable water reached a significantly (p < 0.05) higher drip loss of 13.6% relative to day 1. The blanching treatments resulted in a higher drip loss with an average of 9.6% during the storage period of 13 days.
3.1.4 Respiration rates and quotient
The untreated and washed sugar kelp respired during the early storage period (Figure 4A). The change in respiration rates initially followed a linear decrease during the first 5 days of storage (linear regression, p < 0.001, F value of 28.79–60.69). The sugar kelp ceased to respire (intercept at the x-axis) between days 4 and 5. In contrast, the blanched sugar kelp exhibited no significant (p > 0.05, F value of 0.03–0.04) respiration indicating that endogenous enzymes of the sugar kelp, and not the commensal microorganisms, were responsible for the respiration. During the initial 6 days of storage, the average respiration quotient (RQ) for untreated, washed in potable or sea water (n = 15) was 0.97 ± 0.33 SD for sugar kelp.
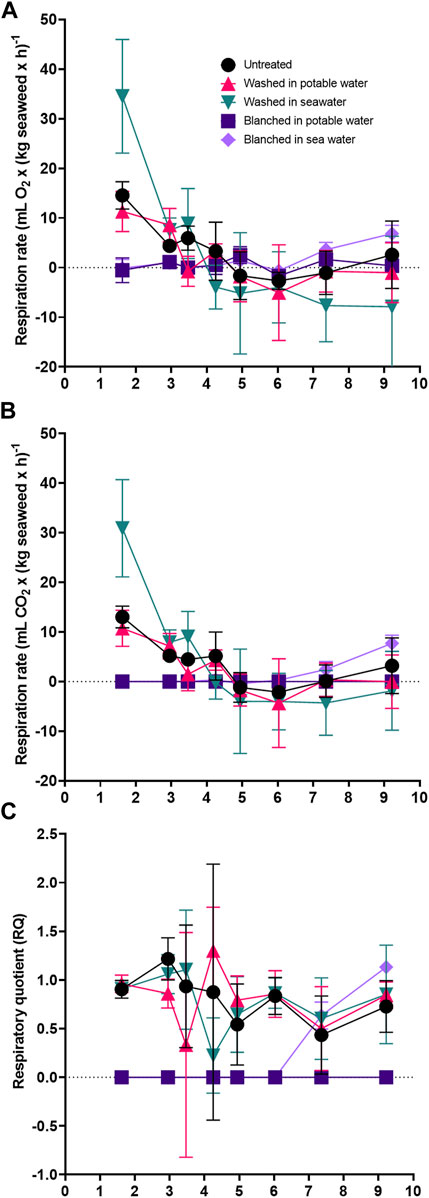
FIGURE 4. Respiration during refrigerated storage of untreated, washed and blanched sugar kelp during packaged refrigerated storage at 2.8°C for day 1–10. (A) Oxygen respiration rate. (B) Carbon dioxide respiration rate. (C) Respiratory quotient.
3.2 Microbial changes during storage
3.2.1 Culture-dependent
The untreated and washed sugar kelp had initial AVC counts between 4.0–4.5 log(CFU g−1), whereas blanching lowered AVC counts to 0.9–1.8 log(CFU g−1) (Figure 5A). Microbial communities grew to AVC counts of 7.2–7.9 log(CFU g−1) after 7 days in all samples, apart from in samples of sugar kelp blanched in potable water, which contained lower levels of 3.3–5.7 log(CFU g−1) (Figure 5A). Based on the selective media used in the study, presumptive Pseudomonas spp. dominated the microbiota in sugar kelp blanched in potable water throughout the entire storage period (Figure 5B). As for the four other treatments, presumptive Pseudomonas spp. increased to levels of 5–6.3 log(CFU g−1) after 7 days, thus remaining at 1.6–2.3 log below AVC counts. H2S-producing bacteria, Actinomycetes and yeast showed no or limited growth during the storage period with initial levels of 0–2.5 log(CFU g−1) and maximum levels of 5.2 log(CFU g−1) (data not shown).
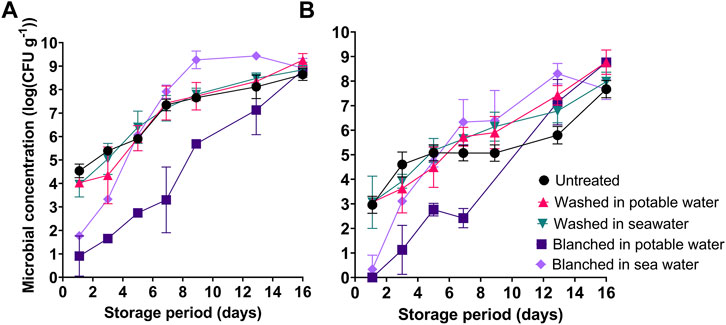
FIGURE 5. Microbial load in untreated, washed and blanched sugar kelp during refrigerated storage at 2.8°C. (A) Aerobic viable counts (AVC) on Marine agar; (B) Pseudomonas spp. counts on CFC agar.
3.2.2 Culture in-dependent
Amplicon sequences of DNA extracted from all 30 fresh and spoiled macroalgal samples passed the quality control and were subjected to further bioinformatic analysis. Based on the rarefaction curves, the minimum sampling depth was set to 7,000 reads per sample, with a maximum sampling depth of 327,435 reads. All rarefaction curves levelled off at the minimum sampling depth (data not shown). A PCA plot of the beta-diversity, determined by the Bray-Curtis dissimilarity, shows how the phylogenetic beta-diversity of bacterial communities changed from being highly similar in fresh (day 1) samples (0.30–0.44) to being different among treatments on day 13 with separate clusters formed by WP, BP and one common cluster for BS, Un and WS (Figure 6A). The Bray-Curtis dissimilarity matrix (Figure 6B) showed the microbiota changed during storage, resulting in high dissimilarity (0.75–0.99) between the fresh and spoiled (day 13) samples. In addition, the spoilage microbiota depended on the type of treatment, except for the similarity (0.30) of the microbiota found on spoiled untreated sugar kelp and sugar kelp washed in sea water (Figure 6B). The spoilage microbiota on sugar kelp blanched in sea water was also similar (0.60–0.69) to the untreated and sugar kelp washed in sea water.
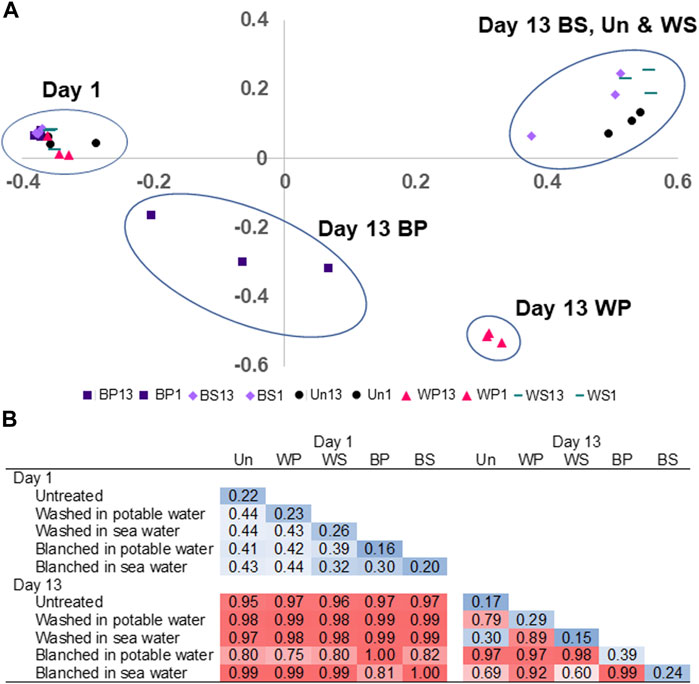
FIGURE 6. (A) Shows the Bray–Curtis Principal Component Analysis of fresh and spoiled microbiota, circles have no statistical properties. (B) The Bray-Curtis dissimilarity matrix of bacterial communities found in fresh and spoiled untreated (Un), washed in potable water (WP), washed in sea water (WS), blanched in potable water (WP), or blanched in sea water (WS) sugar kelp. Blue color indicate low dissimilarity and red color indicate high dissimilarity.
ASVs in fresh sugar kelp samples belonged to a diverse mixture of bacterial classes, including Gammaproteobacteria, Alphaproteobacteria, Bacteroidia and Planctomycetes. In contrast, families in Gammaproteobacteria came to dominate the spoiled macroalgae, with notable differences among the treatments, e.g., Pseudomonadaceae dominated sugar kelp blanched in potable water as opposed to Pseudoalteromonadaceae in sugar kelp blanched in sea water (Figure 6B). Untreated and washed spoiled sugar kelp contained a large proportion of Psychromonadaceae, while the presence of other families depended on the treatment. Calculation of the Bray-Curtis dissimilarity to compare the culture-independent and -dependent identification methods (number of families determined by amplicon sequencing and isolates of colonies) resulted in dissimilarity of 0.35, indicating that the spoilage microbiota results were comparable. Common for all treatments was a reduction of the observed ASVs from levels of 93–210 in fresh sugar kelp to 27–91 in spoiled sugar kelp (Table 5). Blanching in sea water resulted in the lowest ASVs levels. The Shannon entropy decreased in the spoiled samples (2.6–3.5) compared to the fresh samples (4.6–5.4).
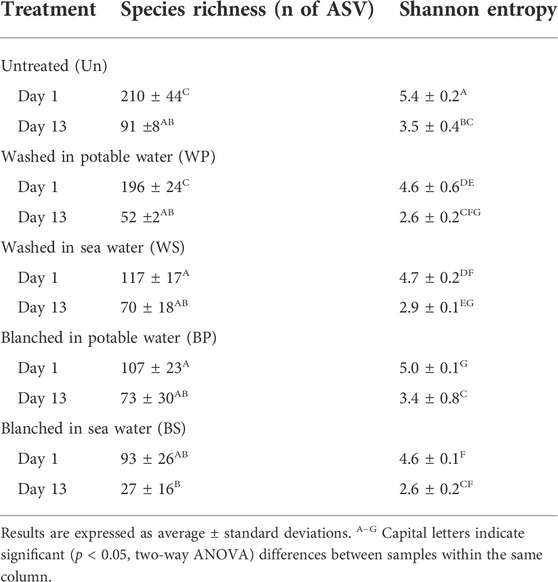
TABLE 5. Bacterial species richness as measured by the number of amplicon sequence variants (ASVs) and Shannon entropy in samples of untreated, washed and blanched samples of sugar kelp stored at 2.8°C for day 1 and 13.
3.3 Chemical changes during storage
The carbohydrate fucoidan comprised between 28 and 43% of the DM content in the untreated or washed sugar kelp (Table 6). This content remained unchanged during the storage time. However, blanching in potable water significantly diminished (p < 0.001, F = 51.3), the fucoidan concentration to levels of 4.77–11.0% DM. Interestingly, blanching in sea water increased the content to 46.5–54.3% DM. The simple sugars, glucose and maltose, were detected in some of the untreated or washed samples, but not in any of the blanched samples (data not shown). The content of the sugar alcohol mannitol was unaffected by storage time but significantly reduced (p < 0.001, F = 79.3) in blanched sugar kelp from both treatments.
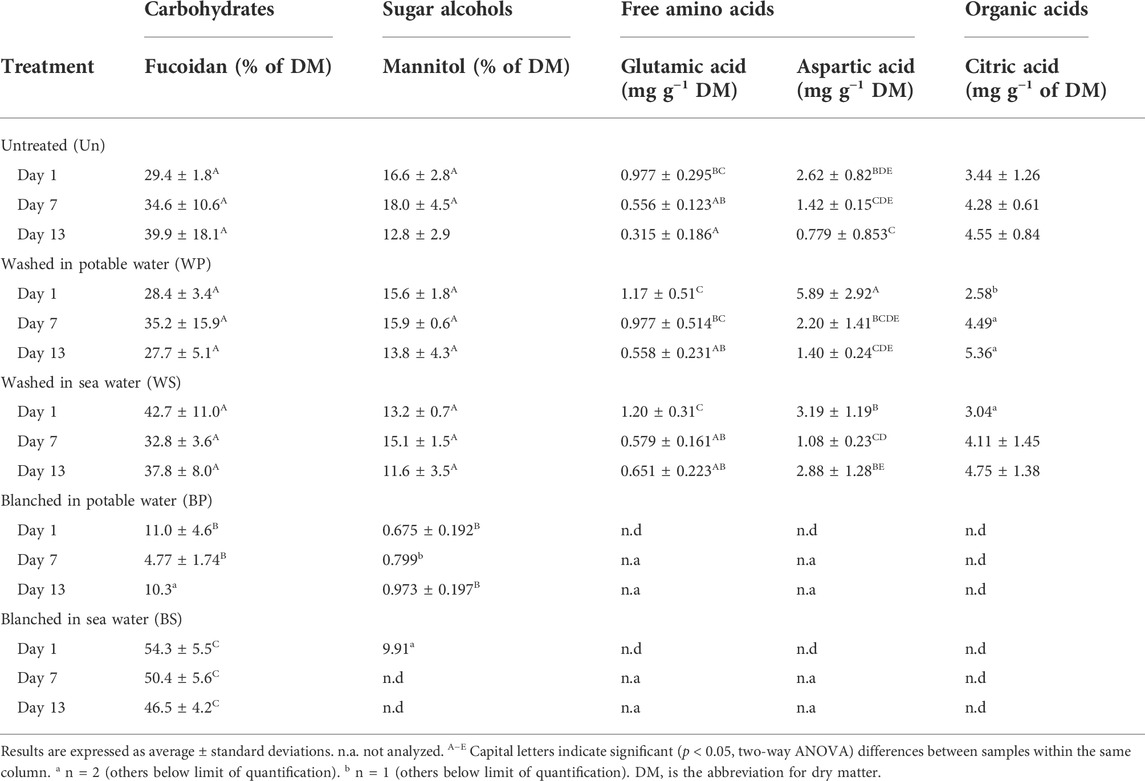
TABLE 6. Content of water soluble carbohydrates, mannitol, free amino acids and citric acid in untreated, washed and blanched sugar kelp during refrigerated storage for day 1, 7 and 13.
Free glutamic and aspartic acids were detected in the untreated or washed sugar kelp but not in blanched sugar kelp (Table 6). Initial levels of the amino acids underwent a significant decrease (p < 0.001, F > 25.8) during the storage period. Citric acid was the only organic acid, aside from Vitamin C, detected. Similarly to the two amino acids, it was only detected in the untreated samples and some of the washed samples, while being below the detection limit in all blanched samples. Levels of citric acid remained constant during storage. Both blanching treatments degraded vitamin C to a level that was below the detection limit (Table 2). In contrast, vitamin C occurred in levels of 8.7 mg 100 g−1 ww for untreated and 16–19 mg 100 g−1 ww for washed sugar kelp, respectively. The content of vitamin C decreased significantly (p < 0.001, F = 59.4) over the storage time for non-blanched sugar kelp. Iodine showed no changes during storage, and the total iodine for untreated sugar kelp was 2,002 μg g−1 DM on day 1, which was significantly higher (p < 0.001, F = 66.9) than levels found in washed (1,303–1,547 μg g−1 DM) or blanched (195–200 μg g−1 DM) sugar kelp (Table 2).
4 Discussion
To the best of our knowledge, the present study represents the to-date most comprehensive investigation of the shelf-life of sugar kelp during refrigerated storage. A shelf-life was established to be 7–9 days for fresh washed or lightly heat-treated sugar kelp stored at 2.8 ± 0.4°C. The short shelf-life is in agreement with previous shelf-life studies of other brown, green, and red macroalgae during refrigerated storage at 2 to 7°C. This indicates that macroalgae are highly perishable food products with sensory shelf-lives between 3–14°days depending on species and washing treatment (Nayyar, 2016; Nayyar and Skonberg, 2019). To compare shelf-lives from different studies and at different storage temperatures, all shelf-lives were transformed using the relative rate of spoilage square-root model (RRS) (Dalgaard, 2002). Nayyar (2016) reported the shelf-life for sugar kelp to be 12°days when stored at 1.1°C. Our predicted shelf-life for sugar kelp at the same temperature would be 9–12°days. A study of thawed and chilled (refreshed) Undaria pinnatifida (wakame) stored at 10°C had a shelf-life of 2–3°days based on the overall acceptability score (Choi et al., 2012). Using the RRS, our sugar kelp was predicted to have a shelf-life of 3.7°days if stored at 10°C. Interestingly, Nayyar (2016) studied another brown algal and found a significantly faster deterioration for winged kelp (Alaria esculenta). In addition to species variation, a seasonal variation was observed with a faster deterioration during the winter compared to the summer season (Nayyar, 2016). The difference between species and season highlights the variations and the need for further studies of the shelf-life of different macroalgae, seasons and cultivated or wild collected kelp. Two studies disagreed with the general acceptance of kelp as a highly perishable food product (Perry et al., 2019; López-Pérez et al., 2020). Lightly salted (aw of 0.96, 30–50 g salt kg−1) winged kelp stored at 5°C was found to have a 6-week shelf-life based on consumer acceptance (Perry et al., 2019). However, the development or changes of sensory properties during the storage period were not described. López-Pérez et al. (2020) found the sensory shelf-life of the raw untreated brown macroalga Laminaria ochroleuca to be under 60°days at a storage temperature of 5°C. However, the sensory properties of the sugar kelp were not tested between day one and day 60, during which the microbial concentration increased from initial levels of 5 log(CFU g−1) to 8 log(CFU g−1) within the first 40°days of storage.
The respiration of plants and macroalgae acts as a metabolic process to maintain cell viability and could be used as a freshness indicator. The non-blanched sugar kelp showed active respiration in the initial storage phase (Figure 4A). The respiration rate of sugar kelp in the present study dropped in washed and untreated treatments to zero within 5 days of storage, while the blanching inhibited the respiration immediately after treatment, and it remained zero for the first 6 days of storage (Figures 4A,B). From day 7 of storage, we observed increased respiration for blanched sugar kelp in sea water. The increased respiration seems to be correlated with increased AVC levels. Interestingly, the lack of respiration in sugar kelp blanched in potable water and low levels of AVC indicate modest microbiological activity throughout the storage period.
The average respiration quotient (RQ) was 0.97 during the initial 6 days of storage for untreated, and sugar kelp washed in potable or washed in sea water. If the metabolic substrates were carbohydrates, then the RQ would be assumed to be equal to 1.0. The RQ would be lower in lipid-driven metabolic pathways and higher when consuming amino acids (Fonseca et al., 2002). An RQ of 0.97 in sugar kelp indicates that carbohydrates are the primary energy source. The value was within the range of previously reported RQ values for algae. Literature RQ values were between 0.6 and 1.2, with no differences among species for three macroalgae: Ulva sp. (Chlorophyta), Pterocladia capillacea Bornet (Rhodophyta) and Sargassum sp. (Ochrophyta) (Carvalho and Eyre, 2011). Similar RQ values have also been observed in harvested fruit and vegetables, with a reported range of 0.7–1.3 (Kader, 1987).
The decrease in the beta- and alpha-diversity between fresh and spoiled sugar kelp (Tables 5 and Figures 6, 7) are similar to those observed in seafood products (Chaillou et al., 2015; Kuuliala et al., 2018; Sørensen et al., 2020). Bacterial isolates from the spoiled sugar kelp belonged predominantly to Pseudoalteromonadaceae, Psychromonadaceae and Pseudomonadaceae (Figure 6) and agreed with the 16S rRNA amplicon sequence data. Sørensen et al. (2020) showed the same agreement between 16S rRNA amplicon sequencing and identification of bacterial isolates in Atlantic cod. Psychromonadaceae, Marinomonadaceae and Pseudoalteromonadaceae dominated the microbiota of spoiled untreated sugar kelp. The first two families also came to dominate in an unsuccessful natural fermentation of sugar kelp from Greenland (Sørensen et al., 2021), indicating a potential role of these bacteria in spoilage of macroalgae. In a study of the bacterial communities on six different macroalgae, the same families were also identified in fresh and stored macroalgae, however, they were not dominating the microbiota (Picon et al., 2021). The application of the RSS model to the shelf-life studies of S. latissima (Nayyar, 2016; our study) and U. pinnatifida (Choi et al., 2012) indicates that the shelf-life may be limited by spoilage caused by the growth of psychrotrophic (Tmin = −9°C) microorganisms (Ratkowsky et al., 1982). The composition of the sequenced microbiota in the spoiled sugar kelp included members of Pseudoalteromonadaceae, Psychromonadaceae and Pseudomonadaceae, all of which are predominantly psychrotrophic bacteria. Future research should determine the spoilage potential for the isolated microorganisms (Figure 6), and thereby elucidate which of the bacteria are responsible for the spoilage characteristics described in the sensory analysis (Figure 2).
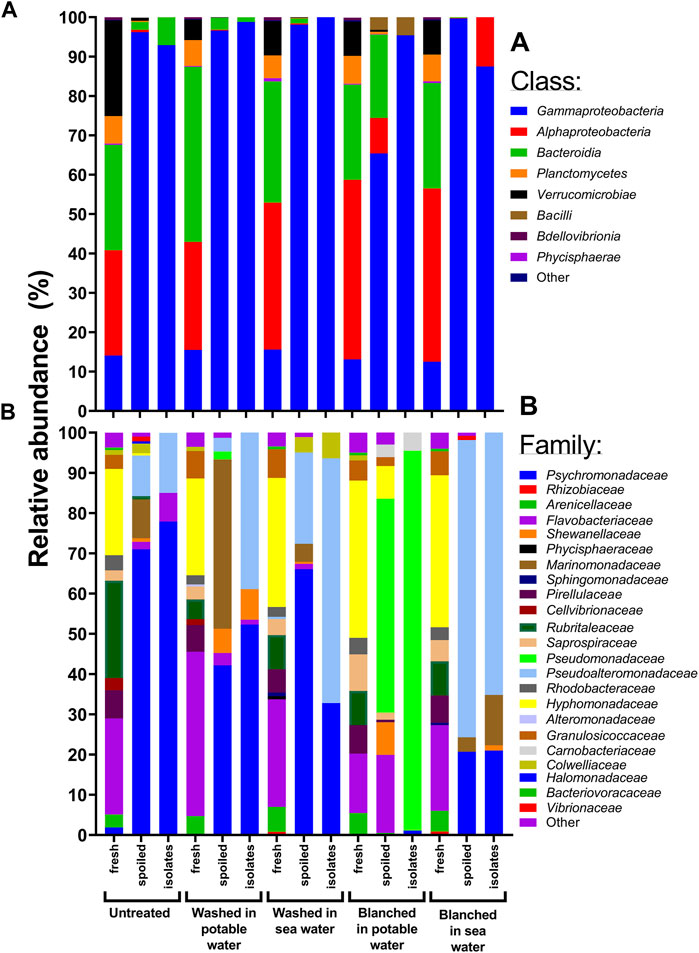
FIGURE 7. Composition of bacterial communities in untreated, washed and blanched sugar kelp as determined after 1 (fresh) and 13 days of storage (spoiled) at 2.8°C. Fresh and spoiled relative abundance are based on amplicon sequencing variants, while isolate abundance values are based on identified representative isolates from day 9. (A) Shows the composition of bacterial taxonomic classes. (B) Is more detailed with the composition of bacterial taxonomic families.
The search to identify single-compound quality indices (SCQI) uncovered that the following parameters were time-dependent (Table 7) and, therefore, potential SCQIs: pH, drip loss, NaCl, free glutamic- and aspartic acid, vitamin C and microbial load. Diving into the potential parameters of pH, NaCl, free glutamic- and aspartic acid, and vitamin C, it was observed that although the parameters were storage dependent (Table 7), no common level could be established to determine the shelf-life. To exemplify, the pH dropped by 0.45–0.97 units during the 13 days of storage (Table 4), but the initial starting points (after 1 day of storage) were not identical, and the difference in the range of pH values, from 6.21 to 8.67, was larger than the drop. The drawback of having an SCQI depending on changes instead of a set level is the need to establish different SCQIs for each treatment process. A microbial SCQI has been proposed for both protein-based seafood and terrestrial vegetables, with spoilage occurring when the bacterial concentration exceeds 7 to 7.7 log(CFU g−1) (Corbo et al., 2006; ICMSF, 2011). Using 7 log(CFU g−1) as an SCQI, the microbial shelf-life would be 7 days for all treatments, except for sugar kelp blanched in potable water (Figure 5A). In the case of sugar kelp blanched in potable water, the microbial shelf-life would be 13 days, which would be a significant overestimation compared to the sensory shelf-life. However, it is possible that the use of MA, with its high salt and mineral content, to quantify bacteria may have led to an underestimation of the number of microorganisms in samples of sugar kelp with almost no NaCl present (0.1%) after blanching in potable water. Based on the evaluation of the parameters in Table 7, a threshold of shelf-life SCQI of 7 log(CFU g−1) determined on MA (15°C, 7 d) is suggested.
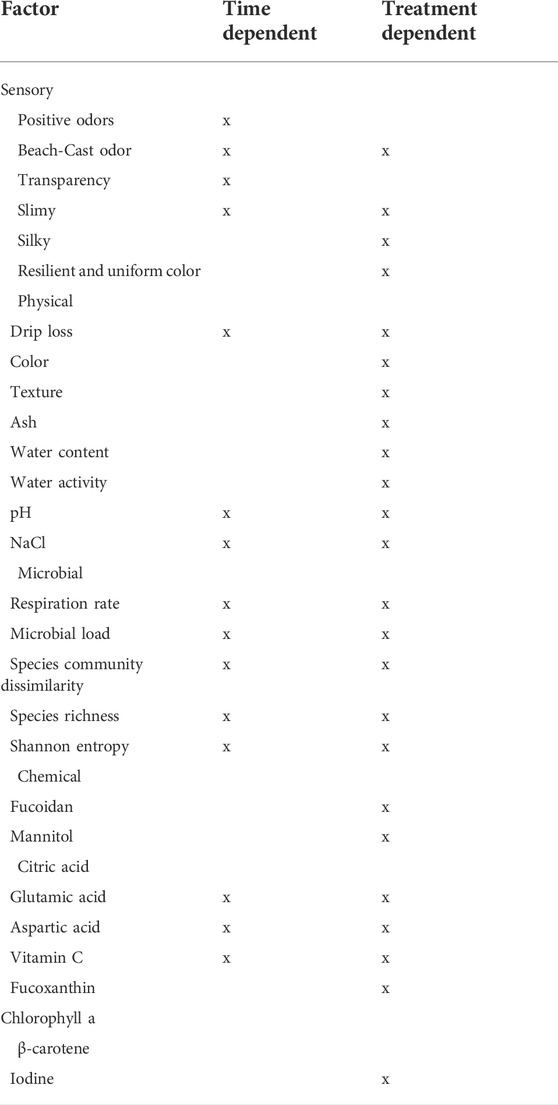
TABLE 7. Summary of parameter dependency on storage time or post-harvest treatment. “x” marks whether the factor was dependent on storage time and/or varied due to treatment (untreated, washed or blanched in potable or sea water).
Previous studies of the microbial quality, i.e., the AVC, of macroalgae have mainly used agar substrates without high salt or mineral concentrations, such as Plate Count Agar (PCA), 3M Petrifilm AVC and tryptic soy agar (TSA) (Choi et al., 2012; Nayyar and Skonberg, 2019; Perry et al., 2019). PCA has, however, been reported to underestimate marine-associated bacterial concentration compared to MA by approximately 2 log(CFU g−1) (Broekaert et al., 2011; del Olmo et al., 2020). Besides the use of non-optimal agar substrates, the choice of incubation temperature may also lead to the use of temperatures close to Tmax for psychrotrophic bacteria or above, e.g., 25–37°C (Liot et al., 1993; Choi et al., 2012; Nayyar and Skonberg, 2019; Perry et al., 2019; del Olmo et al., 2020; López-Pérez et al., 2020). In future studies, it is recommended that the AVC be determined on MA incubated for 7 days at 15°C during storage trials with refrigerated macroalgae unless the salt content has been reduced by treatments such as blanching in potable water. It is known that the microbiota is highly dependent on the incubation temperature (Dalgaard and Jørgensen, 2000).
The choice of treatment affects the final product. Interestingly, the sensory analysis showed a decrease in the odor attributes “sweetness” and “umami”, while the chemical indicators aspartic and glutamic acid also experienced a reduction during storage. The concentration of the sugar alcohol mannitol decreased by 11–23% in untreated or washed sugar kelp during the storage trial. Mannitol is used as an industrial sweetener and is estimated to be half as sweet as sucrose (Schiweck et al., 2012), which might explain the decrease in the sensory score. Umami flavor is only associated with two amino acids in humans: aspartic and glutamic acid (Chandrashekar et al., 2006). Both amino acids were significantly reduced during storage (Table 6). Blanching removed both free amino acids and almost all the water-soluble mannitol (Table 6). Previously, it has been shown that blanching decreases the content of amino acids in sugar kelp and the calculated carbohydrates (Nielsen et al., 2020). Our finding showed that blanching totally removed the free amino acids and not necessarily the ones incorporated in protein. The bioactive water-soluble fucoidan concentration tended to be related to the level of NaCl in the process water and the sugar kelp (Table 6). The correlation between NaCl and fucoidan levels might be due to the affinity of fucoidan for NaCl. During extraction of fucoidan, it has been shown that the molarity of NaCl strongly affects the eluted fucoidan, where the higher the NaCl concentration in the washing or blanching water, the less fucoidan is eluted from the sugar kelp (Zayed et al., 2016). The fucoidan affinity for NaCl could explain the finding of 54.3% DM fucoidan in the sugar kelp blanched in sea water compared to 11.0% in the sugar kelp blanched in potable water.
The initial levels of vitamin C in untreated or washed sugar kelp ranged from 8.7 to 19.4 mg 100 g−1. To compare our finding with concentrations found in the literature, the unit was recalculated to mg g−1 DM, giving a range of 0.73–1.59 mg g−1 DM. The concentrations were higher in our study compared to reports of washed or dried sugar kelp (Sappati et al., 2019) but within a similar range to other macroalgae (Nielsen et al., 2021). During storage, the vitamin C concentration decreased significantly (Table 2), likely due to oxidation to protect degradation of other constituents (Spínola et al., 2014). No other studies of vitamin C during storage have been conducted with sugar kelp or other macroalgae. However, the same decreasing trend has been described in storage experiments with broccoli, green beans, peas, and spinach (Balan et al., 2016). Vitamin C has been proposed as an SCQI in fresh vegetables and freshness indicator of frozen products (Favell, 1998). However, vitamin C is very sensitive to heat, light and oxygen. Thus, blanching of sugar kelp resulted in completely removal of vitamin C. The same result was observed in boiled (for 15–20 min) macroalgae U. pinnatifida and H. elongata, which decreased the vitamin C content below detection limit (Amorim et al., 2012; Amorim-Carrilho et al., 2014; Nielsen et al., 2021). In addition to sensitivity to processing, vitamin C fluctuates between seasonality, location, and storage (Nielsen et al., 2021).
Washing in potable water increased the drip loss within the shelf-life to 5.5% (Table 3), which was similar to drip losses found in U. rigida (Sánchez-García et al., 2021), Palmaria palmata and Gracilaria tikvahiae (Nayyar and Skonberg, 2019). Higher drip losses were observed in blanched sugar kelp, which could be due to the short drip-drying treatment before packaging or blanching-induced changes to the sugar kelp tissue. More research would be required to understand and quantify sugar kelp’s drip-loss level to ensure the best quality and correct labelling of the product. The treatment and packaging atmosphere might be the primary factors to investigate for future research.
The findings and results presented in this article aim to assist food manufacturers and authorities in the establishment of a best practice for chilled storage of sugar kelp. All tested treatments resulted in a shelf-life of 7–9 days at 2.8 ± 0.4°C. The microbiota associated with the sugar kelp became dominated by Gram-negative spoilage bacteria at the end of shelf-life. Among the possible SCQIs investigated in this study, the recommended SCQI would be a threshold AVC of seven log (CFU g−1) determined on MA (15°C, 7 days). Future research is needed to establish a chemical SCQI, preferably a compound whose development correlates to the activity of spoilage organisms and hence development of sensory spoilage characteristics. Additional post-harvest washing of the kelp does not prolong the shelf-life and the type of wash water has no effect on the quality of the chilled kelp. The use of blanching reduced the iodine content to more tolerable levels. Moreover, blanching in potable water lowered the NaCl content to undetectable levels. For kelp industries wanted a low iodine and sodium product, the best practice would be a 2 min blanching in potable water at 80 C followed by quick cooling. The negative effect of blanching is the reduction of vitamin C content to below the detection limit, which indicates that other valuable compounds might decrease due to blanching as well including the “umami amino acids”, aspartic and glutamic.
Data availability statement
The datasets presented in this study can be found in online repositories. The names of the repository/repositories and accession number(s) can be found below: https://www.ncbi.nlm.nih.gov/bioproject/PRJNA788340.
Author contributions
CW: Conceptualization, Methodology, Investigation, Formal analysis, Writing—original draft, Writing—review and editing, Funding acquisition. JS: Conceptualization, Methodology, Investigation, Formal analysis, Writing—original draft, Writing—review and editing. KK: Conceptualization, Investigation, Funding acquisition, Writing—Review and Editing. GH: Supervision, Methodology, Writing—review and editing. SH: Funding acquisition, Supervision, Writing—Review and Editing. LH: Funding acquisition, Supervision, Writing—Review and Editing.
Funding
The study has received financial support from a collaboration of three research projects, the Joint Alliance PhD program, Technical University of Denmark and Norwegian University of Science and Technology, the Northern Periphery and Arctic Program, European Union (Project 366, SW-GROW) and Greenland Research Council.
Acknowledgments
We thank Dansk Tang Aps for the help collecting and providing fresh raw sugar kelp for the research. We thank PhD candidates Hanne Aarslev Jensen, Sanne Kjærulf Madsen, Laboratory Technicians Heidi Jahn, Inge Holmberg, Rie Sørensen, Yuka Omura Lund, Peter Kristian Kristoffersen, Senior Researcher Jette Jakobsen and Professor Jens Jørgen Sloth all from the National Food Institute, for your assistance and contributions to our research.
Conflict of interest
The authors declare that the research was conducted in the absence of any commercial or financial relationships that could be construed as a potential conflict of interest.
Publisher’s note
All claims expressed in this article are solely those of the authors and do not necessarily represent those of their affiliated organizations, or those of the publisher, the editors and the reviewers. Any product that may be evaluated in this article, or claim that may be made by its manufacturer, is not guaranteed or endorsed by the publisher.
References
Akomea-Frempong, S., Perry, J. J., and Skonberg, D. I. (2021a). Effects of pre-freezing blanching procedures on the physicochemical properties and microbial quality of frozen sugar kelp. J. Appl. Phycol. 34, 609–624. doi:10.1007/s10811-021-02610-0
Akomea-Frempong, S., Skonberg, D. I., Camire, M. E., and Perry, J. J. (2021b). Impact of blanching, freezing, and fermentation on physicochemical, microbial, and sensory quality of sugar kelp (Saccharina latissima). Foods 10, 2258. doi:10.3390/foods10102258
Amorim, K., Lage-Yusty, M. A., and López-Hernández, J. (2012). Short communication: Changes in bioactive compounds content and antioxidant activity of seaweed after cooking processing. CYTA - J. Food 10, 321–324. doi:10.1080/19476337.2012.658871
Amorim-Carrilho, K., Lage-Yusty, M. A., and López-Hernández, J. (2014). Variation of bioactive compounds in dried seaweed Himanthalia elongata subjected to different culinary processes. CyTA - J. Food 12, 336–339. doi:10.1080/19476337.2013.877082
ANSES (2018). Opinion of the French agency for food, environmental and occupational health and safety: On the risk of excess iodine intake from the consumption of seaweed in foodstuffs. Buenos Aires, Argentina: ANSES.
Bak, U. G., Nielsen, C. W., Marinho, G. S., Gregersen, Ó., Jónsdóttir, R., and Holdt, S. L. (2019). The seasonal variation in nitrogen, amino acid, protein and nitrogen-to-protein conversion factors of commercially cultivated Faroese Saccharina latissima. Algal Res. 42, 101576. doi:10.1016/j.algal.2019.101576
Balan, D., Israel-Roming, F., Luta, G., and Gherghina, E. (2016). Changes in the nutrients content of some green vegetables during storage and thermal processing. Rom. Biotechnol. Lett. 21, 11857–11865.
Bixler, H. J., and Porse, H. (2011). A decade of change in the seaweed hydrocolloids industry. J. Appl. Phycol. 23, 321–335. doi:10.1007/s10811-010-9529-3
Bolyen, E., Rideout, J. R., Dillon, M. R., et al. (2019). Reproducible, interactive, scalable and extensible microbiome data science using QIIME 2. Nat. Biotechnol. 37, 852–857. doi:10.1038/s41587-019-0209-9
Broekaert, K., Heyndrickx, M., Herman, L., Devlieghere, F., and Vlaemynck, G. (2011). Seafood quality analysis: Molecular identification of dominant microbiota after ice storage on several general growth media. Food Microbiol. 28, 1162–1169. doi:10.1016/j.fm.2011.03.009
Bruhn, A., Brynning, G., Johansen, A., Lindegaard, M. S., Sveigaard, H. H., Aarup, B., et al. (2019). Fermentation of sugar kelp (Saccharina latissima)—Effects on sensory properties, and content of minerals and metals. J. Appl. Phycol. 31, 3175–3187. doi:10.1007/s10811-019-01827-4
Cai, J., Lovatelli, A., Aguiar-Manjarrez, J., Cornish, L., Dabbadie, L., Desrochers, A., et al. (2021). Seaweeds and microalgae: An overview for unlocking their potential in global aquaculture development. Rome, Italy: Food and Agriculture Organization of the United Nations. doi:10.4060/cb5670en
Carvalho, M. C., and Eyre, B. D. (2011). Carbon stable isotope discrimination during respiration in three seaweed species. Mar. Ecol. Prog. Ser. 437, 41–49. doi:10.3354/meps09300
Chaillou, S., Chaulot-Talmon, A., Caekebeke, H., Cardinal, M., Christieans, S., Denis, C., et al. (2015). Origin and ecological selection of core and food-specific bacterial communities associated with meat and seafood spoilage. ISME J. 9, 1105–1118. doi:10.1038/ismej.2014.202
Chandrashekar, J., Hoon, M. A., Ryba, N. J. P., and Zuker, C. S. (2006). The receptors and cells for mammalian taste. Nature 444, 288–294. doi:10.1038/nature05401
Choi, J. S., Lee, B. B., An, S. J., Sohn, J. H., Cho, K. K., and Choi, I. S. (2012). Simple freezing and thawing protocol for long-term storage of harvested fresh Undaria pinnatifida. Fish. Sci. 78, 1117–1123. doi:10.1007/s12562-012-0529-x
Corbo, M. R., Del Nobile, M. A., and Sinigaglia, M. (2006). A novel approach for calculating shelf life of minimally processed vegetables. Int. J. Food Microbiol. 106, 69–73. doi:10.1016/j.ijfoodmicro.2005.05.012
Dagostin, J. L. A. (2016). “Use of blanching to reduce antinutrients, pesticides, and microorganisms,” in New perspectives on food blanching. Editor F. Richter Reis (Jacarezinho: Springer Nature), 1–154. doi:10.1007/978-3-319-48665-9
Dalgaard, P., and Jørgensen, L. V. (2000). Cooked and brined shrimps packed in a modified atmosphere have a shelf-life of >7 months at 0 °C , but spoil in 4-6 days at 25°C. Int. J. Food Sci. Technol. 35, 431–442. doi:10.1046/j.1365-2621.2000.00402.x
Dalgaard, P. (2002). “Modelling and predicting the shelf-life of seafood,” in Safety and quality issues in fish processing. Editor H. A. Bremmer (Cambridge: Woodhead), 191–219.
del Olmo, A., Picon, A., and Nuñez, M. (2020). Preservation of five edible seaweeds by high pressure processing: Effect on microbiota, shelf life, colour, texture and antioxidant capacity. Algal Res. 49, 101938. doi:10.1016/j.algal.2020.101938
DeSantis, T. Z., Hugenholtz, P., Larsen, N., Rojas, M., Brodie, E. L., Keller, K., et al. (2006). Greengenes, a chimera-checked 16S rRNA gene database and workbench compatible with ARB. Appl. Environ. Microbiol. 72, 5069–5072. doi:10.1128/AEM.03006-05
Fachmann, M. S. R., Löfström, C., Hoorfar, J., Hansen, F., Christensen, J., Mansdal, S., et al. (2017). Detection of Salmonella enterica in meat in less than 5 hours by a low-cost and noncomplex sample preparation method. Appl. Environ. Microbiol. 83, e03151–16. doi:10.1128/AEM.03151-16
FAO (2022). Food loss and waste database. Available at: https://www.fao.org/platform-food-loss-waste/flw-data/en/ (Accessed January 14, 2022).
Favell, D. J. (1998). A comparison of the vitamin C content of fresh and frozen vegetables. Food Chem. 62, 59–64. doi:10.1016/S0308-8146(97)00165-9
Fonseca, S. C., Oliveira, F. A. R., and Brecht, J. K. (2002). Modelling respiration rate of fresh fruits and vegetables for modified atmosphere packages: A review. J. Food Eng. 52, 99–119. doi:10.1016/S0260-8774(01)00106-6
Fox, J., and Weisberg, S. (2019). An {R} companion to applied regression. Third Edition. Thousand Oaks CA: Sage. Available at: https://socialsciences.mcmaster.ca/jfox/Books/Companion/.
Graves, S., Piepho, H.-P., and Selzer, L. (2019). multcompView: Visualizations of paired comparisons. R package version 0.1-8. Available at: https://cran.r-project.org/package=multcompView (Accessed January 14, 2022).
Guldager, H. S., Bøknæs, N., Østerberg, C., Nielsen, J., and Dalgaard, P. (1998). Thawed cod fillets spoil less rapidly than unfrozen fillets when stored under modified atmosphere at 2°C. J. Food Prot. 61, 1129–1136. doi:10.4315/0362-028X-61.9.1129
ICMSF (2011). Editor K. M. Swanson (Springer). doi:10.1007/978-1-4419-9374-8_19Microorganisms in foods 8
Illumina (2021). 16S metagenomic sequencing library preparation preparing 16S ribosomal RNA gene amplicons for the illumina MiSeq system. San Diego, California, United States: Illumina.
ISO (2015). Sensory analysis — assessment (determination and verification) of the shelf life of foodstuffs. Geneva: International Organization for Standardization.
Jerše, A., Amlund, H., Rasmussen, R. R., and Sloth, J. J. (2021). Iodine determination in animal feed by inductively coupled plasma mass spectrometry–results of a collaborative study. Food Addit. Contam. Part A Chem. Anal. Control Expo. Risk Assess. 38, 261–267. doi:10.1080/19440049.2020.1856942
Kader, A. A. (1987). “Respiration and gas exchange of vegetables,” in Postharvest physiology of vegetables. Editor J. Weichmann (New York: Marcel Dekker).
Kruskal, W. H., and Wallis, W. A. (1952). Use of ranks in one-criterion variance analysis. J. Am. Stat. Assoc. 47, 583–621. doi:10.1080/01621459.1952.10483441
Kuuliala, L., Al Hage, Y., Ioannidis, A. G., Sader, M., Kerckhof, F. M., Vanderroost, M., et al. (2018). Microbiological, chemical and sensory spoilage analysis of raw Atlantic cod (Gadus morhua) stored under modified atmospheres. Food Microbiol. 70, 232–244. doi:10.1016/j.fm.2017.10.011
Liot, F., Colin, A., and Mabeau, S. (1993). Microbiology and storage life of fresh edible seaweeds. J. Appl. Phycol. 5, 243–247. doi:10.1007/BF00004025
López-Pérez, O., del Olmo, A., Picon, A., and Nuñez, M. (2020). Volatile compounds and odour characteristics during long-term storage of kombu seaweed (Laminaria ochroleuca) preserved by high pressure processing, freezing and salting. Lwt 118, 108710. doi:10.1016/j.lwt.2019.108710
Løvdal, T., Lunestad, B. T., Myrmel, M., Rosnes, J. T., and Skipnes, D. (2021). Microbiological food safety of seaweeds. Foods 10, 2719–2722. doi:10.3390/foods10112719
Mahadevan, K. (2015). “Seaweeds: A sustainable food source,” in Seaweed sustainability: Food and non-food applications. Editors B. K. Tiwari, and D. J. Troy (San Diego: Academic Press), 347–364. doi:10.1016/B978-0-12-418697-2.00013-1
Man, C. M. D. (2016). “Food storage trials,” in The stability and shelf life of food. Editor P. Subramaniam (London: Elsevier), 171–198. doi:10.1016/B978-0-08-100435-7.00006-X
Marquez, G. P. B., Santiañez, W. J. E., Trono, G. C., de la Rama, S. R. B., Takeuchi, H., and Hasegawa, T. (2015). “Seaweeds: A sustainable fuel source,” in Seaweed sustainability: Food and non-food applications. Editors B. K. Tiwari, and D. J. Troy (San Diego: Academic Press), 421–458. doi:10.1016/B978-0-12-418697-2.00016-7
Matsson, S., Christie, H., and Fieler, R. (2019). Variation in biomass and biofouling of kelp, Saccharina latissima, cultivated in the Arctic, Norway. Aquaculture 506, 445–452. doi:10.1016/j.aquaculture.2019.03.068
Nayyar, D. (2016). Refrigerated shelf life evaluation and effects of minimal processing on antioxidant capacity of Fresh Sea vegetables from new england. Available at: http://digitalcommons.library.umaine.edu/etd/2491 (Accessed May 08, 2022).
Nayyar, D., and Skonberg, D. I. (2019). Contrasting effects of two storage temperatures on the microbial, physicochemical, and sensory properties of two fresh red seaweeds, Palmaria palmata and Gracilaria tikvahiae. J. Appl. Phycol. 31, 731–739. doi:10.1007/s10811-018-1545-8
Nielsen, C. W., Holdt, S. L., Sloth, J. J., Marinho, G. S., Sæther, M., Funderud, J., et al. (2020). Reducing the high iodine content of Saccharina latissima and improving the profile of other valuable compounds by water blanching. Foods 9, foods9050569. doi:10.3390/foods9050569
Nielsen, C. W., Rustad, T., and Holdt, S. L. (2021). Vitamin C from seaweed: A review assessing seaweed as contributor to daily intake. Foods 10, 198. doi:10.3390/foods10010198
NMKL (2006). Næringsmidler No . 184 Aerobic count and specific spoilage organisms in fish and fish products. Nord. Comm. food Anal., 2–7.
Olafsen, T., Winther, U., Olsen, Y., and Skjermo, J. (2012). Verdiskaping basert på produktive hav i 2050. Available at: https://www.sintef.no/globalassets/upload/fiskeri_og_havbruk/publikasjoner/verdiskaping- basert-pa-produktive-hav-i-2050.pdf (Accessed January 14, 2022).
Paull, R. E., and Chen, N. J. (2008). Post-harvest handling and storage of the edible red seaweed Gracilaria. Postharvest Biol. Technol. 48, 302–308. doi:10.1016/j.postharvbio.2007.12.001
Perry, J. J., Brodt, A., and Skonberg, D. I. (2019). Influence of dry salting on quality attributes of farmed kelp (Alaria esculenta) during long-term refrigerated storage. Lwt 114, 108362. doi:10.1016/j.lwt.2019.108362
Peteiro, C., Sánchez, N., and Martínez, B. (2016). Mariculture of the Asian kelp Undaria pinnatifida and the native kelp Saccharina latissima along the Atlantic coast of Southern Europe: An overview. Algal Res. 15, 9–23. doi:10.1016/j.algal.2016.01.012
Picon, A., del Olmo, A., and Nuñez, M. (2021). Bacterial diversity in six species of fresh edible seaweeds submitted to high pressure processing and long-term refrigerated storage. Food Microbiol. 94, 103646. doi:10.1016/j.fm.2020.103646
Quast, C., Pruesse, E., Yilmaz, P., Gerken, J., Schweer, T., Yarza, P., et al. (2013). The SILVA ribosomal RNA gene database project: Improved data processing and web-based tools. Nucleic Acids Res. 41, 590–596. doi:10.1093/nar/gks1219
Rajauria, G. (2015). “Seaweeds: A sustainable feed source for livestock and aquaculture,” in Seaweed sustainability: Food and non-food applications. Editors B. Tiwari, and TroyD (Amsterdam, Netherlands: Elsevier). doi:10.1016/B978-0-12-418697-2/00015-5
Ratkowsky, D. A., Olley, J., McMeekin, T. A., and Ball, A. (1982). Relationship between temperature and growth rate of bacterial cultures. J. Bacteriol. 149, 1–5. doi:10.1128/jb.149.1.1-5.1982
R-Core-Team, (2020). R: A language and environment for statistical computing. R foundation for statistical computing. Available at: https://www.r-project.org/.
Robeson, M. S., O´Rourke, D. R., Kaehler, B. D., Ziemski, M., Dillon, M. R., Foster, J. T., et al. (2020). RESCRIPt: Reproducible sequence taxonomy reference database management for the masses. bioRxiv. doi:10.1101/2020.10.05.326504
Robinson, J. E., Browne, K. M., and Burton, W. G. (1975). Storage characteristics of some vegetables and soft fruits. Ann. Appl. Biol. 81, 399–408. doi:10.1111/j.1744-7348.1975.tb01656.x
Ruggiero, M. A., Gordon, D. P., Orrell, T. M., Bailly, N., Bourgoin, T., Brusca, R. C., et al. (2015). A higher level classification of all living organisms. PLoS One 10, e0119248–e0119260. doi:10.1371/journal.pone.0119248
Safafar, H., Wagenen, J. van., Møller, P., and Jacobsen, C. (2015). Carotenoids, phenolic compounds and tocopherols contribute to the antioxidative properties of some microalgae species grown on industrial wastewater. Mar. Drugs 13, 7339–7356. doi:10.3390/md13127069
Sánchez-García, F. S., Hernandez, I., Palacios, V. M., and Roldán, A. M. (2021). Freshness quality and shelf life evaluation of the seaweed Ulva rigida through physical, chemical, microbiological, and sensory methods. Foods 10, 181–215. doi:10.3390/foods10010181
Sappati, P. K., Nayak, B., and van Walsum, G. P. (2017). Effect of glass transition on the shrinkage of sugar kelp (Saccharina latissima) during hot air convective drying. J. Food Eng. 210, 50–61. doi:10.1016/j.jfoodeng.2017.04.018
Sappati, P. K., Nayak, B., VanWalsum, G. P., and Mulrey, O. T. (2019). Combined effects of seasonal variation and drying methods on the physicochemical properties and antioxidant activity of sugar kelp (Saccharina latissima). J. Appl. Phycol. 31, 1311–1332. doi:10.1007/s10811-018-1596-x
Schiweck, H., Bär, A., Vogel, R., Schwarz, E., Kunz, M., Dusautois, C., et al. (2012). Sugar alcohols. Ullmann´s Encycl. Ind. Chem., 265–275. doi:10.1002/14356007.a25_413.pub3
Schloerke, B., Cook, D., Larmarange, J., Briatte, F., Marbach, M., Thoen, E., et al. (2021). GGally: Extension to “ggplot2”. R package version 2.1.0. Available at: https://cran.r-project.org/package=GGally%0A%0A (Accessed January 14, 2022).
Shannon, C. E. (1948). A mathematical theory of communication. Bell Syst. Tech. J. 27, 379–423. doi:10.1002/j.1538-7305.1948.tb01338.x
Skonberg, D. I., Fader, S., Perkins, L. B., and Perry, J. J. (2021). Lactic acid fermentation in the development of a seaweed sauerkraut-style product: Microbiological, physicochemical, and sensory evaluation. J. Food Sci. 86, 334–342. doi:10.1111/1750-3841.15602
Sørensen, J. S., Bøknæs, N., Mejlholm, O., and Dalgaard, P. (2020). Superchilling in combination with modified atmosphere packaging resulted in long shelf-life and limited microbial growth in Atlantic cod (Gadus morhua L.) from capture-based-aquaculture in Greenland. Food Microbiol. 88, 103405. doi:10.1016/j.fm.2019.103405
Sørensen, J. S., Madsen, S. K., Bang-Berthelsen, C. H., and Hansen, L. T. (2021). Quality and safety aspects in fermentation of winged kelp (Alaria esculenta) and sugar kelp (Saccharina latissima) by the natural microbiota with or without addition of a Lactiplantibacillus plantarum starter culture. Food Res. Int. 150, 110800. doi:10.1016/j.foodres.2021.110800
Sørensen, T. (1948). A method of establishing groups of equal amplitude in plant sociology based on similarity of species content and its application to analyses of the vegetation on Danish commons. Det. K. Dan. Vidensk. Selsk. 5, 1–34. doi:10.1007/BF02852438
Spínola, V., Llorent-Martínez, E. J., and Castilho, P. C. (2014). Determination of vitamin C in foods: Current state of method validation. J. Chromatogr. A 1369, 2–17. doi:10.1016/j.chroma.2014.09.087
Watada, A. E., and Qi, L. (1999). Quality of fresh-cut produce. Postharvest Biol. Technol. 15, 201–205. doi:10.1016/S0925-5214(98)00085-4
Wickham, H., François, R., Henry, L., and Müller, K. (2021). Dplyr: A grammar of data manipulation. R package version 1.0.3. Available at: https://cran.r-project.org/package=dplyr (Accessed January 14, 2022).
Keywords: sensory, microbiota, chemical composition, nutrients, physicochemical, processing, best practice, storage trial
Citation: Wirenfeldt CB, Sørensen JS, Kreissig KJ, Hyldig G, Holdt SL and Hansen LT (2022) Post-harvest quality changes and shelf-life determination of washed and blanched sugar kelp (Saccharina latissima). Front. Food. Sci. Technol. 2:1030229. doi: 10.3389/frfst.2022.1030229
Received: 28 August 2022; Accepted: 13 September 2022;
Published: 29 September 2022.
Edited by:
Giustino Tribuzi, Federal University of Santa Catarina, BrazilReviewed by:
Carlos Yure B. Oliveira, Federal Rural University of Pernambuco, BrazilRoberto Odorico, BIO-RES, Italy
Copyright © 2022 Wirenfeldt, Sørensen, Kreissig, Hyldig, Holdt and Hansen. This is an open-access article distributed under the terms of the Creative Commons Attribution License (CC BY). The use, distribution or reproduction in other forums is permitted, provided the original author(s) and the copyright owner(s) are credited and that the original publication in this journal is cited, in accordance with accepted academic practice. No use, distribution or reproduction is permitted which does not comply with these terms.
*Correspondence: Cecilie Bay Wirenfeldt, Y2V3aW5pQGZvb2QuZHR1LmRr; Jonas Steenholdt Sørensen, am9uc29yQGZvb2QuZHR1LmRr
‡Present address: Katharina Johanna Kreissig, Nordic Innovators P/S, Copenhagen, Denmark
†These authors have contributed equally to this work and share the first authorship