 Aakash Sharma
 Housyn Mahmoud
 Brahmaiah Pendyala1
 Ankit Patras
- 1Food Biosciences and Technology Program, Department of Agricultural and Environmental Sciences, Tennessee State University, Nashville, TN, United States
- 2Agriculture and Agri-Food Canada, Guelph, ON, Canada
The main objective of this study was to investigate the effectiveness of ultraviolet light (UV-C) emitting diodes for the decontamination of stainless steel food contact surfaces. Listeria monocytogenes (ATCC 19115), Escherichia coli (ATCC 25922), and Salmonella enterica serovar Typhimurium (ATCC 700720) were chosen as challenge microorganisms. Target microorganisms were subjected to UV-C dosages of 0, 2, 4, 6, and 8 mJ cm−2 at an average fluence of 0.163 mW/cm2 using a near-collimated beam operating at 279 nm wavelength. Escherichia coli showed lower sensitivity to UV-C light compared to Salmonella Typhimurium and followed first-order kinetics. Escherichia coli and Salmonella Typhimurium were reduced by more than 3-log10 cycles at the maximum UV dosage of 12 mJ cm−2. In contrast, Listeria monocytogenes followed the Weibull model with an apparent shoulder in the initial doses. A maximum reduction of 4.4-log10 was achieved at the highest exposure level. This study showed that UV-C LED devices represent an excellent alternative for the inactivation of foodborne microorganisms in droplets. Results clearly demonstrate that UV-C LED devices can serve as an additional sanitation method to routine cleaning practices, which are commonly utilized in the food industry.
1 Introduction
Microbiological cross-contamination has been a contributing factor to several well-documented outbreaks of foodborne illness in the United States (Jackson et al., 2011; CDC, 2008). The prevalence of microorganisms on food contact surfaces has been linked to their high environmental stability (Kramer and Assadian, 2014). In a food preparation setting, surfaces can be contaminated by various vectors (air and other gases, water and other liquids, and physical objects or people), which can lead to the transfer of pathogens (Listeria monocytogenes, Salmonella serovars, and Escherichia coli) to various food products (D’Souza et al., 2006). In practice, infected droplets with multiple microorganisms can land on food contact surfaces and form biofilms. Biofilms can harbor pathogens and spoilage microorganisms that can lead to food contamination and spoilage if not sanitized or disinfected. Commonly found microbes on food contact surfaces are enterobacteria, lactic acid bacteria, micrococci, streptococci, pseudomonads, and bacilli (Holah et al., 2002). A comprehensive review by Galié et al. (2018) highlights the importance of the development of alternative and sustainable strategies for controlling biofilms in the food industry.
Sources and vectors of pathogens may be associated with a specific process step or may affect the processing line in general. For example, contaminated air in the production environment might affect many processing steps within a production line, whereas vectors associated with a specific line procedure may be associated solely with a specific process step. Cleaning-in-place procedures, if not done correctly, may leave residual droplets contaminated with pathogenic microorganisms leading to matured biofilm formation. The cleanliness of surfaces, good manufacturing, and design practices are important in combating hygiene problems within the food industry (Holah, Lelieveld, and Gabric, 2016). Currently, disinfection after the removal of biofilms, using suitable cleaning procedures, is also required in food plants where wet surfaces provide favorable conditions for microbial growth. In the food industry, equipment design and choice of surface materials are important in inactivating microbial biofilm formation. The most practical material in processing equipment is steel (Carrascosa et al., 2021), which can be treated with mechanical grinding, brushing, lapping, and electrolytic or mechanical polishing. Dead ends, corners, cracks, crevices, gaskets, valves, and joints are vulnerable points for contaminated water droplets. Therefore, mechanical/chemical cleaning will always be limited, and unless huge attention is paid to details, it is impossible to guarantee the prevention of food contamination and future outbreaks. Therefore, we aim to investigate the efficacy of eliminating microbial contamination with LED UV-C light.
There is limited literature on the application of UV-C LED (279 nm) for inactivating microorganisms in fluid suspensions and surfaces. Kim, Kim, and Kang (2017) investigated the bactericidal effect of 266–279 nm wavelength on vegetative cells. Inoculated media were treated at dosages of 0.1, 0.2, 0.3, 0.4, 0.5, and 0.6 mJ/cm2. The authors observed that low wavelength (266 nm) resulted in a higher microbial reduction of bacteria and yeasts compared to high wavelength UV-Cs. E. coli O157:H7 and Salmonella spp. were easily inactivated by UV-C LEDs. It is also worth noting that the applied doses to the microorganism were relatively low, as documented in the literature for 254 nm wavelength. UV-C susceptibility followed the sequence of Gram-negative bacteria > Gram-positive bacteria > yeasts. Green et al. (2018) qualitatively showed that UV LEDs in the 259–275 nm range must be either as effective as or, in most cases, more effective than low-pressure mercury (LMP) lamps emitting at 253.7 nm in the reduction of three common foodborne pathogens. In contrast, according to Kim, Kim, and Kang (2016), 266 nm UV-C LEDs demonstrated over 5-log reductions in E. coli O157:H7 and S. Typhimurium, whereas 1–2-log reductions were achieved using UV lamps at the same dosages with UV lamp intensity attenuated to the levels of UV-C LED.
Due to the germicidal effects (direct damage of DNA) of UV-C (200–280 nm) light, it is envisaged that the application of UV energy can be translated for surface sanitation in the food industry to control microorganisms in food environments (Fan et al., 2017). In literature, the UV-C light treatment was successfully applied to the decontamination of various food products, including chicken, raw salmon, hazelnut, tiger nut milk, and tomato (Holck et al., 2018). UV-C light treatment has also been used in the food industry for different purposes, including air sanitation in meat and vegetable processing and the reduction of pathogens in red meat, poultry, and fish (Wong, Linton, and Gerrard, 1998; Liltved and Landfald, 2000). UV-C treatment of heat-resistant yeasts, molds, and Bacillus spores are also common applications in orange juice processing (Tran and Farid, 2004). Additionally, UV-C irradiation has been successfully applied to the pasteurization of certain liquid foods, such as milk and fruit juices (Koutchma et al., 2004; Matak et al., 2005; Pendyala et al., 2020), but data on food contact surfaces are limited, especially on droplets, a prerequisite for biofilm formation. Such data are required to evaluate the inactivation of bacterial cells through exposure to UV irradiation. To the best of our knowledge, this study is the first to apply a mathematical modeling approach to investigate the effect of a single UV-C wavelength on microorganisms in droplets.
Our objective in this study was to investigate the efficiency of UV-C LED irradiation as a non-thermal decontamination process for inactivating microorganisms in a droplet on food contact surfaces (E. coli, Salmonella Typhimurium, and Listeria monocytogenes). For this purpose, the effects of 279 nm UV-C LED were investigated due to the already established DNA damage along with less known protein degradation.
2 Materials and methods
2.1 Materials
Peptone water: 20 g of buffered peptone water base (Bio-Rad Laboratories, Inc., Hercules, CA, United States) was added to 1,000 ml of de-ionized water, followed by mixing (500 rpm at 150°C for 5 min) and autoclaving (121°C for 15 min at 15 psi). Phosphate buffered saline (PBS) of 1% was prepared from stock, as mentioned by Maclean et al. (2009).
2.2 Bacterial strain and culture conditions
Escherichia coli ATCC 25922, Salmonella Typhimurium ATCC 700720, and Listeria monocytogenes ATCC 19115 were obtained from American Type Culture Collection (Manassas, Virginia) in a freeze-dried vial (stored at 4°C till reactivation). E. coli and Salmonella Typhimurium were propagated in the tryptic soy broth (TSB) (211825, Becton Dickinson and Company, Le Pont de Claix, France) and plated on tryptic soy agar (TSA) (236950, Becton Dickinson and Company, Le Pont de Claix, France). Both cultures were inoculated at 2% in sterile TSB broth, followed by incubation at 37°C for 18 h for propagation. The method for propagation and plating was adapted from Beck et al. (2017) and Vashisht et al. (2021). Listeria was propagated and plated using buffered Listeria enrichment broth base (CM0897; Oxoid Ltd., Basingstoke, United Kingdom) and Listeria selective agar base (CM0856; Oxoid Ltd., Basingstoke, United Kingdom) with Listeria selective supplement (Oxoid Ltd., Basingstoke, United Kingdom). Listeria was inoculated at 2% in sterile broth, followed by 24 h of incubation at 37°C. Bhullar et al. (2019) was used as reference for Listeria propagation and plating. All cultures were stored at 4°C after incubation.
Fresh bacterial cells were harvested by centrifugation (3,000 × g, 5 min) using a high-speed microcentrifuge (VWR International, Radnor, Pennsylvania, United States) at room temperature. Cell pellets were washed twice in 0.1% (w/v) PBS (Becton Dickinson, New Jersey, United States) and re-suspended in 1 ml of PBS. Appropriate dilutions in peptone water (in 0.1% PW) were plated in duplicate onto TSA (Oxoid Ltd., Basingstoke, United Kingdom) plates for E. coli and Salmonella suspensions and incubated for 24 h at 37°C. Listeria monocytogenes suspensions were plated on Listeria selective agar base (CM0856; Oxoid Ltd., Basingstoke, United Kingdom) plates with incubation for 24 h at 37°C to enumerate the original population densities in each cell suspension. The suspensions contained approximately 109 cfu/ml. Appropriate dilutions were made to reach the target concentration of 107 cfu/ml.
2.3 Inoculation and UV-C exposures
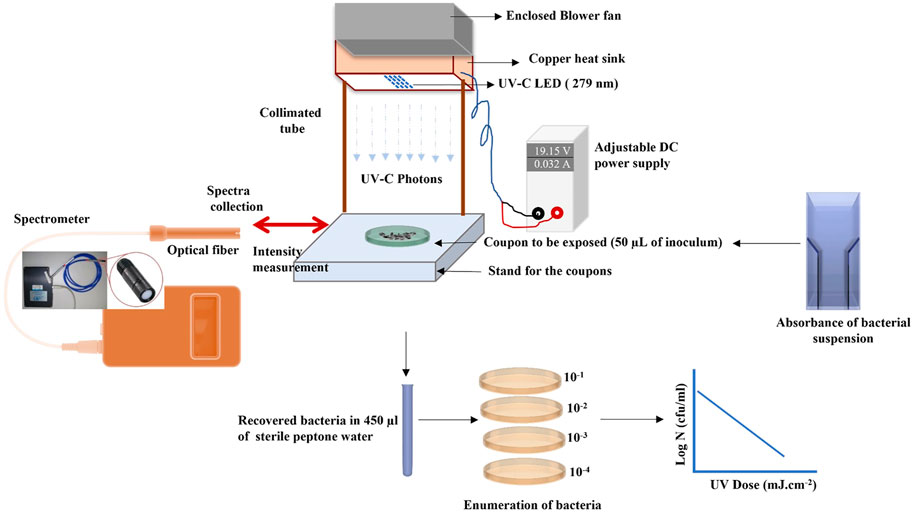
The 0.5-inch (12.7-mm) stainless steel circular coupons (grade 316L) were procured from BioSurface Technologies Corporation (Bozeman, MT). The coupons were sterilized using an autoclave to remove any natural flora. Cell suspensions of the test microorganism 7-log10 CFU/ml were inoculated on a coupon as a single 50-μL droplet (see Figure 3 for droplet geometry). The inoculated coupons were exposed to UV-C irradiation at a known height of 4 cm. A UV-C LED (IRTRONIX, Torrance, CA, United States), which emits at a peak wavelength of 279 nm, mounted on top of a quasi-collimated system (Figure 1), was used to perform irradiation experiments. A panel with sixteen UV-C light-emitting diodes was connected to the heat sink to prevent overheating of the LEDs. A PVC pipe (non-reflective black taping inside) was used to maintain the distance between the coupon and LEDs. This study used a DC power source generating 180 W Multirange 60V/8A DC Power Supply (BK Precision, Yorba Linda, CA, United States). Central irradiance incident on the surface of the droplet was measured with a high sensitivity calibrated spectrometer (QE Pro series, Ocean Optics, Dunedin, FL, United States) as absolute spectral irradiance (µw/cm2/nm). The spectrometer is equipped with an irradiance probe, a solarization-resistant optical fiber with a Spectralon cosine corrector of 180° field of view, coupled to its end. Spectralon is a Lambertian diffuse material with a reflectance higher than 95% in the 250–400 nm range. The irradiance of the LED system was measured across the sampling area where the coupon was placed to assess any inconsistency or spectral shift within the exposure area. The system was stable across the sampling area (14.9 cm2). The UV-C dose was calculated by summing the average UV irradiance over the wavelength range. It was calculated as a product of the UV intensity (mW.cm−2) and exposure time (sec). The UV-C dose was expressed as mJ.cm−2. UV dose exposures ranging from 0 to 8 mJ cm−2 were delivered to the microorganisms. All experiments were conducted in triplicate.
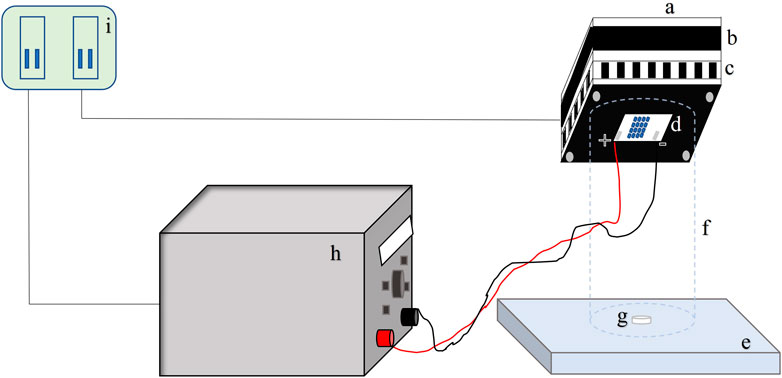
FIGURE 1. Schematic figure of UV-C exposure; a = Cooling fan impeller casing; b = Cooling fan; c = Fins and air circulation ports; d = LEDs; e = Flat surface; f = PVC cylinder (internally taped); g = SS Coupon; h = DC power supply; i = AC power supply.
2.4 Enumeration of microorganisms after UV-C treatments
After UV-C treatments, the coupon was washed using a fixed volume of diluent (i.e., suspending coupon in diluent and vortex) followed by decimal dilutions of the treated samples and control using 0.1% peptone water (12013259, Bio-Rad Laboratories, Inc., Hercules, CA, United States). E. coli, Salmonella, or L. monocytogenes inoculated droplets were diluted to between 10−2 and 10–7. Serial dilution of the irradiated samples was conducted using peptone water followed by spread plating within 2 h. The TSA plate was spread with a 100-μL diluted irradiated sample in duplicate. For Listeria enumeration, Listeria selective agar with Listeria selective supplement was used. The plates were incubated at 37°C for 18–24 h. Isolated colonies on the plates in the range of 25–250 colonies were counted and expressed as CFU/ml. All experiments were conducted in triplicate, and viable plate counts from three replications are reported as log CFU/ml.
2.5 Optical properties and UV-C spectra of bacterial suspensions
Optical properties and UV spectra of bacterial suspensions were measured in a double-beam Cary 100 spectrophotometer (Varian, United States) equipped with a 6-inch single integrating sphere (Labsphere, DRA-CA-30, United States) to include scattered light. The sphere primarily collects the total transmitted light through a bacterial suspension when the sample is placed at the entrance port and collects the total reflected light (diffuse reflectance) when the bacterial suspension is positioned at the exit port. The UV-C (220–280 nm) absorption spectra were determined for all three bacteria, as illustrated in Figure 2B. The method was adapted from Vashisht et al. (2022). The absorbance was determined using the Beer–Lambert law (Eq. 1):
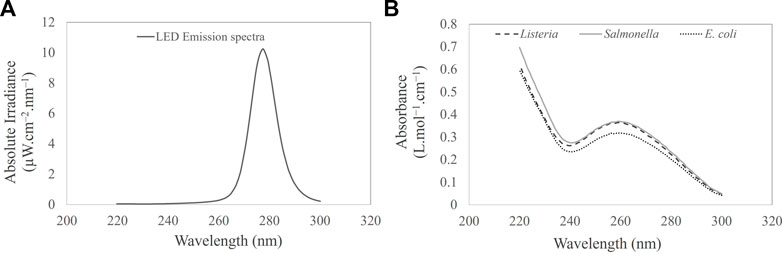
FIGURE 2. (A) UV-C LED emission spectra. (B) UV-C (220–300 nm) absorption spectra of Salmonella Typhimurium, Listeria monocytogenes, and Escherichia coli cell suspension in PBS.
where `A means absorbance,
2.6 Film geometry analysis
The bacterial suspension droplet on a 1-cm stainless steel coupon was analyzed using a camera of 16 megapixels. A picture was taken with a camera module, which allows for streamlined image processing in Python. The height of the camera sensor and film was aligned with a guided laser (Line Lasers-0109, Dreyoo) while images were captured. Film thickness was quantified using image pixels by Java-based image processing software (ImageJ).
2.7 Statistical analysis and mathematical modeling
A balanced design with three independent biological replicates for each treatment was exposed to the selected UV-C treatment. Each sample was independent and randomly assigned to a treatment. One-way ANOVA with Tukey’s HSD test was performed to assess the effects of UV-C on the SAS statistical computing environment (SAS, 2016). Data are presented as means ± standard deviation. Statistical significance was tested at a 5% significance level. All log reductions from the UV-C inactivation treatments were recorded, and log-linear and nonlinear models were fitted in Microsoft Excel and GInaFit Tool (Excel Add-in). Model fit statistics, including adjusted R2 and root mean square error (RMSE), were compared among the competing models (Geeraerd, Valdramidis, and Van Impe, 2005).
Log-linear and nonlinear models available in the GInaFiT were used to describe the UV-C inactivation kinetics of target microorganisms. The selected models provide a good fit to microbial inactivation data and goodness of fit parameters were evaluated ( including R2, RMSE, and rate constants). The linear inactivation model is given in the following equation:
For identification purposes, the expression was reformulated as
where C is the initial concentration of microorganisms, C0 is the concentration of microorganisms at dose D, k is the degradation rate constant, and D is the UV dose delivered.
The nonlinear model equation is as follows:
For identification purposes, the expression was reformulated as
where N is the initial concentration of the microorganisms, N0 is the concentration of microorganisms after the dose, p is the Weibull slope (or threshold parameter), δ represents a 90% reduction in the microbial population, and D is exposure dosage. The numerical values for inactivation kinetic parameters, the dosage required to obtain 5-log reduction, and other similar parameters were calculated for the model. The values of δ and p were used to calculate the desired log reduction at a specific dosage. The dose required to obtain an x log reduction (txd) was calculated using Eq. 7.
3 Results and discussion
3.1 UV-C LED absolute irradiance, emission spectra, and UV-C dose
The absolute irradiance of the LED device was determined using a QEPro high-performance spectrometer (Ocean Optics; Largo, FL, United States), as described briefly in Section 2.3. Figure 2A illustrates the wavelength and corresponding absolute irradiance (power output per unit area per wavelength) of the LED device. The peak emission of the LED device was observed at 279 nm, exhibiting an irradiance or average fluence rate of 0.163 ± 0.003 mJ cm−2 at a distance of 4 cm from the optical source. The current (0.032A) and voltage (19.15 V) were optimized to achieve the desired power. The UV dose and corresponding exposure times are shown in Table 1.
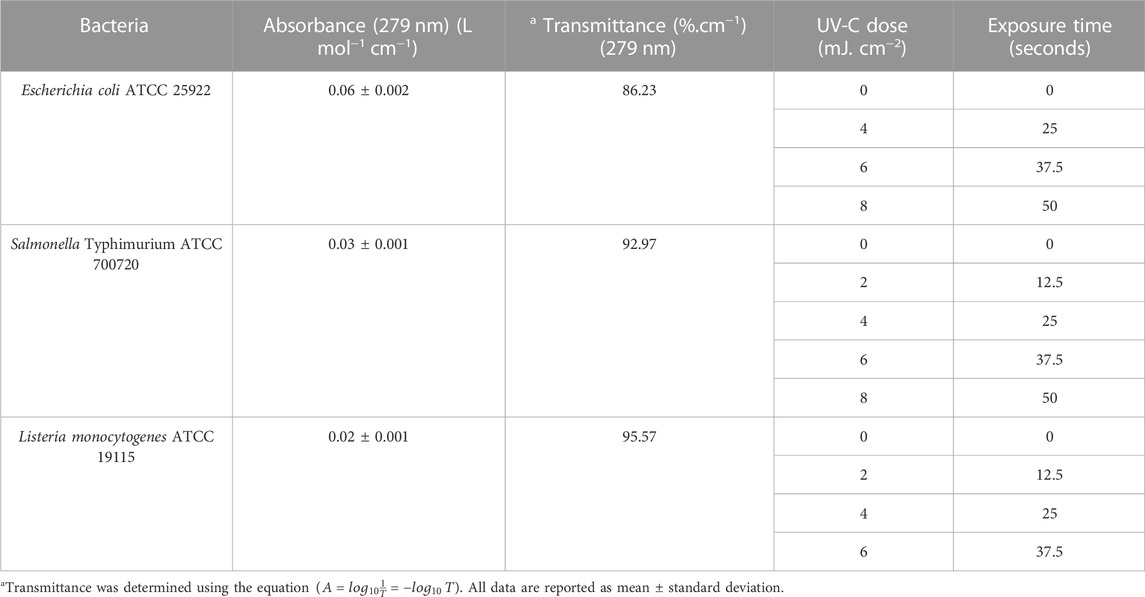
TABLE 1. Optical properties and calculated UV-C doses for microorganisms.
3.2 Absorption spectra and optical properties
Figure 2B shows the UV absorption spectra of E. coli, Salmonella, and Listeria. All UV wavelengths cause photochemical effects, and wavelengths in the UV-C range are particularly damaging to bacterial cells as they are absorbed by proteins and DNA (Bolton and Cotton, 2011; Rauth, 1965). A maximum peak at 260 nm was observed, as illustrated in Figure 2B. This corresponds absorption of UV energy by the bacterial DNA. Absorption in the peptide bonds within proteins at wavelengths above 260 nm was also observed. Pyrimidines (thymine, cytosine, and uracil) absorb approximately ten times more UV than purines. As evidenced in the literature, the optimum wavelength for inactivating bacteria, at 265 nm, is approximately 15% more effective than the UV-C peak of 254 nm. Perhaps, the optimum wavelength for inactivating spores is 270 nm, which is approximately 40% more effective than 254 nm (Waites et al., 1988).
A decrease in bacterial absorption was observed between 270 and 300 nm. It is envisaged that at a wavelength of 279 nm, the transmission was higher than that at 254 nm (12%). The increase in the UV transmission allows the photons to penetrate the fluid layers achieving a better dose distribution compared to 254 nm. Perhaps, the fluid region close to the source will achieve a high dosage compared to the bottom fluid layers. The spatial UV fluence rate can be described as a function of the optical transmissivity of the test fluid, the UV output of the optical source, and the distance to the source. The absorbance values of E. coli, Salmonella Typhimurium, and Listeria suspensions were 0.06 ± 0.002, 0.03 ± 0.001, and 0.02 ± 0.001 L mol−1 cm−1 corresponding to the UV transmission of the 86.23%, 92.97%, and 95.57% transmittance.
3.3 Film geometry and intensity distribution of droplet
Figure 3 shows the liquid film geometry over the 1-inch stainless steel coupon. The three-dimensional shape was identical to the spherical dome, with the maximum and minimum thicknesses at the center and periphery, respectively. The maximum thickness at the center was calculated as 0.71 mm using ImageJ software, as explained in Section 2.6. Over the thickness of the film, the UV intensity decreased as a function of fluid depth. UV intensity across the film depends on the film thickness and fluid optical properties. Fluid-dependent optical properties [i.e., absorbance (or transmittance), concentration, and scattering] are critical parameters that affect UV delivery and impact microbial inactivation. The UV-C dose is the number of photons absorbed per surface area by an irradiated fluid during a particular exposure time. The gradients in UV intensity as a function of fluid depth are illustrated in Figure 3. Only 84% of UV-C energy reaches the bottom layer of the fluid at the center, where the droplet is 0.71 mm thick.
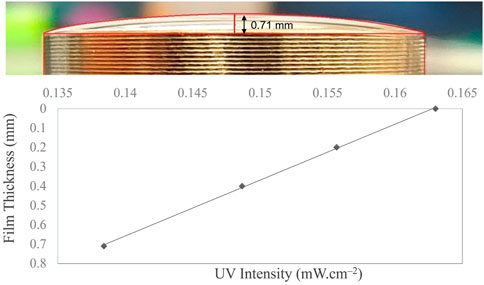
FIGURE 3. Liquid film geometry over a 0.5-inch stainless steel coupon with 50 μL cell suspension exhibiting a fluid thickness of 0.71 mm at the center following the spherical dome shape. The dose distribution curve with respect to the film thickness is illustrated, which shows that the irradiation intensity at the coupon surface reduces as the liquid film thickness increases.
4 UV-C inactivation of E. coli, Salmonella Typhimurium, and Listeria monocytogenes
4.1 UV inactivation of E. coli in a droplet
In this investigation, a LED system was tested against a suite of microorganisms in a droplet on the food contact surface. Survival curves were constructed by plotting log concentration versus UV doses. In general, the UV-C dose was calculated by multiplying the irradiance (mW/cm2) by the exposure time. Figure 4 shows the survival curves of E. coli. The survival curves followed a logarithmic order of death. With a maximum dosage dose of 8 mJ/cm2, a 3-log reduction for E. coli was achieved. Microbial inactivation followed the log-linear model with adjusted R2 values of 99.2% and Kmax value of 0.85 ± 0.02, with a low RMSE of 0.101.
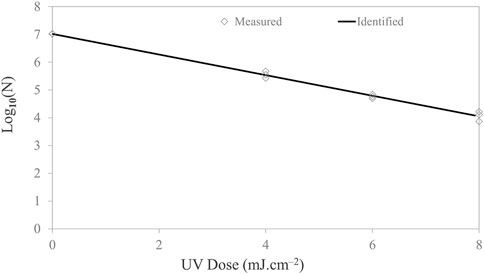
FIGURE 4. Microbial inactivation curve (survival colonies vs. UV dose) for Escherichia coli cell suspension in PBS on stainless steel coupon using a UV-C (279-nm wavelength) light-emitting diodes. Triplicate irradiations were performed for each dose; all replicates are shown on the plot as averages of duplicate plating of each irradiated sample.
For 1-, 2-, 3-, and 4-log inactivation of the Escherichia coli ATCC 25922 on the stainless steel coupon, the delivered UV doses were 2.70, 5.39, 8.09, 10.79 mJ/cm2, with a calculated D10 value of 2.70 mJ cm−2. Survival curves did not show tailing. The dose required for 4-log reduction was extrapolated based on the rate constants. In comparison, Kim and Kang (2020) reported a 0.9–1.44-log10 reduction of E. coli 0157:H7 with a UV-C dose of 2 mJ cm−2 on different dried food contact surfaces with 280 nm UV-C LEDs. Sommer et al. (1998) reported that UV-C doses of 6.0, 6.5, 7.0, 8.0, 9.0, and 10.0 mJ cm−2 resulted in 1-, 2-, 3-, 4-, 5-, and 6-log10 reduction of Escherichia coli ATCC 25922, respectively, using 254 nm low-pressure lamp as the UV source. Lu et al. (2021) examined the inactivation effect of UV LEDs with three different wavelengths on solid agar surfaces (mimicking food contact surface) and investigated any occurrence of synergistic effects under the simultaneous operation of any two UV wavebands (i.e., 369/288 nm and 369/271 nm). The authors observed that the 271-nm UV LED had the highest inactivation efficiency among the UV LEDs applied alone. Irradiance by a combination of 288/271-nm UV LEDs had a positive synergistic effect against E. coli, S. marcescens, and S. Typhimurium. The k-values revealed that the inactivation capacities of the 271-nm UV LED for the tested bacteria are in the following order: E. coli > S. marcescens > P. alcaligenes > S. epidermidis > S. Typhimurium.
4.2 UV-C inactivation of Salmonella in a droplet
The Salmonella populations were reduced by 4-log10 at the highest UV-C dose of 8 mJ cm−2. The first-order inactivation kinetics plotted in Figure 5 shows the inactivation trend. Kinetic rate constants are documented in Table 2. The experimental data were fitted to a log-linear model. The D10 (2.303/Kmax) value of Salmonella was observed to be 1.90 mJ/cm2/log. Figure 5 shows the log reductions obtained for Salmonella following exposure to 2, 4, 6, and 8 mJ cm−2 of the UV-C dosage. The data show a significant (p ≤ 0.05) increase in dose-dependent inactivation.
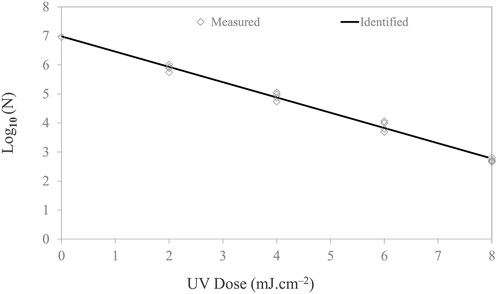
FIGURE 5. Microbial inactivation curve (survival colonies vs. UV dose) for Salmonella Typhimurium cell suspension in PBS on stainless steel coupon using UV-C (279 nm wavelength). Triplicate irradiations were performed for each dose; all replicates are shown on the plot as averages of duplicate plating of each irradiated sample.
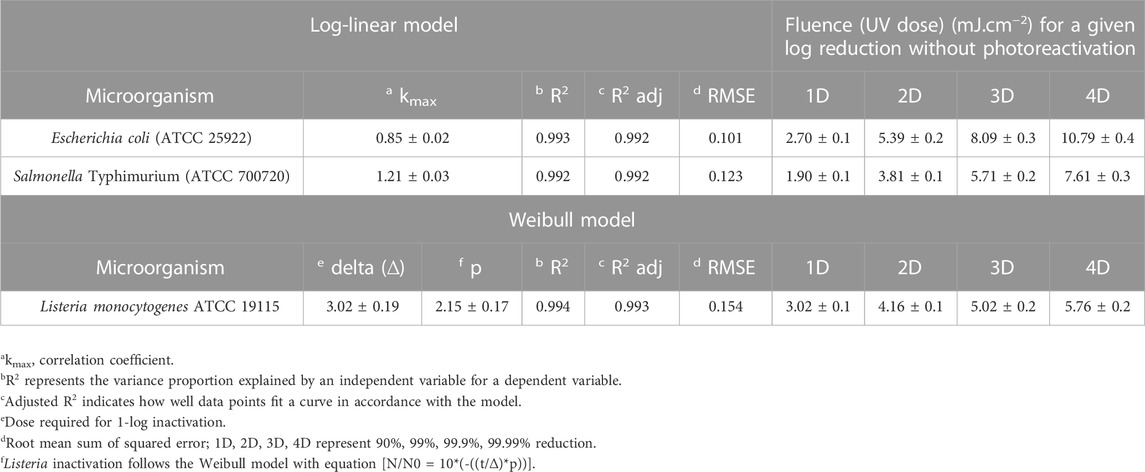
TABLE 2. Kinetic constants and D10 values of microorganisms.
For the 1-, 2-, 3-, and 4-log inactivation of Salmonella on the stainless steel coupon, the UV-C dose required was 1.90 ± 0.06, 3.81 ± 0.12, 5.71 ± 0.19, and 7.61 ± 0.25 mJ cm−2. Kim and Kang (2020) reported a 0.5–1.66-log reduction of Salmonella Typhimurium at a dose of 3.0 mJ/cm2 for dried food contact surfaces. Chang et al. (1985) reported that 7.00 mJ cm−2 UV-C dose inactivated 99.99% Salmonella Typhimurium while using a 254-nm low-pressure lamp (254 nm) for liquid suspension. A UV-C dose of 7.7 mJ cm−2 is required for 99.99% inactivation of Salmonella Typhimurium (Hu et al., 2012). Chen, Craik, and Bolton (2009) also reported that 7.8 mJ/cm2 UV-C dose inactivated 3-log10 of Salmonella Typhimurium. Among the different strains, UV sensitivity varies due to differences in their genetic makeup.
4.3 UV-C inactivation of Listeria in a thin-film droplet
The efficacy of UV-C light in inactivating Listeria is reported in Figure 6. A nonlinear inactivation trend was observed for Listeria. The shoulder curves started with a horizontal slope before developing into full exponential decay. It can be hypothesized that the lag in response to the stimulus implies that either a threshold dose may be necessary before measurable effects occur or repair mechanisms actively deal with low-level damage at low doses (Casarett, 1968). This effect is species-dependent and appears to be a function of light intensity. However, for low irradiance, the shoulder can be significant and prolonged for certain bacteria (Kowalski, 2001).
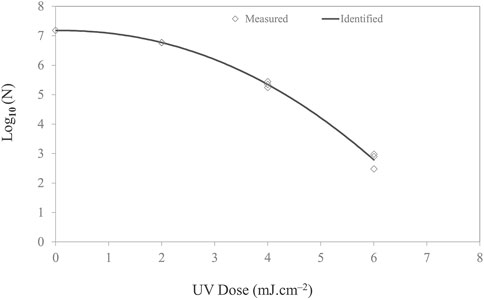
FIGURE 6. Microbial inactivation curve (survival colonies vs. UV dose) for Listeria monocytogenes cell suspension in PBS on stainless steel coupon using UV-C (279 nm wavelength) light-emitting diodes with total irradiance of 0.163 mW/cm2. Triplicate irradiations were performed for each dose; all replicates are shown on the plot as averages of duplicate plating of each irradiated sample.
The inactivation followed the Weibull model with a delta value and p-value of 3.02 ± 0.19 and 2.15 ± 0.17, respectively. The p-value signifies the shape of the microbial inactivation curve, which was observed to be convex. To describe the survival of Listeria in a film, different inactivation models available in the GInaFiT program, namely, the log-linear and Weibull, were fitted to the experimental inactivation data and evaluated for the goodness of fit. The GInaFiT tool was employed to perform regression analysis of microbial inactivation data. Adjusted R2 and RMSE values were 0.98 and 0.244, respectively. For 1-, 2-, 3-, and 4-log inactivation of Listeria on the stainless steel coupon, the UV-C doses required were 3.02 ± 0.06, 4.16 ± 0.12, 5.02 ± 0.18, and 5.76 ± 0.24 mJ cm−2.
The initial resistance toward UV-C inactivation might result from thicker cell walls in Gram-positive microorganisms. Several studies reported that Listeria shows increased resistance to any disinfection treatment if it had already been under any type of stress (Bernbom, Vogel, and Gram, 2011; Schaik et al., 1999; McKinney et al., 2009; Gahan, O’Driscoll, and Hill, 1996), for instance, L. monocytogenes (Gram positive) stressed with either acid or antibiotic showed a higher resistance to UV-C inactivation (McKinney et al., 2009). These findings indicate that despite the UV-C doses required for log inactivation of Listeria being considerably lower than required for 1-log10 inactivation of E. coli and Salmonella, the UV-C survival of Listeria was similar to that reported for other Gram-negative zoonotic pathogens, such as E. coli O157:H7 and Salmonella spp. (Manreet S Bhullar et al., 2018). The aforementioned findings are critical in understanding the inactivation of microorganisms in a thin-film droplet. We hypothesize that diffuse reflectivity spreads photons in all directions, regardless of the incident angle of incoming light rays. Perhaps the back reflection from the stainless steel coupon may explain the lower D value of target microorganisms compared to microbes suspended in clear solutions under stirred conditions. In addition, photons at 279 nm may cause protein damage and form dimers. The usefulness of surface rate constants is critical for equipment sterilization and disinfection of food contact surfaces. The inactivation rates of microbes on surfaces may vary depending on the type of surface used for the studies. Perhaps it is worth noting that the UV-C sensitivity of microorganisms on surfaces may be higher or lower than observed in water, for any given species; the absolute differences do not seem great that it would invalidate the use of water-based rate constants to predict surface disinfection rates.
5 Conclusion
UV-C light effectively inactivated the target microbes as a droplet on food contact surfaces (>3-log10 reduction). The optical property of the droplet dictated the inactivation rate. Many published studies on UV inactivation of microbes involved exposure on petri dishes or other solid materials. Therefore, these results can be considered applicable to surface disinfection. These sets of experiments concluded that photons at 279 nm can be used to disinfect food contact surfaces. This information is critical to design an effective UV-based surface disinfection system. The implementation of this novel technology could be used in combination with current chemical sanitizers to control spoilage and pathogenic microorganisms.
Data availability statement
The raw data supporting the conclusions of this article will be made available by the authors without undue reservation.
Author contributions
AS: conceptualization, methodology, investigation, and writing—original draft. HM: conceptualization, investigation, and writing—original draft. AP: supervision, funding acquisition, and writing—review and editing. BP: methodology and writing—review. SB: writing—review. All authors listed have made a substantial, direct, and intellectual contribution to the work and approved it for publication.
Funding
This research was supported by the United State Department of Agriculture (NIFA) (Award Number-2022-67018-36277) and the National Science Foundation (Division of Biochemical, Bioengineering, Environmental, and Transport System) (Award Number-2200683).
Acknowledgments
The authors would also like to thank Yvonne Myles and Amritpal Singh for their help in this project.
Conflict of interest
AP declared working as an editorial board member at Frontiers at the time of submission. This had no impact on the peer review process and the final decision.
The remaining authors declare that the research was conducted in the absence of any commercial or financial relationships that could be construed as a potential conflict of interest.
Publisher’s note
All claims expressed in this article are solely those of the authors and do not necessarily represent those of their affiliated organizations or those of the publisher, the editors, and the reviewers. Any product that may be evaluated in this article, or claim that may be made by its manufacturer, is not guaranteed or endorsed by the publisher.
References
Beck, S. E., Hodon Ryu, L. .A., Jennifer, L. C., Kaitlyn, M. J., James, S. R., Rosenblum, J. S., et al. (2017). Evaluating UV-C LED disinfection performance and investigating potential dual-wavelength synergy. Water Res. 109 (2), 207–216. doi:10.1016/J.WATRES.2016.11.024
Bernbom, N., Vogel, B. F., and Gram, L. (2011). Listeria monocytogenes survival of UV-C radiation is enhanced by presence of sodium chloride, organic food material and by bacterial biofilm formation. Int. J. Food Microbiol. 147 (1), 69–73. doi:10.1016/J.IJFOODMICRO.2011.03.009
Bhullar, M. S., Patras, A., Kilonzo-Nthenge, A., Pokharel, B., and Sasges, M. (2019). Ultraviolet inactivation of bacteria and model viruses in coconut water using a collimated beam system. Food Sci. Technol. Int. 25 (7), 562–572. doi:10.1177/1082013219843395
BhullarSingh, M., Patras, A., Kilanzo-Nthenge, A., Pokharel, B., Kumar Yannam, S., Rakariyatham, K., et al. (2018). Microbial inactivation and cytotoxicity evaluation of UV irradiated coconut water in a novel continuous flow spiral reactor. Food Res. Int. 103 (1), 59–67. doi:10.1016/J.FOODRES.2017.10.004
Bolton, J. R.Christine Anne Cotton (2011). The ultraviolet disinfection handbook. American Water Works Association.
Carrascosa, C., Raheem, D., Ramos, F., Saraiva, A., and Raposo, A. (2021). Maltitol: Analytical determination methods, applications in the food industry, metabolism and health impacts. Int. J. Environ. Res. Public Health. MDPI. 17, 5227. doi:10.3390/ijerph17145227
Casarett, A. P. (1968). American institute of biological sciences, and U S atomic energy commission. Radiation Biology. Prentice-Hall. Available at: https://books.google.com/books?id=7QW2AAAAIAAJ.
Chang, J. C. H., Ossoff, S. F., Lobe, D. C., Dorfman, M. H., Dumais, C. M., Qualls, R. G., et al. (1985). UV inactivation of pathogenic and indicator microorganisms. Appl. Environ. Microbiol. 49 (6), 1361–1365. doi:10.1128/AEM.49.6.1361-1365.1985
Chen, R. Z., Craik, S. A., and Bolton, J. R. (2009). Comparison of the action spectra and relative DNA absorbance spectra of microorganisms: Information important for the determination of germicidal fluence (UV dose) in an ultraviolet disinfection of water. Water Res. 43 (20), 5087–5096. doi:10.1016/J.WATRES.2009.08.032
D’Souza, D. H., Sair, A., Williams, K., Papafragkou, E., Jean, J., Moore, C., et al. (2006). Persistence of caliciviruses on environmental surfaces and their transfer to food. Int. J. Food Microbiol. 108 (1), 84–91. doi:10.1016/J.IJFOODMICRO.2005.10.024
Fan, X., Huang, R., and Chen, H. (2017). Application of ultraviolet C technology for surface decontamination of fresh produce. Trends Food Sci. Technol. 70 (12), 9–19. doi:10.1016/J.TIFS.2017.10.004
Gahan, C. G. M., O’Driscoll, B., and Hill., C. (1996). Acid adaptation of Listeria monocytogenes can enhance survival in acidic foods and during milk fermentation. Appl. Environ. Microbiol. 62 (9), 3128–3132. doi:10.1128/AEM.62.9.3128-3132.1996
Galié, S., García-Gutiérrez, C., Miguélez, E. M., Villar, C. J., and Lombó, F. (2018). Biofilms in the food industry: Health aspects and control methods. Frontiers in Microbiology. Frontiers Media S.A. doi:10.3389/fmicb.2018.00898
Green, A., Popović, V., Jacob, P., Biancaniello, M., Keith, W., and Koutchma, T. (2018). Inactivation of Escherichia coli, Listeria and Salmonella by single and multiple wavelength ultraviolet-light emitting diodes. Innovative Food Sci. Emerg. Technol. 47 (6), 353–361. doi:10.1016/J.IFSET.2018.03.019
Holah, J., Lelieveld, H., and Gabric, D. (2016). Handbook of hygiene control in the food industry. Sawston, Cambridge: Woodhead Publishing. doi:10.1016/C2014-0-01825-4
Holah, J. T., Taylor, J. H., Dawson, D. J., and Hall, K. E. (2002). Biocide use in the food industry and the disinfectant resistance of persistent strains of Listeria monocytogenes and Escherichia coli. J. Appl. Microbiol. Symposium Suppl. 92 (1), 111S–120S. doi:10.1046/J.1365-2672.92.5S1.18.X
Holck, A., Liland, K. H., Carlehög, M., and Heir, E. (2018). Reductions of Listeria monocytogenes on cold-smoked and raw salmon fillets by UV-C and pulsed UV light. Innovative Food Sci. Emerg. Technol. 50 (12), 1–10. doi:10.1016/J.IFSET.2018.10.007
Hu, X., Geng, S., Wang, X., and Hu, C. (2012). Inactivation and photorepair of enteric pathogenic microorganisms with ultraviolet irradiation. Environ. Eng. Sci. 29 (6), 549–553. doi:10.1089/EES.2010.037953
Jackson, K. A., Biggerstaff, M., Tobin-D’Angelo, M., Sweat, D., Klos, R., Nosari, J., et al. (2011). Multistate outbreak of Listeria monocytogenes associated with Mexican-style cheese made from pasteurized milk among pregnant, hispanic women. J. Food Prot. 74 (6), 949–953. doi:10.4315/0362-028X.JFP-10-536
Kim, D. k., and DongK, H. (2020). Effect of surface characteristics on the bactericidal efficacy of UVC LEDs. Food control. 108 (2), 106869. doi:10.1016/j.foodcont.2019.106869
Kim, D. K., Kim, S. J., and DongKang, H. (2017). Bactericidal effect of 266 to 279 Nm wavelength UVC-LEDs for inactivation of gram positive and gram negative foodborne pathogenic bacteria and yeasts. Food Res. Int. 97 (7), 280–287. doi:10.1016/J.FOODRES.2017.04.009
Kim, S. J., Do, K. K., and Dong, H. .K. (2016). Using UVC light-emitting diodes at wavelengths of 266 to 279 nanometers to inactivate foodborne pathogens and pasteurize sliced cheese. Appl. Environ. Microbiol. 82 (1), 11–17. doi:10.1128/AEM.02092-15/ASSET/506A677F-DFAF-474A-872D-C39BB64BF68E/ASSETS/GRAPHIC/ZAM9991167560002.JPEG
Koutchma, T., Keller, S., Chirtel, S., and Parisi, B. (2004). Ultraviolet disinfection of juice products in laminar and turbulent flow reactors. Innovative Food Sci. Emerg. Technol. 5 (2), 179–189. doi:10.1016/J.IFSET.2004.01.004
Kramer, A., and Assadian, O. (2014). “Survival of microorganisms on inanimate surfaces,” in Use of biocidal surfaces for reduction of healthcare acquired infections (Springer International Publishing). 9783319080574:7–26. doi:10.1007/978-3-319-08057-4_2
Liltved, H., and Landfald, B. (2000). Effects of high intensity light on ultraviolet-irradiated and non-irradiated fish pathogenic bacteria. Water Res. 34 (2), 481–486. doi:10.1016/S0043-1354(99)00159-1
Lu, Y., Yang, B., Zhang, H., and keung Lai, A. C. (2021). Inactivation of foodborne pathogenic and spoilage bacteria by single and dual wavelength UV-LEDs: Synergistic effect and pulsed operation. Food control. 125 (6), 107999. doi:10.1016/J.FOODCONT.2021.107999
Maclean, M., MacGregor, S. J., Anderson, J. G., and Woolsey, G. (2009). Inactivation of bacterial pathogens following exposure to light from a 405-nanometer light-emitting diode array. Appl. Environ. Microbiol. 75 (7), 1932–1937. doi:10.1128/AEM.01892-08
Matak, K. E., Churey, J. J., Worobo, R. W., Sumner, S. S., Hovingh, E., Hackney, C. R., et al. (2005). Efficacy of UV light for the reduction of Listeria monocytogenes in goat’s milk. J. Food Prot. 68 (10), 2212–2216. doi:10.4315/0362-028X-68.10.2212
McKinney, J. M., Williams, R. C. G. D. B., Joseph, D., Sumner, S. S., and Eifert, J. D. (2009). Effect of acid stress, antibiotic resistance, and heat shock on the resistance of Listeria monocytogenes to UV light when suspended in distilled water and fresh brine. J. Food Prot. 72 (8), 1634–1640. doi:10.4315/0362-028X-72.8.1634
McKinney, J., Williams, R. C., Boardman, G. D., Eifert, J. D., and Sumner, S. S. (2009). Dose of UV light required to inactivate Listeria monocytogenes in distilled water, fresh brine, and spent brine. J. Food Prot. 72 (10), 2144–2150. doi:10.4315/0362-028X-72.10.2144
Multistate Outbreak of Salmonella Agona Infections Linked to Rice and Wheat Puff Cereal (2008). Multistate outbreak of Salmonella agona infections linked to rice and wheat puff cereal.
Pendyala, B., Patras, A., Ravi, R., Sudhir Gopisetty, V. V., and Sasges, M. (2020). Evaluation of UV-C irradiation treatments on microbial safety, ascorbic acid, and volatile aromatics content of watermelon beverage. Food Bioprocess Technol. 13 (1), 101–111. doi:10.1007/s11947-019-02363-2
Rauth, A. M. (1965). The physical state of viral nucleic acid and the sensitivity of viruses to ultraviolet light. Biophysical J. 5 (3), 257–273. doi:10.1016/S0006-3495(65)86715-7
Schaik, W. V., Cormac, G., Gahan, M., and Hill., C. (1999). Acid-adapted Listeria monocytogenes displays enhanced tolerance against the lantibiotics nisin and lacticin 3147. J. Food Prot. 62 (5), 536–539. doi:10.4315/0362-028X-62.5.536
Sommer, R., Haider, T., Cabaj, A., Pribil, W., and Lhotsky, M. (1998). Time dose reciprocity in UV disinfection of water. Water Sci. Technol. 38 (12), 145–150. doi:10.2166/wst.1998.0526
Tran, M. T. T., and Farid, M. (2004). Ultraviolet treatment of orange juice. Innovative Food Sci. Emerg. Technol. 5 (4), 495–502. doi:10.1016/J.IFSET.2004.08.002
Vashisht, P., Pendyala, B., Patras, A., Sudhir Gopisetty, V. V., and Ravi, R. (2022). Design and efficiency evaluation of a mid-size serpentine dean flow UV-C system for the processing of whole milk using computational fluid dynamics and biodosimetry. J. Food Eng. 335 (12), 111168. doi:10.1016/J.JFOODENG.2022.111168
Vashisht, P., Pendyala, B., Sudhir Gopisetty, V. V., and Patras, A. (2021). Modeling and validation of delivered fluence of a continuous dean flow pilot scale UV system: Monitoring fluence by biodosimetry approach. Food Res. Int. 148 (10), 110625. doi:10.1016/J.FOODRES.2021.110625
Keywords: UV-C LED, food contact surfaces, non-thermal processing, UV light, food and environment safety, food safety
Citation: Sharma A, Mahmoud H, Pendyala B, Balamurugan S and Patras A (2023) UV-C inactivation of microorganisms in droplets on food contact surfaces using UV-C light-emitting diode devices. Front. Food. Sci. Technol. 3:1182765. doi: 10.3389/frfst.2023.1182765
Received: 09 March 2023; Accepted: 28 April 2023;
Published: 17 May 2023.
Edited by:
Xiaonan Lu, McGill University, CanadaReviewed by:
Aubrey Francis Mendonca, Iowa State University, United StatesIrene R. Grant, Queen’s University Belfast, United Kingdom
Copyright © 2023 Sharma, Mahmoud, Pendyala, Balamurugan and Patras. This is an open-access article distributed under the terms of the Creative Commons Attribution License (CC BY). The use, distribution or reproduction in other forums is permitted, provided the original author(s) and the copyright owner(s) are credited and that the original publication in this journal is cited, in accordance with accepted academic practice. No use, distribution or reproduction is permitted which does not comply with these terms.
*Correspondence: Housyn Mahmoud, aG1haG1vdWRAdG5zdGF0ZS5lZHU=; Ankit Patras, YXBhdHJhc0B0bnN0YXRlLmVkdQ==