 Lena Trapp1
 Gisela Guthausen
- 1Institute of Mechanical Process Engineering and Mechanics, Karlsruhe Institute of Technology, Karlsruhe, Germany
- 2Fraunhofer Institute for Process Engineering and Packaging IVV, Freising, Germany
- 3Engler-Bunte-Institut, Water Chemistry and Technology, Karlsruhe Institute of Technology, Karlsruhe, Germany
Hazelnut-based spreads are very popular, and they are available in a variety of compositions and prices. They, therefore, require detailed quality control and reliable fraud detection regarding the substitution of high-cost cocoa butter. Transverse relaxation measured via 1H time domain NMR (TD-NMR) is an approach that is compatible with industrial quality control but allows an in-depth insight into the materials. When transverse relaxation is measured as a function of temperature in a moderate range T ϵ [253, 353] K, the melting of cocoa butter and palm oil can be studied. The observations can be taken as a basis for quality control as the prices of these two components are significantly different. Fats introduce different qualities to the spreads in addition. This paper describes the experimental procedure and the findings on a spread sample basis with a considerable span width regarding the ingredients of commercially available hazelnut-based spreads.
1 Introduction
Product fraud is a well-known problem in a wide range of industries. Apart from branded clothing and cosmetics, criminals are not stopping at adulterated food products (Ulberth and Buchgraber, 2000). Food fraud is often motivated by raw material costs to maximize financial profit. Popular examples of adulterated foods are olive oil, honey, wine, coffee, and fruit juices (Cordella et al., 2002; Ogrinc et al., 2003; Santos et al., 2016; Santos et al., 2017; Siddiqui et al., 2017). The adulterants usually do not pose a health risk to the consumer. The consumer, however, is deceived with respect to the quality, origin, and physiological value of the food, thus violating the consumer’s basic rights. Efficient food control procedures are indispensable due to these criminal intentions. Analytical techniques should provide reliable quality parameters that can be easily and reproducibly measured. A standard operating procedure (SOP) ensures that the method functions independently from the user. In addition, fast and cost-efficient measurement procedures are preferred. Nuclear magnetic resonance (NMR) represents a powerful and non-destructive device that is well-established in the food environment and also in the detection of adulteration. Apart from high-resolution NMR spectroscopy, the cost-efficient 1H time domain NMR (TD-NMR) with low-field instruments is widely spread in the food industry for quality control (Hills, 2006; van Duynhoven et al., 2010; Meyer et al., 2016; Blümich, 2019; Ezeanaka et al., 2019). Measurements of transverse relaxation provide information about the intrinsic molecular mobility in the low-frequency range. Since the transverse relaxation rate R2 of substances (e.g., water, oil, and fat) differs, the composition of samples is accessible not only by NMR-spectra but also with integral relaxation measurements by TD-NMR. To establish such a method, extensive preliminary investigations are necessary in both high-field and low-field NMR to find suitable parameters that allow conclusions to be drawn about the constituents of the samples.
Nut spreads are frequently consumed and, therefore, represent an important market segment for food products. Nut spreads are dispersions of solids in oils or fats derived from mostly hazelnuts and other drupes. A creamy, spreadable mass is available at room temperature due to the partial crystallization of high-melting triglycerides, which are mainly found in solid fats such as palm oil (PO) and cocoa butter (CB). A large proportion of the solids are finely ground nuts, sugar, milk powder, and cocoa powder. Commercial nut spreads are available in supermarkets in a huge variety of recipes but also fineness, homogeneity, and viscosity (Principato et al., 2022). PO is often added to nut spreads as a fatty phase to give the product a creamy consistency and stability. Due to the currently discussed ecological problems in PO production, alternative structuring fats come into the focus of the food industry and recipe development (Kovács et al., 2021; Marra et al., 2023). Some products are already constituted with CB instead of PO. However, the substitution of PO is associated with considerably higher raw material costs, changed physical parameters, and taste (Aydemir, 2019), and thus invites food fraud. For example, with a price of $830 per ton in September 2023 (World Bank, 2023), PO is nearly five to 10 times cheaper than CB. A suitable analytical method is, therefore, highly desirable. To the best of our knowledge, no analytical approach exists so far to detect possible frauds in nut-based spreads in a fast, non-destructive, and convenient way with good reproducibility. In this paper, we describe the use of the multi-echo sequence CPMG (Carr, Purcell, Meiboom, Gill) for that purpose and provide evidence for its suitability.
The aim of this study was to show the suitability of TD-NMR for the discrimination of PO- and CB-containing nut spreads and thus provide a basis for fraud detection in the context of hazelnut-based spreads. The NMR transverse relaxation properties of nut spreads were investigated to find reliable and well-defined quality characteristics with a focus on easily, but reliably, measurable parameters. Spectrally resolved measurements provided the basis for a TD-NMR application. Temperature-dependent measurements with TD-NMR provide insights into fat melting and allow for differentiation of the spreads. Measurements were performed on 20 commercially available hazelnut-based spreads and five fat raw materials as reference samples: hazelnut oil (HNO), sunflower oil (SFO), rapeseed oil (RO), PO, and CB.
2 Materials and methods
2.1 Materials
Virgin HNO was obtained from Reichold Feinkost GmbH (Diez, Germany), SFO from Nestlé (Vevey and Cham, Switzerland), RO from RAPSO Österreich GmbH (Aschach an der Donau, Austria), PO from Landkrone Naturkost und Naturwaren GmbH (St. Ingbert, Germany), and CB from Alnatura Produktions-und Handels GmbH (Darmstadt, Germany) as the main fat components of nut spreads. Because of the high content of unsaturated fatty acids, HNO (95% (Crews et al., 2005)), SFO (91% (Chowdhury et al., 2007)), and RO (93% (Lewinska et al., 2015)) are liquid at room temperature compared to CB (36%–43% (Naik and Kumar, 2014; Ghazani and Marangoni, 2021)) and PO (53% (Chowdhury et al., 2007)). In total, 20 hazelnut-based spreads (sample a-u, Table 1) were purchased from local supermarkets.
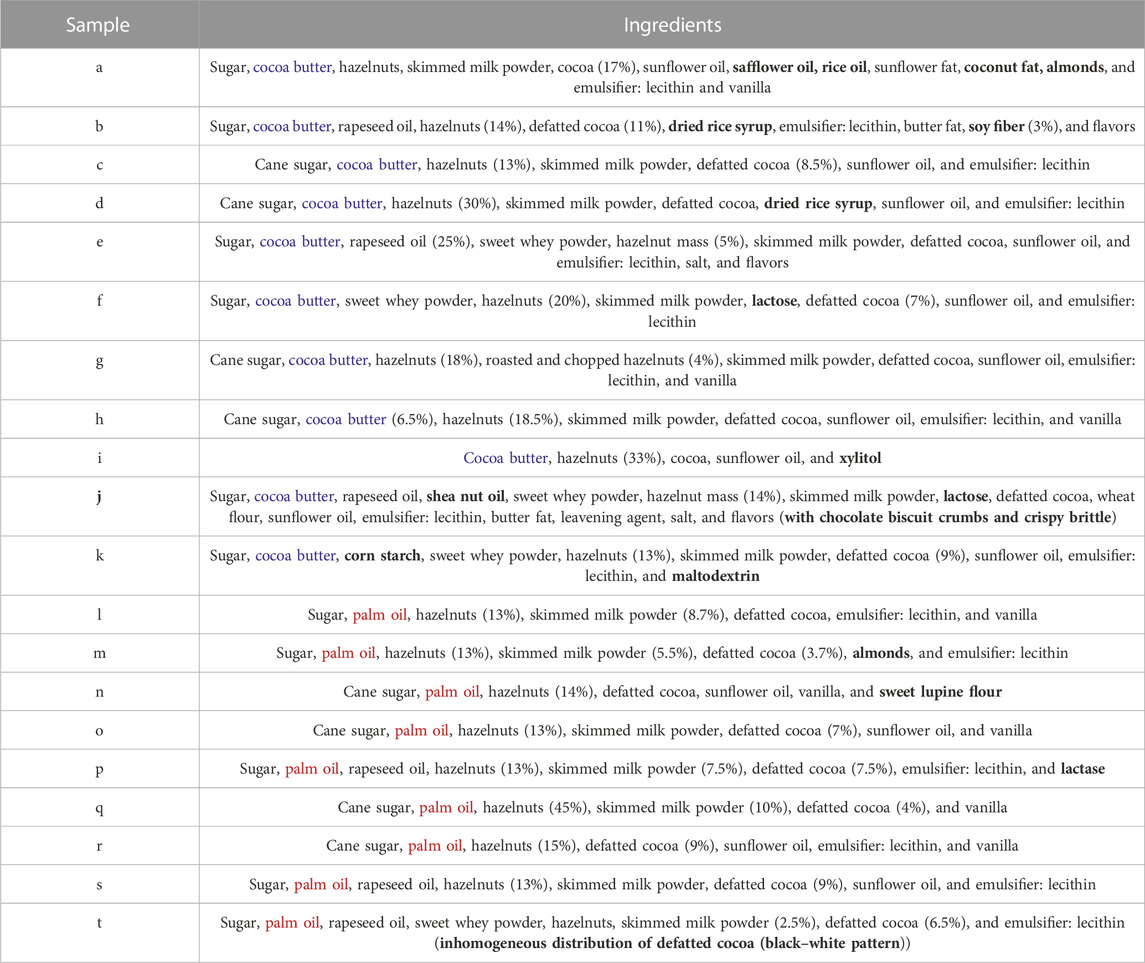
TABLE 1. Ingredients as reported on the label packaging of the 20 commercial nut spreads.
The samples were selected to cover a wide range of formulations. It is common to all spreads that their main components are sugar, vegetable oils or fats, cocoa, hazelnuts, and milk components (Table 2). The details of formulation and even of composition or fractions of the main ingredients are not disclosed to the consumer. All samples were stored at room temperature for weeks before the measurements, and melting was observed by transverse relaxation.

TABLE 2. Typical ranges of mass fractions of the main components in commercial nut spreads.
2.2 Instrumentation and NMR experiments
1H-NMR spectroscopy and transverse relaxation measurements with spectral resolution were performed on an AVANCE NEO NanoBay 300-MHz spectrometer equipped with a broadband BBFO probe and the acquisition software package TopSpin 4.0.9 (Bruker, Ettlingen, Germany) at a temperature T = 298 K. The CPMG multi-echo sequence according to Carr, Purcell, and Meiboom and Gill (1958) was used (Figure 1). In addition, CPMG transverse relaxation measurements were performed on a 20 MHz time domain Bruker minispec mq20 instrument to investigate transverse relaxation as the potential quality control parameter. T was varied in 5 K steps between 298 K and 373 K. A holding time of 10 min preceded each NMR measurement, guaranteeing isothermal conditions spatially and temporally. The samples were filled into 5-mm (300 MHz) and 10-mm (20 MHz) NMR glass tubes with a filling height of 10 mm to reduce temperature gradients and therefore convection especially at elevated T. All samples were measured undiluted to explore the capabilities of TD-NMR on samples, as available in quality control.
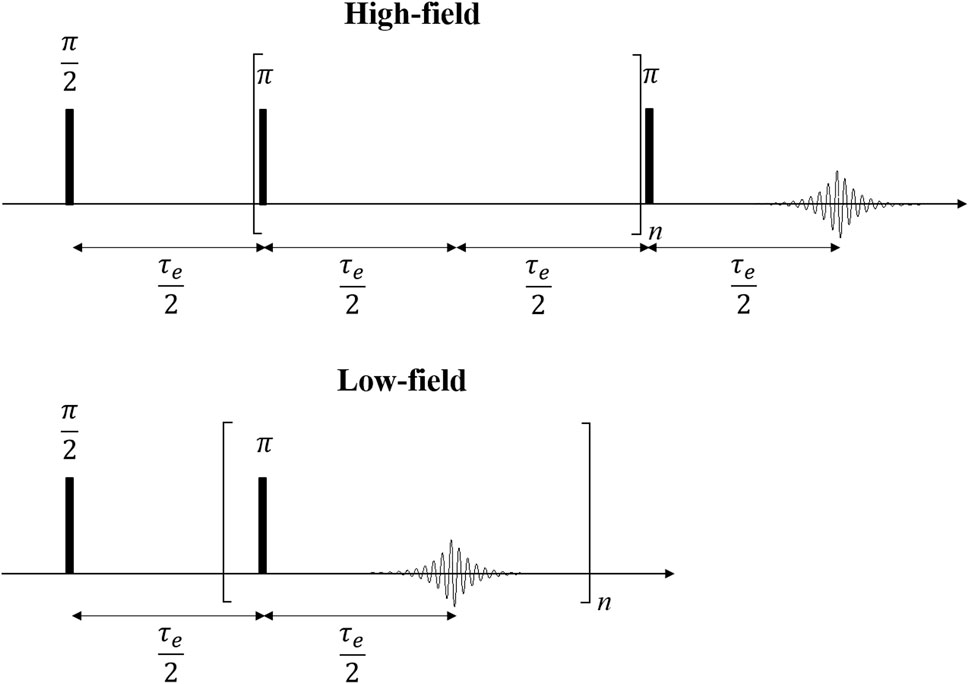
FIGURE 1. The CPMG pulse sequence is a multi-echo sequence for the measurement of transverse relaxation. A 90° pulse is followed by repeated refocusing by 180° refocusing pulses and echo acquisitions at intervals of half the echo time τe/2 with n-fold repetition until the signal decay was complete. In the case of spectrally resolved measurements, n is incremented while only the last echo is acquired (high-field, top), whereas the entire echo train is acquired in TD-NMR (low-field, bottom).
The main NMR parameters are listed in Table 3.
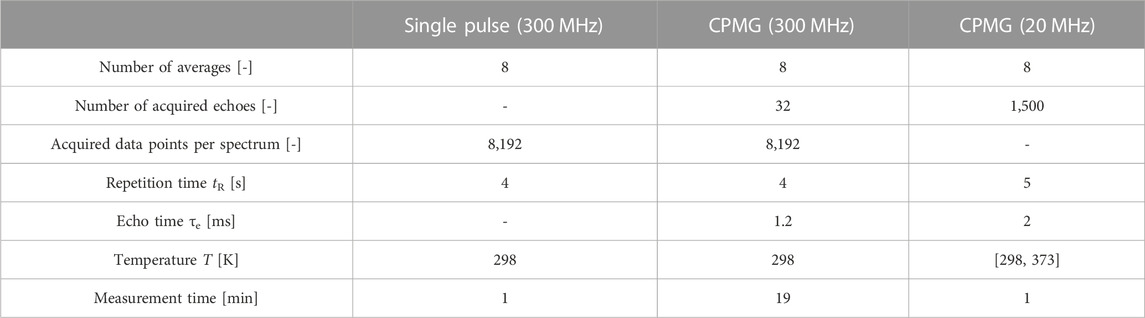
TABLE 3. Main parameters of the 1H-NMR experiments.
2.3 Data processing
Pseudo-2D datasets were recorded on the AVANCE NEO NanoBay 300-MHz spectrometer. Pseudo-2D means, in this context, that one dimension of the dataset is a time scale, n·τe (τe being the echo time and n the number of the echo), and the other dimension is the free induction decay (FID) time scale. The data were Fourier-transformed along that dimension and phase-corrected, providing chemical shift information (Figure 2). The waterfall plot shows largely unstructured spectra due to mainly homonuclear dipolar interactions. The spectra do not allow for an in-detail chemical analysis of fat composition. This would require either dissolution of the fats at a low concentration and measurements with dedicated pulse sequences or higher temperatures, leading to a comparison with spectra in the literature and databases (Díaz et al., 2005; Trapp et al., 2023).
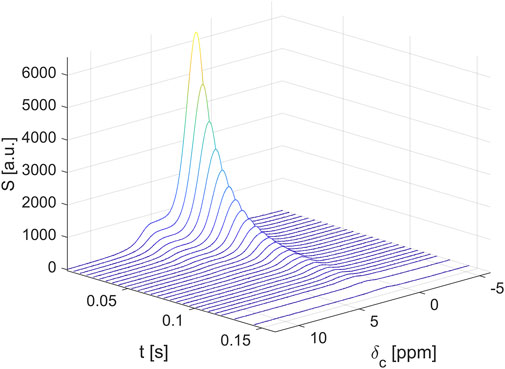
FIGURE 2. The spectrally resolved transverse relaxation at 300 MHz on a hazelnut-based spread shows a continuous decay independent of the chemical shift, apart from the significant line broadening.
The normalized signal attenuation SS0−1 of the designed regions (unitless) was plotted as a function of n·τe, showing the magnetization decays (Figure 3). The signal decays of the three integration areas show identical time dependence within the experimental error and are discussed in more detail in Section 3.1.
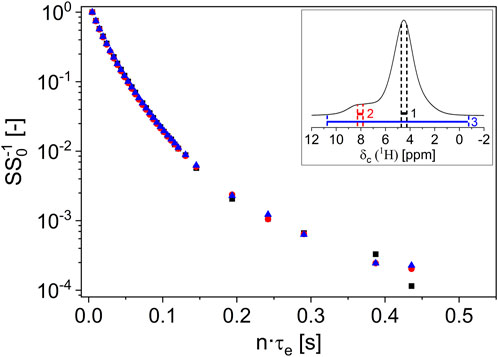
FIGURE 3. The normalized transverse signal decays at 300 MHz of the two broad main signal regions 1 (inset, black region) and 2 (inset, red region) on a hazelnut-based spread show identical transverse relaxation behavior down to the noise level. An integral (inset, blue region) measurement of the transverse relaxation is, therefore, appropriate. The curvature of magnetization in the semi-log graph indicates a distribution of relaxation rates.
As the decays are independent of the chemical shift, the signal can be measured integrally without loss of information as it is usually done in TD-NMR. The echo maxima S were recorded as an average over a few data points for each echo as a function of n·τe (Figure 1). These TD-NMR 1H relaxation curves were normalized to the signal amplitude of the first echo S0 and analyzed via fits of Eqs 1, 2 using Origin software, version 2021 (OriginLab Corporation, Northampton, United States), using the Levenberg–Marquardt algorithm. The coefficient of determination R2 was always larger than 99%.
Nut spreads and raw oils and fats cannot be regarded as “simple” spin systems, which is already evident from their chemical composition and additionally motivated by the state of aggregation of the components. Thus, magnetization decays differ from a mono-exponential decay function which would be expected for liquid and often diluted small molecules. To extract interesting material parameters, the measured decays were further condensed by modeling the decays with gamma distributions (Förster et al., 2017), which allows the extraction of the mean value and the distribution width of the transverse relaxation rates. The mean transverse relaxation rate <R2> and the associated distribution width σ were derived from the NMR raw data, according to the following equation:
A bimodal distribution is required to describe numerically well the magnetization decays of fats and multicomponent blends such as hazelnut-based spreads at temperatures below the melting temperatures T < TM:
The amplitudes Ai and the relaxation parameters <R2,i> and σi were determined by non-linear least squares fits. The fit parameters provide detailed insights into the relaxation behavior of the spreads and will be discussed in the context of quality control and fraud detection.
2.4 Statistical validity
In quality control, the meaningfulness of sample preparation, raw data, and processing errors need to be known to be able to grade an analytical tool. The repeatability of a typical TD-CPMG measurement was, therefore, measured by investigating a single nut spread under worst-case conditions, i.e., measurements at room temperature, on a sample containing PO, taking 10 measurements on the same sample tube to detect the error of the instrument (case A). In addition, the sampling error was investigated by filling and measuring 10 independently prepared samples of the same nut spread (case B).
The mean value of the measured data points (Figure 4) and the standard deviations of each data point in a low-field CPMG were deduced for cases A and B. The sample temperature was room temperature, which is a worst-case scenario: The permanent magnet was thermostated at 308 K with a potential impact on the sample temperature, which should be constant at 293 K. A probe was used which compensates this effect of temperature gradient at least partially; this high-temperature probe allows for measurements in the temperature range [173, 473] K as it is equipped with a vacuum-isolated glass dewar with the drawback that the radio frequency coil is much larger in diameter than the optimum diameter at approximately 12 mm for a 10-mm sample. The sensitivity of this probe is, therefore, lower than that of a non-thermostated probe. The vendor specification of a reproducibility of 5% of an NMR signal is met over the complete time scale of the CPMG measurement (Figure 4, case A); the observed values are significantly smaller than the specification. For case A, the statistical error in the time range n·τe > 1 s is less than 1%, measured as the absolute standard deviation of the raw signal; it amounts to a maximum of 2% measured as the relative error for n·τe < 1 s. For the reproducibility of sampling (case B), the errors are similar; the relative error for n·τe < 1 s amounted to 4%. Sample preparation induces, therefore, an additional error, as expected. In addition, the errors induced by data processing were quantified for both cases. As expected, modeling leads to additional statistical and systematic errors (Table 4). The mean relaxation rates show a relative error of the standard deviations of 4% (<R2,1>) and 5% (<R2,2>), while the relative error of the amplitudes is approximately 4% (A1) and 10% (A2) for case A. For case B, the relative errors are slightly larger.
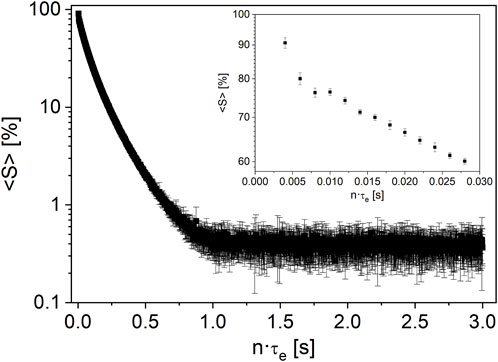
FIGURE 4. Mean measured signal <S> in a repeated CPMG experiment at 20 MHz on a nut spread at room temperature. The error bars indicate the calculated standard deviation of each measured echo over 10 repetitions. The noise level scatters by less than 1% absolute; the first echoes with the largest signal intensity in the inset show an absolute scatter below 2%.
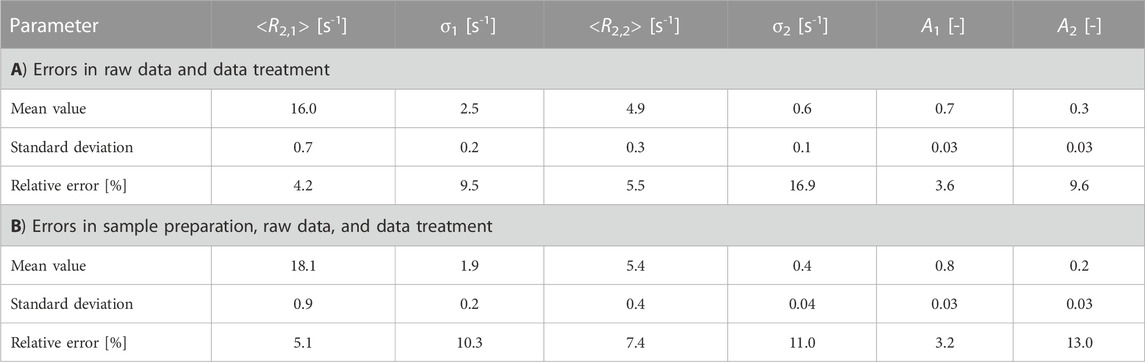
TABLE 4. Reproducibility of the measured NMR parameters deduced from CPMG measurements at 20 MHz on nut spreads. The model used was the bimodal gamma distribution model, leading to the mean relaxation rates, the width of the distributions, and their amplitudes. Ten NMR measurements were performed on the same sample to determine the measurement error of the instrument (case A). To determine the additional error introduced by sample preparation, 10 samples of the same nut spread were prepared and measured (case B). Different nut spreads were used for cases A and B, and the absolute values, therefore, differ slightly.
3 Results and discussion
3.1 1H transverse relaxation of hazelnut-based spreads at 300 MHz
The 1H magnetization decays were measured at 300 MHz (Figure 3). This NMR spectrometer has a good magnet homogeneity, which allows measuring 1H spectra with a good line width, i.e., the spectra are spectrally resolved, in contrast to TD-NMR at 20 MHz discussed below in Section 3.2. The magnetization decays were analyzed for the two broad signals, which are superpositions of the NMR signals of different functional groups. It should be noted that the lines are broad, indicating significant homonuclear dipolar couplings, thus obscuring the chemical information. Molecular dynamics averages this dominant spin–spin interaction only partially and is exploited to get access to the quality of the hazelnut-based spreads. A deduction of chemical composition from these 1H NMR spectra is hardly possible; dilution in an adequate solvent like deuterated chloroform would be needed. Nevertheless, the mean transverse relaxation rates and the corresponding distribution widths can be obtained. Modeling with a bimodal gamma distribution results in two mean relaxation rates <R2,1> and <R2,2>, their distribution widths σ1 and σ2, and amplitudes A1 and A2, which are almost identical and independent of the chemical shift. The analysis of the marked ranges results in identical signal amplitudes within the experimental error. The transverse relaxation depends on the Larmor frequency which is modeled, for example, in the BPP theory (Bloembergen et al., 1948), while the dominant contribution is that of correlation times near the field-independent inverse line width. This circumstance and the above-discussed observations pave the way for TD-NMR. The mq20 low-field instrument, which is suitable and well-established in quality control, can be used to measure the integral transverse relaxation. This is justified by the analysis of the 300-MHz transverse relaxation measurements and leads to significantly reduced measurement times (Table 3).
3.2 1H transverse relaxation of fat and oil reference samples at 20 MHz (TD-NMR)
Transverse relaxation is clearly different for liquid and solid phases of fats, as utilized already in solid fat content (SFC) measurements (Bosin and Marmor, 1968; Mansfield, 1971; Van Putte and Van den Enden, 1974; IUPAC (International Union of Pure and Applied Chemistry, Commission on Oils, Fats and Derivatives), 1987; International Organization for Standardization ISO 8292, 1991; AOCS Official Methods Cd 16-81, 1993; AOCS Official Methods Cd 16b-93, 1997; Marangoni et al., 2000). Thus, it is possible to distinguish the reference samples contained in spreads, such as the liquid oils HNO, SFO, and RO, from the solid fats PO and CB at room temperature. In addition, the solid–liquid phase transitions of PO and CB can be detected, as shown in the example of the normalized transverse signal decays of CB and PO, measured in the temperature range T ϵ [298, 373] K (Figure 5).
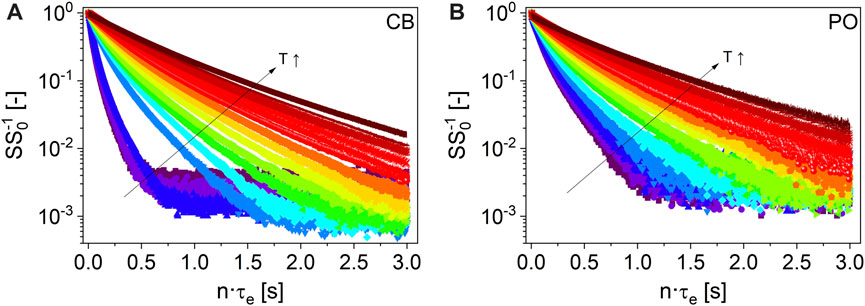
FIGURE 5. Normalized 1H-CPMG magnetization decays (τe = 2 ms, TD-NMR, 20 MHz) of CB (A) and PO (B) for T ϵ [298, 373] K: 298 K (
 ), 308 K (
 ), 313 K
  ), 318 K (
 ), 323 K (
 ), 328 K (
 ), 333 K (
 ), 338 K (
 ), 343 K (
 ), 348 K (
 ), 353 K (
 ), 358 K (
 ), 363 K (
 ), 368 K (
 ), and 373 K (
 ). Please note the step in the relaxation decay of CB between 308 K and 313 K compared to PO, indicating melting at lower temperatures.
The transverse signal decays cannot be described in a physically meaningful way with a monomodal gamma distribution at T < TM, in contrast to HNO, SFO, and RO. TM, here defined as the melting temperature, must be known for the fats and the spreads as it shows up in the CPMG measurements. The definition within this paper is as follows: to determine TM, all data were modeled with a bimodal gamma distribution over the complete temperature range. Subsequently, the amplitude fractions of the two distributions are compared to quantify the temperature transition range characterized by TM, above which the data are better described by a monomodal gamma distribution, neglecting a small magnetization fraction in the range of 2% (Figure 6). TM is, thus, defined as the cross-over point of the two amplitudes A1 and A2 in this approach.
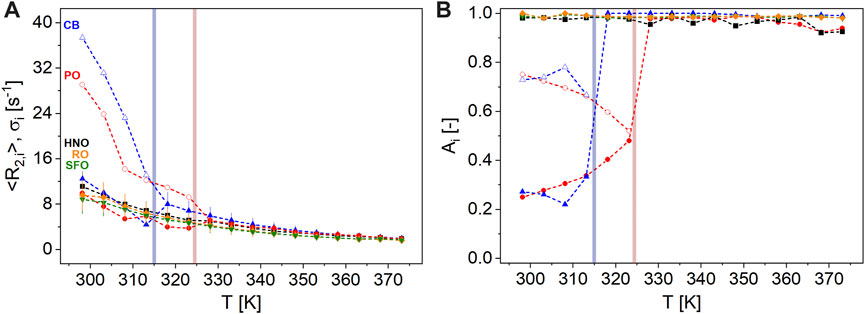
FIGURE 6. Parameters of transverse relaxation measured on the reference samples HNO ( ), RO (
 ), SFO (
 ), PO (
 ), and CB (
 ) as a function of T ϵ [298, 373] K at 20 MHz: (A) <R2,1> ϵ [9, 37] s-1 (unfilled symbols) and <R2,2> ϵ [2, 12] s-1 (filled symbols) with σ1 and σ2 as error bars, respectively. (B) A1 (unfilled symbols) is in the range [0, 78] %, while A2 = 1-A1 (filled symbols) dominates in the liquid state. <R2,1> of both PO and CB are larger than <R2> of the vegetable oils HNO, RO, and SFO at T < TM. The phase transitions between solid and liquid phases (colored regions) of CB (blue) and PO (red) were deduced from transverse magnetization decays.
This approach differs from SFC determination. For the direct SFC determination, the signal amplitude A of an FID is recorded at approximately 10 µs, directly after the probe’s dead time of approximately 6 µs, and 70 µs. This leads to the amplitude of the solid AS = A (10 µs)–A (70 µs), while A (70 µs) = AL is the amplitude of the liquid oil fraction. The corrected ratio of these amplitudes is SFC. SFC is temperature-dependent and already allowed the detection of crystal morphologies of CB and similar fats in combination with well-defined tempering schemes (Petersson et al., 1985; van Duynhoven et al., 2002). With echo times of 1.2 ms and 2 ms (Table 3), the solid fractions in the sense of SFC are not detected in the current approach of exploring CPMG decays. The approach in this study leads, therefore, to different ranges of melting temperatures and reflects changes in molecular dynamics of the liquid part of SFC (Petersson et al., 1985). In addition, we observed only the melting of the samples without tempering them along a protocol. All samples were, however, stored at room temperature for weeks before the measurements.
The mean relaxation rates of the faster relaxing components <R2,1> ϵ [9, 37] s-1 with a larger fraction A1 ϵ [0.52, 0.78] of both solid fats CB and PO are considerably larger than the mean relaxation rates <R2> ϵ [2, 11] s-1 of HNO, SFO, and RO for T < TM. The mean relaxation rates of the slower relaxing components <R2,2> ϵ [2, 12] s-1 instead are in a similar order of magnitude, indicating the wide spread of molecular fluctuation time scales in these fats. <R2,1> of CB and PO could possibly represent the high-melting triglycerides (e.g., 1,3-dipalmitoyl-2-oleoylglycerol (POP)), whereas <R2,2> could be assigned to the low-melting triglycerides (e.g., 1,3-dioleoyl-2-palmitoyl glycerol (POO)) in both fats (Müller, 2020; Ghazani and Marangoni, 2021).
HNO, SFO, and RO mainly have a high content of unsaturated fatty acids, i.e., lipophilic molecules in the liquid form at room temperature. The intramolecular, specifically homonuclear dipolar, interactions are time-averaged, leading to long magnetization decays and relatively low relaxation rates in the CPMG experiments. The intrinsic mobility in these fat molecules is larger, i.e., the fluctuations are on a faster time scale than in the structured solids CB and PO in the temperature range observed. At T = 298 K, CB and PO, both known for their polymorphism, consist of both “liquid” and “solid” triglycerides on the time scale of R2. In contrast to HNO, SFO, and RO, the polymorphic crystalline structures in CB and PO influence intrinsic mobility and thus cause faster 1H transverse relaxation. Thus, <R2> of HNO, SFO, and RO is smaller than <R2,1> of CB and PO for T < TM. In contrast, <R2,2> of CB and PO reflects mobile fractions or functional groups, which relax on a time scale similar to HNO, SFO, and RO. As temperature increases, <R2,i> decreases, and the amplitude proportions of faster and slower relaxing components in CB and PO, reflecting temperature-dependent melting, change.
<R2,1> = 37 s-1 of CB is larger than <R2,1> = 29 s-1 of PO at T = 298 K. <R2,1> decreases steadily with temperature for CB, whereas the decrease in <R2,1> of PO, reflecting the transition from a solid to a liquid phase, is observed over a wider temperature range. Thus, melting as monitored by TD-NMR CPMG is determined for CB at TM = 314 K, for PO at TM = 324 K. This reflects the multiscale properties of fats and is consistent with other studies, for example, Sonwai et al. (2014), Nikolaeva et al. (2018), and Nikolaeva et al. (2019) and references therein. At T > TM, i.e., in the liquid state, transverse relaxation occurs on a similar time scale for all measured reference samples. Due to the different characteristics of triglyceride compositions of CB and PO, the fats do not have well-defined melting temperatures but melting temperature ranges which are additionally strongly influenced by the polymorphism of the respective fat crystals (Garti and Sato, 2001; Chong et al., 2007). Different triglycerides of PO with their respective different melting ranges allow diverse fractions to be obtained from PO (Omar et al., 2015; Yılmaz and Ağagündüz, 2022). The two best-known products of fractionation are palm olein and palm stearin. Fractionation allows one to separate oils or fats with different physical properties and mix them in specific ratios to produce products such as nut spreads with defined phase transition ranges. For example, a higher proportion of palm stearin can give the product a higher TM = 325 K (Hubbes et al., 2020). In addition, the time scales of tempering and of observation, i.e., the analytical method, need to be considered when defining a solid–liquid phase transition.
3.3 1H transverse relaxation of hazelnut-based spreads at 20 MHz (TD-NMR)
Hazelnut-based spreads can be classified into spreads with CB or with PO when considering fat composition, as indicated on the packaging. The measurements on two representative nut spreads with CB (sample a, Table 1) and PO (sample l, Table 1) result in the temperature dependence of transverse relaxation shown in Figure 7. The low-temperature magnetization decays need to be modeled by bimodal gamma distributions, while at T > 330 K, similar behavior is observed, as for the reference samples CB and PO (Figure 7). This similarity led to the conclusion that the melting of these two fats is mainly observed as changes in magnetization decays when measuring CPMG on the spreads as a function of temperature in the range [298, 373] K. Monomodal distributions describe the data sufficiently for T > TM, and the cross-points of the amplitudes can be defined according to the previous definition. This leads to TM = 317 K in the case of sample a and to TM = 327 K for sample l.
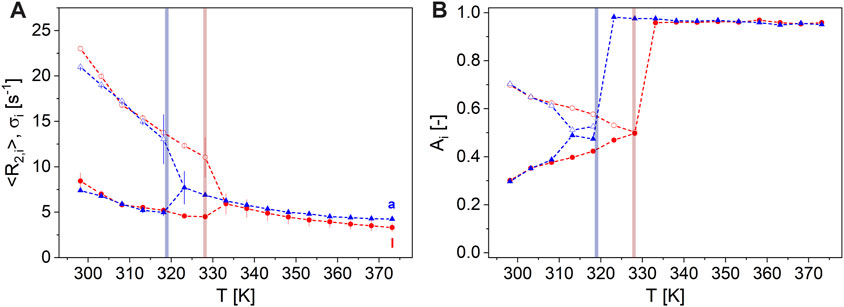
FIGURE 7. Magnetization decays at 20 MHz of two exemplary spreads were modeled by monomodal gamma distributions for large T, whereas at lower T, the bimodal description was appropriate. (A) The fast relaxing component is given by the mean value of distributions <R2,1> ϵ [11, 24] s-1 (unfilled symbols) and the slower component by <R2,2> ϵ [3, 11] s-1 (filled symbols) with σ1 and σ2 as the corresponding distribution widths (error bars). (B) A1 (unfilled symbols) in the range [0, 70] % and A2 = 1-A1 (filled symbols) of the nut spread samples a ( ) and l (
 ) as a function of T ϵ [298, 373] K. The colored regions indicate the temperatures where the spreads appear as molten, as measured by <R2,i>. The spread with PO (sample l, TM = 327 K) can easily be distinguished from the spread with CB (sample a, TM = 317 K) not only by the melting temperature range but also especially by the temperature dependence of <R2>.
This difference is explored in the following for other commercially available nut spreads to prove the reliability of the approach and to get an estimate of the span of the values within the two classes of hazelnut-based spreads: Eleven hazelnut-based spreads with CB are compared to nine samples with PO, regarding their transverse relaxation behavior (Figure 8). When collecting the samples, special emphasis was placed on the maximal variation of ingredients and of origin to sense the span width of transverse relaxation of commercially available hazelnut-based spreads.
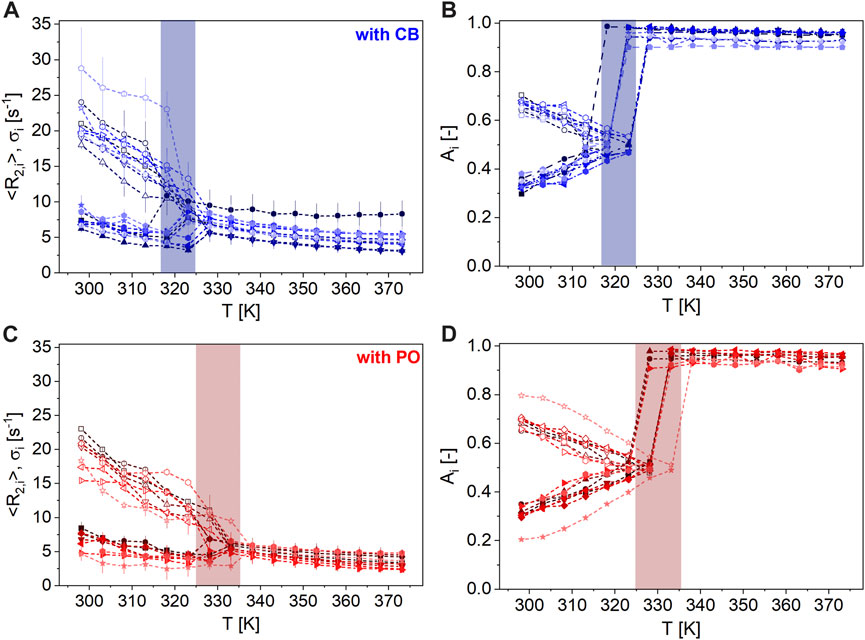
FIGURE 8. (A + C) <R2,1> ϵ [7, 29] s-1 (unfilled symbols) and <R2,2> ϵ [2, 10] s-1 (filled symbols) with σ1 and σ2 (error bars), respectively, (B + D) A1 (unfilled symbols) in the range [0, 80] % and A2 = 1-A1 (filled symbols) of the nut spreads with CB (top, blue: sample a ( ), b (
 ), c (
 ), d (
 ), e (
 ), f (
 ), g (
 ), h (
 ), i (
 ), j (
 ), and k (
 ); Table 1) and with PO (bottom, red: sample l (
 ), m (
 ), n (
 ), o (
 ), p (
 ), q (
 ), r (
 ), s (
 ), and t (
 ); Table 1) as a function of T ϵ [298, 373] K at 20 MHz. The colored regions indicate the temperature range where all nut spreads with CB (blue, TM ϵ [317, 325] K) and PO (red, TM ϵ [325, 336] K) appear as molten, as deduced from transverse magnetization decays. Nut spreads with CB have a larger dispersion of <R2,i> ϵ [3, 29] s-1 compared to PO.
At T < TM, bimodal distributions describe the measured magnetization decays numerically very well, while above TM, a monomodal distribution leads to relaxation rates in the order of the reference oils. Spreads with CB show a pronounced decrease in <R2,1> in the temperature range TM ϵ [317, 325] K, whereas spreads with PO show a decrease at higher temperatures TM ϵ [325, 336] K. Common to all of them is that TM values of spreads are larger than those of the reference samples, which is attributed to the presence of solid components and the composition detailed in Table 1.
Since spreads are multicomponent systems (Table 1), the observation is in line with findings on other materials and is caused by interactions between different ingredients, leading to changes in the microscopic structure, which affect R2. The critical temperature range marked in Figure 8 depends on the fat type and content, sugar content, and other ingredients, especially solid particles like fibers, crunchies, and pieces of chocolate. The higher TM value of spreads containing PO is in line with the finding on PO. Furthermore, the scatter in TM of different nut spreads can be attributed to different triglyceride compositions by fractionation; a wider TM range is, therefore, expected.
A larger dispersion of the relaxation values <R2,i> ϵ [3, 29] s-1 was measured for nut spreads with CB. It is possible that the faster <R2,i> is related to a higher content of solid components contained therein, such as dried rice syrup or dietary fiber, or a low addition of clarified butter, for example, spread j. The hazelnut-based spreads containing PO show a larger span-width in the amplitudes, which is mainly due to sample t with a white–brown pattern in the spread. This indicates that the coloring agent defatted cocoa powder also plays a major role in transverse relaxation at T < TM. Despite large recipe variations, it, nevertheless, is possible to distinguish spreads with PO or CB via transverse relaxation with TD-NMR. As a supplement to Figure 8, Table 5 shows the mean values (M), standard deviations (SD), and minimum (Min) and maximum (Max) values of the respective parameters of the data analysis as a function of temperature.
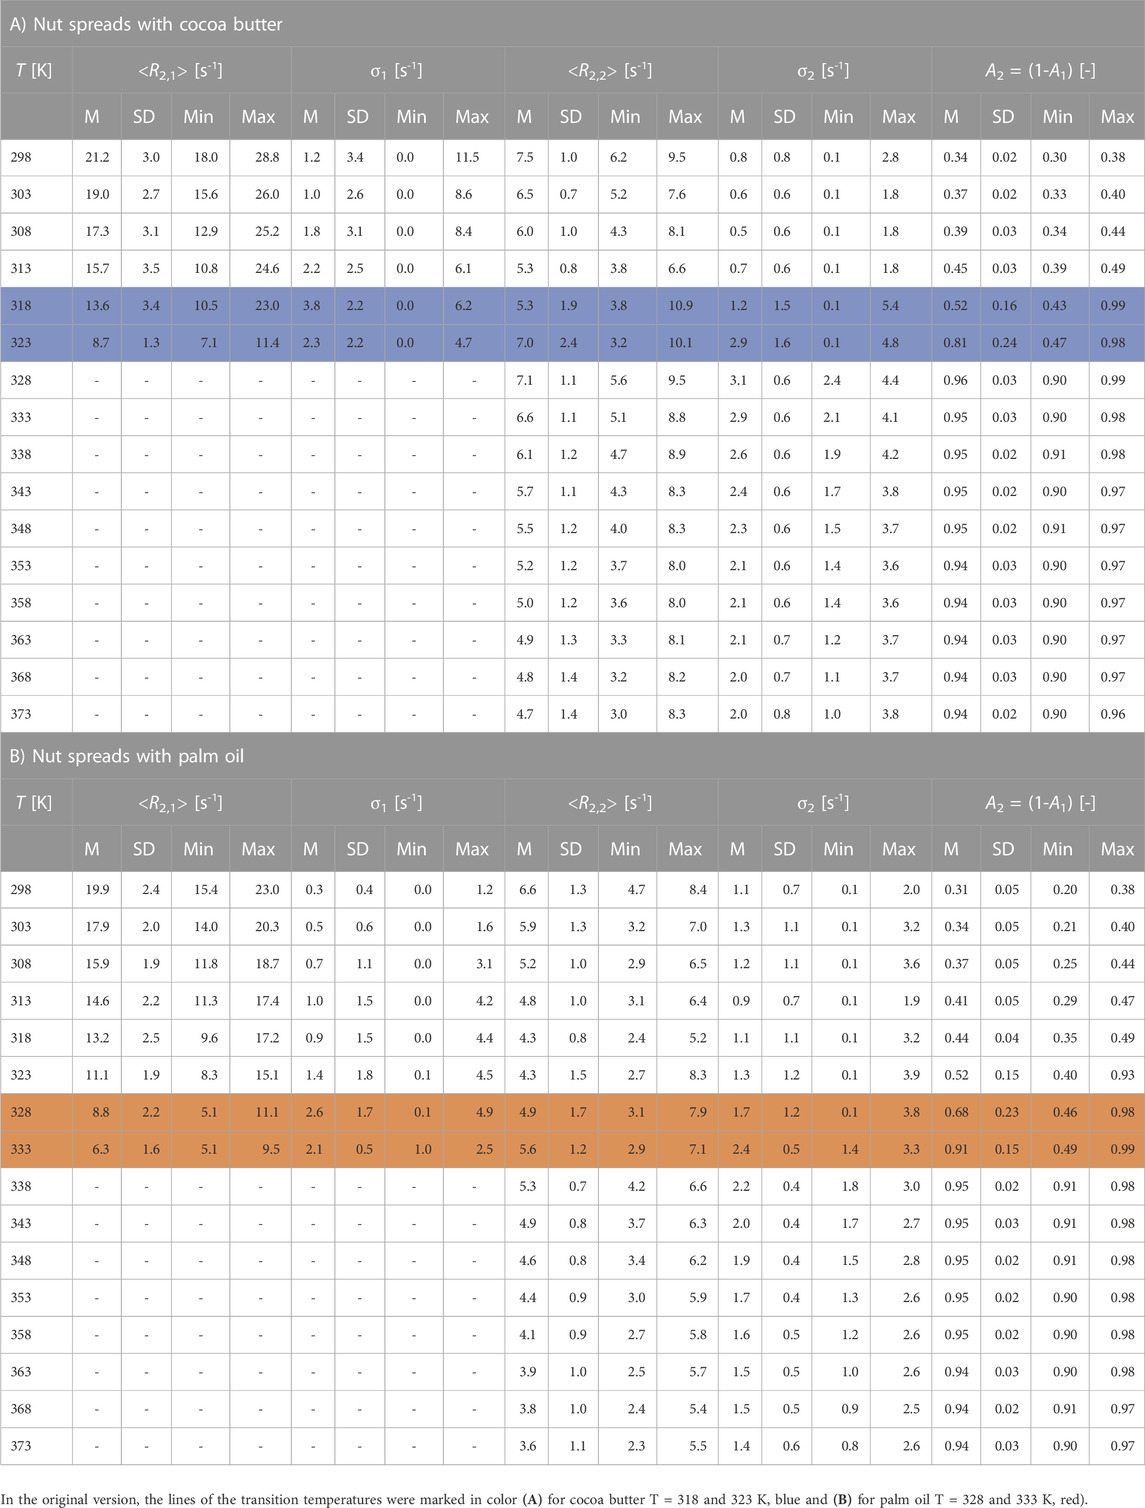
TABLE 5. Mean values (M), standard deviations (SD), and minimum (Min) and maximum (Max) values of the mean relaxation rates <R2,i>, and the corresponding distribution widths σi and amplitudes Ai as a function of temperature T for the nut spreads with cocoa butter (A) and with palm oil (B). Melting ranges are TM ϵ [317, 325] K for nut spreads with cocoa butter and TM ϵ [325, 336] K for nut spreads with palm oil and are marked in color.
The difference in the transverse relaxation behavior as a function of T provides the basis for an SOP to characterize hazelnut-based spreads in the sense of quality control and to detect frauds:
1) Sensitive low-field NMR spectrometer capable of 1H multi-echo detection in a temperature range T ϵ [253, 353] K, preferentially equipped with a 10-mm probe and a cylindrical sensitive region of 10 mm height.
2) Sample preparation: Conventional 10-mm glass tubes are filled with the spread up to a filling level of 10 mm for defined rf-pulse properties and decently homogeneous temperature within the sample volume. To avoid smearing over the whole NMR tube, two approaches can be used: one approach is applied where the spread is extracted from the package using a plastic or metal tube with an outer diameter smaller than the inner diameter of the NMR tube. The spread is pulled out into the NMR tube by either pressurized air or mechanically by a stamp fitting into the plastic or metal tube. The alternative is to use a dedicated cylindrical vial with an outer diameter of <10 mm and a height of <20 mm. The small sample-containing vial is placed into the NMR instrument with a dedicated holder, preferentially equipped with a thread for a stable connection to the vial and made of a material with low heat capacity and small diameter for minimal temperature gradients.
3) The sample is placed into the instrument. The sample chamber is at the lowest temperature when starting the analysis. The sample is kept for a minimum of 10 min at that temperature in the NMR instrument, the NMR pulse sequence parameters and the matching of the NMR probe are checked, and finally, the measurement is determined.
4) Data processing needs to be done with either the inverse Laplace transform or with a mathematic analytical distribution model as the preferred gamma model described above.
5) T-dependent measurements are performed, and the relaxation rates are plotted, including the distribution width as a function of T. The steepest slope and change of the magnetization decays are deduced, and it is compared with values of known hazelnut-based spreads according to the procedure described above.
6) The thus determined melting temperature allows the classification of the measured spread as mainly based on CB (TM < 325 K) and PO (TM > 325 K).
The method was found to work reliably for commercially available hazelnut-based spreads. Deviations occur and are expected for spreads containing other oils and fats and of drastically different compositions. For example, almond-containing spreads show a different melting behavior and need, therefore, a separate treatment.
4 Conclusion
Transverse relaxation was measured by TD-NMR, which was justified by comparative measurements on a 300 MHz NMR with a spectral resolution revealing unique relaxation over the chemical shift range. TD-NMR, thereby, has the advantages of being relatively simple and comparable low costs in investment and maintenance, which makes a dedicated application suitable for industrial application in quality control and fraud detection.
Cocoa butter and palm oil can be distinguished by transverse relaxation, even in more complex recipes of spreads containing solid fractions or inhomogeneously distributed defatted cocoa powder. Care should be taken regarding the choice of temperatures that need to be scanned to obtain a reliable evaluation of the spread under investigation.
From the scientific point of view, the results show that the main components which cause the steep change in relaxation as a function of temperature are the two named fats, while the other ingredients are not neglectable but determine the span-width, especially in the temperature range below the melting temperature range. Further investigation will consider the impact of palm oil fractionation and of other oils, almonds, or peanuts, which were excluded in the present study.
Author’s note
The responsibility for the content of this publication lies with the authors.
Data availability statement
The raw data supporting the conclusion of this article will be made available by the authors, without undue reservation.
Author contributions
LT: conceptualization, data curation, formal analysis, investigation, methodology, project administration, software, supervision, validation, visualization, writing–original draft, and writing–review and editing. SK: data curation, investigation, and writing–review and editing. HS: writing–review and editing. HN: funding acquisition, resources, and writing–review and editing. GG: conceptualization, data curation, formal analysis, funding acquisition, investigation, methodology, project administration, resources, software, supervision, validation, visualization, writing–original draft, and writing–review and editing.
Funding
The authors declare that financial support was received for the research, authorship, and/or publication of this article. This research was funded by the German Federal Ministry of Economic Affairs and Climate Action (BMWK) through the program to promote collective industrial research (IGF) with the German Federation of Industrial Research Association (AiF), IGF-Nr. 21785 N. The Deutsche Forschungsgemeinschaft (DFG) is acknowledged for the substantial financial contribution in form of NMR instrumentation and within the instrumental facility Pro2NMR.
Acknowledgments
The authors thank the German Federation of Industrial Research Association (AiF) and the Deutsche Forschungsgemeinschaft (DFG) for financial support.
Conflict of interest
The authors declare that the research was conducted in the absence of any commercial or financial relationships that could be construed as a potential conflict of interest.
Publisher’s note
All claims expressed in this article are solely those of the authors and do not necessarily represent those of their affiliated organizations, or those of the publisher, the editors, and the reviewers. Any product that may be evaluated in this article, or claim that may be made by its manufacturer, is not guaranteed or endorsed by the publisher.
References
AOCS Official Methods Cd 16-81 (1993). Solid fat content (SFC) by low-resolution nuclear magnetic resonance, indirect and direct methods.
AOCS Official Methods Cd 16b-93 (1997). Solid fat content (SFC) by low-resolution nuclear magnetic resonance, indirect and direct methods.
Aydemir, O. (2019). Utilization of different oils and fats in cocoa hazelnut cream production. J. Food Process. Preserv. 43 (5), e13930. doi:10.1111/jfpp.13930
Bloembergen, N., Purcell, E. M., and Pound, R. V. (1948). Relaxation effects in nuclear magnetic resonance absorption. Phys. Rev. 73 (7), 679–712. doi:10.1103/physrev.73.679
Blümich, B. (2019). Low-field and benchtop NMR. J. Magnetic Reson. 306, 27–35. doi:10.1016/j.jmr.2019.07.030
Bosin, W. A., and Marmor, R. A. (1968). The determination of the solids content of fats and oils by nuclear magnetic resonance. J. Am. Oil Chemists' Soc. 45 (5), 335–337. doi:10.1007/BF02667105
Chong, C. L., Kamarudin, Z., Lesieur, P., Marangoni, A., Bourgaux, C., and Ollivon, M. (2007). Thermal and structural behaviour of crude palm oil: crystallisation at very slow cooling rate. Eur. J. lipid Sci. Technol. 109 (4), 410–421. doi:10.1002/ejlt.200600249
Chowdhury, K., Banu, L. A., Khan, S., and Latif, A. (2007). Studies on the fatty acid composition of edible oil. Bangladesh J. Sci. Industrial Res. 42 (3), 311–316. doi:10.3329/bjsir.v42i3.669
Cordella, C., Moussa, I., Martel, A.-C., Sbirrazzuoli, N., and Lizzani-Cuvelier, L. (2002). Recent developments in food characterization and adulteration detection: technique-oriented perspectives. J. Agric. food Chem. 50 (7), 1751–1764. doi:10.1021/jf011096z
Crews, C., Hough, P., Godward, J., Brereton, P., Lees, M., Guiet, S., et al. (2005). Study of the main constituents of some authentic hazelnut oils. J. Agric. food Chem. 53 (12), 4843–4852. doi:10.1021/jf047836w
Díaz, M. F., Gavín Sazatornil, J. A., Ledea, O., Hernández, F., Alaiz, M., and Garcés, R. (2005). Spectroscopic characterization of ozonated sunflower oil. Ozone Sci. Eng. 27 (3), 247–253. doi:10.1080/01919510590945822
Ezeanaka, M. C., Nsor-Atindana, J., and Zhang, M. (2019). Online low-field nuclear magnetic resonance (LF-NMR) and magnetic resonance imaging (MRI) for food quality optimization in food processing. Food Bioprocess Technol. 12, 1435–1451. doi:10.1007/s11947-019-02296-w
Förster, E., Nirschl, H., and Guthausen, G. (2017). NMR diffusion and relaxation for monitoring of degradation in motor oils. Appl. Magn. Reson. 48 (1), 51–65. doi:10.1007/s00723-016-0842-0
Garti, N., and Sato, K. (2001). Crystallization processes in fats and lipid systems. Boca Raton: CRC Press.
Ghazani, S. M., and Marangoni, A. G. (2021). Molecular origins of polymorphism in cocoa butter. Annu. Rev. Food Sci. Technol. 12, 567–590. doi:10.1146/annurev-food-070620-022551
Hills, B. P. (2006). “Applications of low-field NMR to food science,” in Annual reports on NMR spectroscopy. Editor G. A. Webb (Academic Press), 177–230.
Hubbes, S.-S., Braun, A., and Foerst, P. (2020). Crystallization kinetics and mechanical properties of nougat creme model fats. Food Biophys. 15 (1), 1–15. doi:10.1007/s11483-019-09596-w
International Organization for Standardization ISO 8292 (1991). Animal and vegetable fats and oils—determination of solid fat content—pulsed nuclear magnetic resonance method.
IUPAC (International Union of Pure and Applied Chemistry, Commission on Oils, Fats and Derivatives) 2.150 (1987). Solid content determination in fats by NMR (low resolution nuclear magnetic resonance).
Kovács, A., Körmendi, L., and Kerti, K. B. (2021). Palm oil substitution in hazelnut spread. Prog. Agric. Eng. Sci. 17, 111–117. doi:10.1556/446.2021.30013
Lewinska, A., Zebrowski, J., Duda, M., Gorka, A., and Wnuk, M. (2015). Fatty acid profile and biological activities of linseed and rapeseed oils. Molecules 20 (12), 22872–22880. doi:10.3390/molecules201219887
Mansfield, P. B. (1971). A new wide-line NMR analyzer and its use in determining the solid-liquid ratio in fat samples. J. Am. Oil Chemists' Soc. 48 (1), 4–6. doi:10.1007/BF02673231
Marangoni, A. G., Wright, A. J., Narine, S. S., and Lencki, R. W. (2000). Comment on the use of direct pulsed nuclear magnetic resonance solid fat content measurements in phase behavior studies of lipid mixtures. J. Am. Oil Chem. Soc. 77 (5), 565–567. doi:10.1007/s11746-000-0090-9
Marra, F., Lavorgna, A., Incarnato, L., Malvano, F., and Albanese, D. (2023). Optimization of hazelnut spread based on total or partial substitution of palm oil. Foods 12 (16), 3122. doi:10.3390/foods12163122
Meiboom, S., and Gill, D. (1958). Modified spin-echo method for measuring nuclear relaxation times. Rev. Sci. Instrum. 29 (8), 688–691. doi:10.1063/1.1716296
Meyer, K., Kern, S., Zientek, N., Guthausen, G., and Maiwald, M. (2016). Process control with compact NMR. TrAC Trends Anal. Chem. 83, 39–52. doi:10.1016/j.trac.2016.03.016
Müller, M. T. (2020). Einfluss freier Fettsäuren auf die kristallisationskinetischen und polymorphen Eigenschaften von Kakaobutter und-äquivalenten. Göttingen: Cuvillier Verlag.
Naik, B., and Kumar, V. (2014). Cocoa butter and its alternatives: a review. J. Bioresour. Eng. Technol. 1, 7–17.
Nikolaeva, T., den Adel, R., van der Sman, R., Martens, K. J. A., Van As, H., Voda, A., et al. (2019). Manipulation of recrystallization and network formation of oil-dispersed micronized fat crystals. Langmuir 35 (6), 2221–2229. doi:10.1021/acs.langmuir.8b03349
Nikolaeva, T., Den Adel, R., Velichko, E., Bouwman, W., Hermida-Merino, D., Van As, H., et al. (2018). Networks of micronized fat crystals grown under static conditions. Food & Funct. 9 (4), 2102–2111. doi:10.1039/C8FO00148K
Ogrinc, N., Košir, I. J., Spangenberg, J. E., and Kidrič, J. (2003). The application of NMR and MS methods for detection of adulteration of wine, fruit juices, and olive oil. A review. Anal. Bioanal. Chem. 376 (4), 424–430. doi:10.1007/s00216-003-1804-6
Omar, Z., Hishamuddin, E., Mat Sahri, M., Hazirah, S., Lida, N., Roddy Ramli, M., et al. (2015). Palm oil crystallisation: a review. J. Oil Palm Res. 27 (2), 97–106.
Petersson, B., Anjou, K., and Sandström, L. (1985). Pulsed NMR method for solid fat content determination in tempering fats, Part I: cocoa butters and equivalents. Fette, Seifen, Anstrichm. 87 (6), 225–230. doi:10.1002/lipi.19850870603
Principato, L., Carullo, D., Duserm Garrido, G., Bassani, A., Dordoni, R., and Spigno, G. (2022). Rheological and tribological characterization of different commercial hazelnut-based spreads. J. Texture Stud. 53 (2), 196–208. doi:10.1111/jtxs.12655
Santos, P. M., Kock, F. V. C., Santos, M. S., Lobo, C. M. S., Carvalho, A. S., and Colnago, L. A. (2017). Non-invasive detection of adulterated olive oil in full bottles using time-domain NMR relaxometry. J. Braz. Chem. Soc. 28, 385–390. doi:10.5935/0103-5053.20160188
Santos, P. M., Pereira, E. R., and Colnago, L. A. (2016). Detection and quantification of milk adulteration using time domain nuclear magnetic resonance (TD-NMR). Microchem. J. 124, 15–19. doi:10.1016/j.microc.2015.07.013
Siddiqui, A. J., Musharraf, S. G., Choudhary, M. I., and Rahman, A. U. (2017). Application of analytical methods in authentication and adulteration of honey. Food Chem. 217, 687–698. doi:10.1016/j.foodchem.2016.09.001
Sonwai, S., Kaphueakngam, P., and Flood, A. (2014). Blending of mango kernel fat and palm oil mid-fraction to obtain cocoa butter equivalent. J. food Sci. Technol. 51, 2357–2369. doi:10.1007/s13197-012-0808-7
Trapp, L., Schacht, H., Eymann, L., Nirschl, H., and Guthausen, G. (2023). Oil mobility in hazelnut oil-based oleogels investigated by NMR. Appl. Magn. Reson. 54, 1445–1462. doi:10.1007/s00723-023-01571-6
Ulberth, F., and Buchgraber, M. (2000). Authenticity of fats and oils. Eur. J. Lipid Sci. Technol. 102 (11), 687–694. doi:10.1002/1438-9312(200011)102:11<687::AID-EJLT687>3.0.CO;2-F
van Duynhoven, J., Dubourg, I., Goudappel, G. J., and Roijers, E. (2002). Determination of MG and TG phase composition by time-domain NMR. J. Am. Oil Chem. Soc. 79 (4), 383–388. doi:10.1007/s11746-002-0493-7
van Duynhoven, J., Voda, A., Witek, M., and Van As, H. (2010). Time-domain NMR applied to food products. Annu. Rep. NMR Spectrosc. 69, 145–197. doi:10.1016/S0066-4103(10)69003-5
Van Putte, K. P., and Van den Enden, J. (1974). Fully automated determination of solid fat content by pulsed NMR. J. Am. Oil Chem. Soc. 51 (7), 316–320. doi:10.1007/BF02633005
World Bank (2023). Monatlicher importpreis von Palmöl in europa von Januar 2014 bis september 2023 (in US-dollar pro tonne). Statista.
Keywords: 1H-NMR, R2-relaxation, TD-NMR, hazelnut-based spread, quality control, food fraud detection
Citation: Trapp L, Kafashian S, Schacht H, Nirschl H and Guthausen G (2024) Quality control of hazelnut-based spreads: 1H TD-NMR transverse relaxation. Front. Food. Sci. Technol. 3:1294332. doi: 10.3389/frfst.2023.1294332
Received: 14 September 2023; Accepted: 29 November 2023;
Published: 03 January 2024.
Edited by:
Warangkana Srichamnong, Mahidol University, ThailandReviewed by:
Consolatina Liguori, University of Salerno, ItalyLuiz Colnago, Embrapa Instrumentacao, Brazil
William S. Price, Western Sydney University, Australia
Copyright © 2024 Trapp, Kafashian, Schacht, Nirschl and Guthausen. This is an open-access article distributed under the terms of the Creative Commons Attribution License (CC BY). The use, distribution or reproduction in other forums is permitted, provided the original author(s) and the copyright owner(s) are credited and that the original publication in this journal is cited, in accordance with accepted academic practice. No use, distribution or reproduction is permitted which does not comply with these terms.
*Correspondence: Gisela Guthausen, Z2lzZWxhLmd1dGhhdXNlbkBraXQuZWR1