 Baris Ozel
 Berkay Berk
 Sirvan Sultan Uguz3
 Mecit Halil Oztop
- 1Department of Food Engineering, Middle East Technical University, Ankara, Türkiye
- 2Department of Food Engineering, Izmir Institute of Technology, Izmir, Türkiye
- 3Resonance Systems GmbH, Kirchheim, Germany
Hard candies produced from sucrose and doctoring agents such as glucose syrup (GS) and high fructose corn syrup (FS) have been investigated in terms of their final composition, glass transition temperature (Tg), degree of crystallinity, total soluble solids (TSS) content and water activity (aw). Time domain (TD) 1H NMR longitudinal relaxation time (T1) and second moment (M2) measurements have been used to understand the glassy state and crystallization characteristics for different hard candy formulations. The investigated candies include sucrose as the main sugar component. Different levels of doctoring agents have been mixed with sucrose to obtain products with different characteristics. It has been shown that addition of any doctoring agent to sucrose formulations decreases the Tg of the system significantly (p
1 Introduction
Hard candies are glassy confections prepared usually by mixing sweeteners such as sucrose and doctoring agents, mostly corn syrup (Lans et al., 2018). After mixing the components in the presence of additional water, the mixture is heated up to elevated temperatures for concentrating and then cooled down below Tg to reach the glassy state which provides some kinetic constraints (Hartel et al., 2011). Tg is an important parameter which determines the physical properties of hard candies. Below Tg, the amorphous solid portion of the semi-crystalline sample is defined as glassy state. This amorphous solid portion can also be transformed into a rubbery state above Tg (Tan and Kerr, 2017). In the glassy state, the molecular mobility is restricted and the product is considered stable at least for some time interval. However, glassy state is not a thermodynamically stable but a pseudo kinetically stable state (Sherwin and Labuza, 2006). Therefore, slow changes such as crystallization of sucrose can still take place in the hard candies even below their Tg making the control of the environmental conditions a necessity (Schugmann and Foerst, 2022). Nevertheless, controlling the environmental conditions such as relative humidity (RH) and temperature is not always easy. Thus, changes in the candy formulation can also be considered to produce more stable products especially to storage conditions. For this purpose, doctoring agents including corn syrups could be used in candy formulations (Lans et al., 2018). Such agents have substantial amounts of simple sugars that can incorporate between the sucrose molecules and interfere with the crystal lattice formation by sucrose molecules (McFetridge et al., 2004). In addition to simple sugars, higher MW sugars may also be present in doctoring agents to some extent and they may contribute to the restriction of the molecular mobility by increasing the viscosity of the system (Raudonus et al., 2000). Under such conditions, incorporation of sucrose molecules thus, crystallization within the hard candies becomes harder.
The physicochemical changes taking place in the glassy state of hard candies during storage are mostly undesirable since the resulting product would be unacceptable in terms of sensorial and textural properties (Hartel, 2002). Water migration and temperature difference are the two main reasons for hard candy deterioration during storage. If the RH of the surrounding air is higher than the water activity (aw) of the hard candy, the sample absorbs moisture (Torres et al., 2011). Water acts as a plasticizer and decreases the Tg below the storage temperature resulting in increased molecular mobility in the system (Roos, 2002). Depending on the candy characteristics, samples may become sticky or experience graining (sucrose crystallization) (Nowakowski and Hartel, 2002). If the candy formulation includes large amounts of glucose and fructose, the hygroscopic character of such sugars may induce extreme water absorption and a sticky product (Dinesh Kumar et al., 2021). In the case of high sucrose concentrations, lower levels of moisture may be absorbed by the product but the water in the candy would have higher mobility in the absence or low level of humectants. Consequently, sucrose would be able to use the free water to recrystallize. In such products, generally, graining is initially observed on the surface and crystallization continues into the interiors as the time passed (Netramai et al., 2018). These hard candies may not show stickiness but exert extreme graining lowering the sensorial and textural attributes. Therefore, a trade-off should be made between the stickiness and graining properties by controlling the storage conditions and more importantly hard candy formulations (Lans et al., 2018).
Doctoring agents also prevent or retard sucrose crystallization during the cooling period of the hard candy production primarily by increasing the viscosity of the system (Netramai et al., 2018). Additionally, GS and FS contain considerable amount of glucose and fructose in total. These sugars can both decrease the level of crystallization and increase the sweetness of the sample. They also act as humectants and reduce the risk of graining during storage (Nadaletti et al., 2011). Maltose is also present in GS and FS. It is also a relatively soluble sugar which is able to increase the system viscosity, retarding the crystallization process. The same effect can also be provided by the higher MW oligosaccharides present especially in GS (Ihli and Paterson, 2015).
The most critical phase in the hard candy production is the glass transition process. At Tg, products experience changes in various physicochemical and mechanical properties including viscosity, molecular mobility, specific heat capacity (cp), dielectric constant and hardness (Ergun et al., 2010). Understanding the glass transition process is critical since the main purpose of the cooling of boiled hard candy mixtures is to reach a widely frozen-in thermodynamic non-equilibrium glassy state in which most of the physicochemical changes are restricted (Roos, 2002). The glassy state must be provided for each candy formulation otherwise; the end of shelf life of the products would be unacceptably close (Ergun et al., 2010). One classical method for observing the glass transition process and detecting Tg is DSC. Despite its ability to detect Tg, DSC cannot be used to observe the degree of crystallinity and the crystal content of the glassy products due to the thermal decomposition of the confections before the melting point (Lee et al., 2011). The X-ray diffraction technique is also used for crystallinity measurements, but the biased interpretation of the peaks may induce errors in the obtained results. Furthermore, mixed systems such as hard candies may produce merged peaks that are difficult to distinguish from each other (Le Botlan et al., 1998). Fourier-transform Infrared Spectroscopy (FTIR) can also be considered for crystal content measurements but its limited range of applicability to moisture prevents the analysis of some samples (Nunes et al., 2005). Another alternative is microscopy but the sample should be transparent and have low density matrix which is not suitable for hard candy samples (Martins et al., 2005).
TD NMR, on the other hand, can estimate the crystal content and degree of crystallinity in a simple and fast manner (Hashemi et al., 2010). TD NMR is also frequently used as an official method for solid fat content (SFC) measurements (Teles Dos Santos et al., 2014). The free induction decay (FID) acquired after a single pulse and the subsequent proton relaxation data are used to distinguish solid and liquid fractions of a material (Günther, 2013). However, just applying FID results in loss of signal acquired by the solid fraction due to the ‘dead time’ phenomenon which is caused by the delay in the record of the signal by the receiver (Dejong and Hartel, 2016). Solids relax faster than liquids due to the closer proximity of the atoms in solid materials and some proportion of this initial signal cannot be detected by the hardware leading to erroneous solid to liquid fraction calculations (Grunin et al., 2019). In order to overcome this problem, some correction factors have been previously implemented but the requirement of calibration due to the moisture sensitivity of such factors limits the use of this approach (Kovrlija and Rondeau-Mouro, 2017). Alternatively, Magic Sandwich Echo (MSE) sequence (a modified solid echo (SE) sequence) has previously been implemented to exclude the ‘dead time’ problem since MSE provides refocusing during the relaxation decay. This method enables the detection of the larger part of the signal coming from the solid (crystalline) fraction and eliminates the multiparameter fitting of the ‘bead’ pattern FID signal. In this way, second moment (M2) can be calculated solely by the direct integration of the fast Fourier-transform of the MSE signal (Grunin et al., 2019). In addition to M2 measurements for the detection of degree of crystallinity of hard candies, longitudinal relaxation time (T1) can also be used to for the same purpose. T1 is calculated by applying inversion recovery (IR) or saturation recovery (SR) sequences and a subsequent relaxation spectrum analysis (Hashemi et al., 2010). Le Botlan et al. (1998) have used T1 to detect and quantify the crystallinity of different sugars.
In this study, we have analyzed the glass transition and crystallinity characteristics of different hard candy formulations. In addition to the final composition, Tg, TSS and aw calculations, TD NMR measurements have been performed to understand the physicochemical properties of the samples at glassy state. The addition of doctoring agents (GS and FS) to sucrose hard candies at different concentrations had substantial impacts on almost all parameters analyzed. The use of MSE sequence provided the acquisition of all solid signal from the sample and enabled us to monitor the degree of crystallinity of hard candy samples right after the production. TD NMR results showed that crystallinity of the hard candy formulations can be detected and analyzed by M2 and T1 measurements.
2 Materials and methods
2.1 Samples
In order to prepare hard candy samples; sucrose (Balküpü, Turkey), high fructose corn syrup (FS) (SMF 42 Sunar Glukoz Fruktoz Surubu, Sunar Mısır, Turkey), glucose syrup (GS) (SCG 60 Glukoz Şurubu, DE 57–64, Sunar Mısır, Turkey), and water were used. Syrups and sucrose were mixed up with the proportions indicated in Table 1. Additionally, 5 mL water was added to each 50 g sugar mixture in order to form a solution. Then, all samples were boiled up to 130°C in 140°C oil bath. Only 100% (w/w) sucrose candy (100_S) could not be heated up to 130°C due to crystallization; therefore, it was terminated when 121°C was reached. After reaching 130°C, samples were poured into molds then kept for cooling down to room temperature. Temperatures of the samples were constantly monitored in the oil bath. After cooling, samples were stored in sealed pans. Each sample was made three times for the respective measurements.
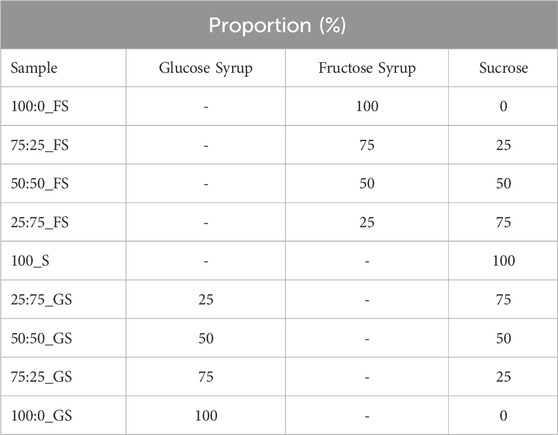
TABLE 1. Initial sugar and syrup contents of sample mixtures (hard candy formulations).
2.2 Sugar profile of syrups by high performance liquid chromatography
Syrup samples were weighed 1 g, and then mixed with 50 mL high performance liquid chromatography (HPLC) grade water (Milli-Q Water System, Millipore S.A., France) according to the procedure previously described in the reference study (Namlı, 2019). Then to hydrate completely, mixtures were stirred by vortex shaker for 5 min. After shaking, with 0.45 μm nylon filter, the solutions were filtered and introduced to HPLC vials. For the analysis, HPLC-RID (Shimadzu Scientific Instruments, Japan) instrument with auto-sampler (SIL-20A HT), degasser (DGU-20A5), pump (LC-20AD), column oven (CTO-20A) and refractive index detector (RID-20A) were used. As the column, the inertsil NH2 column (Shimadzu Scientific Instruments, Japan) (dimensions of 250 × 4.6, 5 μm) was used. Acetonitrile and water (80:20 v/v) mixture was used as the mobile phase during the chromatographical separation.
2.3 Water properties of hard candy formulations
2.3.1 Water content
Due to the low water content of hard candies, Karl-Fischer (KF) titration method was used for determination of water content (Fischer, 1935). The reaction occuring during titration is described by Equations 1, 2 as follows:
By the help of the electrical potential difference occurred in between I2/I− couple, the water content can be estimated stoichiometrically. As water that is in the titration chamber depletes, electrical potential gradient goes to a constant value. When the rate of change drops under the threshold determined as 50 μS, the reaction is ended, and water amount is calculated. The analysis was made by Karl Fischer Titrator (TitraLab KF1000 Series, HACH, UK) at 25°C with a 2 component system with three replicates.
2.3.2 Water activity
In addition to water content determination, aw of the samples were measured by using water activity analyzer (LabStart–aw, Novasina, Switzerland). The principle of the measurement is based on the equilibrium relative humidity (ERH) method (Subranamiam and Wareing, 2016).
2.4 Total soluble solids (TSS)
TSS values of the hard candies were measured by the refractive index method (HI 96801 Refractometer, HANNA Instruments, United States) (Yebra-Biurrun, 2005). Hard candy samples were melted first and then their TSS values were measured. Since hard candy melts are highly viscous materials, the moisture loss during melting was neglected.
2.5 Calculation of glass transition temperature
Tg values of the samples were calculated by using an empirical expression which reflects the compositional dependence. Normally, the Gordon–Taylor equation is used for the calculation of the Tg of binary mixtures (water and a single solute) (Gordon and Taylor, 1952). This equation shows the plasticizing effect of water on Tg. However, the Gordon–Taylor equation is not suitable for the current multicomponent systems like the ones used in this study. Therefore, a modification of the equation for the Tg calculation of polymer mixtures could be considered for the multicomponent hard candy systems. This equation provides a good fit to the experimental data at high sugar concentrations (>70% w/w). Since the hard candy samples used in this study has even higher sugar concentrations, the following Couchman–Karasz expansion equation (Eq. 3) was used for Tg calculations (Couchman and Karasz, 1978; Mayhew et al., 2017):
where wi,
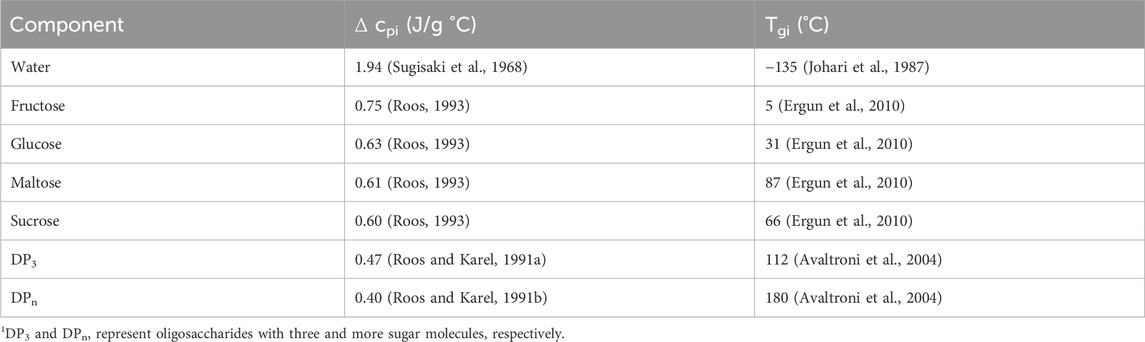
TABLE 2. Glass transition temperatures and specific heat capacity changes at glass transition of each component in the hard candy formulations.
2.6 Time domain nuclear magnetic resonance relaxometry
For the TD-NMR experiments, 0.5 T (20.34 MHz) low resolution NMR System (Spin Track, Resonance Systems GmbH, Kirchheim/Teck, Germany) having 10 mm radiofrequency (RF) coil was used. Mono- and multi-exponential fittings of the relaxation spectra and the calculation of the spectral line M2 values were performed by the Relax8 software package (Resonance Systems GmBH, Kirchheim, Germany).
2.6.1 Longitudinal relaxation time
An SR sequence having a relaxation period of 10 s and a delay time between 5–1,500 ms for 16 points was used with 4 scans to measure T1.
2.6.2 Second moment
M2 values were obtained by MSE sequence (see Figure 1) having 10 s repetition delay and 4 scans per each step of the cycling of phases ϕ1, ϕ2 and ϕ3 as described in a previous study (Grunin et al., 2019). The number of points that were used for FID was 512.
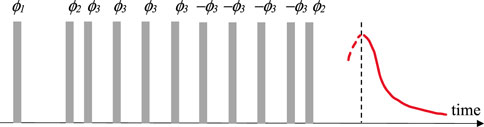
FIGURE 1. Representation of an MSE sequence.
2.7 Statistical analysis
For all experimental results, statistical analysis was performed by analysis of variance (ANOVA) with general linear model of the software Minitab (Minitab Inc., Coventry, United Kingdom). The results were compared with respect to Tukey’s comparison test having 95% confidence interval and at least three replicates were used. Additionally, the Pearson correlation (α ≤ 0.05) was used to find the correlation coefficients between the different parameters investigated.
3 Results and discussion
3.1 Composition of hard candies
The initial moisture content of a hard candy is important since water effects the glassy state characteristics (Borde et al., 2002). The composition of the freshly produced hard candies were calculated after determining their water content by KF titration. The composition of the hard candies are tabulated in Table 3. The initial moisture content of the candy formulations varied between 2.04%–7.08% (w/w). The moisture interval of hard candies is consistent with the literature findings that the initial moisture content of hard confections between 2% and 5% (w/w) (Ergun et al., 2010). Generally, formulations containing FS maintained a higher moisture content than the 100_S and GS including candies. However, the lowest moisture content (4.97% w/w) belongs to 100:0_FS candy among the samples having only FS in their formulations. This could be related to the difference in the viscosity of the FS and GS. GS contains a considerable amount of high molecular weight–long chain sugars (DP3, DPn) that would increase the system viscosity (Hartel, 2002). In contrast, FS is high in glucose and fructose content and contains almost no higher MW oligosaccharides. Therefore, 100:0_FS candy may have attained a lower viscosity, and this may have resulted in higher water loss during boiling of the mixture. This trend changed when sucrose is introduced into the candy formulations as shown in Table 3. The sample having only sucrose (100_S), had the lowest moisture content as expected since GS and FS contains some amount of water in their structures, 18% and 30% (w/w), respectively (Table 4). Images of developed hard candies were provided in Figure 2.
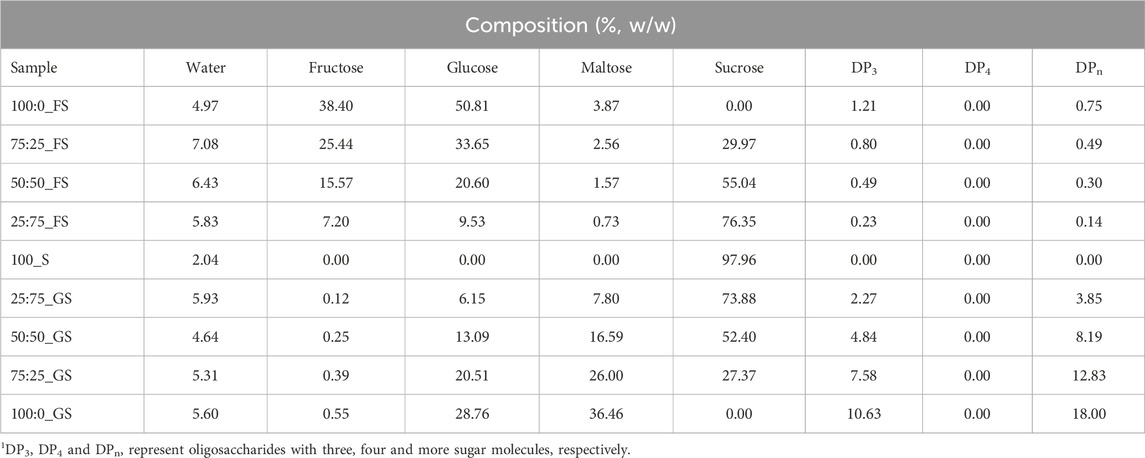
TABLE 3. Compositions of hard candies.
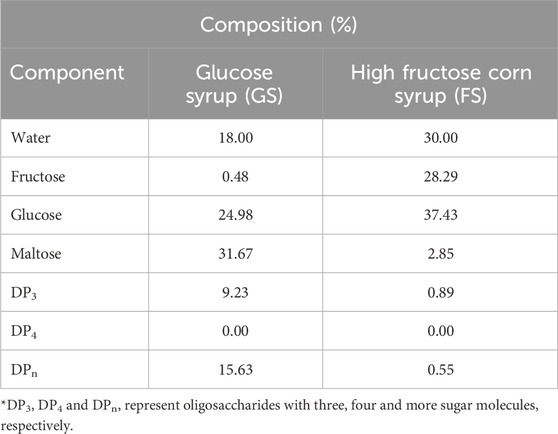
TABLE 4. Compositions of syrups.
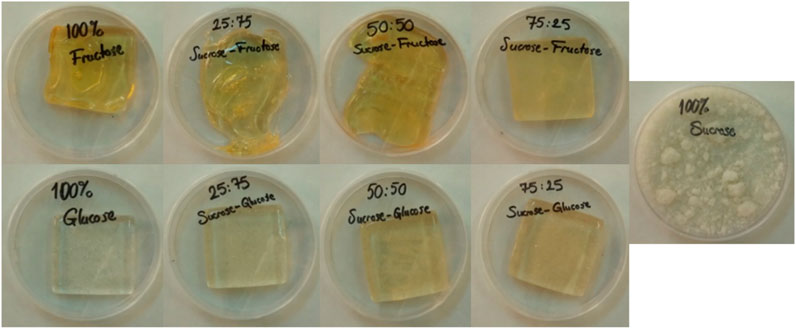
FIGURE 2. Images of developed hard candies.
3.2 Water activity, total soluble solids and glass transition temperature properties
3.2.1 Water activity
Understanding the aw and TSS properties of hard candy formulations is essential since these properties determine the quality and shelf life of the products (Ergun et al., 2010). As shown in Table 5, the highest aw belongs to 100_S (0.80) and addition of any doctoring agent significantly decreased (p
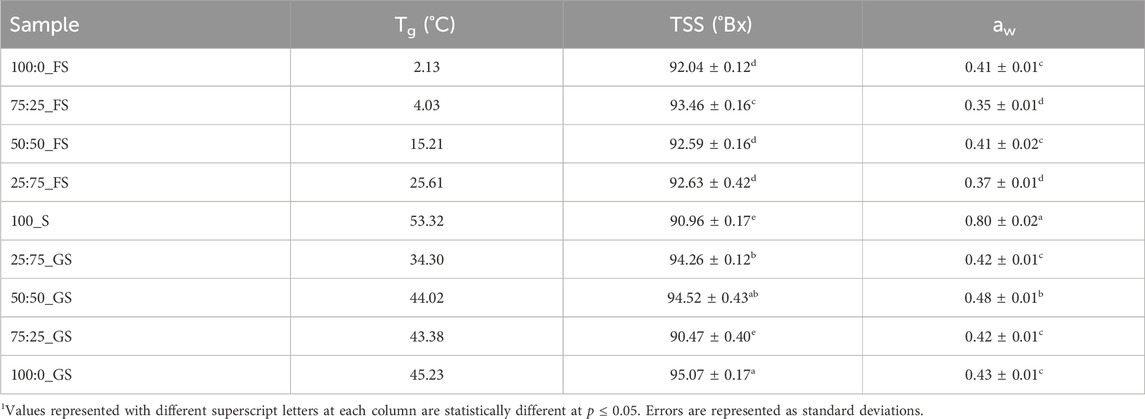
TABLE 5. Glass transition temperatures, total soluble solids and water activity values of hard candies.
3.2.2 Total soluble solids
Solubility characteristics of the sugars in the mixtures also affected the TSS of the hard candies (Zumbé et al., 2001). According to Table 5, addition of a doctoring agent increased the TSS of the candy formulations (p
3.2.3 Glass transition temperature
Another factor that needs to be considered is the Tg values of the hard candies. 100_S candies showed the highest Tg as 53.32°C whereas addition of FS or GS produced lower Tg values as demonstrated in Table 5. Without any doctoring agent, sucrose molecules were able to interact with each other to form a crystal lattice (McFetridge et al., 2004). As a result, 100_S candies reached the glassy state during cooling at a higher temperature with respect to other samples. On the other hand, presence of doctoring agents, diminished the degree of interactions between sucrose molecules in the rubbery state in which molecular mobility is sufficient enough to form crystal structures (Hartel et al., 2011). Moreover, the Tg values of GS–sucrose candies were higher than that of FS–sucrose candies mainly due to the presence of higher amounts of maltose and high MW sugars (Ergun et al., 2010). These sugars have high Tg values individually contributing to the increased Tg level of GS containing samples. Contrarily, FS candies have more fructose and glucose concentration having much lower individual Tg values (5°C and 31°C) compared with the Tg of maltose and high MW oligosaccharides (87 and 112°C–180°C) (Liang et al., 2007) (Table 2). The plasticizing effect of water on Tg was apparently observed on FS–sucrose samples since increasing FS concentration (from 25:75_FS to 75:25_FS) increased the water content from 5.83% to 7.08% (w/w) and decreased Tg from 25.61°C to 4.03°C. Although, GS addition to sucrose candies also decreased Tg, there is not a clear trend between GS concentration and Tg values. The reason could be the distortion of the ideal volume mixing behavior of the GS–sucrose systems (Reinheimer et al., 2010). Generally, when a low Tg component is mixed with a high Tg component, the Tg of the system attains a level between the individual Tg values of the mixed components. However, mixing of two high Tg components may not show an ideal mixing behavior (Šmídová et al., 2003). Since Tg values of GS components are higher than those of FS components, improper mixing may have occurred in GS containing formulations. Moreover, addition of high MW compounds to another component induces a broader glass transition range that would lead to a high variability in calculated Tg values (Kawai et al., 2019). This could be the case in GS–sucrose hard candies that revealed variable Tg values at different GS concentrations.
The Tg results showed that the doctoring agents (FS and GS) clearly decreased sucrose crystallization taking place in the rubbery state during the cooling period. It should also be noted that, Tg values of the FS–sucrose candies remained below the room temperature except for the 25:75_FS sample (Table 5). This is quite risky since such Tg values may lead to temperature induced internal graining during storage (Liang et al., 2007). GS samples, on the other hand, possess higher levels of Tg reducing the risk of temperature induced sucrose crystallization (Levenson and Hartel, 2005). However, GS - sucrose candies are more prone to moisture induced surface graining than FS - sucrose candies as previously discussed when explaining aw results. Although GS candies would absorb less moisture with respect to FS candies at high RH storage conditions due to their higher aw, the free water population would be higher in GS candies in the absence of a sufficient humectant content (Hartel et al., 2011). FS candies would suffer less from the moisture induced sucrose crystallization but they may become stickier than GS samples due their increased level of moisture absorption.
3.3 Longitudinal relaxation time and second moment results
3.3.1 Longitudinal relaxation time
T1 analysis of hard candies showed a monoexponential relaxation behavior except for 100_S candies showing biexponential relaxation (Table 6). The monophasic relaxation of FS or GS added candies indicated that components coming from doctoring agents had enhanced affinity with water and provided a more homogeneous sample (Okada et al., 2019). Additionally, doctoring agents are also able to place themselves between the sucrose molecules and this may have also contributed to the homogeneity of the continuous phase in the hard candies. The presence of solely sucrose probably induced more interactions between the individual sucrose molecules creating distinct proton populations within the samples (Mariette, 2009). The relaxation peaks of 100_S candies exerted a very long T1 (1,627 ms) and a much shorter (
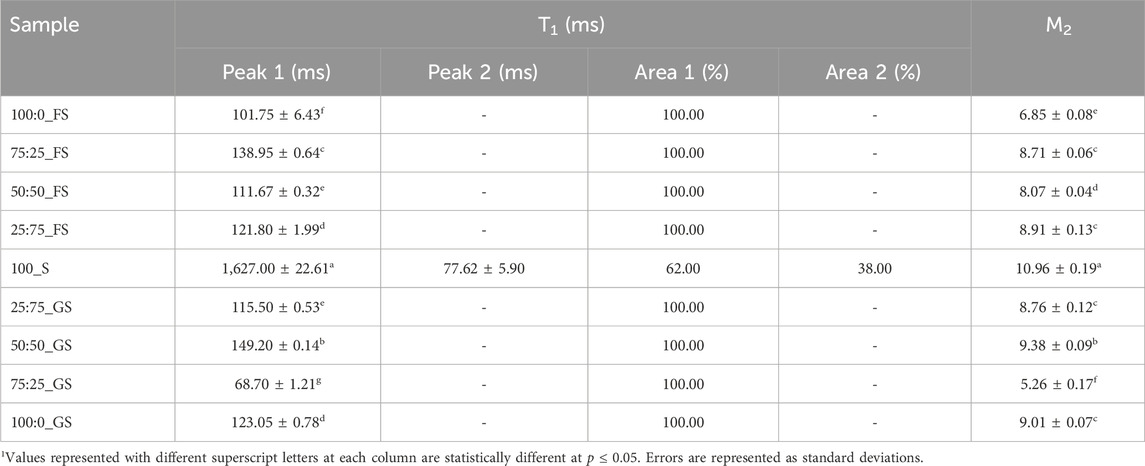
TABLE 6. Longitudinal relaxation time and second moment results.
3.3.2 Second moment
In addition to T1, M2 is also a valuable parameter to understand crystalline state molecular dynamics with more precision as proton mobility within a crystal lattice determines the M2 of a system. A higher M2 value is associated with a lower proton mobility in a solid state (Van Duynhoven et al., 2002). The reason behind this behavior is the enhanced dipolar interactions between the protons in lower molecular mobility conditions (Wang et al., 2002). Therefore, higher M2 values are expected at higher degrees of crystallinity (Grunin et al., 2019). The data in Table 6 indicates this trend as the 100_S candies had the highest M2 (10.96) indicating that 100_S samples possessed the highest crystallinity level (p
In fact, M2 analysis provided a very important information on the crystallization pattern in hard candies. Tg of the 100_S and 75:25_GS candies are high and close to each other as 53.32°C and 45.23°C, respectively. Therefore, one can assume that both candy formulations may have similar crystallinity properties since both samples reached the metastable glassy state at similar temperature regions during production. However, the crystallization processes taking place in these samples were completely opposite to each other. While 100_S candies experienced the highest sucrose crystallization level, 75:25_GS candies showed much less crystal lattice formation. Consequently, M2 analysis provided a detailed understanding of the glass transition and crystallization properties of hard candies. Finally, correlations between the NMR and other measured parameters could be mentioned. Strong positive correlations between T1 - Tg (r
4 Conclusion
This study showed that addition of doctoring agent to sucrose candies reduced the Tg and the level of sucrose crystallization in the hard candies. The type and concentration of the doctoring agent (GS or FS) incorporated into the hard candies affected the sucrose crystallization properties of the hard candies, differently. Moreover, both of the TD NMR parameters, T1 and M2 have been successfully used to interpret the glass transition and degree of sucrose crystallization characteristics of the hard candy formulations. Herewith, the direct integration of the fast Fourier-transform of MSE to calculate M2 could be presented as a precise method to detect the quantity and nature of sucrose crystallization in hard candies.
Data availability statement
The raw data supporting the conclusion of this article will be made available by the authors, without undue reservation.
Author contributions
BO: Conceptualization, Project administration, Resources, Writing–original draft, Writing–review and editing. BB: Data curation, Formal Analysis, Investigation, Methodology, Writing–original draft. SU: Data curation, Project administration, Writing–original draft. LG: Conceptualization, Formal Analysis, Investigation, Methodology, Software, Supervision, Writing–review and editing. MO: Conceptualization, Funding acquisition, Investigation, Methodology, Software, Supervision, Writing–review and editing.
Funding
The author(s) declare financial support was received for the research, authorship, and/or publication of this article. This study has received funding from the European Union’s Horizon 2020 Research and Innovation programme- MSCA RISE under grant agreement # 101008228. Higher Education Council of Turkiye is also acknowledged since SU is funded through YOK 100/2000 program for her PhD Studies.
Acknowledgments
SU performed the NMR experiments during her secondment at Resonance Systems GmbH under the guidance of LG. Sunar Mısır (Adana, Turkiye) is acknowledged for providing the corn syrups.
Conflict of interest
Authors SU and LG were employed by Resonance Systems GmbH.
The remaining authors declare that the research was conducted in the absence of any commercial or financial relationships that could be construed as a potential conflict of interest.
Publisher’s note
All claims expressed in this article are solely those of the authors and do not necessarily represent those of their affiliated organizations, or those of the publisher, the editors and the reviewers. Any product that may be evaluated in this article, or claim that may be made by its manufacturer, is not guaranteed or endorsed by the publisher.
References
Adam-Berret, M., Riaublanc, A., Rondeau-Mouro, C., and Mariette, F. (2009). Effects of crystal growth and polymorphism of triacylglycerols on nmr relaxation parameters. 1. evidence of a relationship between crystal size and spin-lattice relaxation time. Cryst. Growth Des. 9, 4273–4280. doi:10.1021/cg900218f
Adam-Berret, M., Rondeau-Mouro, C., Riaublanc, A., and Mariette, F. (2008). Study of triacylglycerol polymorphs by nuclear magnetic resonance: effects of temperature and chain length on relaxation parameters. Magnetic Reson. Chem. 46, 550–557. doi:10.1002/mrc.2213
Aso, Y., Yoshioka, S., Miyazaki, T., Kawanishi, T., Tanaka, K., Kitamura, S., et al. (2007). Miscibility of nifedipine and hydrophilic polymers as measured by 1H-NMR spin-lattice relaxation. Chem. Pharm. Bull. (Tokyo) 55, 1227–1231. doi:10.1248/cpb.55.1227
Avaltroni, F., Bouquerand, P. E., and Normand, V. (2004). Maltodextrin molecular weight distribution influence on the glass transition temperature and viscosity in aqueous solutions. Carbohydr. Polym. 58, 323–334. doi:10.1016/j.carbpol.2004.08.001
Borde, B., Bizot, H., Vigier, G., and Buléon, A. (2002). Calorimetric analysis of the structural relaxation in partially hydrated amorphous polysaccharides. II. Phenomenological study of physical ageing. Carbohydr. Polym. 48, 111–123. doi:10.1016/S0144-8617(01)00218-1
Bund, R. K., and Hartel, R. W. (2010). “Crystallization in foods and food quality deterioration,” in Chemical deterioration and physical instability of food and beverages. Editors L. H. Skibsted, J. Risbo, and M. L. Andersen (Cambridge, UK: Woodhead Publishing).
Couchman, P. R., and Karasz, F. E. (1978). A classical thermodynamic discussion of the effect of composition on glass-transition temperatures. Macromolecules 11, 117–119. doi:10.1021/ma60061a021
Dejong, A. E., and Hartel, R. W. (2016). Determination of sorbitol crystal content and crystallization rate using TD-NMR. J. Food Eng. 178, 117–123. doi:10.1016/j.jfoodeng.2016.01.012
Dinesh Kumar, R., Sudhakar, V., Sairagul, G., and Jony Blessing Manoj, J. (2021). Studies on the consistency of jaggery-based hard-boiled candy by incorporating thickening and gelling agents. Sugar Tech. 24, 1617–1623. doi:10.1007/s12355-021-01074-3
Ergun, R., Lietha, R., and Hartel, R. W. (2010). Moisture and shelf life in sugar confections. Crit. Rev. Food Sci. Nutr. 50, 162–192. doi:10.1080/10408390802248833
Fischer, K. (1935). Neues Verfahren zur maßanalytischen Bestimmung des Wassergehaltes von Flüssigkeiten und festen Körpern. Angew. Chem. 48, 394–396. doi:10.1002/ange.19350482605
Gordon, M., and Taylor, J. S. (1952). Ideal copolymers and the second-order transitions of synthetic rubbers. I. Non-crystalline copolymers. J. Appl. Chem. 2, 493–500. doi:10.1002/jctb.5010020901
Grunin, L., Oztop, M. H., Guner, S., and Baltaci, S. F. (2019). Exploring the crystallinity of different powder sugars through solid echo and magic sandwich echo sequences. Magnetic Reson. Chem. 57, 607–615. doi:10.1002/mrc.4866
Günther, H. (2013). NMR spectroscopy: basic principles, concepts, and applications in chemistry. Weinheim, Germany: Wiley-VCH Verlag GmbH and Co. KGaA.
Hartel, R. W. (2002). “Crystallization in foods,” in Handbook of industrial crystallization. Editor A. S. Myerson Butterworth-Heinemann, Oxford, UK, 287–304.
Hartel, R. W., Ergun, R., and Vogel, S. (2011). Phase/state transitions of confectionery sweeteners: thermodynamic and kinetic aspects. Compr. Rev. Food Sci. Food Saf. 10, 17–32. doi:10.1111/j.1541-4337.2010.00136.x
Hashemi, R. H., Bradley, W. G., and Lisanti, C. J. (2010). MRI: the basics. Baltimore, Maryland: Lippincott Williams and Wilkins.
Ihli, J., and Paterson, A. H. J. (2015). Effect of galacto-oligosaccharide concentration on the kinetics of lactose crystallisation. Int. Dairy J. 41, 26–31. doi:10.1016/j.idairyj.2014.09.001
Johari, G. P., Hallbrucker, A., and Mayer, E. (1987). The glass-liquid transition of hyperquenched water. Nature 330, 552–553. doi:10.1038/330552a0
Kawai, K., Uneyama, I., Ratanasumawong, S., Hagura, Y., and Fukami, K. (2019). Effect of calcium maltobionate on the glass transition temperature of model and hand-made hard candies. J. Appl. Glycosci. 66, 89–96. doi:10.5458/jag.jag.jag-2019_0005
Kovrlija, R., and Rondeau-Mouro, C. (2017). Multi-scale NMR and MRI approaches to characterize starchy products. Food Chem. 236, 2–14. doi:10.1016/j.foodchem.2017.03.056
Labuza, T. P., and Labuza, P. S. (2004). Influence of temperature and relative humidity on the physical states of cotton candy. J. Food Process Preserv 28, 274–287. doi:10.1111/j.1745-4549.2004.24041.x
Lans, A. M., Frelka, J. C., Paluri, S., and Vodovotz, Y. (2018). Physical properties and sensory analysis of galacto-oligosaccharide glassy confections. LWT 96, 499–506. doi:10.1016/j.lwt.2018.05.056
Le Botlan, D., Casseron, F., and Lantier, F. (1998). Polymorphism of sugars studied by time domain NMR. Analusis 26, 198–204. doi:10.1051/analusis:1998135
Lee, J. W., Thomas, L. C., and Schmidt, S. J. (2011). Can the thermodynamic melting temperature of sucrose, glucose, and fructose be measured using rapid-scanning differential scanning calorimetry (DSC)? J. Agric. Food Chem. 59, 3306–3310. doi:10.1021/jf104852u
Levenson, D. A., and Hartel, R. W. (2005). Nucleation of amorphous sucrose-corn syrup mixtures. J. Food Eng. 69, 9–15. doi:10.1016/j.jfoodeng.2004.07.005
Liang, B., Shi, Y., and Hartel, R. W. (2007). FT-NIR microspectroscopy: a method for quantitatively mapping one-dimensional moisture penetration into sugar glasses. Food Biophys. 2, 93–99. doi:10.1007/s11483-007-9035-6
Mariette, F. (2009). Investigations of food colloids by NMR and MRI. Curr. Opin. Colloid Interface Sci. 14, 203–211. doi:10.1016/j.cocis.2008.10.006
Martins, P. M., Rocha, F. A., and Rein, P. (2005). Modeling sucrose evaporative crystallization. Part 1. Vacuum pan monitoring by mass balance and image analysis methods. Ind. Eng. Chem. Res. 44, 8858–8864. doi:10.1021/ie050639h
Mayhew, E. J., Neal, C. H., Lee, S. Y., and Schmidt, S. J. (2017). Glass transition prediction strategies based on the Couchman-Karasz equation in model confectionary systems. J. Food Eng. 214, 287–302. doi:10.1016/j.jfoodeng.2017.07.007
McFetridge, J., Rades, T., and Lim, M. (2004). Influence of hydrogenated starch hydrolysates on the glass transition and crystallisation of sugar alcohols. Food Res. Int. 37, 409–415. doi:10.1016/j.foodres.2004.01.005
Nadaletti, M., Di Luccio, M., and Cichoski, A. J. (2011). Sucrose inversion of hard candies formulated with rework syrup with addition of sodium lactate. J. Food Process Eng. 34, 305–316. doi:10.1111/j.1745-4530.2009.00358.x
Namlı, S. (2019). Microwave glycation of soy protein isolate. https://etd.lib.metu.edu.tr/upload/12623713/index.pdf.
Netramai, S., Kijchavengkul, T., Sompoo, P., and Kungnimit, W. (2018). The effect of intrinsic and extrinsic factors on moisture sorption characteristics of hard candy. J. Food Process Preserv 42, 135999. doi:10.1111/jfpp.13599
Nowakowski, C. M., and Hartel, R. W. (2002). Moisture sorption of amorphous sugar products. J. Food Sci. 67, 1419–1425. doi:10.1111/j.1365-2621.2002.tb10300.x
Nunes, C., Mahendrasingam, A., and Suryanarayanan, R. (2005). Quantification of crystallinity in substantially amorphous materials by synchrotron X-ray powder diffractometry. Pharm. Res. 22, 1942–1953. doi:10.1007/s11095-005-7626-9
Okada, K., Hirai, D., Kumada, S., Kosugi, A., Hayashi, Y., and Onuki, Y. (2019). 1H NMR relaxation study to evaluate the crystalline state of active pharmaceutical ingredients containing solid dosage forms using time domain NMR. J. Pharm. Sci. 108, 451–456. doi:10.1016/j.xphs.2018.09.023
Raudonus, J., Bernard, J., Janßen, H., Kowalczyk, J., and Carle, R. (2000). Effect of oligomeric or polymeric additives on glass transition, viscosity and crystallization of amorphous isomalt. Food Res. Int. 33, 41–51. doi:10.1016/S0963-9969(00)00022-3
Reinheimer, M. A., Mussati, S., Scenna, N. J., and Pérez, G. A. (2010). Influence of the microstructure and composition on the thermal-physical properties of hard candy and cooling process. J. Mol. Struct. 980, 250–256. doi:10.1016/j.molstruc.2010.07.027
Roos, Y. (1993). Melting and glass transitions of low molecular weight carbohydrates. Carbohydr. Res. 238, 39–48. doi:10.1016/0008-6215(93)87004-C
Roos, Y., and Karel, M. (1991a). Plasticizing effect of water on thermal behavior and crystallization of amorphous food models. J. Food Sci. 56, 38–43. doi:10.1111/j.1365-2621.1991.tb07970.x
Roos, Y., and Karel, M. (1991b). Water and molecular weight effects on glass transitions in amorphous carbohydrates and carbohydrate solutions. J. Food Sci. 56, 1676–1681. doi:10.1111/j.1365-2621.1991.tb08669.x
Roos, Y. H. (2002). Importance of glass transition and water activity to spray drying and stability of dairy powders. Lait 82, 475–484. doi:10.1051/lait:2002025
Schugmann, M., and Foerst, P. (2022). Systematic investigation on the glass transition temperature of binary and ternary sugar mixtures and the applicability of gordon–taylor and couchman–karasz equation. Foods 11, 1679. doi:10.3390/foods11121679
Sherwin, C. P., and Labuza, T. P. (2006). “Beyond water activity and glass transition: a broad perspective on the manner by which moisture can influence reaction rates in foods,” in Water properties of food, pharmaceutical, and biological materials. Editors M. del P. Buera, J. Welti-Chanes, P. J. Lillford, and H. R. Corti New York, NY, USA: CRC Press, 343–376.
Šmídová, I., Čopíková, J., Maryška, M., and Coimbra, M. A. (2003). Crystals in hard candies. Czech J. Food Sci. 21, 185–191. doi:10.17221/3497-cjfs
Spanemberg, F. E. M., Sellitto, M. A., Mailan Porto, L., Cruz dos Santos, A., and Canez Lemos Souza, Á. (2022). Shelf life estimation of glassy confections using moisture sorption isotherms. J. Food Process Eng. 45. doi:10.1111/jfpe.14024
Subranamiam, P., and Wareing, P. (2016). in The stability and shelf life of food. Editor P. Subranamiam (Cambridge, MA, USA: Woodhead Publishing).
Sugisaki, M., Suga, H., and Seki, S. (1968). Calorimetric study of the glassy state. IV. Heat capacities of glassy water and cubic ice. Bull. Chem. Soc. Jpn. 41, 2591–2599. doi:10.1246/bcsj.41.2591
Tan, J., and Kerr, W. L. (2017). Determination of glass transitions in boiled candies by capacitance based thermal analysis (CTA) and genetic algorithm (GA). J. Food Eng. 193, 68–75. doi:10.1016/j.jfoodeng.2016.08.010
Teles Dos Santos, M., Gerbaud, V., and Le Roux, G. A. C. (2014). Solid Fat Content of vegetable oils and simulation of interesterification reaction: predictions from thermodynamic approach. J. Food Eng. 126, 198–205. doi:10.1016/j.jfoodeng.2013.11.012
Torres, D. P. M., Bastos, M., Gonalves, M. D. P. F., Teixeira, J. A., and Rodrigues, L. R. (2011). Water sorption and plasticization of an amorphous galacto-oligosaccharide mixture. Carbohydr. Polym. 83, 831–835. doi:10.1016/j.carbpol.2010.08.063
Van Duynhoven, J., Dubourg, I., Goudappel, G. J., and Roijers, E. (2002). Determination of MG and TG phase composition by time-domain NMR. JAOCS, J. Am. Oil Chemists’ Soc. 79, 383–388. doi:10.1007/s11746-002-0493-7
Wang, Y. L., Tang, H. R., and Belton, P. S. (2002). Solid state NMR studies of the molecular motions in the polycrystalline α-L-fucopyranose and methyl α-L-fucopyranoside. J. Phys. Chem. B 106, 12834–12840. doi:10.1021/jp0268617
Yebra-Biurrun, M. C. (2005). “Sweeteners,” in Encyclopedia of analytical science. Editors P. Worsfold, A. Townshend, and C. Poole (San Diego, CA, USA: Elsevier Academic Press), 562–572.
Keywords: 1 H NMR, hard candy, glass transition, crystallization, sucrose
Citation: Ozel B, Berk B, Uguz SS, Grunin L and Oztop MH (2024) Correlation of low field nuclear magnetic resonance relaxation with composition and glass transition of hard candies. Front. Food. Sci. Technol. 4:1263380. doi: 10.3389/frfst.2024.1263380
Received: 19 July 2023; Accepted: 21 February 2024;
Published: 04 March 2024.
Edited by:
Fanbin Kong, University of Georgia, United StatesReviewed by:
Mehraj Fatema Z. Mulla, Teagasc—Irish Agriculture and Food Development Authority, IrelandWilliam S. Price, Western Sydney University, Australia
Copyright © 2024 Ozel, Berk, Uguz, Grunin and Oztop. This is an open-access article distributed under the terms of the Creative Commons Attribution License (CC BY). The use, distribution or reproduction in other forums is permitted, provided the original author(s) and the copyright owner(s) are credited and that the original publication in this journal is cited, in accordance with accepted academic practice. No use, distribution or reproduction is permitted which does not comply with these terms.
*Correspondence: Mecit Halil Oztop, bWVjaXRAbWV0dS5lZHUudHI=