 Rajesh Kumar
 Edgar Chambers IV*
- Department of Food, Nutrition, Dietetics, and Health, Center for Sensory Analysis and Consumer Behavior, Kansas State University, Manhattan, KS, United States
Researchers commonly use hierarchical clustering (HC) or k-means (KM) for grouping products, attributes, or consumers. However, the results produced by these approaches can differ widely depending on the specific methods used or the initial “seed” aka “starting cluster centroid” chosen in clustering. Although recommendations for various clustering techniques have been made, the realities are that objects in groups can, and do, change their clusters. That can impact interpretation of the data. Researchers usually does not run the clustering algorithms multiple times to determine stability, nor do they often run multiple methods of clustering although that has been recommended previously. This study applied hierarchical agglomerative clustering (HAC), KM and fuzzy clustering (FC) to a large descriptive sensory data set and compared attribute clusters from the methods, including multiple iterations of same methods. Sensory attributes (objects) shuffled among clusters in varying ways, which could provide different interpretations of the data. That frequency was captured in the KM output and used to form the “best possible” clusters via manual clustering (MC). The HAC and FC results were studied and compared with KM results. Attribute correlation coefficients also were compared with clustering information. Using results from one clustering approach may not be reliable, and results should be confirmed using other clustering approaches. A strategy that combines multiple clustering approaches, including a MC process is suggested to determine consistent clusters in sensory data sets.
Introduction
Cluster analysis (CA) is one of the most common statistical techniques used in both sensory and consumer studies to segment, classify or group “objects” into homogenous subsets (Pierguidi et al., 2020). The objects can be consumers, products, or product attributes, and completely depend on the objectives of the study. Studies have used CA for various research purposes such as to summarizes differences among consumers for their likes and dislikes of products, group specific products or attributes for various product categories, and for product optimization in new product development (Zielinski et al., 2014). For example, CA was used to segment consumers for liking similarities of large potato varieties (Sharma et al., 2020), mate tea varieties for sensory properties (Godoy et al., 2020), and non-food products (Grygorczyk et al., 2019) and plant proteins snack development (Saint-Eve et al., 2019).
For multivariate sensory and consumer data the two most common types of clustering methods are hierarchical agglomerative clustering (Jacobsen and Gunderson, 1986) and the non-hierarchical partitioning method, e.g., k-means (Myers and Mullet, 2003). In both methods objects are arranged into relatively homogenous groups according to selected criteria, so objects that show more similarities are placed together in a cluster than with those placed in other clusters (Zielinski et al., 2014). One main challenge with CA application is that the obtained results strongly depend on the choices made by the investigators. Among them, the selection of clustering method, true number of clusters, stability, and repeatability of results are particularly important in sensory studies (Qannari, 2017). Different clustering methods use different assumptions about the structure of the data which yields different results (Yenket and Chambers, 2017).
Mostly, investigators do not have any prior knowledge about the number of clusters and their structure. To overcome this problem some researchers run data with different clustering methods, using different cluster numbers, and present their best interpretable solutions (Næs et al., 2018). The stability of clustering results is extremely important in both market segmentation of consumers, and sensory attributes or products grouping in new product development. A significant amount of literature has been produced on the utilization of clustering methods in various sensory and consumer studies but much less attention has been paid to the stability, validity of results, and properties of clusters obtained from these methods (Sauvageot et al., 2017).
The internal stability of cluster results defines the possibility for replicating the results with the same or similar data (Wedel and Kamakura, 2000). Studies have evaluated internal cluster stability by using variations of clustering methodologies on consumer segmentations but rarely on descriptive sensory data. Müller and Hamm (2014), found consumers could change from one cluster to another when they were retested, and cautions must be taken in the application of clustering methods. Their results suggested that the best solution remains subjective and researcher are advised not to take final solutions for granted. Sauvageot et al. (2017), reported the existence of unstable clusters with KM methods, compared KM clusters with principal component analysis (PCA) results to confirm true nature of clusters, and made subjective decisions to influence final decision in describing dietary patterns in a population.
In a consumer study a HAC method differentiated six alcoholic beverages for emotions and context but failed to distinguish for sensory properties even though the six samples were sensorially different (Pierguidi et al., 2020). Those authors employed several other multi-factor analysis tools to explain differences between clusters. Clustering procedures that produce clusters with reasonably high homogeneity can “miscommunicate” information in typical mapping situations (Yenket and Chambers, 2017). Another study by Yenket et al. (2011), found that clustering procedures based on liking place consumers in groups with other consumers who did not necessarily like the same products.
Endrizzi et al. (2014), compared HAC and KM results of consumer likings for fruit juices to determine the agreement between clustering methods. The results were not completely comparable, a number of consumers moved from one group to another in the KM output, and visual clustering was done through PCA for the identification of an additional cluster representing consumers with liking score in the opposite direction. The study concluded that algorithm based automatic clustering methods (HAC and KM) failed to clearly identify and separate consumer groups, and alternate approaches such as visual clustering, a form of MC, must be applied to identify natural clusters. Segmentations based on visual inspection of plots (PCA, HAC, and KM outputs) represents a more flexible approach than automatic procedures (Wajrock et al., 2008; Endrizzi et al., 2011).
Granato et al. (2018), cautioned researchers on the indiscriminate use of HAC to establish association between bioactive compounds and their antioxidant functional properties. They suggested the results could be misleading or may not represent natural groups. Similarly, other researchers also highlighted issues with the validity of clustering results. Example, HAC does not always recover true clusters, and also does not offer any mechanism to assess if clustering is stable or changing (Wajrock et al., 2008), both HAC and KM clustering approach yielded different results with same data set (Horn and Huang, 2009), consumer segmentations by clustering methods lack stability and repeatability (Müller and Hamm, 2014), and the HAC method failed to clearly distinguish one consumer group for its relationship with mandarin flavor attributes and overall drivers of liking (Simons et al., 2019). Therefore, clusters produced by using one method, without investigating the stability and reproducibility, researchers could easily end-up with misleading conclusions (Yenket et al., 2011).
Over the last decade, researchers have proposed many strategies to help reach stability with clustering results. Vigneau et al. (2016), added a “noise cluster” to remove low-signal consumers using FC approach. Simons et al. (2019), replicated a consumer study four times over a period of 2 years to produce steady consumer clusters for twenty-nine mandarin varieties. The study concluded that repeating studies may help to validate cluster solutions. However, the ability to repeat studies often is impossible given time and money constraints. Vigneau et al. (2014) added external variables to validate cluster results. Similarly, other studies have also suggested various tools of applied statistic to ensure stability. For example, if there are many variables, then removing the redundant ones before segmentation may help (Dolnicar and Grun, 2011). A combination of factor analysis, HAC and KM method was used by Müller and Hamm (2014), and PCA and HAC was used in combination to validate consumer segments (Endrizzi et al., 2011; Juárez-Barrientos et al., 2019). Thus, it remains challenging to determine a single cluster solution with confidence and, consequently, it essentially depends on the methodology applied.
Although studies have highlighted issues with clustering results in consumer studies, the repeatability of CA with descriptive sensory data has been less studied. This study was undertaken to increase researcher’s knowledge on three clustering methods (HAC, KM, and FC). The objectives of this study were (1) to underline the unreliability of clustering outputs with large data set, (2) to provide a methodological approach to identify stable and moving objects within clusters, and (3) to show how other elements of applied statistics can be used for meaningful interpretation of clustering results.
Material and methods
Data source
Data was obtained from Kumar and Chambers (2019), that evaluated 76 multi-sensory i.e., visual (V), hand-feel (H), lip-feel (L), first-bite (FB), multi-bite (MB), and in-throat (TH), descriptive texture attributes of 50 snack foods was used in this study. The previous study used repeated KM clustering and found twenty-eight clusters are optimal, although the clusters were not completely stable. Therefore, this study was designed to investigate stability of clusters using different clustering approaches.
Methods
Table 1, lists clustering methods used in this study along with number of times algorithms run, iterations, and number of results saved for analysis.
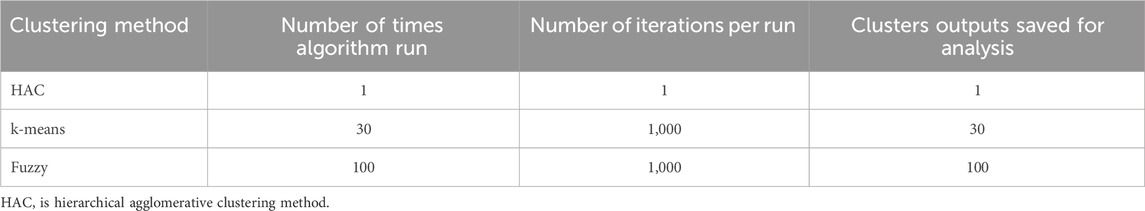
Table 1. Clustering methods, number of times algorithm run, number of iterations per run and cluster outputs saved for analysis.
Hierarchical clustering
The HC method operates in one of two directions. In the most common approach (HAC) each object is initially considered to be a cluster of size one and the analysis successively merges the objects until only one cluster exists. This is referred as agglomerative clustering (Figure 1). The starting point is a distance matrix between the objects to be clustered and it begins by identifying (by distance measures) objects that are closest. The closest objects are then put in one cluster. The first step ends up with N-1 clusters (N = total number of objects), with one cluster consisting of the first two closest objects and the others consisting of only one object each. In the next step, the method again identifies the objects or clusters which are the closest using the same distance criterion. The process continues until all objects are collected with one large cluster (Jacobsen and Gunderson, 1986; Næs et al., 2018).
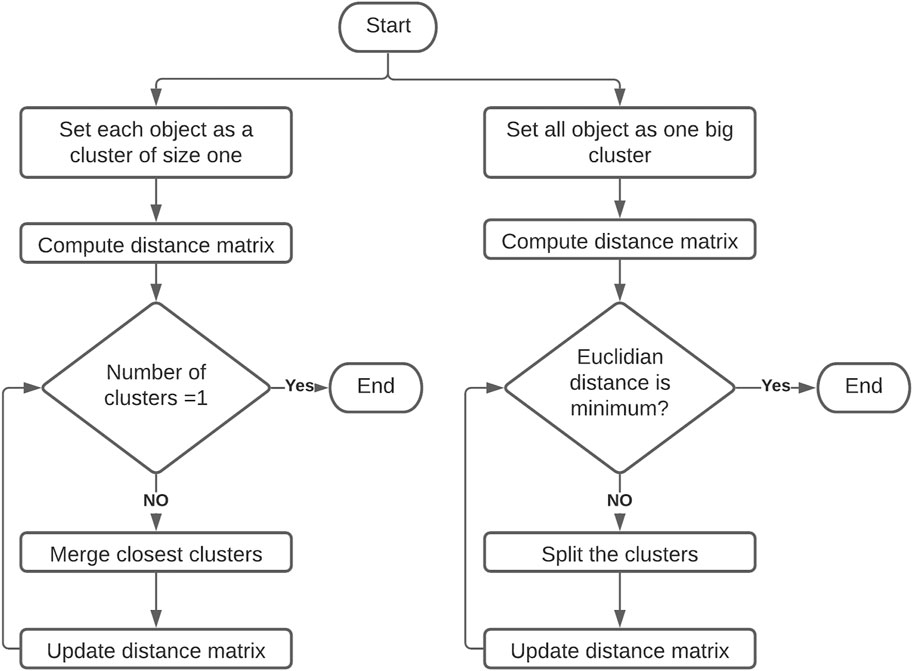
Figure 1. Flow chart of hierarchal agglomerative clustering.
In the second direction, clustering begins by treating all the objects as one big cluster and then breaks groups of objects apart until only a single object remains in each cluster, referred as divisive clustering (Figure 1). The results of HC produce a tree like diagram termed a dendrogram or “tree”. The graphical representation often manifests cluster structures by long vertical line segments, also used to decide the actual number of clusters that exist, and identifying outlier objects (Næs et al., 2018). The outlier object has a large distance to all other objects, and it is put in a cluster at the top level of the dendrogram (largest distance).
In the “tree” style diagram, there are multiple ways to determine which “neighbors” are clustered together in which order and each of those methods can provide differences in the final clusters (Prell and Sawyer, 1988; Chambers et al., 2005; Chambers IV et al., 2016). Common distance measuring approaches used in algorithms are average linkage, centroid linkage, median linkage, furthest neighbor, nearest-neighbor and Ward’s minimum variance linkage (Denis, 2020).
The Ward’s method is one of the most frequently used methods in agglomerative clustering, is available in many statistical software packages, and was used in this study. The Ward’s method uses an analysis of variance (ANOVA) type sum of squares as a distance measure between clusters. Each distance measuring approach has its merits and limitations. Sensory studies on a wide variety of products have used HAC recently (e.g., Donfrancesco et al., 2019; Godoy et al., 2020; Granato et al., 2018; Sharma et al., 2020; Tran et al., 2019).
Clustering using k-means
Non-hierarchical methods also known as partitioning methods includes the KM method and the FC method (Næs et al., 2018). In both methods, the investigator needs to decide the number of clusters beforehand. The objects can be assigned to clusters based on prior knowledge or considering natural groupings. Another approach is to assign objects to any random number of clusters using an iterative algorithm. The algorithms are run through programs which reassigns each object to clusters until homogeneity within cluster is achieved (Denis, 2020). The KM method assigns each object to a cluster based on its distance (Euclidean) from the center of the cluster, as more objects are added to a cluster, the cluster centroid changes (Figure 2). A number of sensory studies have used the KM approach in recent years (e.g., Sauvageot et al., 2017; Tleis et al., 2017; Kumar and Chambers, 2019).
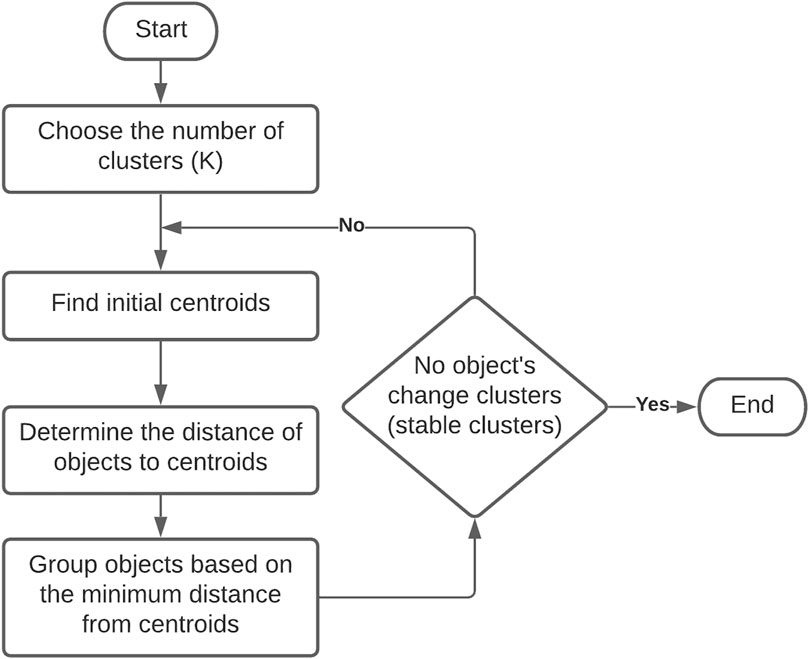
Figure 2. Flow chart of k-means clustering.
The KM approach of seeding the cluster center at a new position on every iteration can result in an object changing its association with the final clusters. Thus, researchers are advised to repeat the iteration for object assignments to clusters until no further changes occur. However, the number of iterations that needs to be repeated to reach homogeneity within cluster is not known. It is left to the discretion of researcher. Many researchers, particularly new or naïve researchers, typically do not run KM algorithms multiple times to obtain stability of clusters. Also, if the true number of clusters is not known beforehand then the procedure must be repeated for different numbers of clusters of interest to the researcher. By its nature, the KM method produces many cluster solutions based on expected number of clusters and different starting seeds. Therefore, it is necessary for the researcher to select the “best” solution that addresses study objectives, a process that can produce bias toward a particular solution.
For this study, the KM approach also was used assuming that the number of clusters was 28 based on the original study. The KM algorithm (R program) was run 30 times (producing 30 cluster solutions) where each run used 1,000 iterations to determine the appropriate cluster solution (Table 1). A clustering frequency matrix was produced to record the number of times attributes stayed with each other and vice-versa. Each attribute was studied for its frequency of clustering with each other and compared to the most frequent clustering solution. Using the clustering frequency matrix, clusters were reorganized manually (MC) to produce the best possible representation of clusters (Table 2).

Table 2. Clusters reorganized based on frequency of occurrence.
Fuzzy clustering
Probabilistic cluster analysis technique a.k.a. FC is where each object is given a degree of membership relative to each cluster (Næs et al., 2018). FC algorithm generates membership values between 0 and 1, to each object for each cluster (Figure 3). FC offers the advantages of differentiating objects that are strongly associated to a particular cluster (i.e., degree of membership close to +1.0) from those objects that have some link with more than one cluster (i.e., equal degree of membership for two or more clusters). In this study, a fuzzy c-means clustering algorithm was applied to cluster attributes but not assign them strictly to one cluster. The objective of FC was to identify attributes that are strongly associated with one cluster, and also to understand the floating nature of other attributes. The number of clusters was set to twenty-eight, the number of iterations for each run was set as 1,000, the seed was set at random, and the algorithm was run 100 times to produce 100 cluster solutions (Table 1). Those 100 outputs were generated and analyzed to observe the clustering pattern, and the output with highest number of occurrences was selected for final discussion and comparison.
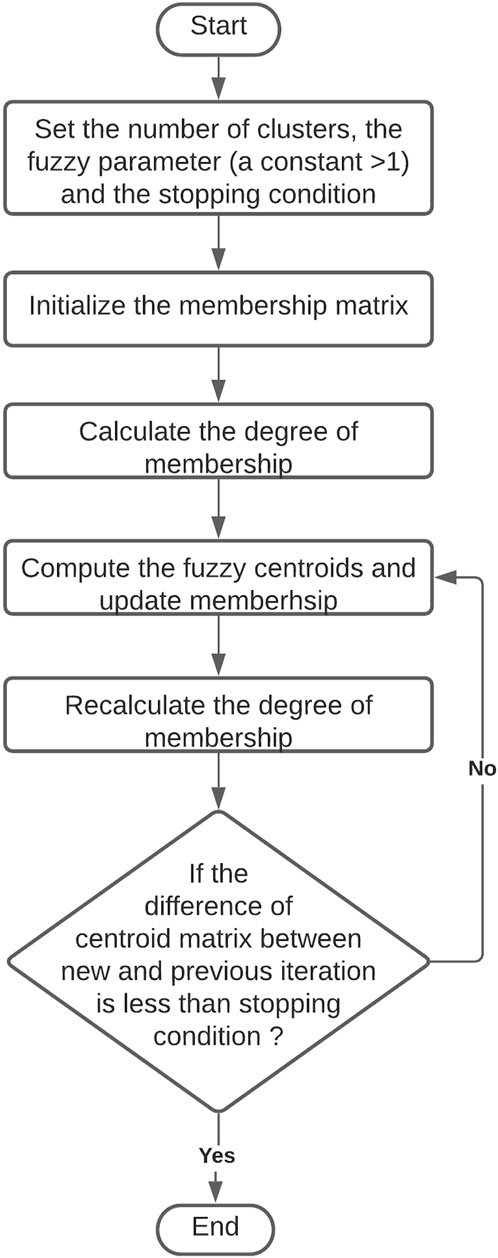
Figure 3. Flow chart of fuzzy clustering.
Correlation coefficient
The correlation coefficient is a measure of the strength of the linear relationship between two variables (sensory attributes in this study). The value of correlation coefficient can range between −1 and +1, where the value of −1 indicates an inverse linear relationship and +1 indicates a positive liner relationship (Meilgaard et al., 1999). Correlation coefficients are computed using the functions cor() in r package.
Statistical software
Data analysis was performed using R-studio version R-4.0.0.pkg (R Foundation for Statistical Computing, Vienna, Austria; https://www.r-project.org/). Published packages such as, factoMineR, factoextra, fclust (fuzzy clustering), flashClust (Optimal hierarchal clustering), ggplot2, SensoMineR, and e1071 (e-means FC) were used throughout the analysis. The analysis and results obtained are reproducible within the limits of the methods used.
Results
Hierarchical Agglomerative Clustering The HAC Ward’s method clustered texture attributes measured by non-oral senses (vison, hand-feel and lips) and oral senses (Kumar and Chambers, 2019). Using Ward’s method again in this research, the HAC analysis maintained groupings of attributes that were the same although measured by different senses into the same cluster (Figure 4). For example, 1) smoothness-V, H, L, and uniformity of surface-V, 2) moistness-V, H, and L, 3) moistness-FB and moistness of mass-MB, 4) residual mouth-TH and residual throat-TH, 5) heat burn-MB, TH, L, FB, and sting bite-L, 6) oil mouthfeel-MB and oil mouth coating-TH, 7) greasy-V, H, L, and oil-V, H, L, 8) fibrous-V, FB, and MB, 9) chalky mouthfeel-MB and chalky mouth coat-TH, 10) effervescence-FB and MB, 11) waxy mouthfeel-MB, waxy mouth coat-TH, waxy-V, H, and L, 12) adhesive-H and L, 13) adhesive to teeth-FB and MB, 14) powdery-V, H, and L, 15) roughness of surface-V, H, and L, 16) sustained crispness-MB, sustained fracturability-MB, fracturability-FB, and initial crispness-FB, 17) particle amount-L, gritty-H, and L, 18) particle amount-V, MB, roughness of mass-MB, and roughness of swallow-TH (Figure 4).
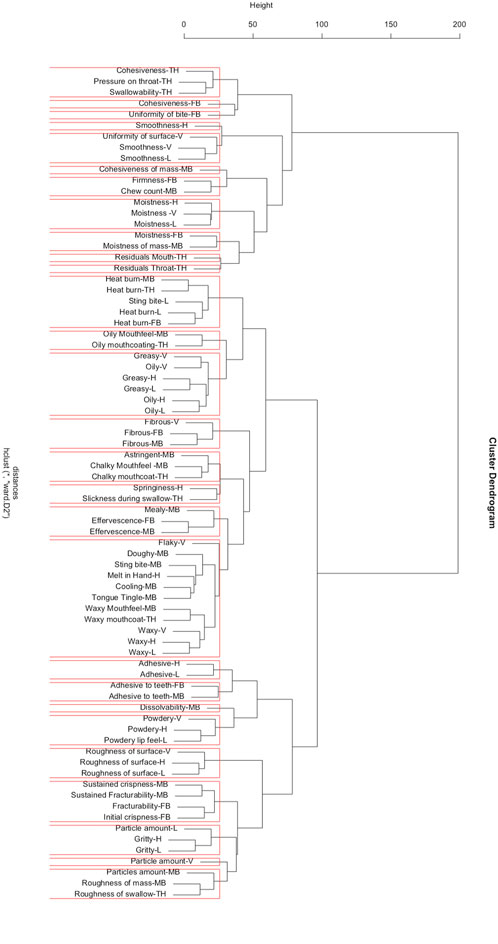
Figure 4. Dendrogram for hierarchal clustering analysis using Ward’s methods showing attribute clusters. Note: V, visual; H, hand feel; L, lip feel; FB, first bite; MB, multiple bite; TH, in throat.
The major challenge with Ward’s was to find the true number of clusters and a mechanism to deal with attributes that clustered together but had no meaning from a sensory point of view. For example, 1) springiness-H and slickness during swallow-TH or 2) flaky-V, doughy-MB, sting bite-MB, cooling-MB, tongue tingle-MB (Figure 4) formed clusters. However, attributes like springiness and slickness neither share obvious structural relationships nor causes that would necessarily result in those attributes grouping together. The same could be said for flaky, dough, sting, cooling, and tongue tingle some of which are purely textural and other that have both a textural and a trigeminal component. The scree plot produced by HAC, a classic way to evaluate the number of clusters, implies that the number of clusters can be any number between twenty and thirty (Figure 5). The sharpest elbow or flattening of the sum of squared residuals curve (Wilderjans and Cariou, 2016), suggests that the optimum number of clusters could be just below thirty (Figure 5). The HAC approach is not designed to cluster objects for a specified number of clusters, instead that number must be chosen based on interpretation of aspects such as scree plot, visual inspection, and interpretation of the clusters.
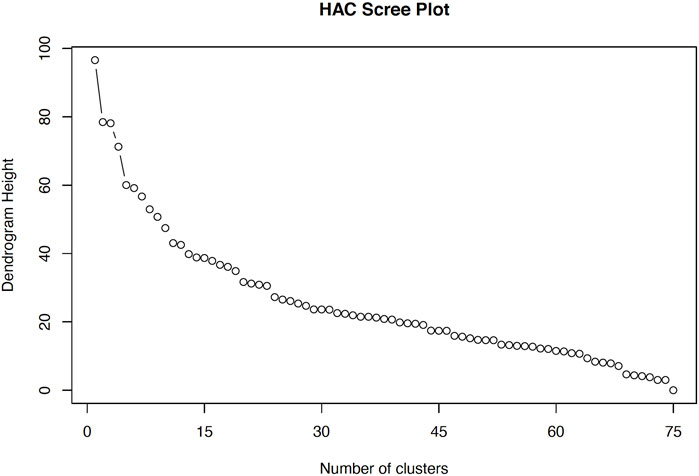
Figure 5. Scree plot with number of clusters plotted against the dendrogram height (sum of squared residuals) produced using hierarchical agglomerative clustering (HAC) Ward’s method.
The HC methods are used for simplicity and dendrograms are useful for visual inspection, and selection of clusters. Clusters formed by means of mathematical algorithms by HC methods may look natural, but it may not be a correct representation of true clusters (Denis, 2020). Additionally, because HC uses a variety of linkage options (single, complete, average and centroid), each linkage could yield different clustering solutions (James et al., 2013; Denis, 2020).
The HC methods do not depend on initialization and a chosen number of clusters beforehand (Næs et al., 2018). However, clusters overlap in HC solutions, and HC methods are less sensitive to noise. Therefore, the method may not be suitable for large data sets, including those in consumer studies (Wajrock et al., 2008). The main problem with HC methods is that the merges are final and there is no option for reassigning an object that was clustered at earlier stages. This could avert global optimization, specifically when there are no true clusters in the data but HC will always form clusters (Næs et al., 2018).
Clustering using k-means
The number of clusters was kept at twenty-eight used by Kumar and Chambers (2019). While examining the KM clustering solutions, we noticed that one clustering solution occurred more frequently than others, and that was the one published by Kumar and Chambers (2019). However, the movement of attributes within clusters never stopped.
The clustering frequency matrix can be used to identify strong, moderate, and weak links of attributes with each other (Table 2). Attributes with frequency greater than twenty-five could be considered strong associations meaning an 84% (0.84 out of 1) chance of clustering consistently. For example, clusters 1, 5, 6, 9, 10, 12, 21, 23, 24, 25, and 26 (Table 2). In the FC method, which is a generalization of KM, and uses many of the same principles to achieve clustering, objects with membership values close to one are considered as almost certainly in that cluster or group (Bedalli et al., 2016; Næs et al., 2018). Thus, we used that standard for KM as well.
In addition, components (sensory attributes) within clusters in which a few attributes have high frequency of clustering (≥25) while others are lower can also be termed as strong associations. For example, in cluster-2 pressure on throat-TH, swallowability-TH, and cohesiveness-TH) have high frequency of clustering (≥28) with each other and the relationship is stronger than residual throat-TH (≤15) (Table 2).
Attributes with frequency between ≥15 and <25 could be termed as moderate associations, and ≤15 could be termed as weak associations. Attributes with frequency ≤15, were changing cluster associations on every other run of the KM algorithm. Attributes that mostly remained independent, and are the most distinguishing ones. For example, slickness during swallow-TH, mealy-MB, flaky-V, dissolvability-MB, springiness-H, and particle amount-V. These attributes never clustered with any other attribute (Table 2).
Thus, a MC solution was produced using the clustering frequency matrix and the use of manual clustering reduced the number of clusters to twenty-seven (Table 2). The total mean variability explained by KM was 87.3%. Out of 27 manual clusters, 19 (68%) clusters matched exactly as they were published in the earlier work (Kumar and Chambers, 2019). Nine clusters that did not match, were not completely different but had one or two attributes moved to different clusters. These attributes had higher frequency of association with other attributes which were not captured in the previous publication. For example, fibrous-V was independent but clustered twenty-eight times with fibrous-FB and MB. Therefore, fibrous-V, FB, and MB were all put into one cluster together (Table 2).
Comparison between hierarchical agglomerative clustering and k-means frequency based manual clustering
An assessment of KM, HAC and FC results are presented in Table 3. All seventy-six attributes are included in KM results, and were compared to HAC results. HAC clusters that did not match to the KM clusters were not included in Table 3. The dissimilar attributes either remained independent or formed new associations (not shown in the table). Fifteen (56%) of KM clusters (3, 5, 6, 8, 9, 10, 12, 14, 15, 16, 18, 23, 24, and 26) were found to be similar in HAC results. These fifteen clusters can be said to have a very strong association with each other and could also be termed as true clusters. These true clusters are confirmed both in the KM and HAC approach.
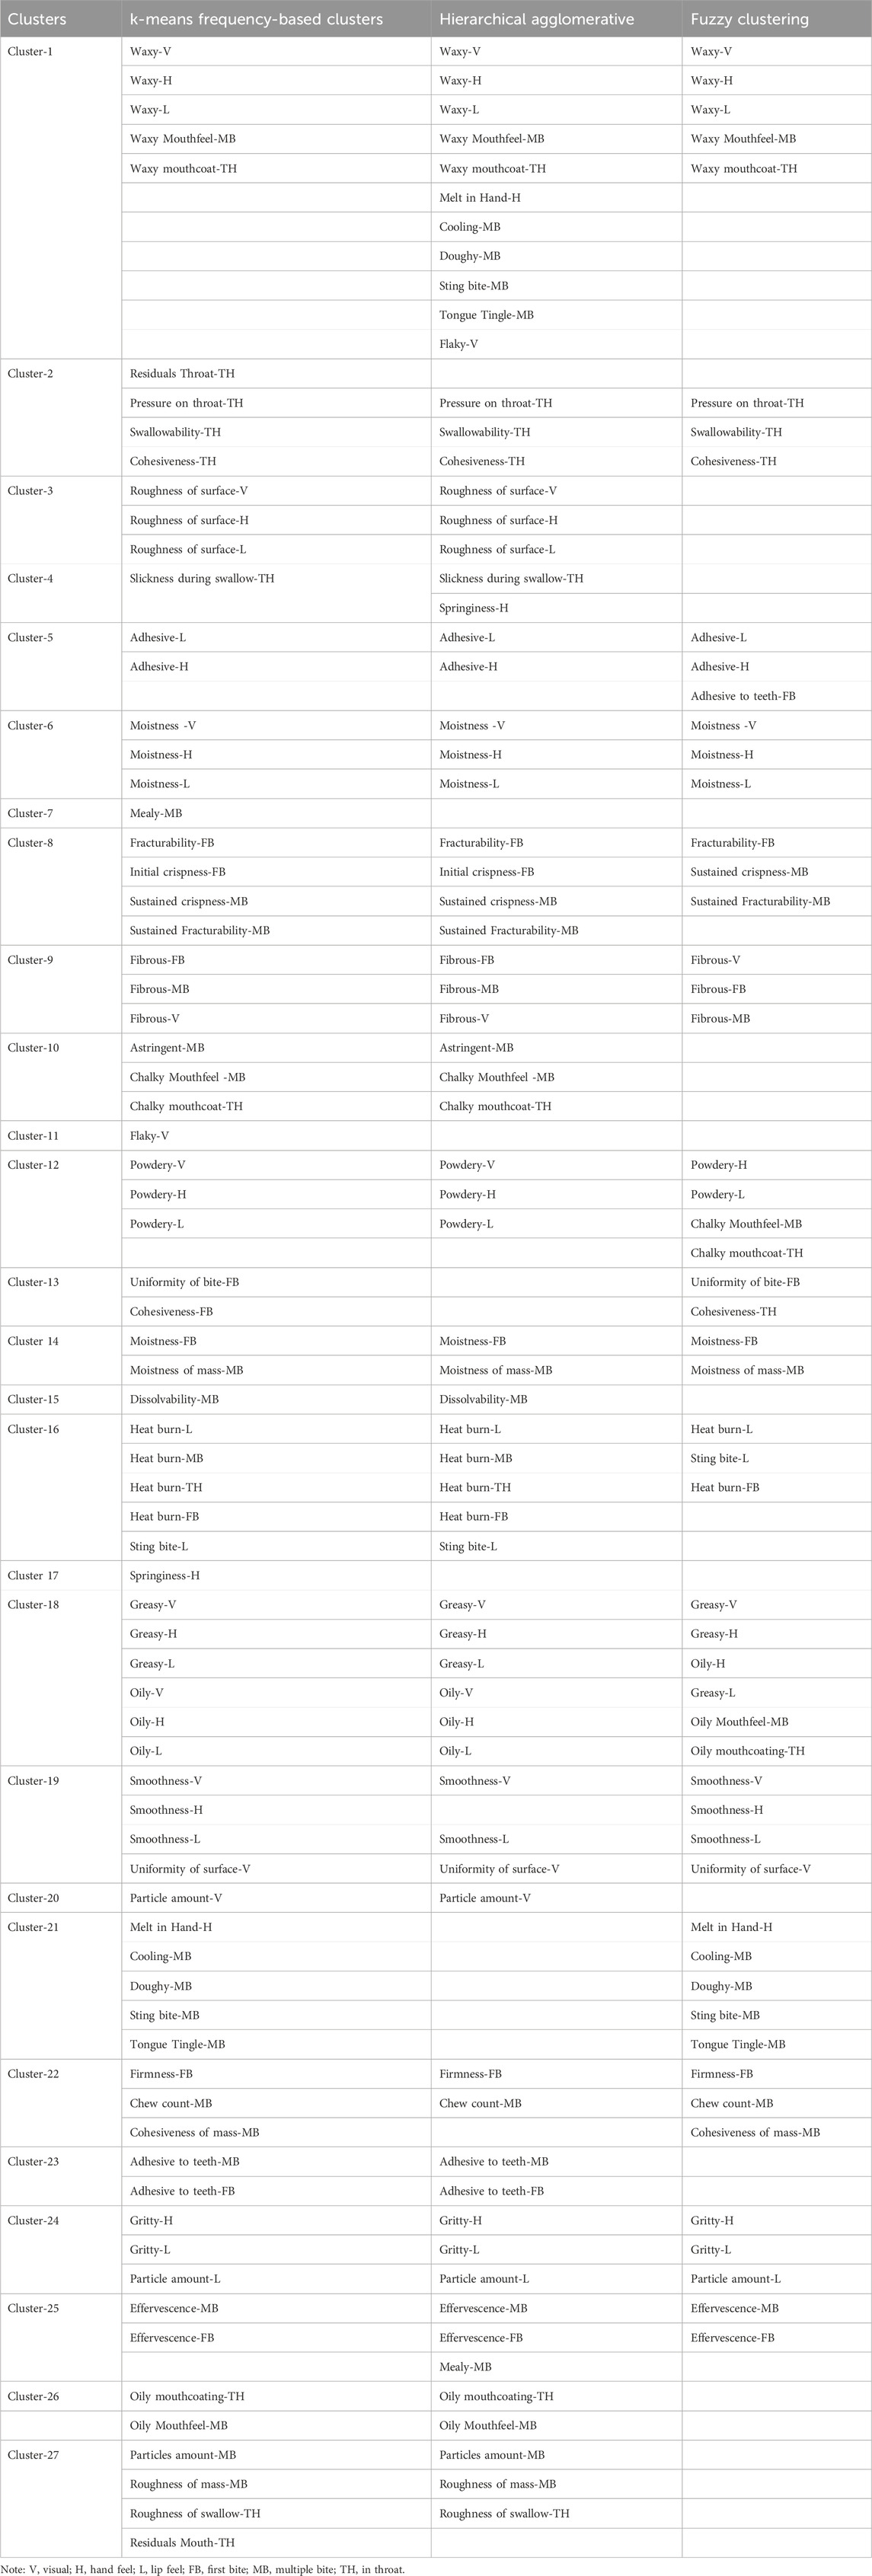
Table 3. Comparison of the k-means, hierarchical agglomerative, and fuzzy clustering approach cluster results.
Six clusters (1, 2, 19, 22, 25, and 27) had either additional attributes joining the cluster or attributes moved out of the cluster (Table 3). The changing attributes of these six clusters can be termed as dominant attributes in cases where they mostly remained independent and form single attribute clusters. Sensory attributes that constantly changed irrespective of clustering method can be called changing attributes. The clusters formed by these changing attributes are unreliable, lack stability and repeatability. The percentage of dissimilarity between the KM and HAC was 44% percent, which cannot be understood until results from both clustering approaches are compared. Researchers can adopt this methodology in their solutions to classify clusters as true clusters and changing clusters (Denis, 2020).
Correlation coefficient and k-means frequency based manual clustering
The attributes clustered by the KM approach were investigated for their correlation coefficients. A scatterplot was generated to examine the relationship between frequency of clustering and correlation values (Figure 6). It was found that few attributes had very high frequency of clustering (30) but had correlation values varying from low to high. Example, waxy-V and waxy mouth coat-TH were clustered in all KM solutions (30) but had moderate correlation (0.54), waxy mouthfeel-MB and waxy mouth coat-TH clustered in all KM solutions but had very high correlation (0.97), and cooling-MB and tongue tingle-MB clustered in all KM solutions but were negatively correlated (−0.04). This study presents strong evidence of no relationship between KM cluster solutions and correlation coefficients (Figure 6).
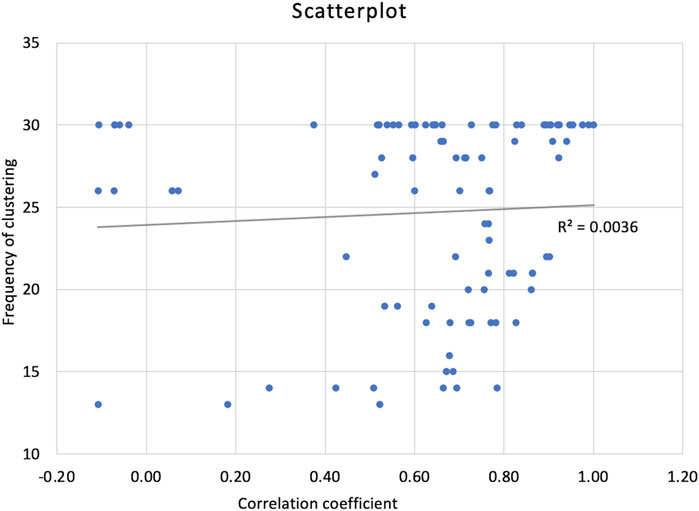
Figure 6. Scatter plot representing frequency of occurrence attribute clustering together in k-means method and correlation coefficient.
Fuzzy clustering
The mean degree of membership for each attribute produced by using a fuzzy c-means algorithm is represented in Figure 7. The mean degree of membership ranged from 0.963 to 0.453, and the highest degree of membership of all attributes ranged from 0.997 to 0.71 and the minimum ranged from 0.025 to 0.001. Because of the large range of mean values, it was difficult to identify which association to use in a final cluster solution.
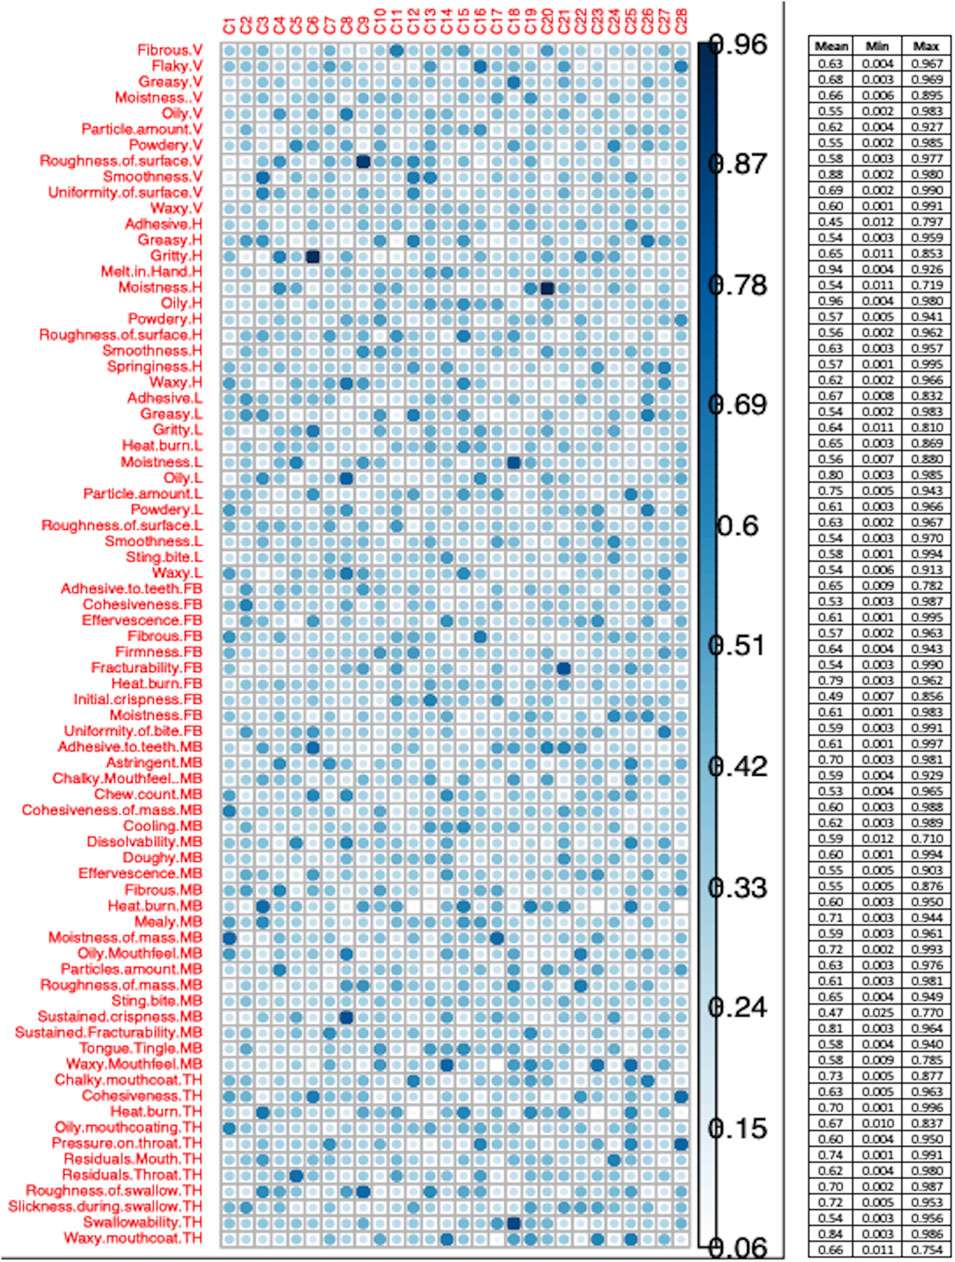
Figure 7. Mean degree of membership for each attribute obtained by c-means fuzzy. A small table attached to the figure represents mean, max and min for each attribute to the corresponding cluster. Note: V, visual; H, hand feel; L, lip feel; FB, first bite; MB, multiple bite; TH, in throat.
The range of degree of membership for each attribute to clusters also was large. For example, Fibrous-V had a mean (0.63), max (0.967) and min (0.004) degree of membership with cluster-11 (Figure 7). A similar pattern was noticed for other attributes. The degree of association for attribute to clusters kept changing on every run, resulting in a large range of mean values. Few cluster solutions were repeated more often than others, five FC solutions are presented as an example in Figures 8A–E. The most frequent FC solution was compared with the KM frequency-based manual cluster solution in Table 3.
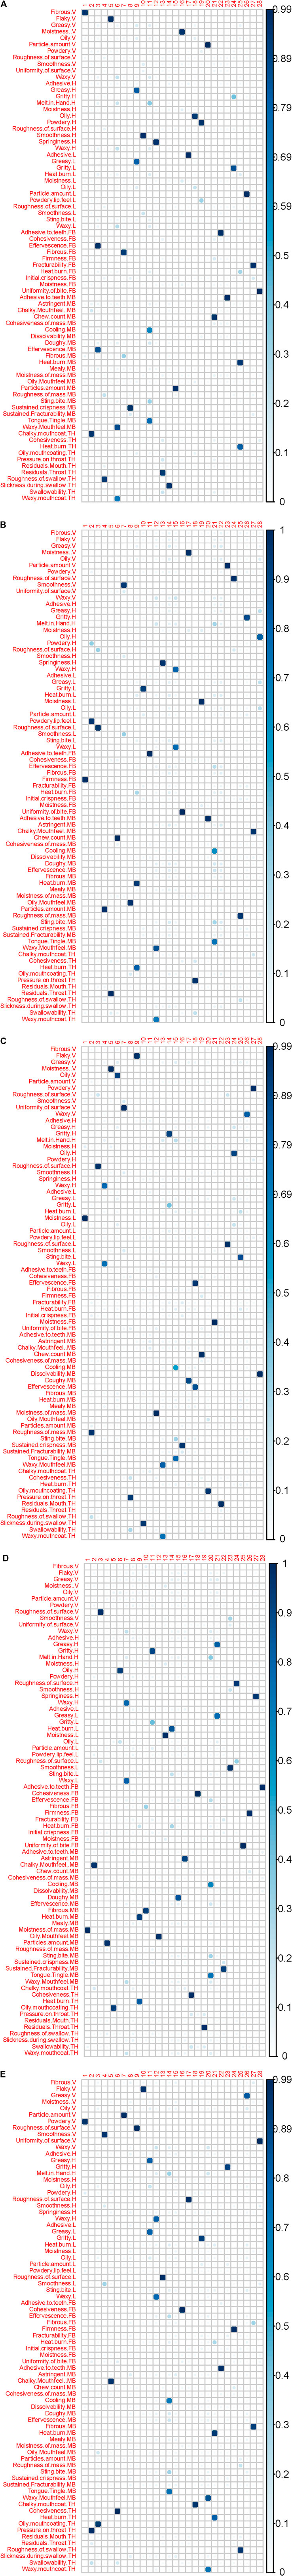
Figure 8. (A–E): Fuzzy cluster presented as examples. Note: V, visual; H, hand feel; L, lip feel; FB, first bite; MB, multiple bite; TH, in throat.
Comparison between fuzzy clustering and k-means frequency-based manual clustering
Only 45% of the cluster were alike between the FC and KM solution. Twelve clusters (1, 5, 6, 9, 13, 14, 18, 19, 21, 22, 24, and 25) were identical (Table 3), and four clusters (2, 8, 12, 16) had either one or more than one attribute changing its association with clusters. The cluster results from the KM approach only translate at a meagre 45% in the fuzzy approach, which means the dissimilarity between clustering solutions was high (55%).
Discussion
Fifty six percent clusters were alike between the KM and HAC, and 45% between KM and fuzzy. Some clusters were completely different, but some clusters had similarities. No method produced the same clusters. Results showed that having common attributes and different attributes in each cluster is dependent on the approach used. For example, cluster-1 produced by MC, was different for HAC, but was similar in FC’s most repeated solution.
Evidence produced in this study suggests that algorithms (methods) used to determine clusters had a significant impact on clustering solutions as noted by Denis (2020). HAC Ward’s method assigns an object to a cluster that minimizes the squared Euclidean distance to the cluster mean. In contrast, KM partitions objects into a predefined cluster number, and then assigns each object to the cluster whose centroid is closet (Næs et al., 2018; Denis, 2020). The cluster arrangement is always dependent of the method used (Yenket et al., 2011; Yenket and Chambers, 2017). The clusters that are alike in all three methods or at least in KM and HAC likely are true clusters and, therefore, can confidently become a part of final results perspective. James et al. (2013) also concluded that consistent clusters obtained from multiple methods can become part of a final clustering solution.
Each clustering method has advantages and limitations. The KM clustering is hard partitioning where each object belongs to only one cluster but obtaining stability in results is challenging. The one advantage this study applied by using KM approach is producing clustering frequency matrix for 30 KM solutions. The frequency matrix helped to reorganize the clusters manually. Researchers can use a frequency matrix to identify strong, moderate, and weak associations of objects to corresponding clusters. While performing KM clustering, it is advised to run the algorithms until 1) stability is reached, 2) identify true and changing clusters, 3) obtain frequency of clustering, and 4) return to original data to see if results can be explained logically. For the KM approach, true clusters would be the ones with the highest frequency of clustering, but result must be compared with cluster solutions obtained other methods to ensure that the frequency is set to a high enough threshold.
Vigneau et al. (2016); Wajrock et al. (2008), concluded that “partitioning methods outperform hierarchical methods”. The conclusion may be true for consumer studies with specific types of data. However, this study results do not support that conclusion, especially for descriptive data with large number of variables. The KM method is sensitive to noise, and thus, not efficient with high dimensional data (Næs et al., 2018).
The HAC methods are widely used in sensory studies and the graphical representation of clusters by HC dendrograms or trees allows the visualization of clusters which facilitates the interpretation of results (Zielinski et al., 2014). The potential limitations of HAC are, 1) overlapping of clusters, 2) variety of linkage methods yield nonunique cluster solutions, 3) once merged, objects cannot be reallocated, 4) does not always recover true clusters, and 5) does not offer any mechanism to assess if clusters are stable or changing (Wajrock et al., 2008; James et al., 2013; Næs et al., 2018; Denis, 2020).
In practice, it is recommended to start with HAC beforehand, to help select the number of clusters (k) to begin using KM. The scree plot generated by HAC approach can aid in deciding the initial number of clusters (Wilderjans and Cariou, 2016). The KM algorithm seeds the clusters randomly and repositions the random seeding to a different place for every iteration. The researchers could run the KM algorithm iteratively until stability is reached. However, this study provides evidence that reaching stability may not be possible with descriptive data and additional or alternative methods may be needed. Thus, other applied statistics tools should be used (i.e., MC based on frequency of clustering or some other technique) to determine stability in cluster solutions (Yenket et al., 2011). Studies have suggested several other tools that may help to decide numbers of clusters and stability in cluster patterns. For example, aggregation criterion evolution plots (Vigneau and Qannari, 2002), variability plots (Kumar and Chambers, 2019), a combination of factor analysis, HAC and KM (Müller and Hamm, 2014), and a combination of PCA and HAC (Juárez-Barrientos et al., 2019).
Correlation coefficients do not have any clear relationship with object’s clusters (Figure 6). For example, in MC cluster 9, 10 and 21 (Table 2), the frequency of clustering was between 26 and 30, but the correlation values varied from −0.07 to 0.92. This trend of varying correlation values is also true for strong associations in cluster-1 (Table 2). Therefore, researchers should not use correlation coefficients as a tool to validate true or natural clusters. Granato et al. (2018), concluded that correlation values and HAC cluster results are not related.
A large range of degree of membership was produced by FC. Only 45% fuzzy clusters were comparable to the KM clusters. Even after running the algorithms for 100 times with 1,000 iteration for each run, the mean degree of membership does not help to distinguish true and changing clusters. The various cluster solutions in Figures 8A–E, indicates that FC is likely to give spurious cluster solutions. Westad et al. (2004) also reported a high risk of finding erroneous consumer clusters in FC.
The comparison of frequency-based MC, HAC and fuzzy clusters indicates that cluster solution based on frequency matrix yielded more common clusters (15) with HAC (Table 3). Six other clusters (1, 2, 19, 22, 25, and 27) were not completely similar but certainly had more commonality than fuzzy clustering (Table 3). The evidence suggests that KM and HAC did a better job of obtaining similar clusters than fuzzy.
Clearly, none of the individual approaches can be termed as the best approach. HAC aids in deciding the initial number of clusters (k) that researchers can use to begin and explore partitioning methods. The KM provided an advantage in developing a frequency matrix for MC, to help identify true and changing clusters. Both KM and HAC helped to identify common clusters. The fuzzy approach showed that an object’s degree of membership to a particular cluster may vary greatly and there likely will always be a few objects that are going to have very high degree of membership. However, the degree of membership changed on every algorithm run. Thus, researchers must try different clustering methods to determine what works best for their data and study objectives.
The findings of this study are limited because they are based on a specific descriptive data set. However, that data set easily shows the fallacy of researchers using only one cluster analysis technique to determine grouping. Thus, researchers are advised not to use one clustering method as a “fits all” approach. The application of this study results may vary from case to case.
Conclusion
Application of clustering methodology is a common phenomenon in sensory studies. Different methods are used to determine clusters but there is no agreed upon or common set of rules concerning which method to use, the exact number of clusters or which linkage is best. Clustering is inherently subjective, depends on the choices made by investigators, and those choices can significantly change cluster results. Results of this study demonstrated that none of the clustering methods (KM, HAC, and fuzzy) can be said to be the best approach. Each method has its advantages and limitations. For example, HAC does not need initialization to begin, helps to visualize clusters, and scree plot assist to find an initial number of clusters. The KM could be used to obtain non-overlapping clusters. The clustering frequency matrix produced from KM solutions was helpful in determining stable and changing objects in the clusters. Also, the frequency matrix helped to identify associations in terms of strong, moderate, and weak. A clustering frequency matrix can be used to perform manual clustering. In practice, researchers should try several different methods, compare cluster results, run algorithms for multiple iterations, focus on finding homogenous and repeatable clusters, and look for one with the most useful or interpretable solution. Mere, use of one clustering method in all sensory studies probably is inappropriate.
Data availability statement
The datasets presented in this article are not readily available because the raw data is confidential, and qualify as an intellectual property of Kansas State University. Requests to access the datasets should be directed to a3JhamVzaEBrc3UuZWR1, ZWNpdkBrc3UuZWR1.
Author contributions
RK: Conceptualization, Data curation, Formal Analysis, Investigation, Methodology, Project administration, Software, Validation, Visualization, Writing–original draft. EC: Resources, Supervision, Writing–review and editing.
Funding
The author(s) declare that no financial support was received for the research, authorship, and/or publication of this article.
Conflict of interest
The authors declare that the research was conducted in the absence of any commercial or financial relationships that could be construed as a potential conflict of interest.
Publisher’s note
All claims expressed in this article are solely those of the authors and do not necessarily represent those of their affiliated organizations, or those of the publisher, the editors and the reviewers. Any product that may be evaluated in this article, or claim that may be made by its manufacturer, is not guaranteed or endorsed by the publisher.
References
Bedalli, E., Mançellari, E., and Asilkan, O. (2016). A heterogeneous cluster ensemble model for improving the stability of fuzzy cluster analysis. Procedia Comput. Sci. 102 (August), 129–136. doi:10.1016/j.procs.2016.09.379
Chambers, D. H., Chambers IV, E., and Johnson, D. (2005). “Flavor description and classification of selected natural cheeses,” in Culinary arts and Sciences V: global and national perspectives. Editors J. S. A. Edwards, B. Kowrygo, and K. Rejman (Bournemouth, UK: Worshipful Company of Cooks Research Centre, Bournemouth University), 641–654.
Chambers, E., Sanchez, K., Phan, U. X. T., Miller, R., Civille, G. V., and Di Donfrancesco, B. (2016). Development of a “living” lexicon for descriptive sensory analysis of brewed coffee. J. Sens. Stud. 31 (6), 465–480. doi:10.1111/joss.12237
Denis, D. J. (2020). Univariate, bivariate, and multivariate statistics using R. Univariate, bivariate, and multivariate statistics using R. Hoboken, NJ, USA: Wiley. doi:10.1002/9781119549963
Dolnicar, S., and Gruun, B. (2011). “Three good reasons NOT to use factor-cluster segmentation,” in Proceedings of the 21st CAUTHE national conference, Adelaide, Australia.
Donfrancesco, B., Gutierrez Guzman, N., and Chambers, E. (2019). Similarities and differences in sensory properties of high quality Arabica coffee in a small region of Colombia. Food Res. Int. 116, 645–651. doi:10.1016/j.foodres.2018.08.090
Endrizzi, I., Gasperi, F., Rødbotten, M., and Næs, T. (2014). Interpretation, validation and segmentation of preference mapping models. Food Qual. Prefer. 32 (PA), 198–209. doi:10.1016/j.foodqual.2013.10.002
Endrizzi, I., Menichelli, E., Johansen, S. B., Olsen, N. V., and Næs, T. (2011). Handling of individual differences in rating-based conjoint analysis. Food Qual. Prefer. 22 (3), 241–254. doi:10.1016/j.foodqual.2010.10.005
Godoy, R. C. B., Chambers, E., and Yang, G. (2020). Development of a preliminary sensory lexicon for mate tea. J. Sens. Stud. 35 (3). doi:10.1111/joss.12570
Granato, D., Santos, J. S., Escher, G. B., Ferreira, B. L., and Maggio, R. M. (2018). Use of principal component analysis (PCA) and hierarchical cluster analysis (HCA) for multivariate association between bioactive compounds and functional properties in foods: a critical perspective. Trends Food Sci. Technol. 72, 83–90. doi:10.1016/j.tifs.2017.12.006
Grygorczyk, A., Jenkins, A. E., and Bowen, A. J. (2019). No rose without a thorn: hedonic testing of live rose plants. J. Sens. Stud. 34 (5). doi:10.1111/joss.12526
Horn, B., and Huang, W. (2009). Comparison of segmentation approaches. Arlington, TX: Decision Analyst.
Jacobsen, T., and Gunderson, R. W. (1986). “Applied cluster analysis,” in Statistical procedures in food research. Editor J. R. Piggott (New York, NY, USA: Elsevier Science Publishing), 361–408.
James, G., Witten, D., Hastie, T., and Tibshirani, R. (2013). An introduction to statistical learning. New York, NY, USA: Springer New York. doi:10.1007/978-1-4614-7138-7
Juárez-Barrientos, J. M., de Montserrat Tejeda-Paz, M., de Jesús Ramírez-Rivera, E., Aguirre-Cruz, A., Rodríguez-Miranda, J., Martínez-Sánchez, C. E., et al. (2019). Use of quantitative descriptive analysis (QDA) coupled with multivariate statistical methods to detection and discrimination of adulterated fresh cheeses. J. Sens. Stud. 34 (1), 1–8. doi:10.1111/joss.12479
Kumar, R., and Chambers, E. (2019). Lexicon for multiparameter texture assessment of snack and snack-like foods in English, Spanish, Chinese, and Hindi. J. Sens. Stud. 34, e12500. doi:10.1111/joss.12500
Meilgaard, M. C., Thomas Carr, B., and Vance Civille, G. (1999). Sensory evaluation techniques. Boca Raton, FL, USA: CRC Press.
Müller, H., and Hamm, U. (2014). Stability of market segmentation with cluster analysis - a methodological approach. Food Qual. Prefer. 34, 70–78. doi:10.1016/j.foodqual.2013.12.004
Myers, J. H., and Mullet, G. M. (2003). Managerial applications of multivariate analysis in marketing. Chicago, IL, USA: American Marketing Association.
Næs, T., Varela, P., and Berget, I. (2018). Individual differences in sensory and consumer science. New York, NY, USA: Elsevier. doi:10.1016/C2015-0-05919-6Individual differences in sensory and consumer science
Pierguidi, L., Spinelli, S., Dinnella, C., Prescott, J., and Monteleone, E. (2020). Liking patterns moderate the relationship between sensory, emotional and context appropriateness profiles: evidences from a Global Profile study on alcoholic cocktails. Food Qual. Prefer. 83 (December 2019), 103904. doi:10.1016/j.foodqual.2020.103904
Prell, P. A., and Sawyer, F. M. (1988). Flavor profiles of 17 species of north atlantic fish. J. Food Sci. 53, 1036–1042. doi:10.1111/j.1365-2621.1988.tb13524.x
Qannari, E. M. (2017). Sensometrics approaches in sensory and consumer research. Curr. Opin. Food Sci. 15, 8–13. doi:10.1016/j.cofs.2017.04.001
Saint-Eve, A., Granda, P., Legay, G., Cuvelier, G., and Delarue, J. (2019). Consumer acceptance and sensory drivers of liking for high plant protein snacks. J. Sci. Food Agric. 99 (8), 3983–3991. doi:10.1002/jsfa.9624
Sauvageot, N., Schritz, A., Leite, S., Alkerwi, A., Stranges, S., Zannad, F., et al. (2017). Stability-based validation of dietary patterns obtained by cluster analysis. Nutr. J. 16 (1), 4–13. doi:10.1186/s12937-017-0226-9
Sharma, C., Jayanty, S. S., Chambers, E., and Talavera, M. (2020). Segmentation of potato consumers based on sensory and attitudinal aspects. Foods 9 (2), 161. doi:10.3390/foods9020161
Simons, T., McNeil, C., Pham, V., Slupsky, C., and Guinard, J. X. (2019). Comparison of preference clustering outcomes from replicated consumer tests—a case study with mandarins. J. Sens. Stud. 34 (6). doi:10.1111/joss.12537
Tleis, M., Callieris, R., and Roma, R. (2017). Segmenting the organic food market in Lebanon: an application of k-means cluster analysis. Br. Food J. 119 (7), 1423–1441. doi:10.1108/BFJ-08-2016-0354
Tran, T., James, M. N., Chambers, D., Koppel, K., and Chambers, E. (2019). Lexicon development for the sensory description of rye bread. J. Sens. Stud. 34 (1), e12474. doi:10.1111/joss.12474
Vigneau, E., Charles, M., and Chen, M. (2014). External preference segmentation with additional information on consumers: a case study on apples. Food Qual. Prefer. 32, 83–92. doi:10.1016/j.foodqual.2013.05.007
Vigneau, E., and Qannari, E. M. (2002). Segmentation of consumers taking account of external data. A clustering of variables approach. Food Qual. Prefer. 13 (7–8), 515–521. doi:10.1016/S0950-3293(02)00048-4
Vigneau, E., Qannari, E. M., Navez, B., and Cottet, V. (2016). Segmentation of consumers in preference studies while setting aside atypical or irrelevant consumers. Food Qual. Prefer. 47, 54–63. doi:10.1016/j.foodqual.2015.02.008
Wajrock, S., Antille, N., Rytz, A., Pineau, N., and Hager, C. (2008). Partitioning methods outperform hierarchical methods for clustering consumers in preference mapping. Food Qual. Prefer. 19 (7), 662–669. doi:10.1016/j.foodqual.2008.06.002
Wedel, M., and Kamakura, W. A. (2000). Market segmentation. Boston, MA, USA: Springer. doi:10.1007/978-1-4615-4651-1
Westad, F., Hersleth, M., and Lea, P. (2004). Strategies for consumer segmentation with applications on preference data. Food Qual. Prefer. 15 (7-8 SPEC.ISS.), 681–687. doi:10.1016/j.foodqual.2004.04.004
Wilderjans, T. F., and Cariou, V. (2016). CLV3W: a clustering around latent variables approach to detect panel disagreement in three-way conventional sensory profiling data. Food Qual. Prefer. 47, 45–53. doi:10.1016/j.foodqual.2015.03.013
Yenket, R., and Chambers, E. (2017). Influence of cluster analysis procedures on variation explained and consumer orientation in internal and external preference maps. J. Sens. Stud. 32 (5), 1–11. doi:10.1111/joss.12296
Yenket, R., Chambers, E., and Johnson, D. E. (2011). Statistical package clustering may not be best for grouping consumers to understand their most liked products. J. Sens. Stud. 26 (3), 209–225. doi:10.1111/j.1745-459X.2011.00337.x
Zielinski, A. A. F., Haminiuk, C. W. I., Nunes, C. A., Schnitzler, E., van Ruth, S. M., and Granato, D. (2014). Chemical composition, sensory properties, provenance, and bioactivity of fruit juices as assessed by chemometrics: a critical review and guideline. Compr. Rev. Food Sci. Food Saf. 13 (3), 300–316. doi:10.1111/1541-4337.12060
Keywords: sensory, clustering, HAC (hierarchical agglomerative clustering), k-means, fuzzy-C means
Citation: Kumar R and Chambers E IV (2024) Unreliability of clustering results in sensory studies and a strategy to address the issue. Front. Food. Sci. Technol. 4:1271193. doi: 10.3389/frfst.2024.1271193
Received: 01 August 2023; Accepted: 22 March 2024;
Published: 10 April 2024.
Edited by:
Claudia Gonzalez Viejo, The University of Melbourne, AustraliaReviewed by:
Shogo Okamoto, Tokyo Metropolitan University, JapanRaúl Villarreal-Lara, Monterrey Institute of Technology and Higher Education (ITESM), Mexico
Copyright © 2024 Kumar and Chambers. This is an open-access article distributed under the terms of the Creative Commons Attribution License (CC BY). The use, distribution or reproduction in other forums is permitted, provided the original author(s) and the copyright owner(s) are credited and that the original publication in this journal is cited, in accordance with accepted academic practice. No use, distribution or reproduction is permitted which does not comply with these terms.
*Correspondence: Edgar Chambers IV, ZWNpdkBrc3UuZWR1