 Laura Hottenrott
 Thomas Gronwald
 Kuno Hottenrott
 Thimo Wiewelhove
 Alexander Ferrauti
- 1Department of Training and Exercise Science, Faculty of Sports Science, Ruhr University Bochum, Bochum, Germany
- 2Department of Performance, Neuroscience, Therapy and Health, Faculty of Health Sciences, Medical School Hamburg, Hamburg, Germany
- 3Institute of Sports Science, Department of Training Science and Sports Medicine, Martin-Luther-University Halle-Wittenberg, Halle, Germany
Background: Viral diseases have different individual progressions and can lead to considerable risks/long-term consequences. Therefore, it is not suitable to give general recommendations on a time off from training for athletes. This case report aims to investigate the relevance of detecting heart rate (HR) and HR variability (HRV) during an orthostatic test (OT) to monitor the progression and recovery process during and after a viral disease in an elite endurance athlete.
Methods: A 30-year-old elite marathon runner contracted a viral infection (upper respiratory tract infection) 4 weeks after a marathon race. RR intervals in HR time series in supine and standing positions were monitored daily in the morning. Analyzed parameters included HR, the time-domain HRV parameter root mean square of successive difference (RMSSD), peak HR (HRpeak) in a standing position, and the time to HR peak (tHRpeak).
Results: During the 6-day viral infection period, HR increased significantly by an average of 11 bpm in the supine position and by 22 bpm in the standing position. In addition, the RMSSD decreased from 20.8 to 4.2 ms, the HRpeak decreased by 13 bpm, and the tHRpeak increased by 18 s in the standing position significantly. There were no significant changes in the pre-viral infection RMSSD values in the supine position. The viral infection led to a significant change in HR and HRV parameters. The cardiac autonomic system reacted more sensitively in the standing position compared to the supine position after a viral infection in the present case study.
Conclusion: These data have provided supportive rationale as to why the OT with a change from supine to standing body position and the detection of different indicators based on HR and a vagal driven time-domain HRV parameter (RMSSD) is likely to be useful to detect viral diseases early on when implemented in daily routine. Given the case study nature of the findings, future research has to be conducted to investigate whether the use of the OT might be able to offer an innovative, non-invasive, and time-efficient possibility to detect and evaluate the health status of (elite endurance) athletes.
Introduction
With the pandemic spread of the novel coronavirus (SARS-CoV-2) that causes coronavirus disease 2019 (COVID-19; World Health Organization, 2020), healthcare professionals and coaches are faced with an increasing number of athletes seeking advice on when and how to restart training after recovery from viral diseases. This is challenging, as practical and evidence-based recommendations for a return to sports after infectious episodes are limited and heterogeneous. Preliminary approaches regarding COVID-19 provide symptom-based decision schemes to make recommendations for additional assessment and intervention measures (Nieß et al., 2020; Schnellhorn et al., 2020). It is the aim of this case report to investigate the relevance of detecting heart rate (HR) and HR variability (HRV) during an orthostatic test (OT) to monitor the progression and recovery process during and after a viral disease in an elite endurance athlete.
Due to the negative effects on health status and performance capacity, viral infections in sports must be detected early and physical exercise is not recommended in the case of a viral infection (Roberts, 1986). Especially, myocarditis is a significant cause of sudden cardiac death and sudden cardiac arrest (SCD/SCA) in athletes (Harmon et al., 2016) with case series reporting myocarditis as a potential source of SCD/SCA in up to 8% (Halle et al., 2020). In this regard, it is important to find very early indicators and sensitive markers (ideally before the onset of symptoms) that are practicable and can map the course of viral disease and recovery for detailed control diagnostics. According to Friman and Wesslén (2000), fever (>38°C or 0.5–1° higher than usual) and an increased resting heart rate (>10 bpm higher than normal) are contraindications for physical training. Therefore, deciding on the right time to restart training is essential (Dores and Cardim, 2020). Long breaks in physical training are critical for performance development in elite athletes; too short breaks in the case of viral infection can cause a relapse and incomplete curing of an infection can lead to severe health risks (Verwoert et al., 2020).
The scientific community is working on the topic of how to optimize the time to return to sports after a viral infection and which diagnostic indicators could support decision making (Dores and Cardim, 2020; Nieß et al., 2020; Schnellhorn et al., 2020; Verwoert et al., 2020). Viral infections affect the cardiovascular system and lead to an increased resting heart rate (HR) in the presence of fever (Karjalainen and Viitasalo, 1986). Acute upper respiratory tract infections (URTIs), including influenza, respiratory syncytial virus, and bacterial pneumonias, are well-recognized triggers for cardiovascular diseases (Cowan et al., 2018). The emergence of SARS-CoV-2 has rapidly grown into a pandemic and practical parameters for daily health monitoring are necessary. A large proportion of affected patients have been reported to have underlying cardiovascular diseases, and myocardial infarctions were noted to occur after an infection (Madjid et al., 2020). A recent case study on cardiovascular changes occurring during an infection with COVID-19 shows that heart rate variability (HRV) decreases but HR does not increase at rest (Buchhorn et al., 2020). Thus, it is not sufficient to only examine resting HR, but further parameters are required for a differential analysis.
For athletes and coaches, it is essential to perform detailed health monitoring in conjunction with performance monitoring to ensure a very early detection of a viral infection and to guarantee a safe return to training (Hagen et al., 2020). For the control of physical load, athletes often use HR and HRV measurements to individualize the training load and to detect symptoms of overtraining at an early stage (Uusitalo et al., 2000; Buchheit, 2014; Plews et al., 2014; Hottenrott and Hoos, 2017). To the best of our knowledge, no study has examined HR and HRV measurements in elite athletes to monitor health status during and after a viral infection and to individualize return to training.
Cardiac vagal control reflects the activity of the vagus nerve regulating cardiac functioning and can be inferred via HRV measurements (Laborde et al., 2018; Schneider et al., 2018). Most often, HRV analysis is derived from resting data in a single supine or sitting position. However, some studies show that RR measurements in a single resting position are not sufficient to detect training-induced fatigue in athletes (Buchheit, 2014; Plews et al., 2014; Bellenger et al., 2016a,b). A passive head-up tilt test in supine and upright positions results in specific changes in the spectral characteristics of HRV as a result of reduced vagal and enhanced sympathetic outflow and gives valuable indications that a change of body position can lead to additional information about regulation patterns of the cardiac autonomic system (Tulppo et al., 2001). An active switching from the supine to the upright position imposes stress by gravitational pooling of the blood in the splanchnic venous reservoir and leg veins (Stewart et al., 2006). Consequently, the autonomic nervous system is required to maintain the hemodynamic to avoid cerebral hypoperfusion. From supine to standing, HR increases (RR intervals become shorter) and high frequency power (parasympathetic) is depressed compared to supine, whereas low frequency power (partially sympathetic) increases (Aubert et al., 2003).
An orthostatic test (OT) provides a practical method for the detection of overload and overtraining in athletes and can be used to assess the autonomic nervous system's response to physical exercise and training (Le Meur et al., 2013; Buchheit, 2014; Plews et al., 2014; Schneider et al., 2019; Barrero et al., 2020). In addition, changes in body position can provoke specific responses in HR dynamics and could therefore provide more specific information about autonomic nervous system regulation patterns (Tulppo et al., 2001). During orthostatic tolerance assessment, HRV patterns in both supine and standing positions are affected by the different involvement of cardiopulmonary receptors, i.e., cardiac preload, and hence, tuned changes in plasma volume and/or peripheral vasomotor tone. Among other factors, these parameters likely support changes in autonomic patterns and HRV also during different training loads and phases (Schmitt et al., 2015). For precise analysis, monitoring in athletes should not be limited to the measurement of cardiac autonomic function in just one body position but should consider assessing the response in two different body positions (e.g., supine and standing) (Buchheit, 2014; Schmitt et al., 2015; Ravé and Fortrat, 2016; Hottenrott and Hoos, 2017; Hottenrott et al., 2019).
Figure 1 displays the temporal course of the heart rate in healthy athletes with uncompromised performance during the OT. The HR is low in the supine position and rises rapidly during active standing-up. In the supine position, the efferent vagal activity often calculated with the parameter root mean square of successive differences (RMSDD) is much higher than in the standing position (Bellenger et al., 2016a). After active standing-up, the HR will reach the first peak (HRpeak) after 15–20 s (Flachenecker, 2000; Rooke and Sparks, 2003). The rate of heart rate increase from rest to exercise or supine to standing is another parameter providing information about the cardiac autonomic system to detect training-induced fatigue (Nelson et al., 2014; Bellenger et al., 2016a,c). Thereafter, a counter-regulation with a rapid decrease of the HR occurs, before the HR rises again and stabilizes in the standing position. When there is high circulation stability, HR in the standing position remains higher than the HR in the supine position. The average HR in the standing position of healthy and non-fatigued athletes is on average 10–20 bpm higher than the HR at rest in the supine position (Aubert et al., 2003; Hottenrott and Hoos, 2017). Standing also induces a three- to four-fold decrease of vagal HRV indices compared to the supine position (Aubert et al., 2003; Hottenrott and Hoos, 2017).
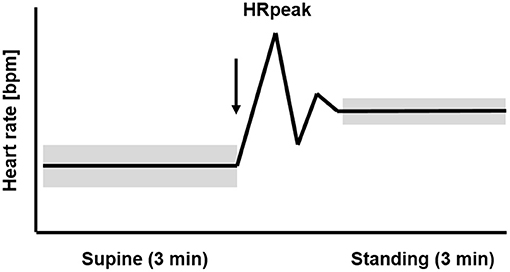
Figure 1. Temporal course of the heart rate (HR) and heart rate variability (HRV) during 3 min supine position followed by 3 min standing position (orthostatic test, including HRpeak) in healthy athletes with uncompromised performance. The arrow marks the change in body position from supine to standing up. The widths of the bars represent the higher HRV in the supine than the standing position (mod. Hottenrott and Hoos, 2017).
Viral diseases (e.g., influenza, Epstein-Barr virus, coronavirus) have different individual progressions (Polak et al., 2020) and can lead to considerable risks/long-term consequences. Therefore, it is not suitable to give general recommendations on time off from training for athletes. The severity of the disease and the course of the recovery process can be very individual. In athletes, viral diseases are usually mild and are often not taken seriously, although considerable risks/long-term consequences can nevertheless occur if training is continued during the infection (Roberts, 1986). Regarding daily monitoring with the OT, it is expected that a viral infection with the presence of fever will lead to an increase in supine resting heart rate and affect the overall cardiac autonomic system (Karjalainen and Viitasalo, 1986; Polak et al., 2020).
It is the aim of the present case report to display how the OT, which is based on the detection of RR intervals in heart rate time series in supine and standing positions, can monitor the progression and recovery process before, during, and after a viral disease in a high-performance endurance athlete providing immediate day-to-day feedback about autonomic nervous system recovery status.
Methods
Participant
The participant is a 30-year-old male elite marathon runner with a personal best time in the marathon of 2:18 h. He has competed in the sport of running since he was 13 years. He has a resting HR of 47 bpm, a maximal HR of 188 bpm, and a VO2max of 71 ml/kg/min and receives medical clearance in a sports medical check-up annually. The athlete's training is monitored routinely throughout the entire year and he performs an OT daily (Figure 1). The participant contracted an upper respiratory tract infection (URTI, diagnosed by a physician) 4 weeks after running a marathon race in 2:21 h. He had intense flu symptoms for 6 days and fever between 38.5° and 39.3°C for 3 days on days 13, 14, and 15; he did not take any fever-lowering medication. Clinical diagnostics were not accompanied by laboratory diagnostics.
The participant provided informed consent in accordance with the institutional review board and the guidelines of the Helsinki World Medical Association Declaration.
Measurements
Ten days before (pre), during, and 10 days after (post) the viral infection, a daily (after a night's sleep) orthostatic test (OT) and a position change test with 3 min in the supine and 3 min in the standing position were performed (Bourdillon et al., 2017; Hottenrott and Hoos, 2017). The recordings were taken in the supine position without a given breathing rhythm after the morning visit to the restroom. The OT was performed with continuous beat-to-beat recording of the heart rate (RR measurement with V800 and H10 sensor, Polar Electro GmbH, Finland, Gilgen-Ammann et al., 2019). The calculated parameters of the OT included HR and the vagal time-domain HRV parameter RMSSD in supine and standing positions as well as the peak HR (HRpeak) and time to HR peak (tHRpeak) in the standing position. Daily the athlete recorded his training and recorded information about his state of health, especially about symptoms of illness.
Data Analysis and Statistics
The calculation of the RR data from the OT was performed with the Kubios HRV Premium Software (Version 3.4.1, Tarvainen et al., 2014). The RMSSD was calculated for 2 min in the supine and 2 min in standing position. The first of the 3 min in the supine position was not used for data analysis but served for physiological stabilization (Bourdillon et al., 2017; Hottenrott and Hoos, 2017). The smallest worthwhile change (SWC) in standing RMSSD from baseline was deemed as 0.5 of the individual baseline coefficient variation (CV) (Plews et al., 2013; Buchheit, 2014) from the baseline during average training load at sea level in a healthy state over 3 month prior to the viral infection (as a fixed reference point). Differences in HR, RMSSD, HRpeak, and tHRpeak between the measure points (days) were evaluated. Statistical analysis was performed with the software SPSS 25.0 (IBM Statistics, USA) for Windows. Prior to the analysis of the differences between 10 days before, during, and 10 days after the upper respiratory tract infection (URTI), Gaussian distribution of the data was verified by the Shapiro–Wilk test. A single factor repeated measures ANOVA was used to test whether there were statistical differences between the mean values of the respective parameters over the three measurement points (pre, URTI, post). For statistical analysis, ANOVA with post-hoc multiple comparisons and Bonferroni correction was applied. The sphericity was determined in advance using the Mauchly test. The data are presented as mean ± standard deviation. The level of significance was set at 0.05 (p < 0.05).
Results
The athlete maintained his average training load of 14–21 km of easy to moderate running per day on days 1–11. He had 1 day of rest on day 9. The athlete was absent from training on day 12–20 and restarted training on day 21 with an easy 10 km run (aerobic) followed by 2 days of easy running training of 8–12 km, on day 24, he completed 20 km of easy running, and on day 25, he did no running but did 3 h of biking. The ANOVA analysis shows significant main time effects for HR supine [F(2.10) = 21.913, p < 0.001, partial η2 = 0.814], HR standing [F(2.10) = 47.253, p < 0.001, partial η2 = 0.904], HRpeak [F(2.10) = 22.586, p < 0.001, partial η2 = 0.819], tHRpeak [F(2.10) = 38.261, p < 0.001, partial η2 = 0.819], RMSSD supine [F(2.10) = 5.625, p = 0.023, partial η2 = 0.529], and RMSSD standing [F(2.10) = 21.761, p < 0.001, partial η2 = 0.813]. Post-hoc comparisons showed that during the 6-day viral infection period, all values, except the RMSSD value in the supine position, changed significantly from the previous 10-day pre-measurement (Table 1). The HR increased by an average of 11 bpm in the supine position and by 22 bpm in the standing position, the HRpeak by 13 bpm, and the tHRpeak increased by 18 s. The RMSSD in the standing position decreased from 20.8 ms to 4.2 ms and showed the largest changes over the course of the viral infection days (Table 1; Figure 2).
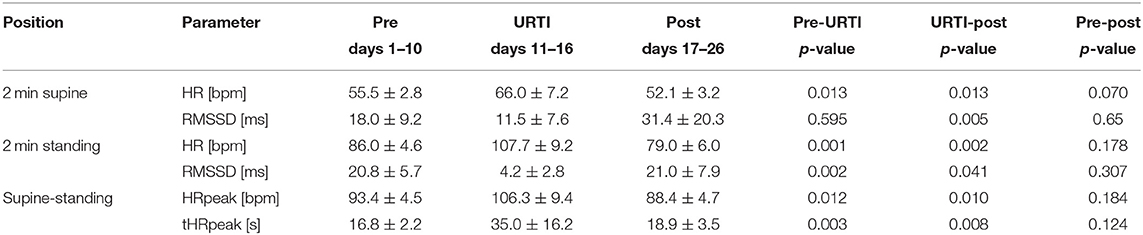
Table 1. Values (mean ± SD) of HR, RMSSD, HRpeak, and tHRpeak (time from HR in the supine position until HRpeak in the standing position) in the orthostatic test (OT) 10 days before, during, and 10 days after the upper respiratory tract infection (URTI) from a 30-year-old elite marathon runner.
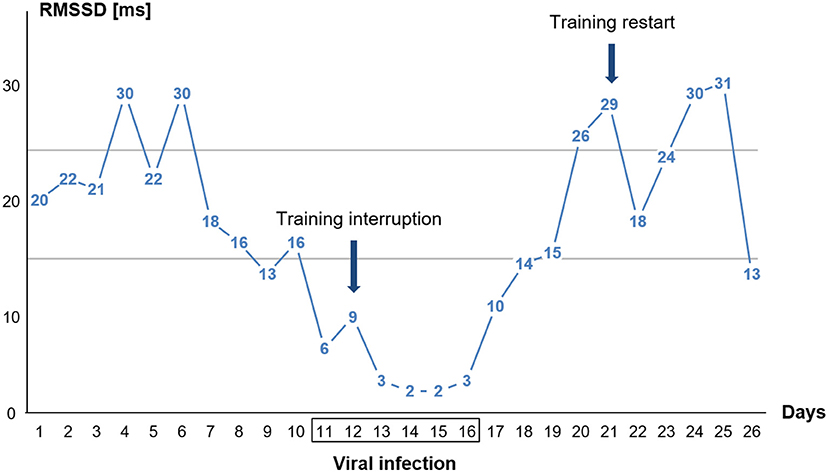
Figure 2. Single day values for time-domain heart rate variability (HRV) parameter RMSSD in the standing position of the orthostatic test (OT) before, during, and after the viral infection. The athlete had fever on days 13, 14, and 15. The two horizontal lines indicate the area of the individual smallest worthwhile change (SWC) in standing RMSSD during baseline (see section Methods).
The 10-day post-measurements differed significantly in all parameters on average from the 6-day viral infection period. The HR in the supine position decreased by 14 bpm, the HR in the standing position by 19 bpm, and the HRpeak by 18 bpm. The RMSSD values increased by 20 ms (supine) and 17 ms (standing), and the HR ascended faster again. The 10-day post RMSSD values in the supine and standing positions and the tHRpeak did not differ from the 10-day pre-measurements (Figure 2).
The graph in Figure 2 displays that the RMSSD values were already decreasing days before the viral infection symptoms were felt. Training was then stopped when the viral infection symptoms (sore throat) appeared (day 12). Upon relief of the viral infection symptoms, RMSSD levels immediately increased. The athlete restarted his training (day 21) after the RMSSD values had approximately reached the initial values before the illness.
Figure 3 shows the HR curves from OT for the 6-day viral infection period and a typical curve before and after the viral infection period. An increase in HR values in supine and standing positions as well as 2 days with extremely slow tHRpeaks (52 s and 59 s) were apparent, and counter-regulation was missing. On the days of the slow tHRpeak (days 4 and 5 of vthe iral infection), the HRpeak reached the highest values (122 bpm and 111 bpm).
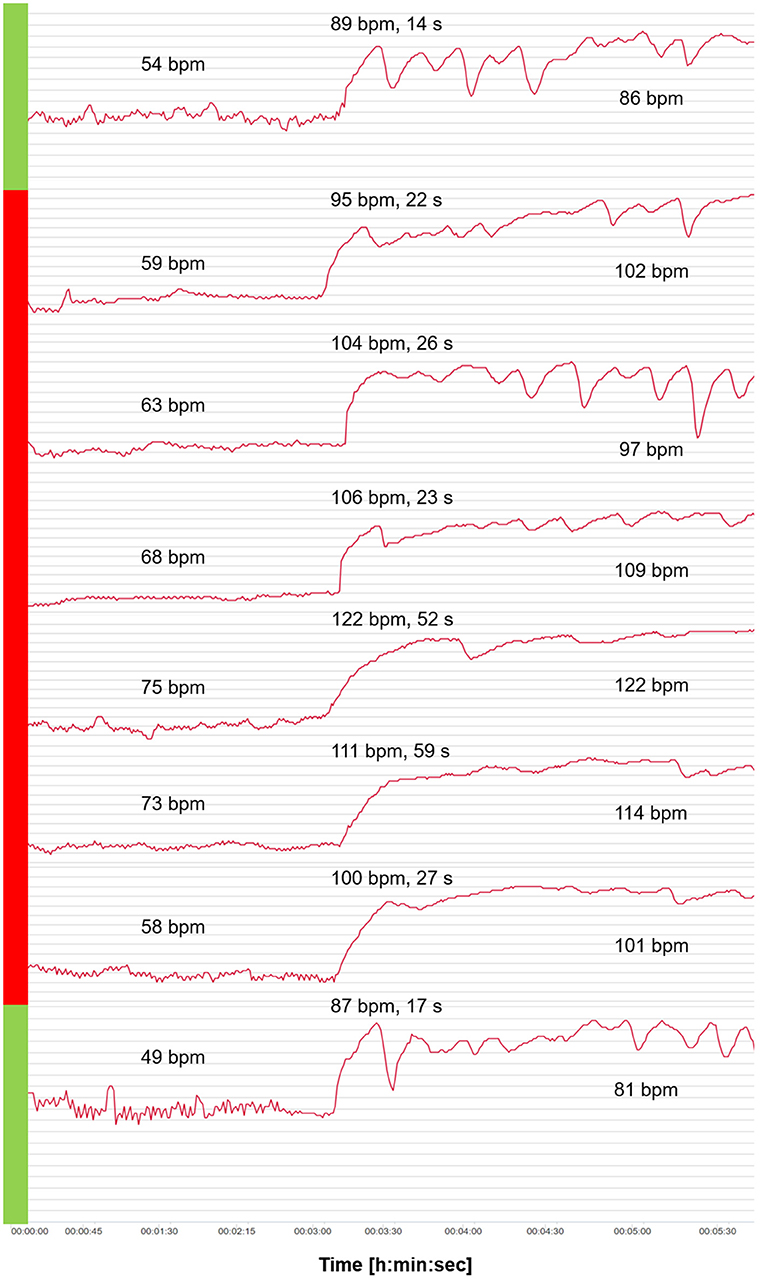
Figure 3. Heart rate (HR) curves from the orthostatic test (OT) for the 6-day viral infection period (red) and a curve before and after the viral infection period (green). Mean values of HR analyzed after 2 min in the supine position, and HRpeak, tHRpeak, and mean values of HR analyzed after 2 min in the standing position.
Discussion
The present case study is the first to show the interaction between a viral infection and the daily monitoring of the cardiac autonomic control in an elite athlete. The case study is particularly unique due to the fact that the data are ecologically valid (not lab-based), and obtained from an elite endurance athlete.
The main finding is that a viral infection had a direct influence on HR and HRV. An increase in HR was accompanied by a decrease in RMSSD in the OT in the standing position. It seems that cardiac vagal activity is suppressed in the presence of a viral infection, which is also the case in patients with fever (Lin et al., 2006; Carter et al., 2014). An increase in resting HR and a decrease in RMSSD suggests a suppression of parasympathetic activity (Buchheit, 2014; Laborde et al., 2018). The kinetics of HR from supine to standing was significantly different in the HR increase (tHRpeak) from a typical course in a healthy condition. With the onset of the viral infection symptoms, there was a slower increase, which was particularly pronounced after 3 days of the 6-day period. The state of research according to changes in cardiac autonomic regulation during viral infection strengthen the evidence that specific measures of HRV are valid indicators of cardiac autonomic responsiveness (Malik et al., 2019). Bellenger et al. (2016c) found a slower HR acceleration at the onset of exercise in athletes suffering from exercise-induced fatigue (overload training). A reduced performance capacity of the athletes and altered cardiac autonomic control due to fatigue may also apply to a viral infection. In the context of viral diseases, HR increase in regard to a change in body position has not been investigated so far. A small number of studies conducted with endurance athletes demonstrated a decrease in HR acceleration following overload training, indicating it may be a potential indicator of training-induced fatigue (Nelson et al., 2014; Bellenger et al., 2016a).
The second main result is that HR and HRV values changed more substantially in the standing position than in the supine position during viral infection. This was particularly pronounced in the RMSSD values, which decreased from 20 ms before to 4 ms during viral infection. The cardiac autonomic system reacted more sensitively in the standing position compared to the supine position in the present data. The RMSSD changed significantly from pre to viral infection values in the standing position only (Table 1). The analysis of the single day values for the RMSSD in the standing position shows that the athlete stopped training when the flu symptoms appeared. However, according to the HRV analysis, a training suspension 2–3 days earlier might have been preferable to avoid weakening the immune system further (Figure 2). The return to training was reasonably chosen after the HRV values had returned to the initial level and were elevated for several days. The further fluctuations of the post-values of the 6-day viral infection period are related to the training process. Moderate aerobic training (low-intensity training) leads to better values in RMSSD compared to pre-values due to positive effects on vagal activity (increases in parasympathetic activity) (Stanley et al., 2013). The reason for the strong decrease in RMSSD values on day 26 could be the more intensive training the day before (training phases with increased time spent at high intensity suppress parasympathetic activity) (Buchheit and Gindre, 2006; Plews et al., 2014; Schneider et al., 2019). This might indicate that the performance capacity and health status level for high training stimuli was not yet given.
Limitations
We chose morning resting HRV recordings due to the practicality of the measurement and with a focus on the vagal HRV parameter RMSSD because this parameter provides valid results in longitudinal analysis without a given breathing rate in the context of training and health status, which cannot be guaranteed using frequency-domain analysis of HRV (e.g., low frequency and high frequency power) without a given breathing control (Nakamura et al., 2015).
Furthermore, it could be shown that RMSSD determined in a short period of already 1 min (calculation of 1 min after 1 min stabilization period) is sensitive to training-induced changes in athletes, and can be used to track cardiac autonomic adaptations (Nakamura et al., 2015). In regard to OT, Schäfer et al. (2015) found no differences using 2 min intervals compared to 4 min intervals in both supine and standing positions for monitoring training and recovery processes. Therefore, the chosen procedure of a 3-min recording time in supine and standing positions with analyzed intervals of 2 min respectively should provide representative values of HR and RMSSD.
Conclusion
The findings of this case report have some implications for sports practitioners and coaches looking to both ensure the health of their athletes, and for using HRV as a tool to monitor training process and the return to sport after a viral infection. For endurance athletes, a control by means of resting HR in one body position does not seem to be sufficient. Accordingly, the data have provided supportive rationale as to why the OT with a change from supine to standing body position and the detection of different indicators based on HR and a vagal driven time-domain HRV parameter (RMSSD) is likely to be useful to detect viral diseases early on when implemented in a daily routine. Given the case study nature of the findings, future research has to be conducted to investigate whether the use of the OT might be able to offer an innovative, non-invasive, and time-efficient possibility to detect and evaluate the health status of (elite endurance) athletes.
Data Availability Statement
The original contributions presented in the study are included in the article/supplementary material, further inquiries can be directed to the corresponding author/s.
Ethics Statement
Ethical review and approval was not required for the study on human participants in accordance with the local legislation and institutional requirements. The patients/participants provided their written informed consent to participate in this study. Written informed consent was obtained from the individual(s) for the publication of any potentially identifiable images or data included in this article.
Author Contributions
LH: conceptualization, methodology, investigation, writing—original draft preparation, and project administration. LH, KH, and TG: validation. LH and KH: data curation and visualization. LH, KH, TG, TW, and AF: writing—review and editing. AF: supervision. All authors have read and agreed to the published version of the manuscript.
Funding
We acknowledge support by the DFG Open Access Publication Funds of the Ruhr-Universität Bochum.
Conflict of Interest
The authors declare that the research was conducted in the absence of any commercial or financial relationships that could be construed as a potential conflict of interest.
Publisher's Note
All claims expressed in this article are solely those of the authors and do not necessarily represent those of their affiliated organizations, or those of the publisher, the editors and the reviewers. Any product that may be evaluated in this article, or claim that may be made by its manufacturer, is not guaranteed or endorsed by the publisher.
References
Aubert, A. E., Seps, B., and Beckers, F. (2003). Heart rate variability in athletes. Sports Med. 33, 889–919. doi: 10.2165/00007256-200333120-00003
Barrero, A., Le Cunuder, A., Carrault, G., Carr,é, F., Schnell, F., and Le Douairon Lahaye, S. (2020). Modeling stress-recovery status through heart rate changes along a cycling grand tour. Front. Neurosci. 14:576308. doi: 10.3389/fnins.2020.576308
Bellenger, C. R., Fuller, J. T., Thomson, R. L., Davison, K., Robertson, E. Y., and Buckley, J. D. (2016a). Monitoring athletic training status through autonomic heart rate regulation: a systematic review and meta-analysis. Sports Med. 46, 1461–1486. doi: 10.1007/s40279-016-0484-2
Bellenger, C. R., Karavirta, L., Thomson, R. L., Robertson, E. Y., Davison, K., and Buckley, J. D. (2016b). Contextualizing parasympathetic hyperactivity in functionally overreached athletes with perceptions of training tolerance. Int. J. Sport Physiol. Perform. 11, 685–692. doi: 10.1123/ijspp.2015-0495
Bellenger, C. R., Thomson, R. L., Howe, P. R., Karavirta, L., and Buckley, J. D. (2016c). Monitoring athletic training status using the maximal rate of heart rate increase. J. Sci Med. Sport 19, 590–595. doi: 10.1016/j.jsams.2015.07.006
Bourdillon, N., Schmitt, L., Yazdani, S., Vesin, J. M., and Millet, G. P. (2017). Minimal window duration for accurate HRV recording in athletes. Front. Neurosci. 11:456. doi: 10.3389/fnins.2017.00456
Buchheit, M. (2014). Monitoring training status with HR measures: do all roads lead to Rome? Front Physiol. 5:73. doi: 10.3389/fphys.2014.00073
Buchheit, M., and Gindre, C. (2006). Cardiac parasympathetic regulation: respective associations with cardiorespiratory fitness and training load. Am. J. Physiol. Heart Circ. Physiol. 291, 451–458. doi: 10.1152/ajpheart.00008.2006
Buchhorn, R., Baumann, C., and Willaschek, C. (2020). Heart rate variability in a patient with coronavirus disease 2019. Int. Cardiovasc. Forum J. 20:2020050209. doi: 10.20944/preprints202005.0209.v1
Carter, I. I. I. R, Hinojosa-Laborde, C., and Convertino, V. A. (2014). Heart rate variability in patients being treated for dengue viral infection: new insights from mathematical correction of heart rate. Front. Physiol. 5:46. doi: 10.3389/fphys.2014.00046
Cowan, L. T., Lutsey, P. L., Pankow, J. S., Matsushita, K., Ishigami, J., and Lakshminarayan, K. (2018). Inpatient and outpatient infection as a trigger of cardiovascular disease: the ARIC study. J. Am. Heart Assoc. 7:e009683. doi: 10.1161/JAHA.118.009683
Dores, H., and Cardim, N. (2020). Return to play after COVID-19: a sport cardiologist's view. Br. J. Sports Med. 54, 1132–1133. doi: 10.1136/bjsports-2020-102482
Flachenecker, P. (2000). Klinische Standarduntersuchungen autonomer Funktionen-Parasympathikusfunktionen. Jörg J: Autonome Diagnostik und Schlafpolygraphie in Klinik und Praxis. Darmstadt: Steinkopff.
Friman, G., and Wesslén, L. (2000). Infections and exercise in high-performance athletes. Immunol. Cell Biol. 78, 510–522. doi: 10.1111/j.1440-1711.2000.t01-12-.x
Gilgen-Ammann, R., Schweizer, T., and Wyss, T. (2019). RR interval signal quality of a heart rate monitor and an ECG Holter at rest and during exercise. Eur. J. Appl. Physiol. 119, 1525–1532. doi: 10.1007/s00421-019-04142-5
Hagen, J., Stone, J. D., Hornsby, W. G., Stephenson, M., Mangine, R., Joseph, M., et al. (2020). COVID-19 surveillance and competition in sport: utilizing sport science to protect athletes and staff during and after the pandemic. J. Funct. Morphol. Kinesiol. 5:69. doi: 10.3390/jfmk5030069
Halle, M., Binzenhofer, L., Mahrholdt, H., Schindler, J. M., Esefeld, K., and Tschope, C. (2020). Myocarditis in athletes: a clinical perspective. Eur. J. Prev. Cardiol. 28, 1050–1057. doi: 10.1177/2047487320909670
Harmon, K. G., Asif, I. M., Maleszewski, J. J., Owens, D. S., Prutkin, J. M., Salerno, J. C., et al. (2016). Incidence and etiology of sudden cardiac arrest and death in high school athletes in the United States. Mayo Clin. Proc. 91, 1493–1502. doi: 10.1016/j.mayocp.2016.07.021
Hottenrott, K., and Hoos, O. (2017). “Heart rate variability analysis in exercise physiology,” in ECG Time Series Variability Analysis: Engineering and Medicine, eds H. F. Jelinek, D. J. Cornforth, and A. H. Khandoker (Boca Raton, FL: CRC Press), 249–279.
Hottenrott, L., Hottenrott, K., and Ketelhut, S. (2019). Commentary: vagal tank theory: the three rs of cardiac vagal control functioning–resting, reactivity, and recovery. Front. Neurosci. 13:1300. doi: 10.3389/fnins.2019.01300
Karjalainen, J., and Viitasalo, M. (1986). Fever and cardiac rhythm. Arch. Intern. Med. 146, 1169–1171. doi: 10.1001/archinte.1986.00360180179026
Laborde, S., Mosley, E., and Mertgen, A. (2018). A unifying conceptual framework of factors associated to cardiac vagal control. Heliyon 4:e01002. doi: 10.1016/j.heliyon.2018.e01002
Le Meur, Y., Pichon, A., Schaal, K., Schmitt, L., Louis, J., Gueneron, J., et al. (2013). Evidence of parasympathetic hyperactivity in functionally overreached athletes. Med. Sci. Sports Exerc. 45, 2061–2071. doi: 10.1249/MSS.0b013e3182980125
Lin, M. T., Wang, J. K., Lu, F. L., Wu, E. T., Yeh, S. J., Lee, W. L., et al. (2006). Heart rate variability monitoring in the detection of central nervous system complications in children with enterovirus infection. J. Crit. Care 21, 280–286. doi: 10.1016/j.jcrc.2006.02.005
Madjid, M., Safavi-Naeini, P., Solomon, S. D., and Vardeny, O. (2020). Potential effects of coronaviruses on the cardiovascular system: a review. JAMA Cardiol. 5, 831–840. doi: 10.1001/jamacardio.2020.1286
Malik, M., Hnatkova, K., Huikuri, H. V., Lombardi, F., Schmidt, G., and Zabel, M. (2019). CrossTalk proposal: heart rate variability is a valid measure of cardiac autonomic responsiveness. J. Physiol. 597:2595. doi: 10.1113/JP277500
Nakamura, F. Y., Flatt, A. A., Pereira, L. A., Ramirez-Campillo, R., Loturco, I., and Esco, M. R. (2015). Ultra-short-term heart rate variability is sensitive to training effects in team sports players. J. Sci. Med. Sport. 14:602.
Nelson, M. J., Thomson, R. L., Rogers, D. K., et al. (2014). Maximal rate of increase in heart rate during the rest-exercise transition tracks reductions in exercise performance when training load is increased. J. Sci. Med. Sport. 17, 129–133. doi: 10.1016/j.jsams.2013.02.016
Nieß, A. M., Bloch, W., Friedmann-Bette, B., Grim, C., Halle, M., Hirschmüller, A., et al. (2020). Position stand: return to sport in the current coronavirus pandemic. Ger. J. Sport Med. 71, 1–4. doi: 10.5960/dzsm.2020.437
Plews, D. J., Laursen, P. B., Kilding, A. E., and Buchheit, M. (2014). Heart-rate variability and training-intensity distribution in elite rowers. Int. J. Sports Physiol. Perform. 9, 1026–1032. doi: 10.1123/ijspp.2013-0497
Plews, D. J., Laursen, P. B., Stanley, J., Kilding, A. E., and Buchheit, M. (2013). Training adaptation and heart rate variability in elite endurance athletes: opening the door to effective monitoring. Sports Med. 43, 773–781. doi: 10.1007/s40279-013-0071-8
Polak, S. B., Van Gool, I. C., Cohen, D., Jan, H., and van Paassen, J. (2020). A systematic review of pathological findings in COVID-19: a pathophysiological timeline and possible mechanisms of disease progression. Modern Pathol. 33, 2128–2138. doi: 10.1038/s41379-020-0603-3
Ravé, G., and Fortrat, J. O. (2016). Heart rate variability in the standing position reflects training adaptation in professional soccer players. Eur. J. Appl. Physiol. 116, 1575–1582. doi: 10.1007/s00421-016-3416-9
Roberts, J. A. (1986). Viral illnesses and sports performance. Sports Med. 3, 296–303. doi: 10.2165/00007256-198603040-00006
Rooke, T. W., and Sparks, H. V. (2003). “Control mechanisms in circulatory function,” in George AT: Medical physiology, ed A. R. Rodney (Philadelphia, PA: Lippincott Williams and Wilkins), 290–308.
Schäfer, D., Olstad, B. H., and Wilhelm, M. (2015). Can heart rate variability segment length during orthostatic test be reduced to 2 min?: 227 Board# 78 May 27, 1100 AM-1230 PM. Med. Sci. Sports Exerc. 47:48. doi: 10.1249/01.mss.0000476531.84848.dd
Schmitt, L., Regnard, J., and Millet, G. P. (2015). Monitoring fatigue status with HRV measures in elite athletes: an avenue beyond RMSSD? Front. Physiol. 6:343. doi: 10.3389/fphys.2015.00343
Schneider, C., Hanakam, F., Wiewelhove, T., Döweling, A., Kellmann, M., Meyer, T., et al. (2018). Heart rate monitoring in team sports—a conceptual framework for contextualizing heart rate measures for training and recovery prescription. Front. Physiol. 9:639. doi: 10.3389/fphys.2018.00639
Schneider, C., Wiewelhove, T., Raeder, C., Flatt, A. A., Hoos, O., Hottenrott, L., et al. (2019). Heart rate variability monitoring during strength and high-intensity interval training overload microcycles. Front. Physiol. 10:582. doi: 10.3389/fphys.2019.00582
Schnellhorn, P., Klingel, K., and Burgstahler, C. (2020). Return to sports after COVID-19 infection. Do we have to worry about myocarditis? Eur. Heart J. 41, 4382–4384. doi: 10.1093/eurheartj/ehaa448
Stanley, J., Peake, J. M., and Buchheit, M. (2013). Cardiac parasympathetic reactivation following exercise: implications for training prescription. Sports Med. 43, 1259–1277. doi: 10.1007/s40279-013-0083-4
Stewart, J. M., Medow, M. S., Glover, J. L., and Montgomery, L. D. (2006). Persistent splanchnic hyperemia during upright tilt in postural tachycardia syndrome. Am. J. Physiol. Heart Circ. Physiol. 290, H665–H673. doi: 10.1152/ajpheart.00784.2005
Tarvainen, M. P., Niskanen, J. P., Lipponen, J. A., Ranta-Aho, P. O., and Karjalainen, P. A. (2014). Kubios HRV–heart rate variability analysis software. Comput. Meth. Prog. Bio. 113, 210–220. doi: 10.1016/j.cmpb.2013.07.024
Tulppo, M. P., Hughson, R. L., Mäkikallio, T. H., Airaksinen, K. J., Seppänen, T., and Huikuri, H. V. (2001). Effects of exercise and passive head-up tilt on fractal and complexity properties of heart rate dynamics. Am. J. Physiol. Heart Circ. Physiol. 280, H1081–H1087. doi: 10.1152/ajpheart.2001.280.3.H1081
Uusitalo, A. L., Uusitalo, A. J., and Rusko, H. K. (2000). Heart rate and blood pressure variability during heavy training and overtraining in the female athlete. Int. J. Sports Med. 21, 45–53. doi: 10.1055/s-2000-8853
Verwoert, G. C., de Vries, S. T., Bijsterveld, N., Willems, A. R., vd Borgh, R., Jongman, J. K., et al. (2020). Return to sports after COVID-19: a position paper from the Dutch Sports Cardiology Section of the Netherlands Society of Cardiology. Neth. Heart J. 28, 391–395. doi: 10.1007/s12471-020-01469-z
World Health Organization (2020). Coronavirus Disease (COVID-19) Pandemic. Available online at: https://www.who.int/emergencies/diseases/novel-coronavirus-2019 (accessed September 25, 2020).
Keywords: orthostatic test, athlete monitoring, heart rate variability, viral infection, return to sport, endurance sport, cardiac autonomic control, marathon
Citation: Hottenrott L, Gronwald T, Hottenrott K, Wiewelhove T and Ferrauti A (2021) Utilizing Heart Rate Variability for Coaching Athletes During and After Viral Infection: A Case Report in an Elite Endurance Athlete. Front. Sports Act. Living 3:612782. doi: 10.3389/fspor.2021.612782
Received: 30 September 2020; Accepted: 28 June 2021;
Published: 03 September 2021.
Edited by:
Sylvain Laborde, German Sport University Cologne, GermanyReviewed by:
Fábio Yuzo Nakamura, Instituto Universitário da Maia (ISMAI), PortugalRoss Sherman, Grand Valley State University, United States
Copyright © 2021 Hottenrott, Gronwald, Hottenrott, Wiewelhove and Ferrauti. This is an open-access article distributed under the terms of the Creative Commons Attribution License (CC BY). The use, distribution or reproduction in other forums is permitted, provided the original author(s) and the copyright owner(s) are credited and that the original publication in this journal is cited, in accordance with accepted academic practice. No use, distribution or reproduction is permitted which does not comply with these terms.
*Correspondence: Laura Hottenrott, bGF1cmEuaG90dGVucm90dEBydWIuZGU=