 Felix Melcher1†Tillmann Peest1,2†Diego Garay1,2†Florian Utz3,4Michael Paper1Andrea Spaccasassi2,3
 Lisa Obermaier5
 Jennifer Schneiderbanger6Max Koch7Daniel Garbe1Tom Nilges7Thomas Becker6
 Michael Rychlik5
 Corinna Dawid3,4
 Wolfram M. Brück8Nikolaus I. Stellner1,2*Thomas B. Brück1*
- 1Werner Siemens - Chair of Synthetic Biotechnology, Technical University of Munich, TUM School of Natural Sciences, Garching, Germany
- 2TUMCREATE Ltd., Singapore, Singapore
- 3Chair of Food Chemistry and Molecular Sensory Science, Technical University of Munich, TUM School of Life Sciences, Freising, Germany
- 4Professorship for Functional Phytometabolomics, Technical University of Munich, TUM School of Life Sciences, Freising, Germany
- 5Chair of Analytical Food Chemistry, Technical University of Munich, TUM School of Life Sciences, Freising, Germany
- 6Chair of Brewing and Beverage Technology, Technical University of Munich, TUM School of Life Sciences, Freising, Germany
- 7Professorship of Synthesis and Characterisation of Innovative Materials, Technical University of Munich, TUM School of Natural Sciences, Garching, Germany
- 8Institut of Life Sciences, University of Applied Sciences and Arts Western Switzerland, Sitten, Switzerland
A growing global population and climate change challenge conventional agriculture and global food safety. Microalgae are an emerging sustainable nutrient food resource, increasingly regarded as an important component for the human diet. The chlorophyte Chlorella sp. is regulated and commercialized for food applications. Commercial Chlorella preparations are either produced by heterotrophic fermentation or photoautotrophic cultivation in bioreactors or outdoor ponds. Products can differ significantly with regard to taxonomy of the production strain, changed genetic properties due to strain development, cultivation conditions, and downstream biomass processing methods. Notably, heterotrophic strains may be adapted to generate little or no photosynthetic pigments, resulting in yellow or white variant. In this study, eight different commercial Chlorella products from different EU suppliers were analyzed and compared regarding identity of the production strain, macro-and micronutrient profiles, sensory properties, as well as microbial load. The production processes featured different cultivation methods, production strains, genetic variants (yellow and white) and downstream processing methods. Data indicates significant variations between the Chlorella products. White and yellow Chlorella products showed different protein and taste profiles compared to green, photosynthetically competent wild type strains. We confirmed relatively high and stable protein concentrations but could detect variations in sugar and specifically lipid and vitamin profiles depending on strain, cultivation and downstream processing methods. The microbial load varied strongly between closed and open cultivation systems but was compliant with legislative (EFSA) specifications for all samples. The comparative nutrient- and sensory data set presented in this study will aid in selecting algae products for the development of innovative foods, thereby accelerating adoption and differentiation of algae food products.
1 Introduction
Because of a rapidly growing global population global food demand will increase by 50% until 2050 (Nations, 2022a; Nations, 2022b). While food production is responsible for about 34% of all human-induced greenhouse gas emissions it also faces challenges because of climate change and the scarcity of arable land. To address these issues and to ensure food security for the world population, it is essential to explore more sustainable alternatives to conventional agriculture and livestock breeding (Crippa et al., 2021; Mirón et al., 2023). Microalgae build up biomass much faster than terrestrial crops and represent a rich source of high-quality protein, essential fatty acids, vitamins, minerals, and bioactive compounds supporting a healthy human diet (Andrade et al., 2018; Bhuvana et al., 2019; Yang et al., 2023). Chlorella vulgaris, for example, shows a projected market value of USD 413.3 million by 2028 with an annual biomass production of about 5,000 tons and has been recognized as the most valuable commercially produced green microalga (Levasseur et al., 2020). This species is regulated for food and feed applications from the food and drug administration (FDA) as well as European food safety authority (EFSA) and is generally recognized as safe (GRAS) (Additives and Food, 2015; Food and Administration, 2016). The reported intracellular protein content of Chlorella sp. biomass is between 40% and 70% and complies with the requirements of a high quality protein according to the essential amino acid index (EAAI), which is used to evaluate protein quality for human nutrition (Becker, 2007; Bito et al., 2020; Fu et al., 2021; Markou et al., 2012; Matard-Mann et al., 2017; Muys et al., 2019; Qin et al., 2020; Yang et al., 2023). In addition to its high protein content, Chlorella sp. biomass contains a variety of vitamins and other bioactive and potentially health promoting compounds (Bito et al., 2020; Markou et al., 2012; Matard-Mann et al., 2017; Qin et al., 2020).
The composition of the commercialized biomass is mainly dependent on the cultivation method, the production species/strain, their genetic variation and downstream processing (Hosseinizand et al., 2018; Kolackova et al., 2023; Muys et al., 2019; Nwoba et al., 2019; Silva et al., 2021; Vilatte et al., 2023). Chlorella sp. can be cultivated photoautotrophically in illuminated, closed photobioreactors or open ponds, with carbon dioxide as carbon source (phototrophic/autotrophic). Alternatively, algae biomass can be cultivated heterotrophically in conventional stirred tank fermenters using monomeric sugars (e.g., glucose) as a carbon source. Moreover, both photoautotrophic and heterotrophic cultivation modes can be combined in mixotrophic cultivation modes using photobioreactor systems (Barros et al., 2019; Patel et al., 2021). The ability to grow Chlorella heterotrophically enables the development of genetically adapted strains with less or devoid of photosynthetic pigments. These yellow or white algae products have altered sensory profiles (Cabrol et al., 2023; Schüler et al., 2020), which offers new options for the development of food products. Nevertheless, microalgae biomass is currently predominantly used as an additive to products to increase their nutritional value, or as a dietary supplement due to its potentially health-promoting properties. Therefore, in addition to the contained nutrients color, taste, and odor can play a major role in the general consumer acceptance of microalgae in food. In this context, product quality and shelf life of microalgae biomass products is highly dependent on the microbial loads of microalgae preparations, which are significantly affected by the individual cultivation and downstream processing methods.
There is sporadic information on production strains, cultivation methods and nutritional profiles mainly provided by manufacturers of microalgae biomass. However, detailed and standardized analysis of micro-and macronutrient composition as well as sensory profiles are typically not reported. Moreover, data on microbial loads pertaining to these products are commonly not disclosed. This study used standardized analysis methods to compare macro- and micronutrient composition, sensory profiles, as well as microbial load of eight different dried commercial Chlorella sp. powders. Highlighting the impacts of different ways of microalgae production and processing may be of interest to food technologists to evaluate the potential for food development of different Chlorella products.
2 Materials and methods
2.1 Chlorella powders
Eight different types of Chlorella powders covering different suppliers, strains, cultivation methods, and downstream processing wer analyzed for their nutrient and sensory profiles (Table 1).
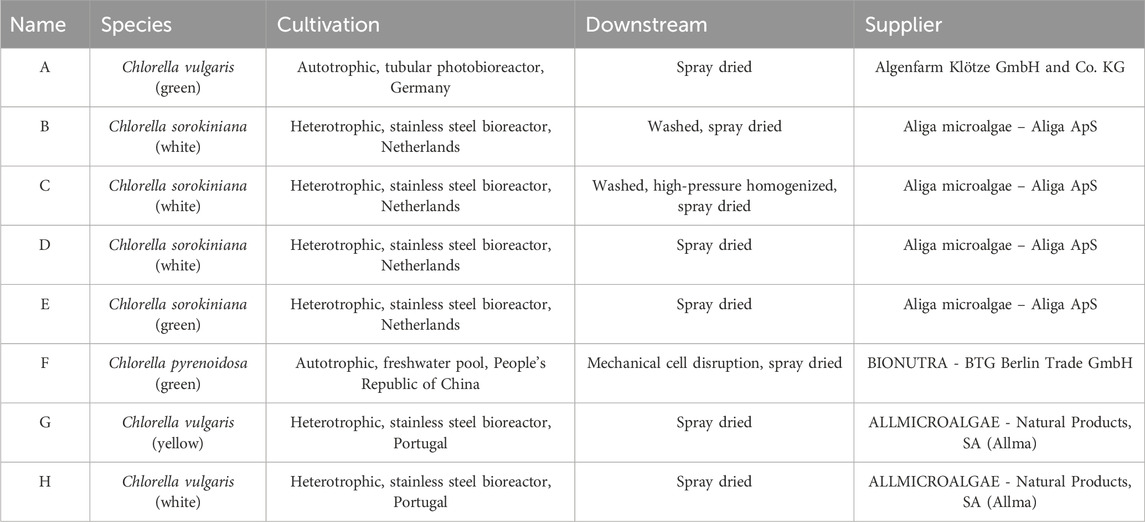
Table 1. Overview of tested Chlorella powders showing species, cultivation method, downstream processing and supplier according to the supplier’s information.
2.2 Qualitative pigment analysis
For the pigment analysis 10–15 mg of the different biomass samples were extracted with 4 mL HPLC-grade acetone in 10 mL glass tubes with solvent-proof screw-top lids according to Paper et al. (Paper et al., 2022). and directly analyzed using a Shimadzu Prominence LC-20A HPLC-system (Shimadzu, Duisburg, Germany) equipped with an SPD-M20A diode array detector on a Phenomenex Luna C8 LC column (250 mm × 4.6 mm I.D; particle size 5 μm, Phenomenex Ltd. Deutschland, Aschaffenburg, Germany) according to (Paper et al., 2022). Pigment standards were purchased from CaroteNature (Lupsingen, Germany) and Sigma-Aldrich Chemie (Weinheim, Germany) in HPLC grade.
2.3 Microbiological load
2.4. Microbiological analysis was performed according to standard ISO methodology in an ISO17025 accredited laboratory (STS 0093). All media were purchased from HiMedia (Lucerna-Chem AG, Lucerne, Switzerland). All media were performance tested according to ISO 11133:2014 before use. 10 g of powdered algae samples were reconstituted in 90 mL of Sodium Chloride Peptone Broth (SCPB; Millipore, Zug, Switzerland). Serial dilutions (1:10) were prepared for duplicate plating of chosen dilutions. Aerobe mesophilic microorganisms (ISO 4833-1:2013) were analyzed using Plate Count Agar (PCA) incubated at 30°C for 72 h. Total yeast and molds were enumerated following ISO 7954:1987, where samples were incubated for up to 5 days at 25°C on Yeast Extract Glucose Chloramphenicol Agar (YGC-A). Quantitative determination of presumptive Bacillus cereus was performed using Mannitol Egg Yolk Polymyxin Agar (MYP-A) as described in ISO 7932:2004/Amd 1:2020. Samples were incubated for 24 h at 30°C. On the medium, typical colonies of B. cereus appear rough and dry, set against a bright pink background with an egg yolk precipitate. Colonies exhibiting this characteristic appearance were examined microscopically for the typical morphology of B. cereus, which is characterized by large cells (3.5 µm) that sometimes form short chains or long strands, featuring central to terminal ellipsoidal spores that do not cause the cells to swell. For the enumeration of Enterobacteriaceae, Violet Red Bile Glucose Agar (VRBG-A) was used according to ISO 21528-2:2017. An overlay of VRBG-A was used to prevent swarming colonies and to provide semi-anaerobic conditions. Samples were incubated at 37°C for 24 h. Small (1–2 mm in diameter), round and violet to pink colonies with a halo surrounding the colony and a confirmed oxidase negative test were counted. After all ISO accredited methods were performed, the 1 g of powdered sample was reconstituted in 9 mL of SCPB and heated to 80°C for 12 min to eliminate all viable microorganisms (McHugh et al., 2017). The heat-treated samples were analyzed for mesophilic aerobic spores using Tryptic Soy Agar (TSA) incubated at 37°C for 48 h (Kyrylenko et al., 2023). The presence of total anaerobic spores was estimated by plating the heat-treated samples on Brain Heart Infusion Agar (BHI-A) and incubating at 37°C for 24 h in an anaerobic workstation (Whitley A85 Workstation, Meintrup DWS Laborgeräte, Herzlake, Germany) (Hu et al., 2021)
2.4 Determination of water content and water activity
The water content of the samples was determined by drying oven method according to the MEBAK method R-110.40.020 [2016-03] (Mebak, 2016a). The water activity (aw) of the samples was measured using a Novasina TH 500/RTD-502 AW SPRINT (Novasina, Lachen, Switzerland) with the measurement chamber set to 25°C.
2.5 Determination of raw Protein content
The raw protein content of the samples was determined by Kjeldahl method according to the MEBAK method R-110.41.030 [2016-03] (Mebak, 2016b) taking into account the nitrogen-to-protein conversion factor (kp) of 4.78 (Sägesser et al., 2023).
2.6 Determination of ash content
About 1 g of the different Chlorella powders ashed at 650°C in pre-weight crucibles for 4h. Afterwards, the crucibles were placed in a vacuum desiccator for cooling and weight again to determine the ash content. All experiments were carried out in biological triplicates.
2.7 Amino acid analysis
The amino acid composition after acidic hydrolysis was determined according to the literature (Wollmann and Hofmann, 2013). Aliquots (5 mg) of the Chlorella powders were suspended in aqueous hydrochloric acid (6 M; 3 mL) and incubated for 24 h at 110°C. Cooled and neutralized (NaOH; 12 M) solutions were further diluted to 5 mL with water. Aliquots (990 µL) thereof were then spiked with the internal standard (10 µL) and quantified by means of SIDA-HPLC-MS/MS (Hillmann et al., 2012).
2.8 Fatty acid analysis
The fatty acid profile was determined according to Engelhart-Straub et al. using 10 mg of the different Chlorella powders. The sample preparation, namely, the extraction and transesterification of the lipids, was performed using a Multi-Purpose Sampler MPS robotic (Gerstel, Linthicum Heights, MD, United States) with C12:0 TAG as internal standard for quantification (Engelhart-Straub et al., 2022). The samples were measured at an GC-2025 coupled to an AOC-20i Auto Injector and AOC-20s Auto Sampler (Shimadzu, Duisburg, Germany). Marine oil fatty acid methyl ester (FAME) mix (20 components from C14:0 to C24:1; Restek GmbH, Bad Homburg, Germany) was used as standard for the quantification of the fatty acid methyl esters (FAMEs).
2.9 Sugar analysis
The Chlorella powders were chemically hydrolyzed using 2% sulfuric acid. For this, 50 mg of each powder was suspended in 19.6 mL water and incubated at 95°C for 1 h in a water bath. Afterwards, the solids were separated from the water phase by centrifugation (19,000 rcf, 10 min, RT). The supernatant was acidified to a final sulfuric acid concentration of 2% (v/v) with concentrated acid and the pellet was resuspended in 2% (v/v) sulfuric acid. After autoclaving (60 min, 121°C) both acidic liquid phases were neutralized with solid calcium carbonate. 2 mL of each supernatant were frozen overnight, thawed, and filtered through a 0.2 μm Phenex-NY syringe filter (Phenomenex, Torrance, CA, United States). 3 μL of 0.5 M EDTA was then added to 197 µL of sample. The samples were analyzed in a Agilent HPLC according to Jurkowski et al. with 60 min runtime per sample (Jurkowski et al., 2022).
2.10 Determination of vitamins C, D, and E
Vitamin C concentrations were quantified using the Ascorbic Acid Assay Kit MAK074 (Sigma-Aldrich, St. Louis, MO, United States). By means of a coupled enzyme reaction, the resulting colorimetric product was measured at 570 nm, which forms proportionally to the ascorbic acid content in the sample. Vitamin D2 and D3 contents were quantified by means of the ELISA Kit E-EL-0012, purchased from Elabscience Biotechnology Inc. (Wuhan, China). The measurements were conducted at 450 nm. Vitamin E contents were quantified by the Colorimetric Assay Kit E-BC-K033 (Elabscience Biotechnology Inc.), measuring the reduction of Fe3+ to Fe2+ by Vitamin E and further colorimetric reaction with phenanthroline at 533 nm. All sample preparations were conducted completely according to the respective guidelines and spectrophotometric measurements were performed with a microplate reader (Infinite 200, Tecan Group AG, Männedorf, Switzerland) at individual wavelengths specified for each assay.
2.11 Folate quantification
2.11.1 Extraction
The algae samples were analyzed in triplicate according to Striegel et al. with regards of the five folate vitamers PteGlu, H4folate, 5-CH3-H4folate, 5-CHO-H4folate, and 10-CHO-PteGlu (Striegel et al., 2018). The complete information about chemicals, standards, and preparations of solutions as well as validation of the method can be obtained from this previous publication (Striegel et al., 2018). 5–10 mg of freeze-dried, ground algae samples were used for quantification. After equilibration for 15 min with 10 mL buffer, the respective internal standards [13C5]-PteGlu, [13C5]-H4folate, [13C5]-5-CH3-H4folate, [13C5]-5-CHO-H4folate, and [13C5]-10-CHO-PteGlu were added in equal amounts of the expected concentration of the unlabeled analytes in the sample. Following 15 min equilibration time and boiling for 10 min, 900 mL chicken pancreas solution and 400 mL rat serum were added for deconjugation. After overnight incubation at 37°C, the samples were boiled for 10 min and 10 mL acetonitrile was added to the cooled sample. The supernatant of each sample was used for purification by solid phase extraction (SPE), filtered and measured by LC-MS/MS. All given results are based on dry biomass.
2.11.2 Instrumentation
The LC-MS/MS analysis was carried out as described in a previous publication with slight modifications (Striegel et al., 2018). The quantification was performed on a Shimadzu Nexera X2 UHPLC system (Shimadzu, Kyoto, Japan) with a Raptor ARC 18 column (2.7 μm, 100 × 2.1 mm, Restek, Bad Homburg, Germany) and a Raptor ARC-18 precolumn (2.7 μm, 5 × 2.1 mm, Restek) as a stationary phase held at 30°C. The mobile phase for the binary gradient consisted of (A) distilled water with 0.1% (v/v) formic acid and (B) acetonitrile with 0.1% (v/v) formic acid at a flow rate of 0.4 mL/min. The LC system was coupled with a triple quadrupole mass spectrometer (LCMS-8050, Shimadzu, Kyoto, Japan), operated in positive ESI mode.
2.12 Metal ion analysis
For the measurement of metal content in algal biomass, between 0.5 g and 1 g of dry algal biomass were incubated in 10 mL of demineralized water under constant shaking. Afterwards, the samples were centrifuged at 10.000 rcf for 10 min and the supernatant was analyzed. ICP-OES (Inductively Coupled Plasma Optical Emission Spectrometry) (Agilent 725 Series ICP Optical Emission Spectrometer, Agilent Technologies Inc., United States) was used to determine the metal content in the investigated solutions. As a calibration standard, a Certipur® ICP multi-element standard solution IV from Merck (Merck KGaA, Darmstadt, Germany) comprising 23 elements was used. The ICP Expert II Agilent 725-ES Instrument Software Version 2.0 (Agilent Technologies Inc., United States) was used to analyze the data.
2.13 Sensory analysis
2.13.1 General conditions and panel training
Sensory analysis was carried out by fifteen trained panelists (ten women and five men, age 21–45 years) from the Chair of Food Chemistry and Molecular Sensory Science at the Technical University of Munich using a quantitative descriptive analysis. Panelists had no history of known disorders and were trained weekly for a minimum of at least 2 years to be able to distinguish precisely between different aroma and taste qualities (Utz et al., 2022). Before the quantitative descriptive analyses (QDA) began, the panelists agreed upon a consistent panel language according to Stone and Sidel and available sensory lexicons (de Godoy et al., 2020; Stone et al., 2012; Stone et al., 2004). Thus, for orthonasal aroma evaluation, the following attributes including their reference compounds in brackets (20 mL; 100-fold odor thresholds in water) were chosen: metallic (Iron (II) sulfate), green (hexanal), hay-like (3-methyl-2,4-nonanedione), malty (3-methylbutanal), earthy (2,3,5-trimethyl-pyrazine), citrus-like (octanal), and sea breeze-like (without a reference substance) (Fischer and Schieberle, 2009; Kreissl et al., 2022; Mall and Schieberle, 2017). For taste evaluation, the panelists continuously wore nose clips to avoid cross-modal interactions with odorants. For training, aqueous solutions of sucrose for sweet taste, lactic acid for sour taste, monosodium glutamate for umami taste, sodium chloride for salty taste, caffeine for bitter taste, and tannic acid for astringency were used according to earlier investigations (Utz et al., 2021). For kokumi sensation, a reduced glutathione solution in model broth was utilized, respectively (Brehm et al., 2019). Before and between each test, the panelists rinsed their mouth for about 20 s with Evian water (Évian-les-Bains, France). All sensory data was collected in special sensory cabins with air-conditioning at 20–25°C.
2.13.2 Flavor profile analysis (FPA)
According to Caul (1957) a flavor profile analysis was performed (Caul, 1957). Thereby, each FPA of different Chlorella powders was divided into orthonasal aroma and taste experiments. 100 g/L Chlorella powder was suspended in Evian water (pH 5.5) and presented in closed sensory vials (45 mL) to the panelists, who evaluated the described aroma and taste qualities from 0 (not detectable) to 5 (very intense). Principal Component Analysis (PCA) was performed on the average scaled sensory data using the PCA() function from FactoMineR in R (R Core Team, Vienna, Austria). The first two principal components were visualized in a combined plot using the ggplot2 and ggrepelR packages for both individuals and variables.
2.14 Statistical analysis
Differences in biomass composition were statistically evaluated with a one-way ANOVA followed by a post hoc analysis according to Scheffé. A level of p ≤ 0.05 was considered significant. Calculations were performed with Microsoft Excel® (365 MSO, Version 2501, Microsoft Corp., Redmond, United States).
3 Results
3.1 Pigment analysis
The qualitative HPLC-based pigment analysis showed signals for chlorophylls (e.g., chlorophyll A and B) as well as lutein in all green Chlorella powders (A, E, F). In addition, β-carotene was detected in samples E and F, while neoxanthin was just present in sample E. The yellow Chlorella powder G showed a signal for lutein as dominant pigment, but zeaxanthin was also detected for this sample. For the white Chlorella powders there were no pigments detectable at all (Supplementary Figure S2).
3.2 Microbiological load
The photoautotrophically generated sample A (Algomed, C. vulgaris (green)) and F (Bionutra, Chlorella pyrenoidosa (green)), which are cultivated in closed photobioreactors or open ponds, had elevated counts of aerobic mesophilic microorganisms, aerobe mesophilic spores, anaerobe mesophilic spores, and B. cereus (Table 2). However, food is considered potentially hazardous only if levels emetic toxin producing B. cereus strain(s) exceed 105 cfu/g in foods (Authority, 2005). Furthermore, as all samples exhibited a water activity (aw) below 0.4 sporulation and growth of all spores in the samples is unlikely. All tested Chlorella powders fulfilled the requirements for food applications in microbiological contaminations (EFSA).
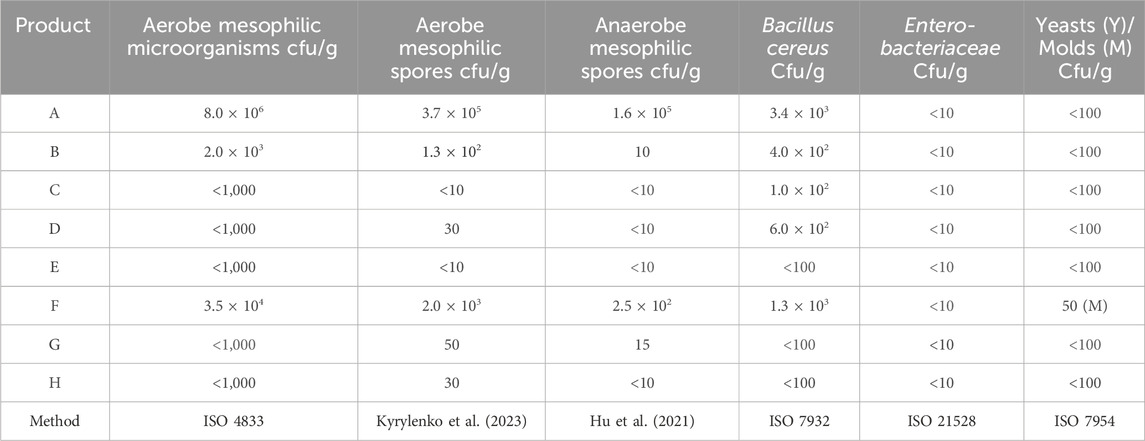
Table 2. Microbiological profiles of the tested Chlorella powders; A: Algomed, Chlorella vulgaris (green), phototrophic; B: Aliga, Chlorella sorokiniana (white), heterotrophic, washed, HPH; C: Aliga, Chlorella sorokiniana (white), heterotrophic, washed; D: Aliga, Chlorella sorokiniana (white), heterotrophic; E: Aliga, Chlorella sorokiniana (green), heterotrophic; F: Bionutra, Chlorella pyrenoidosa (green), phototrophic; G: Allma, Chlorella vulgaris (yellow), heterotrophic; H: Allma, Chlorella vulgaris (white), heterotrophic. All experiments were carried out in biological duplicates.
3.3 Biomass composition
Protein content was calculated with Kjeldahl measurements using a conversion factor of 4.78 and was overall lower for the chlorophyll-deficient strains B-D and G-H (Sägesser et al., 2023). The carbohydrate content, determined by HPLC analysis after chemical hydrolysis to convert carbohydrates like cell wall components and starch to monomeric sugars, was higher for all heterotrophic cultivations (B-E, G-H) independent of the chlorophyll content. The lipid quantification according to FAME analysis resulted in lipid contents lower than 10% for all samples, with slightly lower results for the Chlorella sorokiniana samples (B-D) (Table 3). In addition, the ash content was in a comparable range for all samples without washing step in the downstream processing (A, D-H) and lower with washing step (B, C). Proteins, carbohydrates, lipids, ash, and moisture did not sum up to 100 g, the difference (A: 23.7, B: 17.5, C: 7.0, D: 9.9, E: 2.7, F: 20.8, G: 15.4, H: 19.6) is mostly referred as fiber content.
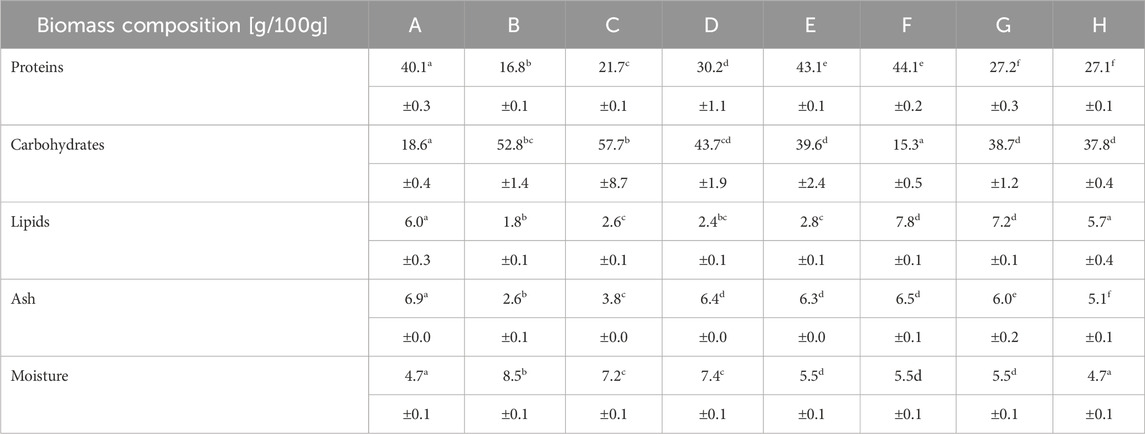
Table 3. Protein, carbohydrate, lipid, ash and moisture content of the tested Chlorella powders; A: Algomed, Chlorella vulgaris (green), phototrophic; B: Aliga, Chlorella sorokiniana (white), heterotrophic, washed, HPH; C: Aliga, Chlorella sorokiniana (white), heterotrophic, washed; D: Aliga, Chlorella sorokiniana (white), heterotrophic; E: Aliga, Chlorella sorokiniana (green), heterotrophic; F: Bionutra, Chlorella pyrenoidosa (green), phototrophic; G: Allma, Chlorella vulgaris (yellow), heterotrophic; H: Allma, Chlorella vulgaris (white), heterotrophic; Numbers represent the means and standard deviation of biological triplicates (n = 3). Statistically significant differences in biomass composition were determined in a one-way ANOVA (p ≤ 0.05), followed a Scheffé post hoc test. Different superscript letters (a-f) in the one row correspond to significant differences (p < 0.05). For detailed significant differences see Supplementary Tables S7, S13.
3.3.1 Amino acid profile
Independent of the species, cultivation, or downstream processing all Chlorella powders had a comparable amino acid profile containing all essential amino acids except L-methionine and L-tryptophan. The highest fluctuation between samples was found in L-arginine ranging from 2.1% to 10.4% of the total amino acids. Also, the E/N-ration ranging from 0.65 to 0.89 (A: 0.89, B: 0.76, C: 0.68, D: 0.69, E: 0.65, F: 0.80, G: 0.75, H: 0.75) is comparable over all tested samples (Figure 1A; Supplementary Table S1).
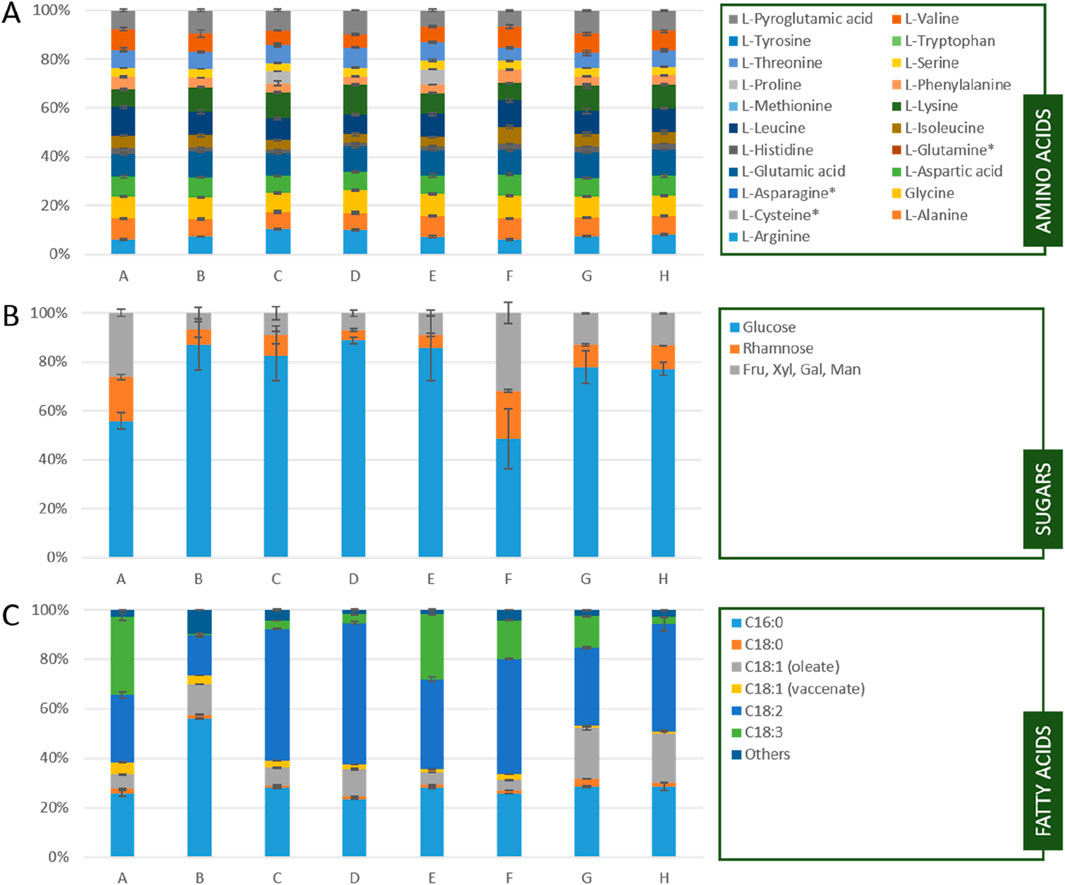
Figure 1. (A) Amino acid profile (B)sugar profile and (C) fatty acid profile of the tested Chlorella powders; A: Algomed, Chlorella vulgaris (green), phototrophic; B: Aliga, Chlorella sorokiniana (white), heterotrophic, washed, HPH; C: Aliga, Chlorella sorokiniana (white), heterotrophic, washed; D: Aliga, Chlorella sorokiniana (white), heterotrophic; E: Aliga, Chlorella sorokiniana (green), heterotrophic; F: Bionutra, Chlorella pyrenoidosa (green), phototrophic; G: Allma, Chlorella vulgaris (yellow), heterotrophic; H: Allma, Chlorella vulgaris (white), heterotrophic; * L-Cysteine is not analyzable without derivatization due to its high reactivity, L-Asparagine and L-Glutamine are oxidized to L-Aspartic or L-Glutamic acid by acidic hydrolysis. nd = not detectable; Fru: fructose, Xyl: xylose, Gal: galactose, Man: Mannose; In A bars and error bars represent the means and standard deviation of biological duplicates (n = 2) and technical triplicates (n = 3) for B and C bars and error bars represent the means and standard deviation of biological triplicates (n = 3).
3.3.2 Carbohydrate composition
The sugar profile of the tested Chlorella powders mainly consists of glucose, rhamnose and a mixed peak of fructose, xylose, galactose, and mannose, representing the monomers of cellulose, pectin, and hemicellulose. While there is no significant difference in the sugar profile between the different species, heterotrophic cultivation resulted in a higher amount of glucose (A, F) compared to the photoautotrophically cultivated biomass (Figure 1B; Supplementary Table S2)
3.3.3 Fatty acid composition
In contrast to the amino acid profile, the fatty acid profile showed more pronounced differences between the products. While the amount of C16:0 is comparable for most samples, sample B showed a twofold higher C16:0 content. In general, the green powders (A, E, F) contained more C18:3 compared to the chlorophyll deficient strains (Figure 1C; Supplementary Table S3).
3.3.4 Vitamins C, D, and E
The photoautotrophic samples (A, F) showed a higher vitamin E content, but a lower vitamin C content compared to the heterotrophic samples (B-E, G-H). Among the Chlorella sorokiniana (B-E) strains, vitamin E was determined for the chlorophyll-containing sample E in the highest amount and at low quantities for the white Chlorella powders (B-D). In addition, the mechanical cell disruption using high-pressure homogenization led to an increase of detectable vitamin D and reduced vitamin C (samples B compared to C and D) (Figure 2A; Supplementary Table S4).
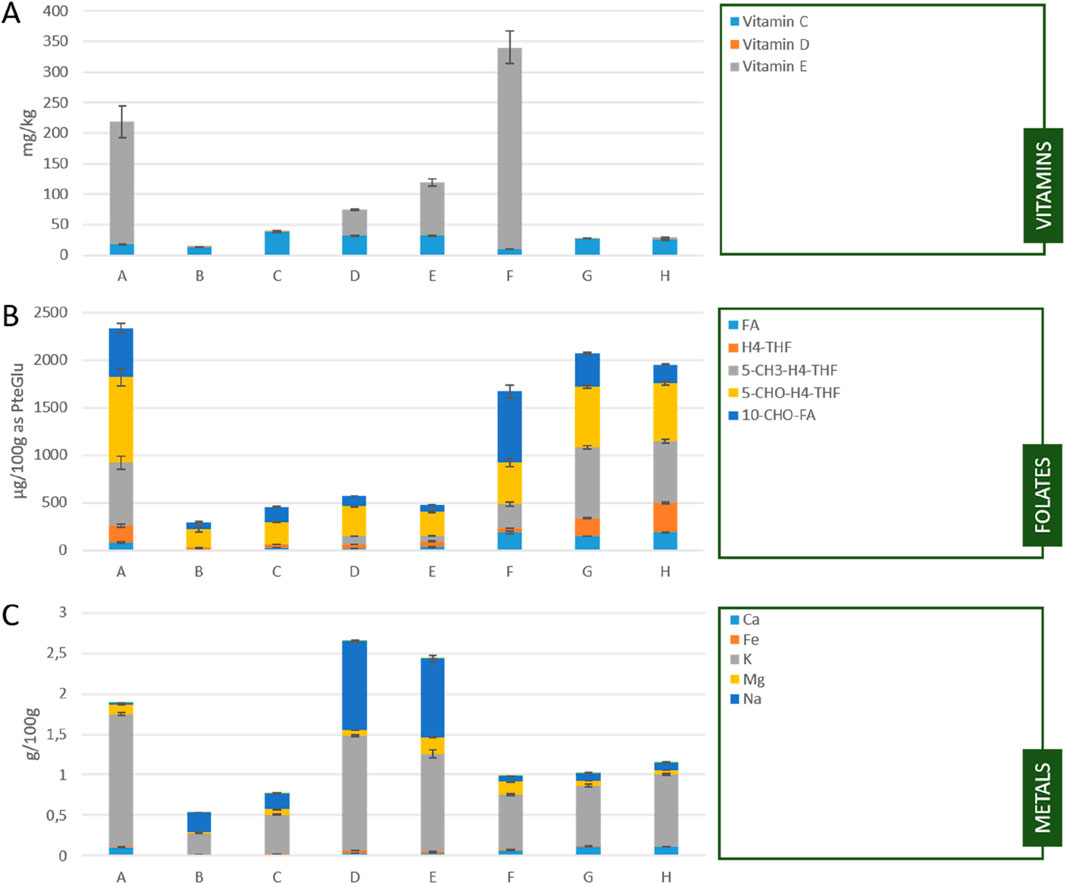
Figure 2. (A) Vitamin C, D, and E content (B) folate content and (C) metal content of the tested Chlorella powders; A: Algomed, Chlorella vulgaris (green), phototrophic; B: Aliga, Chlorella sorokiniana (white), heterotrophic, washed, HPH; C: Aliga, Chlorella sorokiniana (white), heterotrophic, washed; D: Aliga, Chlorella sorokiniana (white), heterotrophic; E: Aliga, Chlorella sorokiniana (green), heterotrophic; F: Bionutra, Chlorella pyrenoidosa (green), phototrophic; G: Allma, Chlorella vulgaris (yellow), heterotrophic; H: Allma, Chlorella vulgaris (white), heterotrophic; FA: folic acid, H4-THF: tetrahydrofolic acid, 5-CH3-H4-THF: 5-methyl-tetrahydrofolic acid, 5-CHO-H4-THF: 5-formyl-tetrahydrofolic acid, 10-CHO-FA: 10-formyl-folic acid; Bars and error bars in (A) represent the means of biological (n = 2) and technical replicates (n = 2) as well as relative standard deviation. Bars and error bars in (B,C) represent the means and standard deviation of biological triplicates (n = 3).
3.3.5 Folates
Folates were present in all tested samples, but the amount and proportion of the vitamers was different. While the folate content was higher for the Chlorella vulgaris strains (A, G, H) as well as Chlorella pyrenoidosa (F), it was much lower for the C. sorokiniana strains (B-E) (Figure 2B; Supplementary Table S5).
3.3.6 Metals
Potassium was the most prominent metal ion found in all samples. The samples from Aliga (B-E) also showed a significant amount of sodium in the powder, which is most probably a residue from the cultivation medium. Magnesium was present in all samples, while calcium was just found in traces in the Aliga samples (B-E). Washing, or washing combined with mechanical cell disruption led to a decrease in metal ion content. (B, C compared to D) (Figure 2C; Supplementary Table S6).
3.4 Sensory analysis
The quantitative descriptive analysis of the orthonasal aroma evaluation of the microalgae samples revealed similar aroma profiles among the different products (Figure 3A). For all samples except B-E (Aliga), hay-like was the most dominant aroma. Sample A (Algomed) exhibited the highest intensity of the green and hay-like aromas, scoring 2.8 and 3.2, respectively, suggesting a pronounced grassy and straw-like note. In contrast, sample D (Aliga) had the lowest green aroma score (1.1). Samples G and H both received similar scores in most aroma categories, suggesting a comparable sensory profile between the two Allma samples. Regarding other aroma attributes, sample D (Aliga) stood out with the highest malty aroma score of 2.1. Allma samples (G, H) received lower scores for earthy aroma than the other samples. In general, all the samples were attributed with lower and similar values for metallic, citrus-like, and sea breeze-like aromas. The prevailing scents in photoautotrophic samples (A, F) were green, hay-like, and earthy, whereas in heterotrophic samples, especially Allma (G, H), the dominant aromas were hay-like and malty. Overall, only smaller differences were found between the samples. The biggest distinction was observed for the green and hay-like aromas. The sensory analysis of taste attributes among the different microalgae samples revealed some differences (Figure 3). In terms of sweetness, sample B (Aliga) exhibited the lowest score among the samples, the other ones being in a similar range as for sourness, samples B to D exhibited the most pronounced characteristics compared to the others. Concerning saltiness, sample D displayed notably higher levels than the other samples, which presented similar scores. Sample G exhibited the lowest score for bitterness. For umami, astringency, and kokumi, all the samples presented similar scores. Umami also was the dominant taste in both Allma samples (G, H), which were also characterized by reduced bitterness.
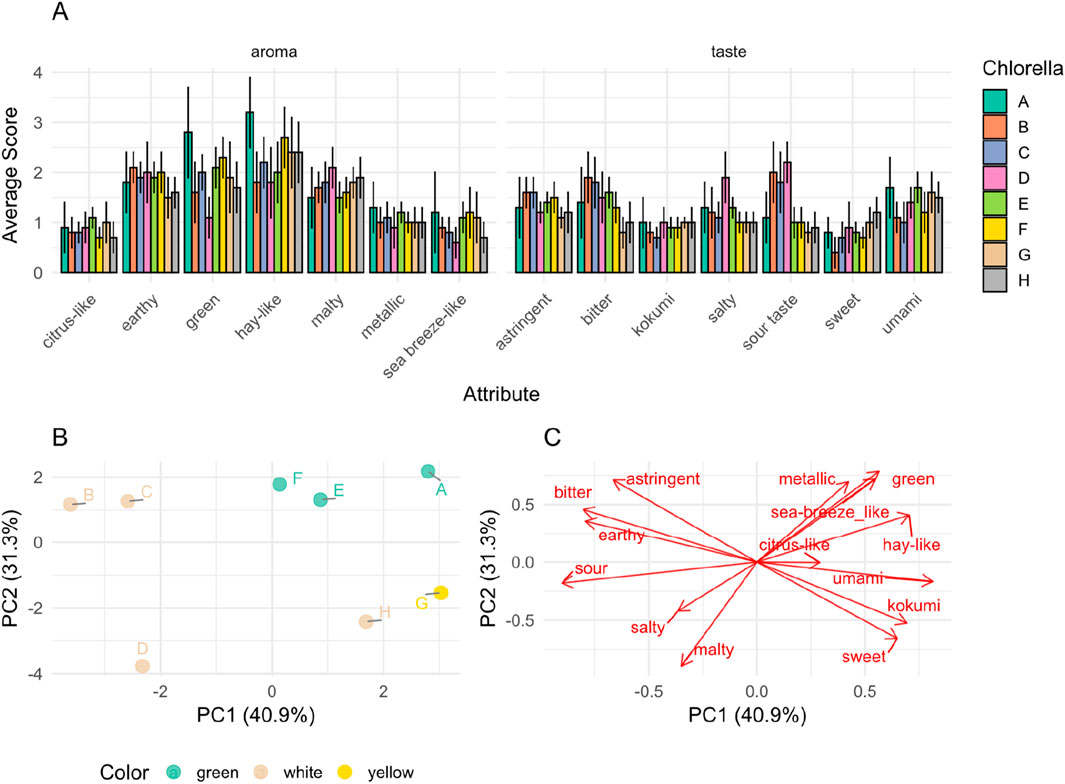
Figure 3. Multi-panel visualization of the sensory data (A) Comparative flavor profile analysis of the tested Chlorella powders (10% in Evian water, pH 5.5) in comparison to the reference “A” (mean ± CI; α = 0.05; n = 12); A: Algomed, Chlorella vulgaris (green), phototrophic; B: Aliga, Chlorella sorokiniana (white), heterotrophic, washed, HPH; C: Aliga, Chlorella sorokiniana (white), heterotrophic, washed; D: Aliga, Chlorella sorokiniana (white), heterotrophic; E: Aliga, Chlorella sorokiniana (green), heterotrophic; F: Bionutra, Chlorella pyrenoidosa (green), phototrophic; G: Allma, Chlorella vulgaris (yellow), heterotrophic; H: Allma, Chlorella vulgaris (white), heterotrophic (B) PCA individuals plot displaying the distribution of Chlorella samples based on sensory attributes, colored by microalgae color. (C) PCA variables plot illustrating the contribution of sensory attributes to the principal components.
The principal component analysis (PCA) of sensory data revealed further clustering patterns among the Chlorella powders in the multivariate space, which are partially connected to cultivation location (along with supplier) and color (Figure 3B). The first two principal components explained 40.9% (PC1) and 31.3% (PC2) of the variance, suggesting differences in sensory perception across the samples. An influence of sample color (green, white, yellow) was observed in PCA clustering (Figure 3B). Green-colored samples (A, E, F) clustered in the positive PC1/PC2 region, suggesting a shared sensory profile which is associated with the sensory variables green, hay-like, and sea-breeze-like attributes (Figure 3C). In contrast, some white samples (B, C, D) are positioned in the negative PC1 region and associated with sour, earthy, and bitter notes (Figures 3B,C). The yellow sample (G) and the white sample H positioned towards the positive PC1 and negative PC2 regions were associated with sweet, umami, and kokumi flavors (Figures 3B,C). These two samples cluster differently from white samples B, C and D and from green samples F, E, and A. This difference suggests that other variables may be playing a role in addition to color. In this case, samples G and H are produced by the same supplier in the same geographical region and with the same processing conditions. Samples cultivated under autotrophic conditions (A, F) and heterotrophically cultivated samples (B, C, D, E, G, H) exhibited more significant variability along PC1 and PC2. This suggests that cultivation conditions and species differences do not seem to contribute to sensory characteristics uniformly. Among heterotrophic samples, Chlorella sorokiniana (B, C, D) formed a subgroup from Chlorella vulgaris (G, H). However, C. sorokiniana sample E and C. vulgaris sample A seem to follow the opposite pattern. Further examination of downstream processing methods indicated that high-pressure homogenization does not seem to explain variance. Sample C resulted in a sensory profile like sample B (same supplier, same color, but no high-pressure homogenization was applied), distinct from other samples. These two samples correlate with bitter, astringent, and earthy notes, which other variables may explain in addition to those presented in Table 1.
4 Discussion
4.1 Pigment analysis
The analysis of photosynthetic pigments gave results that correlated well with the color of the respective products. In accordance to the literature dominant pigments in all green samples were chlorophyll A and B followed by one of the most prominent carotenoids in Chlorophyceae lutein, while in the yellow sample chlorophylls were lacking and lutein was the main remaining pigment (Batista et al., 2013; Khairunnisa et al., 2024). Moreover, all white products did not show any photosynthetic pigments correlating with the sample color.
4.2 Microbiological load
While all samples had microbial loads below the food grade certification limits, there were significant differences between the autotrophic and heterotrophically cultivated samples. Generally, the autotrophic samples had a higher microbial load than the heterotrophically gown Chlorella powders, as latter were generated by precision fermentation using axenic starter cultures in sterilized stainless steel bioreactors. The detected microbial load will most likely be due to the post-harvesting processes that are not conducted under sterile conditions. In this context, washing steps tend to reduce the microbial load, while additional mechanical processing, such as high-pressure homogenization tends to increase microbial loads. The latter may be due to remaining biomass between processing batches, which adds to carry over in the following processing steps. By contrast, in the autotrophic systems the algae cultures contain a symbiotic microbial flora, which is propagated together with the algae biomass in the photobioreactor or open ponds (Almalki et al., 2024). In this context, the autotrophically generated products can be compared to conventional agricultural food products, which all contain a microbial accompanying flora. Biomass processing can significantly impact microbial contamination levels and hence product quality and shelf life.
4.3 Biomass composition
The determined biomass compositions align with the information provided by the suppliers as well as the ranges reported in the literature. The deviations between the tested samples in proteins, carbohydrates, and lipids might be explained by different batches of biomass and different biomass cultivation and processing methods. Specifically, the composition of Chlorella biomass may vary significantly even within the same strain depending on the cultivation conditions, including light intensity, temperature, pH value, nutrient availability, and salinity (Kolackova et al., 2023; Muys et al., 2019). In addition to the cultivation parameters, the downstream processing can affect biomass composition depending on parameters like temperature, drying time, light, oxidation, and drying load (Hosseinizand et al., 2018; Silva et al., 2021; Vilatte et al., 2023). The detailed individual process parameters used for the biomass processing were not available.
The protein content was calculated from the nitrogen content determined by the Kjeldahl method using a nitrogen-to-protein conversion factor (kp) of 4.78. This is a more conservative conversion factor compared to other reports, resulting in the calculation of lower protein contents (Sägesser et al., 2023). The Kjeldahl method is a general quantification method for the determination of organic and inorganic nitrogen including non-protein components, such as photosynthetic pigments (i.e., chlorophyll), cell wall components (i.e., glucosamine) as well as nitrogen-containing media components used for algae cultivation. This non-protein related nitrogen has to be considered when defining a conversion factor, next to the amino acid composition of the contained protein, otherwise protein content may be overestimated. For microalgal biomass different factors ranging from 3.59 to 6.35 are used, (López et al., 2010; Safi et al., 2013). The Kjeldahl method is the commonly used method for raw protein quantification in food and feed, but for a better comparison between different types of biomasses, especially between chlorophyll containing and deficient strains, individual nitrogen-to-protein conversion factors for each sample are needed for accurate protein quantification. In addition, another Chlorella vulgaris powder from Allma showed a higher protein content calculated with a conversion factor of 6.25 but with a high in-vitro digestibility of the biomass including the protein fraction (Niccolai et al., 2019).
The amino acid profile is quite comparable between all tested samples independent of strain, cultivation condition or downstream processing. Chlorella generally has more leucine, lysine, and valine compared to meat like beef, mutton or pork. Reportedly, animal proteins tend to have higher levels of methionine and cysteine as well as glycine. Compared to soybean and egg, Chlorella contains lower levels of glutamic acid, lysine and Isoleucine. Overall, the data highlights the nutritional value of Chlorella sp. as a valuable protein source. Its amino acid profile makes it a promising candidate for supplementing human diets, particularly for individuals seeking plant-based protein alternatives (Table 4).

Table 4. Amino acid composition in Chlorella vulgaris, meat samples and legumes. Ala, L-alanine; Gly, glycine; Asp, L-aspartic acid; Glu, L-glutamic acid; His, L-histidine; Ile, L-isoleucine; Leu, L-leucine; Lys, L-lysine; Phe, L-phenylalanine; Pro, L-proline; Ser, L-serine; Thr, L-threonine; Val, L-valine; Pyr, L-pyroglutamic acid, Met, methionine; Tyr, tyrosine; Trp, tryptophan, Cys, cysteine. References: A: average of all Chlorella powders tested in this study; B: (Koyande et al., 2019); C: (Jorfi et al., 2012); D: (Joint, 1977); E (Becker, 2007).
The carbohydrate content as well as the sugar profile of the tested Chlorella powders was comparable between the photoautotrophic (A, F) and the heterotrophic samples. In general, the heterotrophic samples showed a higher carbohydrate content and a higher share of glucose. The species, detailed cultivation conditions, and downstream processing seem to have a minor effect on the carbohydrate content or sugar profile. C. sorokiniana and C. vulgaris belong to the glucosamine group of the Chlorella sp., which means that the rigid cell is mostly composed of glucosamine together with glucose, mannose, rhamnose, and galactose (Takeda, 1988; Takeda, 1991). Therefore, the mixed peak of fructose, xylose, mannose, and galactose should be mainly composed of mannose and galactose. The higher share of glucose in the heterotrophic samples might also be due to the chemical hydrolysis of intracellular starch used as carbon storage in Chlorella (Takeshita et al., 2014). In addition, there are different methods to determine the carbohydrate and/or fiber content in food. While in some cases carbohydrates represent the residual biomass after determination on the other macronutrients, in this study carbohydrates like starch and most cell wall components were chemically hydrolyzed and quantified by HPLC (Grácio et al., 2024). The residual biomass after determination of the macronutrients including carbohydrates is commonly considered as fiber content. Depending of the methods used for quantification of total dietary fibers there is a wide range in literature covering the non-defined amount of the tested Chlorella powders between 7.0 and 23.7 (Gao et al., 2024; Niccolai et al., 2019; Nova et al., 2019)
The cultivation conditions play a crucial role in shaping the fatty acid profile of microalgae. For instance, using hetero- or photoautotrophic cultivation, nutrient availability, light intensity, temperature, as well as pH can affect the synthesis of specific fatty acids (Alkhamis et al., 2022; Bajwa et al., 2019; Cheirsilp et al., 2023; Gómez-De la Torre et al., 2023; Yun et al., 2020). Interestingly, the fatty acid profile of sample B was quite different compared to sample C and D, even though they are the same strain and only underwent different downstream processing methods. While the washing step did not affect the fatty acid profile significantly, the high-pressure homogenization step led to a decrease in unsaturated fatty acid and in total lipid content. This could be explained by strong mixing as well as an increase in temperature during the process leading to oxidation of unsaturated fatty acids. This effect was analyzed by Canelli et al. observing higher lipid oxidation with the mechanical cell disruption (Canelli et al., 2021).
The vitamin C, D and E content varies in the published range over the tested Chlorella powders (Bito et al., 2020; Sandgruber et al., 2023). While the content of vitamin C was in a comparable range for all powders, the vitamin D content was quite low but higher for sample B with mechanical cell disruption. This increase might be caused by a better accessibility of the lipid soluble vitamin after cell disruption. On the other hand, this behavior was not detectable for sample F with mechanical cell disruption but other supplier, species, and cultivation. The highest vitamin E content was determined for the photoautotrophic samples, followed by the chlorophyll containing, heterotrophic sample (E). Interestingly, vitamin E was detected in the chlorophyll-deficient Chlorella sorokiniana but only without the washing step in downstream processing.
Notably, Chlorella has been recognized for its high folate levels (Bito et al., 2020; Edelmann et al., 2019; Woortman et al., 2020). Folate content and distribution of the different oxidation levels are reported to be dependent on the cultivation conditions as well as downstream processing (Blancquaert et al., 2015; Fitzpatrick et al., 2012; Woortman et al., 2020). The results for the tested Chlorella powders indicate that the species seems to have the highest impact on the folate content and distribution. The three different species C. vulgaris (A, G, H), C. sorokiniana (B-E) and Chlorella pyrenoidosa (F) showed similar results within the group independent of the supplier, cultivation, downstream processing or chlorophyll deficiency. The folate content of C. vulgaris and C. pyrenoidosa was in the published range of C. vulgaris between 1,200 and 3,600 µg/100 g (Bito et al., 2020), C. sorokiniana showed significant lower levels between 267 and 530 µg/100 g. While the content of vitamin C, D, and E in the tested Chlorella powders was quite low, Chlorella, especially C. vulgaris, seems to be a suitable source of folates in human diet.
Microalgae are known to adsorb and bioaccumulate metals, due to negatively charged functional groups of their cell walls (Kumar et al., 2015; Paper et al., 2023; Sandgruber et al., 2023). The main source of metals in the Chlorella powder is most probably the media composition used for cultivation. Washing the cells in water or buffer has demonstrated the effective removal of salts from microalgae (Khaw et al., 2021; Zhu and Lee, 1997). This can be seen by the significant reduction in metal content for samples B and C compared with the unwashed sample D. This reduction in metals aligns with the ash content determined for the tested samples, representing the total mineral amount.
4.4 Sensory analysis
The sensory profile of microalgae can be affected by various compositional factors (Van Durme et al., 2013). For instance, the presence of sulfuric compounds correlates with typical seafood flavors (sea breeze like variables) while shorter chain aldehydes contribute to green, fruity, and vegetable flavors (green and hay like attributes). Food manufacturers may use these intrinsic attributes to incorporate microalgae into alternative protein food products as a nutritious and valuable ingredient (Coleman et al., 2022). Our results point to differences among the tested Chlorella powders; these differences must be taken into account by the food manufacturer when choosing the raw material ingredient to be integrated into the production process.
Amino acid composition, particularly the content of phenylalanine, can lead to distinctively higher levels of benzaldehyde, impacting the overall aroma. Furthermore, alanine, glycine, proline, serine, and threonine may provide a sweet taste, whereas histidine, allo-isoleucine, isoleucine, leucine, methionine, phenylalanine, tryptophan, and valine are related to a bitter taste; aspartic acid and glutamic acid are correlated to the umami taste (Zamuz et al., 2019). Additionally, the concentration of PUFAs plays a role, where species with higher PUFA concentrations tend to exhibit more linear aldehydes, due to enzymatic processes and fatty acid oxidation. The presence of carotenoids in microalgae can also lead to the production of ionones, well-known for their floral sensory properties (Van Durme et al., 2013). Few studies have explored the sensory traits of C. vulgaris. One study by Van Durme focused on evaluating the aroma of phototrophic C. vulgaris while another study by Isleten Hosoglu examined a heterotrophic grown C. vulgaris (Hosoglu, 2018; Van Durme et al., 2013). They agree that Chlorella has a rather bland flavor profile dominated by ‘grassy, vegetable, cucumber’ aromas (Hosoglu, 2018; Van Durme et al., 2013) with less fishy, shrimpy and marine odors, making Chlorella less suitable for alternative seafood solutions (Francezon et al., 2021). Similar results were observed for the eight tested Chlorella powders in this study with a decrease in green and hay-like odor for the chlorophyll deficient strains (B-D, G, H) as well as heterotrophically cultivated green Chlorella to a smaller extent (E). While the sour taste was higher for all chlorophyll-deficient samples from Aliga (B-D), the salty flavor was reduced by washing in the downstream processing (D compared to B, C). Overall, from the dimensionality reduction of the sensory data, the color difference, alongside production location and supplier, seemed to emerge as relevant variables. Downstream processing, including drying, washing, and high-pressure homogenization, does not seem to influence the sensory profile of the studied samples. This may be due to limited information on the detailed cultivation and processing steps adopted for the studied samples. Green Chlorella samples A, E, F which clustered together based on their sensory profile (Figure 3B) were also found to contain high levels of C18:3 fatty acids compared to the other samples (Figure 1C). This sample cluster is associated the most with green, hay-like sensory notes which are, attributes associated with oxidation of unsaturated fatty acids and consequent production of aldehydes and ketones in alternative proteins (Mittermeier-Kleßinger et al., 2021).
These results represent key information for food suppliers to select the most suitable Chlorella powder for the specific application. For instance, a vegan replacement for seafood may look at powders with a higher intensity of umami, kokumi, and sea breeze-like sensory notes while minimizing bitter and sour notes. A deeper mechanistic understanding of the variables influencing each descriptor must still be obtained to fine-tune the cultivation and production process. This mechanistic understanding cannot be based on commercial products but has to be studied and controlled from cultivation to storage and consumption (Zhou et al., 2017).
5 Summary
The eight different types of Chlorella powders covering different suppliers, strains, cultivation methods, and downstream processing showed a comparable biomass composition with slightly lower protein contents for the chlorophyll deficient strains, slightly higher sugar contents for the heterotrophic samples, and slightly lower lipid contents for C. sorokiniana. The amino acid profile was comparable between all tested samples, in the sugar profile the glucose concentration was higher for the heterotrophic samples and the highest deviation was shown in the fatty acid profile. The vitamin levels were in a similar range with a higher vitamin D content for sample B, a higher vitamin E content for the phototrophic samples A and F as well as a lower folate content for the C. sorokiniana strains (B-E). The presence of metals was assumed to be linked to the media formulation used for cultivation and was overall reduced by washing during downstream processing. The taste and odor profiles of the tested samples were comparable, with a reduced hay-like and green odor for the chlorophyll-deficient strains. In conclusion, the biomass composition showed mostly differences on a micronutrient level. The cellular capacity to do photosynthesis, such as the presence of chlorophyll, seemed to have the highest impact on taste and odor. Notably, the microbial loads of the different Chlorella product preparations varied significantly, which may be due to both cultivation and post-harvesting biomass processing methods. Heterotrophically produced biomass under sterile cultivation conditions had the lower loads. Biomass processing can significantly impact microbial contamination levels and hence product quality and shelf life, while all examined products were within EFSA specifications about microbial loads.
In summary, the comparative nutrient and sensory evaluation presented in this study will aid in selection of microalgae products for food development, fostering a broadening of applications in the food space. Our study could confirm the high nutritional density of algae biomass, with the high protein content being beneficial for generation of protein-rich food, including shakes, bakery products, and meat substitutes. While this study provides an overview of the nutritional value and sensory perception of commercial Chlorella preparation, bioavailability of these nutrients for consumers was not assessed. In this context, human intervention studies to explore nutrient accessibility and effects are currently underway. As a first indicator, the balanced amino acid profile being independent from cultivation and processing conditions together with an abundance of vitamins (specifically vitamin C) may potentially aid digestibility and metabolic valorization of algae protein fractions (Said, 2023). Further studies with focus on isolation, concentration, and processing of algae protein fractions are ongoing in the Protein4Singapore consortium addressing urgent market needs and consumer demand.
Data availability statement
The original contributions presented in the study are included in the article/Supplementary Material, further inquiries can be directed to the corresponding authors.
Author contributions
FM: Conceptualization, Formal Analysis, Methodology, Writing – review and editing, Data curation, Investigation, Visualization, Writing – original draft. TP: Data curation, Formal Analysis, Investigation, Methodology, Visualization, Writing – original draft, Validation, Writing – review and editing. DiG: Formal Analysis, Validation, Investigation, Methodology, Visualization, Writing – original draft, Data curation. FU: Conceptualization, Data curation, Formal Analysis, Investigation, Methodology, Validation, Visualization, Writing – original draft. MP: Data curation, Formal Analysis, Investigation, Methodology, Validation, Visualization, Writing – original draft, Writing – review and editing. AS: Data curation, Formal analysis, Methodology, Validation, Visualization, Software, Writing – review and editing. LO: Data curation, Formal Analysis, Investigation, Methodology, Validation, Writing – original draft. JS: Data curation, Formal Analysis, Investigation, Methodology, Validation, Writing – original draft. MK: Data curation, Formal Analysis, Investigation, Methodology, Validation, Writing – original draft. DaG: Funding acquisition, Project administration, Resources, Writing – review and editing, Data curation, Methodology, Supervision. TN: Formal Analysis, Methodology, Project administration, Resources, Supervision, Validation, Writing – review and editing. TBe: Formal Analysis, Methodology, Project administration, Resources, Supervision, Validation, Writing – review and editing. MR: Formal Analysis, Methodology, Project administration, Resources, Supervision, Validation, Writing – review and editing. CD: Formal Analysis, Methodology, Project administration, Resources, Supervision, Validation, Writing – review and editing. WB: Data curation, Formal Analysis, Investigation, Methodology, Project administration, Resources, Supervision, Validation, Visualization, Writing – original draft, Writing – review and editing. NS: Conceptualization, Formal Analysis, Funding acquisition, Project administration, Resources, Supervision, Validation, Writing – review and editing, Data curation, Methodology. TBr: Conceptualization, Formal Analysis, Funding acquisition, Methodology, Project administration, Resources, Supervision, Validation, Writing – review and editing.
Funding
The author(s) declare that financial support was received for the research and/or publication of this article. TBB and FM gratefully acknowledge the Valuable (https://valuable-project.eu) project (Grant Agreement No.: 101059786) funded under the European Union’s Horizon Europe research and innovation programme. CD, TB, TBB, MR, NIS, TP, and DG gratefully acknowledge funding for the Proteins4Singapore project (https://www.tum-create.edu.sg/research/proteins4singapore). Parts of the research is supported by the National Research Foundation, Prime Minister’s Office, Singapore under its Campus for Research Excellence and Technological Enterprise (CREATE) program. TBB acknowledges the Werner Siemens Foundation for initial funding of the new research area of Synthetic Biotechnology at the Technical University of Munich.
Conflict of interest
The authors declare that the research was conducted in the absence of any commercial or financial relationships that could be construed as a potential conflict of interest.
The author(s) declared that they were an editorial board member of Frontiers, at the time of submission. This had no impact on the peer review process and the final decision.
Correction note
This article has been corrected with minor changes. These changes do not impact the scientific content of the article.
Generative AI statement
The author(s) declare that no Generative AI was used in the creation of this manuscript.
Publisher’s note
All claims expressed in this article are solely those of the authors and do not necessarily represent those of their affiliated organizations, or those of the publisher, the editors and the reviewers. Any product that may be evaluated in this article, or claim that may be made by its manufacturer, is not guaranteed or endorsed by the publisher.
Supplementary material
The Supplementary Material for this article can be found online at: https://www.frontiersin.org/articles/10.3389/frfst.2025.1534438/full#supplementary-material
Abbreviations
FFA, free fatty acid; FAME, fatty acid methyl ester; EU, European Union; RT, room temperature; EDTA, Ethylenediaminetetraacetic acid; FA, folic acid, H4-THF, tetrahydrofolic acid, 5-CH3-H4-THF, 5-methyl-tetrahydrofolic acid, 5-CHO-H4-THF, 5-formyl-tetrahydrofolic acid, 10-CHO-FA, 10-formyl-folic acid; Fru, fructose, Xyl, xylose, Gal, galactose, Man, Mannose.
References
Additives, E. P. o. F., and Food, N. S. a. t. (2015). Scientific Opinion on the re-evaluation of chlorophylls (E 140 (i)) as food additives. EFSA J. 13 (5), 4089. doi:10.2903/j.efsa.2015.4089
Alkhamis, Y. A., Mathew, R. T., Nagarajan, G., Rahman, S. M., and Rahman, M. M. (2022). pH induced stress enhances lipid accumulation in microalgae grown under mixotrophic and autotrophic condition. Front. Energy Res. 10, 1033068. doi:10.3389/fenrg.2022.1033068
Almalki, W. J., Nwokeoji, A. O., and Vaidyanathan, S. (2024). Density and composition of cohabiting bacteria in Chlorella vulgaris CCAP 211/21a is influenced by changes in nutrient supply. SynBio 2 (2), 190–204. doi:10.3390/synbio2020011
Andrade, L., Andrade, C., Dias, M., Nascimento, C., and Mendes, M. (2018). Chlorella and spirulina microalgae as sources of functional foods, nutraceuticals, and food supplements; an overview. Nutraceuticals, Food Suppl. 6 (1), 45–58. doi:10.15406/mojfpt.2018.06.00144
Authority, E. F. S. (2005). Opinion of the Scientific Panel on biological hazards (BIOHAZ) on Bacillus cereus and other Bacillus spp in foodstuffs. EFSA J. 3 (4), 175. doi:10.2903/j.efsa.2005.175
Bajwa, K., Bishnoi, N. R., Kirrolia, A., Gupta, S., and Tamil Selvan, S. (2019). Response surface methodology as a statistical tool for optimization of physio-biochemical cellular components of microalgae Chlorella pyrenoidosa for biodiesel production. Appl. Water Sci. 9, 128–216. doi:10.1007/s13201-019-0969-x
Barros, A., Pereira, H., Campos, J., Marques, A., Varela, J., and Silva, J. (2019). Heterotrophy as a tool to overcome the long and costly autotrophic scale-up process for large scale production of microalgae. Sci. Rep. 9 (1), 13935. doi:10.1038/s41598-019-50206-z
Batista, A. P., Gouveia, L., Bandarra, N. M., Franco, J. M., and Raymundo, A. (2013). Comparison of microalgal biomass profiles as novel functional ingredient for food products. Algal Res. 2 (2), 164–173. doi:10.1016/j.algal.2013.01.004
Becker, E. W. (2007). Micro-algae as a source of protein. Biotechnol. Adv. 25 (2), 207–210. doi:10.1016/j.biotechadv.2006.11.002
Bhuvana, P., Sangeetha, P., Anuradha, V., and Ali, M. S. (2019). Spectral characterization of bioactive compounds from microalgae: N. oculata and C. vulgaris. Biocatal. Agric. Biotechnol. 19, 101094. doi:10.1016/j.bcab.2019.101094
Bito, T., Okumura, E., Fujishima, M., and Watanabe, F. (2020). Potential of Chlorella as a dietary supplement to promote human health. Nutrients 12 (9), 2524. doi:10.3390/nu12092524
Blancquaert, D., Van Daele, J., Strobbe, S., Kiekens, F., Storozhenko, S., De Steur, H., et al. (2015). Improving folate (vitamin B9) stability in biofortified rice through metabolic engineering. Nat. Biotechnol. 33 (10), 1076–1078. doi:10.1038/nbt.3358
Brehm, L., Jünger, M., Frank, O., and Hofmann, T. (2019). Discovery of a thiamine-derived taste enhancer in process flavors. J. Agric. Food Chem. 67 (20), 5857–5865. doi:10.1021/acs.jafc.9b01832
Cabrol, M. B., Glišić, M., Baltić, M., Jovanović, D., Silađi, Č., Simunović, S., et al. (2023). White and honey Chlorella vulgaris: sustainable ingredients with the potential to improve nutritional value of pork frankfurters without compromising quality. Meat Sci., 198, 109123. doi:10.1016/j.meatsci.2023.109123
Canelli, G., Martínez, P. M., Hauser, B. M., Kuster, I., Rohfritsch, Z., Dionisi, F., et al. (2021). Tailored enzymatic treatment of Chlorella vulgaris cell wall leads to effective disruption while preserving oxidative stability. LWT 143, 111157.
Caul, J. F. (1957). “The profile method of flavor analysis,”Adv. food Res., 7, 1–40. doi:10.1016/s0065-2628(08)60245-1
Cheirsilp, B., Maneechote, W., Srinuanpan, S., and Angelidaki, I. (2023). Microalgae as tools for bio-circular-green economy: zero-waste approaches for sustainable production and biorefineries of microalgal biomass. Bioresour. Technol. 387, 129620. doi:10.1016/j.biortech.2023.129620
Coleman, B., Van Poucke, C., Dewitte, B., Ruttens, A., Moerdijk-Poortvliet, T., Latsos, C., et al. (2022). Potential of microalgae as flavoring agents for plant-based seafood alternatives. Future Foods 5, 100139. doi:10.1016/j.fufo.2022.100139
Crippa, M., Solazzo, E., Guizzardi, D., Monforti-Ferrario, F., Tubiello, F. N., and Leip, A. (2021). Food systems are responsible for a third of global anthropogenic GHG emissions. Nat. Food 2 (3), 198–209. doi:10.1038/s43016-021-00225-9
de Godoy, R. C. B., Chambers IV, E., and Yang, G. (2020). Development of a preliminary sensory lexicon for mate tea. J. Sens. Stud. 35 (3), e12570. doi:10.1111/joss.12570
Edelmann, M., Aalto, S., Chamlagain, B., Kariluoto, S., and Piironen, V. (2019). Riboflavin, niacin, folate and vitamin B12 in commercial microalgae powders. J. Food Compos. Analysis 82, 103226. doi:10.1016/j.jfca.2019.05.009
Engelhart-Straub, S., Cavelius, P., Hölzl, F., Haack, M., Awad, D., Brueck, T., et al. (2022). Effects of light on growth and metabolism of rhodococcus erythropolis. Microorganisms 10 (8), 1680. doi:10.3390/microorganisms10081680
Fischer, A., and Schieberle, P. (2009). Characterisation of the key aroma compounds in the peel oil of Pontianak oranges (Citrus nobilis Lour. var. microcarpa Hassk.) by aroma reconstitution experiments. Eur. Food Res. Technol. 229, 319–328. doi:10.1007/s00217-009-1058-4
Fitzpatrick, T. B., Basset, G. J., Borel, P., Carrari, F., DellaPenna, D., Fraser, P. D., et al. (2012). Vitamin deficiencies in humans: can plant science help? Plant Cell 24 (2), 395–414. doi:10.1105/tpc.111.093120
Food, U., and Administration, D. (2016). Substances generally recognized as safe. U. S. Fed. Reg. 81 (159), 54960.
Francezon, N., Tremblay, A., Mouget, J.-L., Pasetto, P., and Beaulieu, L. (2021). Algae as a source of natural flavors in innovative foods. J. Agric. food Chem. 69 (40), 11753–11772. doi:10.1021/acs.jafc.1c04409
Fu, Y., Chen, T., Chen, S. H. Y., Liu, B., Sun, P., Sun, H., et al. (2021). The potentials and challenges of using microalgae as an ingredient to produce meat analogues. Trends Food Sci. and Technol. 112, 188–200. doi:10.1016/j.tifs.2021.03.050
Gao, L., Qin, Y., Zhou, X., Jin, W., He, Z., Li, X., et al. (2024). Microalgae as future food: rich nutrients, safety, production costs and environmental effects. Sci. Total Environ. 927, 172167. doi:10.1016/j.scitotenv.2024.172167
Gómez-De la Torre, A. E., Ochoa-Alfaro, A. E., Rocha-Uribe, A., and Soria-Guerra, R. E. (2023). Effects of sulfur and phosphorus concentration on the lipid accumulation and fatty acid profile in Chlorella vulgaris (Chlorophyta). Folia Microbiol. 68 (3), 453–463. doi:10.1007/s12223-022-01029-5
Grácio, M., Ferreira, J., Steinrücken, P., Kleinegris, D. M. M., Sousa, I., Nunes, M. C., et al. (2024). The volatile composition and the potential health benefits of different microalgae strains. Foods 13 (14), 2174. doi:10.3390/foods13142174
Hillmann, H., Mattes, J., Brockhoff, A., Dunkel, A., Meyerhof, W., and Hofmann, T. (2012). Sensomics analysis of taste compounds in balsamic vinegar and discovery of 5-acetoxymethyl-2-furaldehyde as a novel sweet taste modulator. J. Agric. Food Chem. 60 (40), 9974–9990. doi:10.1021/jf3033705
Hosoglu, M. I. (2018). Aroma characterization of five microalgae species using solid-phase microextraction and gas chromatography–mass spectrometry/olfactometry. Food Chem. 240, 1210–1218. doi:10.1016/j.foodchem.2017.08.052
Hosseinizand, H., Sokhansanj, S., and Lim, C. J. (2018). Studying the drying mechanism of microalgae Chlorella vulgaris and the optimum drying temperature to preserve quality characteristics. Dry. Technol. 36 (9), 1049–1060. doi:10.1080/07373937.2017.1369986
Hu, W. S., Woo, D. U., Kang, Y. J., and Koo, O. K. (2021). Biofilm and spore formation of Clostridium perfringens and its resistance to disinfectant and oxidative stress. Antibiotics 10 (4), 396. doi:10.3390/antibiotics10040396
Joint, F. (1977). “Energy and protein requirements,” in Report of a joint, 22. Rome: FAO/WHO Ad Hoc Expert Committee.
Jorfi, R., Mustafa, S., Man, Y. B. C., Hashim, D. B. M., Sazili, A. Q., Farjam, A. S., et al. (2012). Differentiation of pork from beef, chicken, mutton and chevon according to their primary amino acids content for halal authentication. Afr. J. Biotechnol. 11 (32), 8160–8166. doi:10.5897/ajb11.3777
Jurkowski, W., Paper, M., and Brück, T. B. (2022). Isolation and investigation of natural rare earth metal chelating agents from Calothrix brevissima-a step towards unraveling the mechanisms of metal biosorption. Front. Bioeng. Biotechnol. 10, 833122. doi:10.3389/fbioe.2022.833122
Khairunnisa, K., Hartati, R., and Widowati, I. (2024). Chlorophyll content of Chlorella vulgaris (beijerinck, 1890) on different light intensity. Bul. Oseanogr. Mar. 13 (1), 107–112. doi:10.14710/buloma.v13i1.59218
Khaw, Y. S., Tan, H. T., Sopawong, A., Shaharuddin, N. A., Omar, A. R., and Yusoff, F. M. (2021). A recommendation for a pre-standardized marine microalgal dry weight determination protocol for laboratory scale culture using ammonium formate as a washing agent. Biology 10 (8), 799. doi:10.3390/biology10080799
Kolackova, M., Janova, A., Dobesova, M., Zvalova, M., Chaloupsky, P., Krystofova, O., et al. (2023). Role of secondary metabolites in distressed microalgae. Environ. Res. 224, 115392. doi:10.1016/j.envres.2023.115392
Koyande, A. K., Chew, K. W., Rambabu, K., Tao, Y., Chu, D.-T., and Show, P.-L. (2019). Microalgae: a potential alternative to health supplementation for humans. Food Sci. Hum. Wellness 8 (1), 16–24. doi:10.1016/j.fshw.2019.03.001
Kreissl, J. M. V., Steinhaus, P., and Steinhaus, M. (2022).“Leibniz-LSB@TUM odorant database,” in Leibniz institute for food systems biology at the technical university of Munich. Freising, Germany. Available online at: https://www.leibniz-lsb.de/en/databases/leibniz-lsbtum-odorant-database.
Kumar, K. S., Dahms, H.-U., Won, E.-J., Lee, J.-S., and Shin, K.-H. (2015). Microalgae–a promising tool for heavy metal remediation. Ecotoxicol. Environ. Saf. 113, 329–352. doi:10.1016/j.ecoenv.2014.12.019
Kyrylenko, A., Eijlander, R. T., Alliney, G., Lucas-van de Bos, E., and Wells-Bennik, M. H. (2023). Levels and types of microbial contaminants in different plant-based ingredients used in dairy alternatives. Int. J. Food Microbiol. 407, 110392. doi:10.1016/j.ijfoodmicro.2023.110392
Levasseur, W., Perré, P., and Pozzobon, V. (2020). A review of high value-added molecules production by microalgae in light of the classification. Biotechnol. Adv. 41, 107545. doi:10.1016/j.biotechadv.2020.107545
López, C. V. G., García, M. d. C. C., Fernández, F. G. A., Bustos, C. S., Chisti, Y., and Sevilla, J. M. F. (2010). Protein measurements of microalgal and cyanobacterial biomass. Bioresour. Technol. 101 (19), 7587–7591. doi:10.1016/j.biortech.2010.04.077
Mall, V., and Schieberle, P. (2017). Evaluation of key aroma compounds in processed prawns (whiteleg shrimp) by quantitation and aroma recombination experiments. J. Agric. food Chem. 65 (13), 2776–2783. doi:10.1021/acs.jafc.7b00636
Markou, G., Angelidaki, I., and Georgakakis, D. (2012). Microalgal carbohydrates: an overview of the factors influencing carbohydrates production, and of main bioconversion technologies for production of biofuels. Appl. Microbiol. Biotechnol. 96, 631–645. doi:10.1007/s00253-012-4398-0
Matard-Mann, M., Bernard, T., Leroux, C., Barbeyron, T., Larocque, R., Préchoux, A., et al. (2017). Structural insights into marine carbohydrate degradation by family GH16 κ-carrageenases. J. Biol. Chem. 292 (48), 19919–19934. doi:10.1074/jbc.M117.808279
McHugh, A. J., Feehily, C., Hill, C., and Cotter, P. D. (2017). Detection and enumeration of spore-forming bacteria in powdered dairy products. Front. Microbiol. 8, 109. doi:10.3389/fmicb.2017.00109
Mebak, o. (2016a). Method R-110.40.020 [2016-03] Wassergehalt von Gerste – Trockenschrank-Methode. Mitteleur. Brautech. Anal. (MEBAK®) e.V., Freising, BY, Ger. Available online at: https://www.mebak.org/methode/r-110-40-020/wassergehalt-von-gerste-trockenschrank-methode/1946.
Mebak, o. (2016b). Method R-110.41.030 [2016-03] nitrogen content (raw protein) in barley – KJELDAHL. Mitteleur. Brautech. Anal. (MEBAK®) e.V. Available online at: https://www.mebak.org/en/methode/r-110-41-030/nitrogen-content-raw-protein-in-barley-kjeldahl/2588.
Mirón, I. J., Linares, C., and Díaz, J. (2023). The influence of climate change on food production and food safety. Environ. Res., 216, 114674. doi:10.1016/j.envres.2022.114674
Mittermeier-Kleßinger, V. K., Hofmann, T., and Dawid, C. (2021). Mitigating off-flavors of plant-based proteins. J. Agric. Food Chem. 69 (32), 9202–9207. doi:10.1021/acs.jafc.1c03398
Muys, M., Sui, Y., Schwaiger, B., Lesueur, C., Vandenheuvel, D., Vermeir, P., et al. (2019). High variability in nutritional value and safety of commercially available Chlorella and Spirulina biomass indicates the need for smart production strategies. Bioresour. Technol. 275, 247–257. doi:10.1016/j.biortech.2018.12.059
Nations, U. (2022a). 2022 revision of world population prospects. Available online at: https://population.un.org/wpp/.
Nations, U. (2022b). UN Report: global hunger numbers rose to as many as 828 million in 2021. Available online at: https://www.who.int/news/item/06-07-2022-un-report--global-hunger-numbers-rose-to-as-many-as-828-million-in-2021.
Niccolai, A., Zittelli, G. C., Rodolfi, L., Biondi, N., and Tredici, M. R. (2019). Microalgae of interest as food source: biochemical composition and digestibility. Algal Res. 42, 101617. doi:10.1016/j.algal.2019.101617
Nova, P., Martins, A. P., Silva, J. G., Pereira, R., Abreu, H., Silva, A. M., et al. (2019). Determination of soluble and insoluble dietary fiber content of marine macroalgae and microalgae. Book of abstracts of the XX EuroFoodChem Congress
Nwoba, E. G., Mickan, B. S., and Moheimani, N. R. (2019). Chlorella sp. growth under batch and fed-batch conditions with effluent recycling when treating the effluent of food waste anaerobic digestate. J. Appl. Phycol. 31, 3545–3556. doi:10.1007/s10811-019-01878-7
Paper, M., Glemser, M., Haack, M., Lorenzen, J., Mehlmer, N., Fuchs, T., et al. (2022). Efficient green light acclimation of the green algae Picochlorum sp. triggering geranylgeranylated chlorophylls. Front. Bioeng. Biotechnol. 10, 885977. doi:10.3389/fbioe.2022.885977
Paper, M., Koch, M., Jung, P., Lakatos, M., Nilges, T., and Brück, T. B. (2023). Rare earths stick to rare cyanobacteria: future potential for bioremediation and recovery of rare earth elements. Front. Bioeng. Biotechnol. 11, 1130939. doi:10.3389/fbioe.2023.1130939
Patel, A. K., Singhania, R. R., Dong, C.-D., Obulisami, P. K., and Sim, S. J. (2021). Mixotrophic biorefinery: a promising algal platform for sustainable biofuels and high value coproducts. Renew. Sustain. Energy Rev. 152, 111669. doi:10.1016/j.rser.2021.111669
Qin, H.-M., Gao, D., Zhu, M., Li, C., Zhu, Z., Wang, H., et al. (2020). Biochemical characterization and structural analysis of ulvan lyase from marine Alteromonas sp. reveals the basis for its salt tolerance. Int. J. Biol. Macromol. 147, 1309–1317. doi:10.1016/j.ijbiomac.2019.10.095
Safi, C., Charton, M., Pignolet, O., Silvestre, F., Vaca-Garcia, C., and Pontalier, P.-Y. (2013). Influence of microalgae cell wall characteristics on protein extractability and determination of nitrogen-to-protein conversion factors. J. Appl. Phycol. 25, 523–529. doi:10.1007/s10811-012-9886-1
Sägesser, C., Kallfelz, J. M., Boulos, S., Hammer, L., Böcker, L., Portmann, R., et al. (2023). A novel approach for the protein determination in food-relevant microalgae. Bioresour. Technol. 390, 129849. doi:10.1016/j.biortech.2023.129849
Said, A. (2023). The impact of ascorbic acid (E 300) on digestion of different nutrients using in vitro digestion model.
Sandgruber, F., Gielsdorf, A., Schenz, B., Müller, S. M., Schwerdtle, T., Lorkowski, S., et al. (2023). Variability in macro-and micronutrients of 15 rarely researched microalgae. Mar. Drugs 21 (6), 355. doi:10.3390/md21060355
Schüler, L., Greque de Morais, E., Trovão, M., Machado, A., Carvalho, B., Carneiro, M., et al. (2020). Isolation and characterization of novel Chlorella vulgaris mutants with low chlorophyll and improved protein contents for food applications. Front. Bioeng. Biotechnol. 8, 469. doi:10.3389/fbioe.2020.00469
Silva, T. L. d., Moniz, P., Silva, C., and Reis, A. (2021). The role of heterotrophic microalgae in waste conversion to biofuels and bioproducts. Processes 9 (7), 1090. doi:10.3390/pr9071090
Stone, H., Bleibaum, R. N., and Thomas, H. A. (2012). Sensory evaluation practices. Elsevier Science. Available online at: https://books.google.de/books?id=ZqNcZYNUXWIC.
Stone, H., Sidel, J., Oliver, S., Woolsey, A., and Singleton, R. C. (2004). “Sensory evaluation by quantitative descriptive analysis,” in Descriptive sensory analysis in practice, 23–34.
Striegel, L., Chebib, S., Netzel, M. E., and Rychlik, M. (2018). Improved stable isotope dilution assay for dietary folates using LC-MS/MS and its application to strawberries. Front. Chem. 6, 11. doi:10.3389/fchem.2018.00011
Takeda, H. (1988). Classification of Chlorella strains by cell wall sugar composition. Phytochemistry 27 (12), 3823–3826. doi:10.1016/0031-9422(88)83025-5
Takeda, H. (1991). Sugar composition of the cell wall and the taxonomy of Chlorella (Chlorophyceae) 1. J. Phycol. 27 (2), 224–232. doi:10.1111/j.0022-3646.1991.00224.x
Takeshita, T., Ota, S., Yamazaki, T., Hirata, A., Zachleder, V., and Kawano, S. (2014). Starch and lipid accumulation in eight strains of six Chlorella species under comparatively high light intensity and aeration culture conditions. Bioresour. Technol. 158, 127–134. doi:10.1016/j.biortech.2014.01.135
Utz, F., Kreissl, J., Stark, T. D., Schmid, C., Tanger, C., Kulozik, U., et al. (2021). Sensomics-assisted flavor decoding of dairy model systems and flavor reconstitution experiments. J. Agric. food Chem. 69 (23), 6588–6600. doi:10.1021/acs.jafc.1c02165
Utz, F., Spaccasassi, A., Kreissl, J., Stark, T. D., Tanger, C., Kulozik, U., et al. (2022). Sensomics-assisted aroma decoding of pea protein isolates (Pisum sativum L.). Foods 11 (3), 412. doi:10.3390/foods11030412
Van Durme, J., Goiris, K., De Winne, A., De Cooman, L., and Muylaert, K. (2013). Evaluation of the volatile composition and sensory properties of five species of microalgae. J. Agric. food Chem. 61 (46), 10881–10890. doi:10.1021/jf403112k
Vilatte, A., Spencer-Milnes, X., Jackson, H. O., Purton, S., and Parker, B. (2023). Spray drying is a viable technology for the preservation of recombinant proteins in microalgae. Microorganisms 11 (2), 512. doi:10.3390/microorganisms11020512
Wollmann, N., and Hofmann, T. (2013). Compositional and sensory characterization of red wine polymers. J. Agric. food Chem. 61 (9), 2045–2061. doi:10.1021/jf3052576
Woortman, D. V., Fuchs, T., Striegel, L., Fuchs, M., Weber, N., Brück, T. B., et al. (2020). Microalgae a superior source of folates: quantification of folates in halophile microalgae by stable isotope dilution assay. Front. Bioeng. Biotechnol. 7, 481. doi:10.3389/fbioe.2019.00481
Yang, S., Fan, Y., Cao, Y., Wang, Y., Mou, H., and Sun, H. (2023). Technological readiness of commercial microalgae species for foods. Crit. Rev. Food Sci. Nutr. 64, 7993–8017. doi:10.1080/10408398.2023.2194423
Yun, H.-S., Kim, Y.-S., and Yoon, H.-S. (2020). Characterization of Chlorella sorokiniana and Chlorella vulgaris fatty acid components under a wide range of light intensity and growth temperature for their use as biological resources. Heliyon 6 (7), e04447. doi:10.1016/j.heliyon.2020.e04447
Zamuz, S., Purriños, L., Galvez, F., Zdolec, N., Muchenje, V., Barba, F. J., et al. (2019). Influence of the addition of different origin sources of protein on meat products sensory acceptance. J. Food Process. Preserv. 43 (5), e13940. doi:10.1111/jfpp.13940
Zhou, L., Chen, J., Xu, J., Li, Y., Zhou, C., and Yan, X. (2017). Change of volatile components in six microalgae with different growth phases. J. Sci. Food Agric. 97 (3), 761–769. doi:10.1002/jsfa.7794
Keywords: sensory analysis, nutritional profile, Chlorella powder, microalgae, innovative food
Citation: Melcher F, Peest T, Garay D, Utz F, Paper M, Spaccasassi A, Obermaier L, Schneiderbanger J, Koch M, Garbe D, Nilges T, Becker T, Rychlik M, Dawid C, Brück WM, Stellner NI and Brück TB (2025) Comparative nutrient and sensory analysis of eight different commercial Chlorella powders. Front. Food Sci. Technol. 5:1534438. doi: 10.3389/frfst.2025.1534438
Received: 25 November 2024; Accepted: 12 May 2025;
Published: 18 June 2025; Corrected: 19 June 2025.
Edited by:
Tatiana Koutchma, Agriculture and Agri-Food Canada (AAFC), CanadaReviewed by:
Giustino Tribuzi, Federal University of Santa Catarina, BrazilCristiana Nunes, University of Lisbon, Portugal
Copyright © 2025 Melcher, Peest, Garay, Utz, Paper, Spaccasassi, Obermaier, Schneiderbanger, Koch, Garbe, Nilges, Becker, Rychlik, Dawid, Brück, Stellner and Brück. This is an open-access article distributed under the terms of the Creative Commons Attribution License (CC BY). The use, distribution or reproduction in other forums is permitted, provided the original author(s) and the copyright owner(s) are credited and that the original publication in this journal is cited, in accordance with accepted academic practice. No use, distribution or reproduction is permitted which does not comply with these terms.
*Correspondence: Thomas B. Brück, YnJ1ZWNrQHR1bS5kZQ==; Nikolaus I. Stellner, bmlrb2xhdXMuc3RlbGxuZXJAdHVtLWNyZWF0ZS5lZHUuc2c=
†These authors have contributed equally to this work and share first authorship