 Yogarajah Elakneswaran1*
 Natsumi Noguchi1Kazuki Matumoto1Yuka Morinaga1Takashi Chabayashi2Hiroyoshi Kato2Toyoharu Nawa3
- 1Division of Sustainable Resources Engineering, Faculty of Engineering, Hokkaido University, Sapporo, Japan
- 2Cement Business Division, Development Department, Tokuyama Corporation, Yamaguchi, Japan
- 3Hokkaido University, Sapporo, Japan
The cement industry is an energy-intensive industry, and improving the energy efficiency of cement has become necessary to reduce its carbon footprint and to compete in the global market. Clinker production consumes more than 90% of the total energy used in the cement industry. Therefore, a reduction in the burning temperature of the cement clinker can reduce the energy consumption; however, it alters the mineralogy of the clinker composition. Ferrite-rich Portland cement can be produced by lowering the burning temperature by ~100°C (i.e., at 1,350°C), which can reduce the energy consumption by ~5% in comparison with ordinary Portland cement (OPC) clinker. In this study, the hydration reaction and properties of the ferrite-rich Portland cement were examined by experimental techniques and thermodynamic modeling approach, and the results were compared with that of OPC. The produced ferrite-rich cement has almost twice the amount of ferrite phase and half the amount of belite phase contents present in the OPC. The hydration reaction and the composition of hydrates were studied by the X-ray diffraction (XRD)/Rietveld analysis and thermogravimetry (TG) and differential thermal analysis (DTA). The different proportions of the ferrite and belite phases in ferrite-rich cement change their hydration reaction from that of the OPC, but not the total hydration of cement. The XRD results reveal similar phases in both the cements, and the analysis could not identify the new phases formed in the ferrite-rich cement. An equal degree of hydration and quantified hydrates at the early age results in almost identical initial and final setting times in both the cements. The ferrite-rich cement demonstrates a high early strength and relatively slower strength development; however, it can develop adequate strength at 28 days. The thermodynamic model predicts the hydration of ferrite-rich cement and shows comparatively high amount of Fe-containing phases, mainly Fe-ettringite and Fe-siliceous hydrogarnet. Model predictions of the hydrates compositions agreed with the experimental results, and a relationship between the predicted total porosity and the measured compressive strength was derived.
Introduction
The cement industry is a high-energy consuming sector, and the production of ordinary Portland cement (OPC) is responsible for ~5% of the total anthropogenic greenhouse gas emission by limestone calcination (Imbabi et al., 2012; Amato, 2013). Reduction of CO2 emission associated with the cement manufacturing process without affecting the cement demand is a very challenging task for the cement and concrete industry. Investigations on novel cement systems and low-carbon concretes are thus important to reduce the environmental impact of cement. A number of novel cement systems and low-carbon concretes are currently being developed as alternatives for the OPC (Gartner, 2004; Gartner and Macphee, 2011). Replacement of clinker or OPC by supplementary cementitious materials can help to mitigate the carbon footprint of the OPC (Lothenbach et al., 2011), and various alternative clinkers have been proposed to reduce the limestone amount in the raw mix of cement production (Morin et al., 2017).
Over the years, cement industry has been reducing the CO2 emission associated with the heating process by improving the energy efficiency, increasing the use of alternative fuels, and deploying renewable energy sources (Morin et al., 2011; Folliet et al., 2017). However, it needs further energy conservation technologies to reduce its carbon footprint. The conventional OPC clinker is burnt at a very high temperature of about 1,450°C, and the heating process is the most energy-consuming part in cement manufacture. Therefore, decreasing the clinker burning temperature reduces both the energy consumption and CO2 emission. Various technologies have been developed to reduce the energy consumption during the burning process, such as changing the mineral composition of the clinker or using alternative clinkers for OPC and using mineralizers to reduce the burning temperature (Yamashita and Tanaka, 2011). However, studies on the systematic adjustment of the mineral composition of clinker to reduce the burning temperature are limited.
Authors' previous study has reported that compared to the other components of the clinker, the ferrite phase contributes the most to the sintering of the clinker, and the contributions of the various components to clinker burnability is in the order, C4AF>C3A>C2S>C3S (Chabayashi et al., 2012, 2015). A low-burning-temperature clinker, which sinters at 1,350°C, which is ~100°C lesser than temperature required for the OPC clinker, was produced by increasing the C4AF and decreasing the C2S proportions while targeting a strength equal to that of the conventional OPC. It was successfully burnt in an actual kiln as well (Chabayashi et al., 2015). The cement manufactured using this low-burning-temperature clinker is called ferrite-rich Portland cement (FC), and it can reduce ~5% of total CO2 emission compared to the OPC during the clinkering process (Chabayashi et al., 2015). Furthermore, the amount of limestone required for cement production, calculated from mineral composition of clinker, proved that compared to the OPC, the FC would reduce ~1.29% of CO2 emission during the heating of limestone. Therefore, the overall CO2 emission in cement manufacturing process can be decreased by 2.77% by replacing OPC with FC (Shinmi et al., 2017). The characteristics of FC are investigated in this study.
To the best of authors' knowledge, only a few studies have been reported on the production, hydration, property development, and performance of FC. It has been reported that use of FC delays the strength development compared to those with less ferrite and more aluminates (Gartner and Myers, 1993). Furthermore, chemical admixtures are necessary to enhance the hydration reaction of the ferrite phase (Gartner and Myers, 1993; Schwarz, 1995); this in turn contributes to later-age strength development. Poor crystalline Fe-containing phases could form during the hydration of the ferrite phase (Dilnesa et al., 2011, 2014), influencing the properties of the cement matrix. Difficulties in understanding the hydration reaction of the ferrite phase and the identification of Fe-containing phases in the hydration products limit the development and application of FC. Therefore, the objectives of this study are to understand and evaluate the hydration reaction and mechanical performance of FC and to compare the results with that of the conventional OPC. The X-ray diffraction (XRD)/Rietveld analysis and thermogravimetry (TG) and differential thermal analysis (DTA) were used to identify and quantify the clinker minerals and their hydration products as well as to estimate the amount of amorphous in the hydration products. The thermodynamic hydration model developed in authors' previous study (Elakneswaran et al., 2016) was applied to the FC to predict the hydration reaction and to estimate the hydration products. The modeling results were verified with the experimental results. Finally, a relationship between the measured compressive strength of the cement paste and predicted total porosity was derived.
Materials and Methods
Clinker and Cement Production
The limestone, silica stone, coal ash, and iron source were used for the clinker production of both cements. The mixture of raw materials for OPC was first heated to 1,000°C using electric furnace in 30 min and burnt at that temperature for another 30 min. Further, the temperature was increased to 1,470°C in 47 min and kept constant for 90 min to limit the amount of free lime to <1%. The calcination of FC up to 1,000°C follows the same procedure as that used for OPC; thereafter, the temperature is raised to 1,370°C in 37 min and sustained for 90 min.1 The clinkers were rapidly cooled to room temperature in the air. Finally, gypsum (gypsum: bassanite = 1:1) was added to the produced clinkers in an amount equal to 2% of SO3, and the mixture was then ground using a ball mill to the target Blaine value of 3,200 ± 50 cm2g−1 to produce the cements. The Blaine specific surface area and the density based on JIS R 5201, the oxide composition by X-ray fluorescence (XRF), and the mineral composition by Bogue analysis were determined for the produced cements; the results are listed in Table 1.
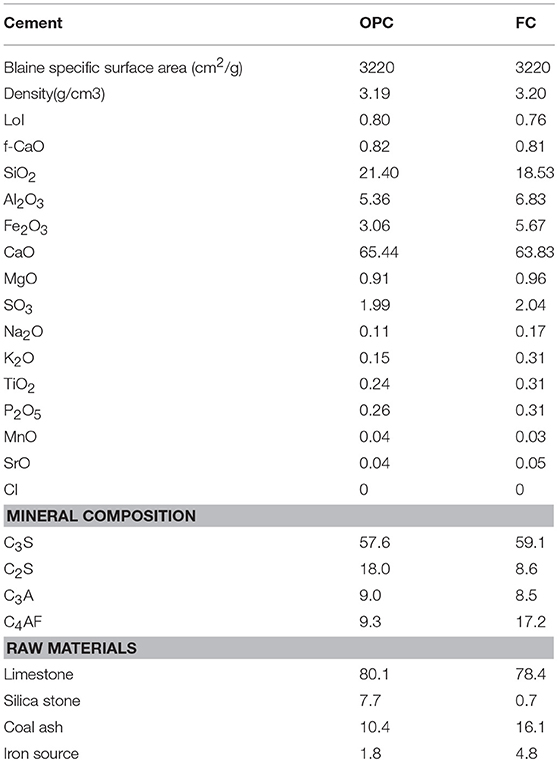
Table 1. Physical properties and chemical composition of cements used (Oxide in wt.%).
Sample Preparation
The cement was mixed with distilled water at a water to cement ratio of 0.5. The mixture was stirred manually until bleeding stopped. Further, it was cast into cylindrical molds and sealed-cured at 20°C. The samples that reached the predetermined curing time (1, 6, and 12h and 1, 2, 3, 7, 14, and 28 days) were ground and immersed in acetone for 1h to stop the hydration. Thereafter, the samples were removed from the acetone solution by suction filtration using an aspirator. Finally, the samples were kept in an oven at 40°C until they reached a constant mass. The prepared samples were ground and powdered for XRD and TG measurements. The 2 × 2 × 8 cm paste specimens were prepared for compressive strength measurement using a mixer given in JIS R 5201.
Experimental Methods
The fine powders of the samples were blended with 10 wt.% of corundum (α-Al2O3) and analyzed by XRD. The XRD was performed using a Rigaku MultiFlex X-ray generator with CuKα radiation. The measurement was performed under the following conditions: tube voltage of 40 kV, tube current of 40 mA, scan speed of 1°2θ min−1, scan range of 2θ = 5–70°, and step width of 0.02°. Siroquant Version 4.0, manufactured by Sietronics, was used for quantitative Rietveld analysis. In the Rietveld analysis, monotrinic and triclinic C3S, α- and β-C2S, cubic C3A, C4AF, Gypsum, Bassanite, Portlandite, Ettringite, Monosulfoaluminate (simply called monosulfate), and Corundum (α-Al2O3) were assigned as targets. The quantitative value of C3S was taken as the sum of the measured values of polymorphic minerals with different crystal structures. The amount of amorphous phase content was calculated according to Equation (1) from the quantitative value obtained by adding 10% mass of corundum (α-Al2O3).
where P is the amount of amorphous phase content (% mass); A is the mixing rate of corundum (% mass); and R is the quantitative value of corundum (% mass). The amount of amorphous phase content in the sample was calculated from the quantitative value obtained by the Rietveld analysis using corundum as an internal standard substance, according to Equation (1). This result was used to correct the determined values of cement minerals. The loss on ignition was obtained as a mass loss between 105 and 950°C, using the mass measured after the ignition loss. To determine the hydration degree against the unhydrates, the value obtained by the Rietveld analysis was corrected with the ignition loss value using Equation (2).
where: Q is the corrected quantitative value (%); Q0 is the quantitative value before the correction (%); and LOI is the loss on ignition (%).
TG/DTA measurements were performed in nitrogen using a HITACHI TG/DTA 7220 analyser at a heating rate of 5°C/min up to 1,000°C. Cement setting time experiment was conducted according to JIS R 5201 and the compressive strength of the paste specimens was measured on 3, 7, 14, and 28 days of curing.
Modeling Approach
The coupled thermodynamic model developed in our previous work (Elakneswaran et al., 2016) was used to model the hydrate assemblage of OPC and FC as a function of hydration time. The thermodynamic model combines the IPhreeqc module (Charlton and Parkhurst, 2011) and Excel for computations. The thermodynamic properties of various phases including Fe-containing hydrates and minerals in the cement system were collected from Cemdata18 (Lothenbach et al., 2008a, 2019) and others (Myers et al., 2014), and the data were converted into a format suitable for PHREEQC. The converted data by Elakneswaran et al. (2016) along with the PHREEQC default thermodynamic database (Parkhust and Appelo, 1999) were used for the calculations.
Results and Discussion
The XRD patterns of un-hydrated cements and their pastes hydrated for 1h and 28 days are shown in Figure 1. In addition to the cement clinker minerals, peaks of portlandite, ettringite, and monosulfate were identified in both the cements, and calcium silicate hydrates (C-S-H) exists in amorphous phase. The quantitative amounts of the phases were determined by Rietveld analysis and TG/DTA, and the results are discussed later. No qualitative difference is observed in the product formation in the decreasing of the C2S proportion and increasing of the C4AF proportion in FC. Ettringite production is noted from 1h in the hydration products, and it transformed to monosulfate after 3 days of hydration in both the cements. Further, the results suggest that the Fe-hydrates may exist in their amorphous states as they cannot be identified by XRD. Figure 2 illustrates the hydration degree of each clinker mineral in OPC and FC, while the total degree of hydration as a function of time is plotted in Figure 3. As given in Table 1, both the cements have almost the same proportions of C3S and C3A; therefore, variation in their hydration degree with time is the same. However, the change in the proportions of C2S and C4AF affects their hydration; ~20% difference was observed between the C4AF hydrations of OPC and FC at 28 days. Nevertheless, the differences did not influence on the total degree of cement hydration (Figure 3).
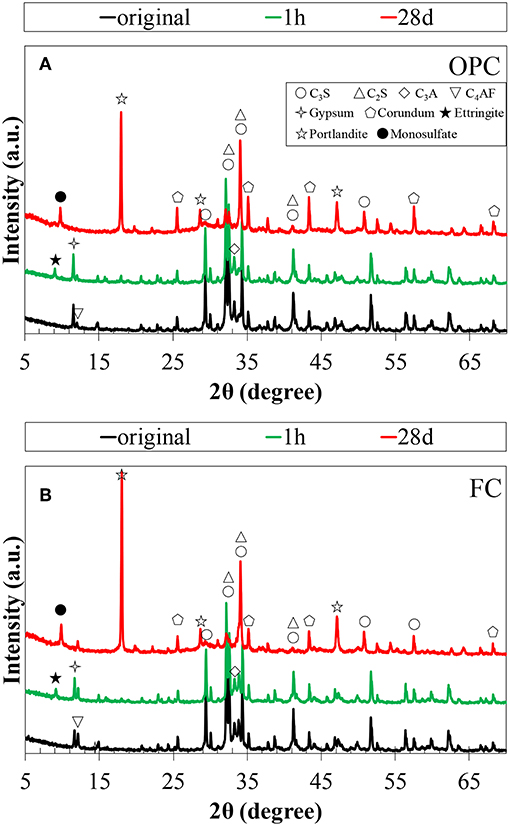
Figure 1. XRD patterns of cements. (A) OPC and (B) FC.
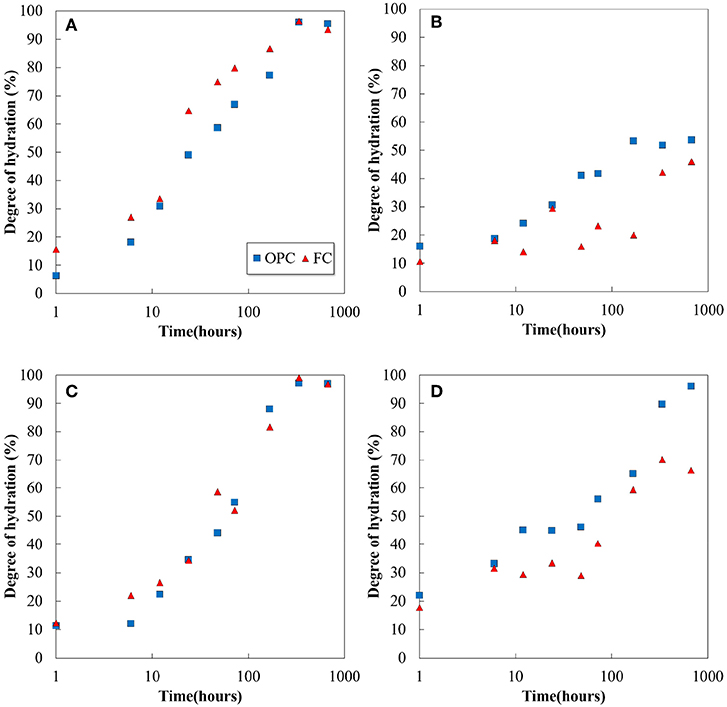
Figure 2. Hydration of (A) C3S, (B) C2S, (C) C3A, and (D) C4AF in the cements as a function of time from the XRD/Rietveld analysis.
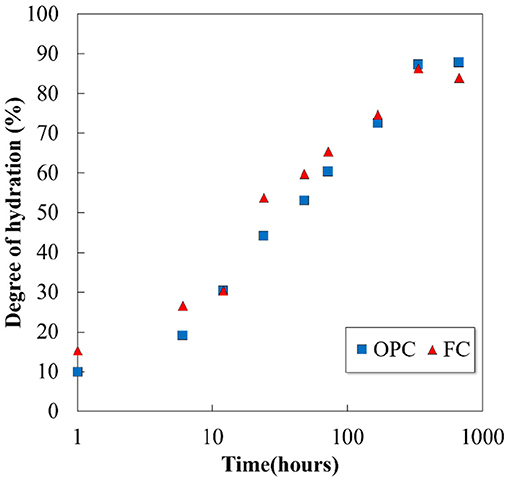
Figure 3. Hydration degree of cements as a function of hydration time determined by XRD.
The XRD/Rietveld analysis reveals that the portlandite, ettringite, monosulfate, and amorphous phase contents are the main hydration products of both OPC and FC, and the variation in their quantities with respect to the hydration time are plotted in Figure 4. The phenomenon of hydration in FC is similar to that observed in the conventional Portland cement system: portlandite and amorphous phase contents are formed from the beginning of the hydration process and increase with hydration time, and the decrease in the amount of ettringite correlates with the formation of monosulfate. It can be observed that the increase in ferrite and the decrease in belite in FC do not significantly influence the quantitative value of hydration products at an early age. However, at a later age, a difference is observed particularly in amorphous phase contents. The hydration degree of belite and ferrite in FC further affects the difference (Figure 2). Although it is difficult to distinguish the amorphous phase contents using XRD/Rietveld analysis, it is believed that the hydration products which containing Fe are quantified as amorphous.
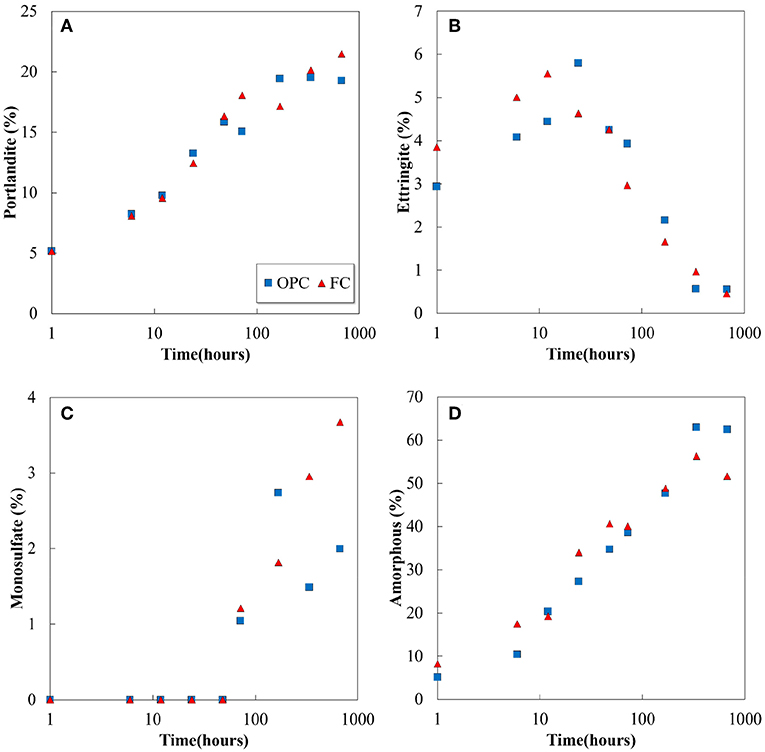
Figure 4. Experimentally determined (A) portlandite, (B) ettringite, (C) monosulfate, and (D) amorphous contents variations as a function of hydration time for OPC and FC.
Figure 5 illustrates the setting time results of OPC and FC. With an identical value of Blaine specific surface area, both the cements demonstrate similar initial and final setting times. As shown in Figures 3, 4, the hydration reaction and the amounts of solid products formed in FC are equivalent to that of OPC, which attribute to the similar setting time in both the cements. The measured compressive strength of the hydrated cements, mean of 4 samples, is shown in Figure 6 (standard deviation is shown by bars). It demonstrates that the strength continues to develop with the hydration time in both the cements, and the ferrite-rich cement displays a higher compressive strength at early age and becomes equal to OPC at 14 days. Early age compressive strength of OPC paste is slightly lower than the values reported in the hydrated paste, however it shows the similar strength at 28 days (Hoshino et al., 2006). Although the 28 days compressive strength of FC is lower than that of OPC, but it is sufficiently developed.
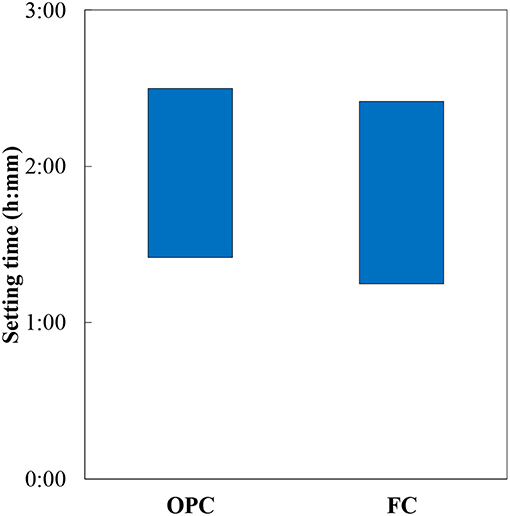
Figure 5. Initial and final setting times of hydrated cements.
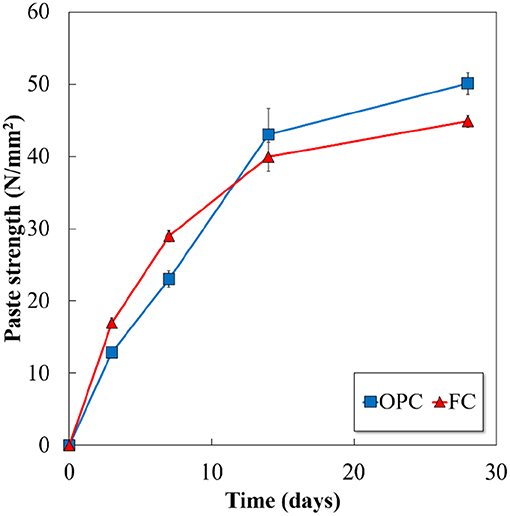
Figure 6. Compressive strength of hydrated cements.
A coupled thermodynamic model, proposed in a previous study for OPC and slag-blended cementitious materials (Elakneswaran et al., 2016), is employed without any modifications in this study to understand the hydration reaction of the ferrite-rich cement system. The coupled model solves the kinetic equation of the clinker minerals in Excel, and the dissolved quantities are input to PHREEQC for the thermodynamic equilibrium and solid solution calculations. An ideal solid-solution model consisting of six end-members was considered for C-S-H. Prior to predicting the hydration products, the kinetic model is used to predict the hydration degree of the clinker minerals and the total degree of hydration in both the cements. The comparison of results estimated from the model and that obtained from XRD/Rietveld analysis are shown in Figure 7. Despite certain discrepancies between the calculation results and the experimental data on individual clinker hydration, the kinetic equations and constants (Elakneswaran et al., 2016) can predict the hydration reaction of ferrite-rich cement and its clinker minerals.
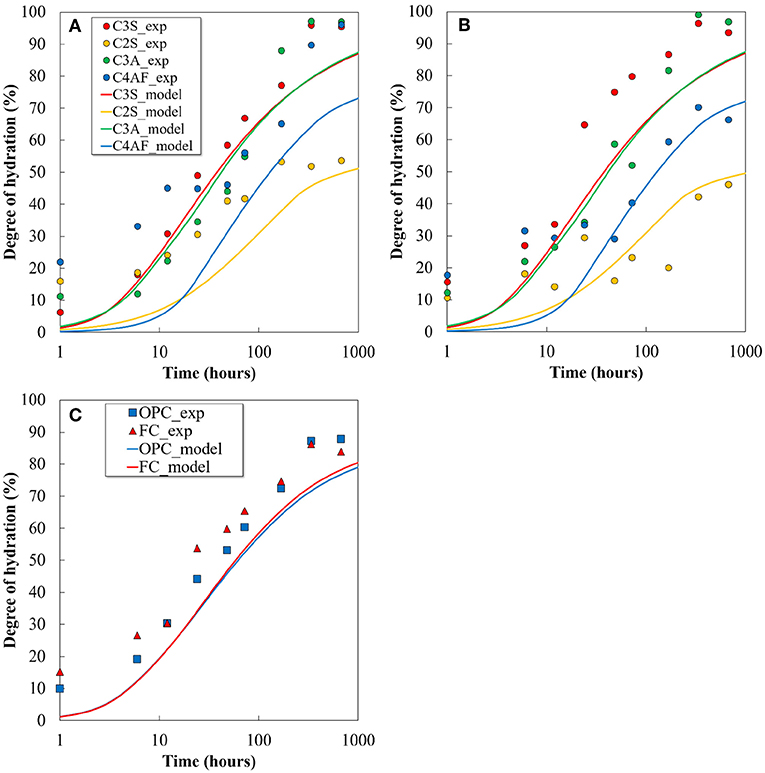
Figure 7. Comparison of calculated hydration degree of each clinker mineral and cements with the quantitative value determined by XRD: (A) OPC, (B) FC, and (C) comparison of total hydration degree.
The hydration degree or amount of dissolved clinker phases was used in the thermodynamic calculations with the thermodynamic database for cement minerals and phases. It has been reported that the Fe-siliceous hydrogarnet is expected to form in the hydrated cement system, and it is more stable than Al-siliceous hydrogarnet (Lothenbach et al., 2019). Fe-ettringite, Fe-monosulfate, and Fe-siliceous hydrogarnet were considered in addition to other hydrates commonly found in the hydrated cement system for the calculations of both the cements. For the input of the clinker composition of cement determined by XRD/Rietveld analysis and the mixing conditions, the predicted phase-assemblage composition of the hydrated OPC and FC in mass percentage, relative to the total amount of solid products, is shown in Figure 8. Both the cement systems form the same kind of phases with the hydration time, but the initial clinker proportion influences their quantitative values. The presence of Fe-containing phases from the model prediction is consistent with the experimental observation (Dilnesa et al., 2011). Fe-ettringite formed at early age, destabilized and transformed to form Al-ettringite; Fe-monosulfate was not produced. The stable Fe-siliceous hydrogarnet starts to form from early age and continues with the hydration time. The dissolved Fe from the ferrite phase transforms into Fe-ettringite and Fe-siliceous hydrogarnet. The high quantity of ferrite phase in the FC enhances the formation of the Fe-containing phases.
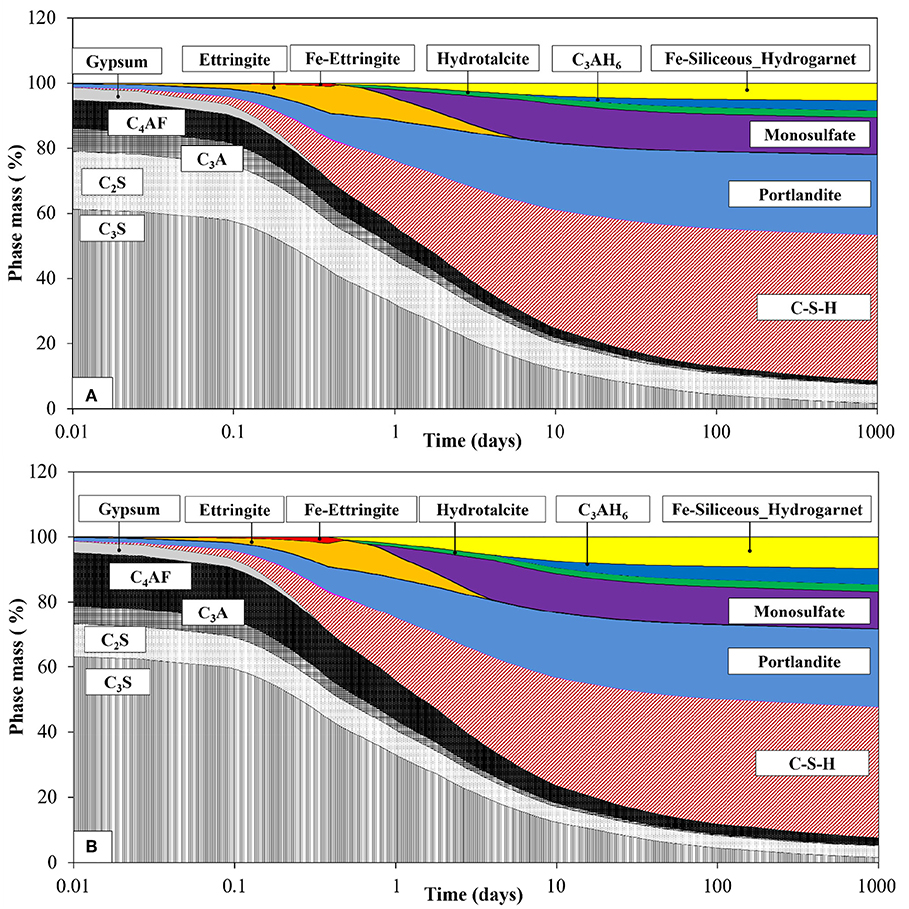
Figure 8. Calculated mass of hydrates as a function of hydration time for (A) OPC and (B) FC.
The predicted mass percentage of portlandite, ettringite, and amorphous phase content are compared with the experimental data in Figure 9. As reported, the poor crystalline phases of AFm and Fe-containing phases are difficult to quantify by XRD/Rietveld analysis, since they might exist in the amorphous phase as well (Matschei et al., 2007; Lothenbach et al., 2008b). Therefore, the summation of the total amorphous phase content and monosulfate was compared with the addition of the predicted C-S-H, monosulfate, and Fe-siliceous hydrogarnet. Apart from certain variations, the calculated phase assemblage generally agrees well with the experimentally determined values, both qualitatively and quantitatively. A high proportion of the Fe-containing phases formed from the hydration of ferrite phase in the FC contributes significantly to the increase in the calculated amorphous phase content. The composition of the phase assemblage in terms of volume fraction is shown in Figure 10. The volume of each hydrate was calculated from its molar volume, and the total porosity is estimated based on the volumes of hydrates and un-hydrated cement at any time and the initial volume of the paste, assuming that chemical shrinkage does not occur. The calculated total porosity is found to be closely associated with the measured compressive strength, as shown in Figure 11, and the relationship is found to be more prominent in FC. As shown in Figure 10, the porosity does not change significantly with the increase in ferrite and decrease in belite phase proportions in FC, though certain differences are observed between the quantitative values of the hydration products of the two cements.
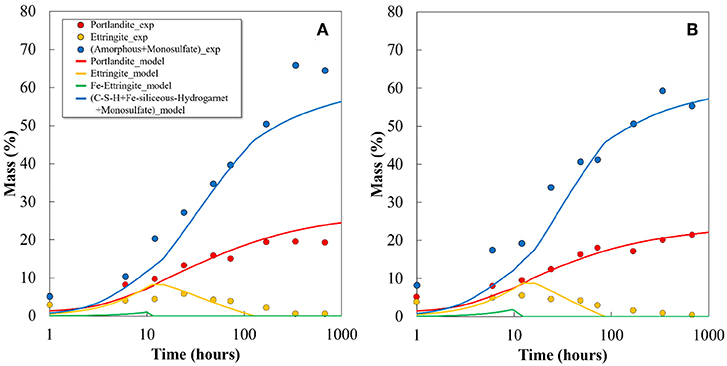
Figure 9. Comparison of calculated hydrates with quantitative value determined by XRD Rietveld analysis and TG/DTA for (A) OPC and (B) FC.
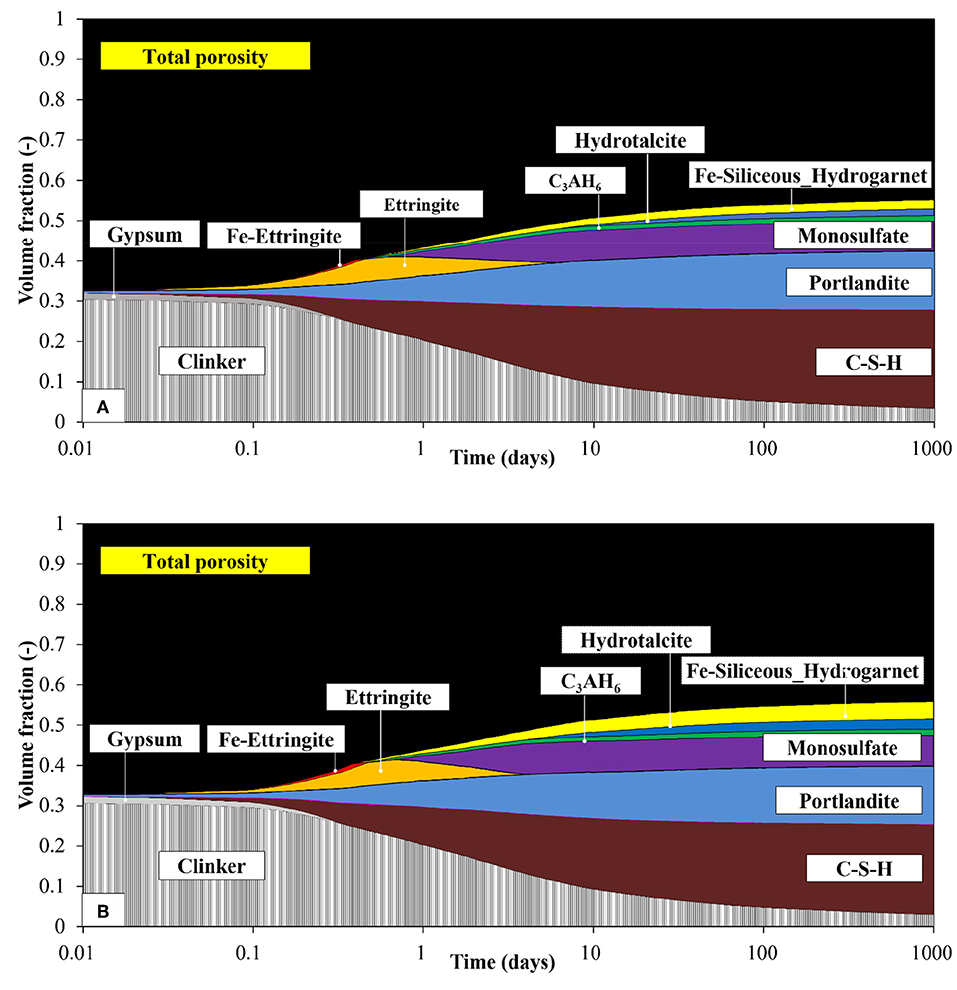
Figure 10. Calculated volume of hydrates as a function of hydration time for (A) OPC and (B) FC.
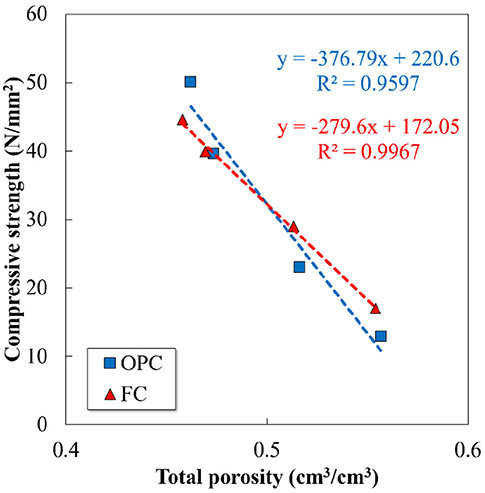
Figure 11. Relationship between calculated total porosity and measured compressive strength.
Conclusions
Burning of clinker at ~1,350°C, which is 100°C lower than the burning temperature of OPC, produces a high-ferrite and low-belite content cement. The manufacturing process of this cement may release 5% lesser CO2 than that of OPC, thus demonstrating a potential to substitute the OPC. The hydration behavior of the FC is similar to that of OPC, but the different proportions of the clinkers influence their hydration degree; low hydration degree of C2S and C4AF are found in FC, in contrast to the OPC. The hydration products were identified and quantified by the XRD/Rietveld analysis and TG/DTA, except the C-S-H and Fe-containing phases that were accounted as amorphous phase contents. The degree of hydration and hydration products of ferrite-rich cement are comparatively similar to that of the OPC; therefore, both the cements exhibit the same initial and final setting times. The ferrite-rich cement develops higher initial compressive strength than the OPC, and displays slow strength development at later age, but achieves the required final strength. Thermodynamic modeling results reveal the hydration reaction of FC. Fe-siliceous hydrogarnet is the main Fe-containing phase formed during the hydration of both FC and OPC, and Fe-ettringite is produced at a very early age and then converted to Al-ettringite. The predicted quantities of the Fe-containing phases strongly depend on the proportion of ferrite in the cement. The estimated compositions of portlandite, ettringite, and amorphous phase contents agree satisfactorily with the XRD/Rietveld analysis and TG/DTA results. Furthermore, the predicted total porosity correlates well with the measured compressive strength.
The present study focuses on the hydration reaction of FC and compares it with that of the OPC. The next step would be identifying and quantifying the Fe-containing phases formed in the cement and verifying it with a thermodynamic model, which requires additional thermodynamic data for the other Fe-containing phases. In addition, Mancini (Mancini et al., 2018) has recently pointed out that Fe can incorporate into C-S-H as well, which should be included in the C-S-H model by either surface complexation or phase equilibrium.
Author Contributions
YE, TC, HK, NN, YM, and TN designed the experimental plan. NN, KM, YM, TC conducted the experiments and data analysis. YE and NN carried out the modeling work. YE, NN, YM, and TC drafted the manuscript. TC, HK, and TN contributed to the discussions.
Conflict of Interest Statement
The authors declare that the research was conducted in the absence of any commercial or financial relationships that could be construed as a potential conflict of interest.
References
Chabayashi, T., Nagata, H., Nakamura, A., and Kato, H. (2012). Reduction of burning temperature of cement clinker by adjusting of mineral composition. Cement Sci. Concrete Technol. 66, 217–222. doi: 10.14250/cement.66.217
Chabayashi, T., Nagata, H., Shinmi, T., and Kato, H. (2015). Burning test result of the low burning-temperature type clinker by actual kiln and properties of the cement. Cement Sci. Concrete Technol. 69, 124–130. doi: 10.14250/cement.69.124
Charlton, S. R., and Parkhurst, D. L. (2011). Modules based on the geochemical model PHREEQC for use in scripting and programming languages. Comput. Geosci. 37, 1653–1663. doi: 10.1016/j.cageo.2011.02.005
Dilnesa, B. Z., Lothenbach, B., Le Saout, G., Renaudin, G., Mesbah, A., Filinchuk, Y., et al. (2011). Iron in carbonate containing AFm phases. Cement Concrete Res. 41, 311–323. doi: 10.1016/j.cemconres.2010.11.017
Dilnesa, B. Z., Wieland, E., Lothenbach, B., Dähn, R., and Scrivenerc, K. L. (2014). Fe-containing phases in hydrated cements. Cement Concrete Res. 58, 45–55. doi: 10.1016/j.cemconres.2013.12.012
Elakneswaran, Y., Owaki, E., Miyahara, S., Ogino, M., Maruya, T., and Nawaa, T. (2016). Hydration study of slag-blended cement based on thermodynamic considerations. Construct. Build. Mater. 124, 615–625. doi: 10.1016/j.conbuildmat.2016.07.138
Folliet, M., Saiz, M. R., and Shah, J. (2017). Improving Thermal and Electric Energy Efficiency at Cement Plants: International Best Practice. International Finance Corporation Report.
Gartner, E. (2004). Industrially interesting approaches to “low-CO2” cements. Cement Concrete Res. 34, 1489–1498. doi: 10.1016/j.cemconres.2004.01.021
Gartner, E., and Macphee, D. E. (2011). A physico-chemical basis for novel cementitious binders. Cement Concrete Res. 41, 736–749. doi: 10.1016/j.cemconres.2011.03.006
Gartner, E., and Myers, D. (1993). Influence of tertiary alkanolamines on portland cement hydration. J. Am. Ceram. Soc. 76, 1521–1530. doi: 10.1111/j.1151-2916.1993.tb03934.x
Hoshino, S., Yamada, K., and Hiro, H. (2006). XRD/Rietveld analysis of the hydration and strength development of slag and limestone blended cement. J. Adv. Concrete Technol. 4, 357–367. doi: 10.3151/jact.4.357
Imbabi, M. S., Carrigan, C., and McKenna, S. (2012). Trends and development in green cement and concrete technology. Int. J. Sustain. Built Environ. 1, 194–216. doi: 10.1016/j.ijsbe.2013.05.001
Lothenbach, B., Kulik, D. A., Matschei, T., Balonis, M., Baquerizo, L., Dilnesa, B., et al. (2019). Cemdata18: a chemical thermodynamic database for hydrated Portland cements and alkali-activated materials. Cement Concrete Res. 115, 472–506. doi: 10.1016/j.cemconres.2018.04.018
Lothenbach, B., Le Saout, G., Gallucci, E., and Scrivener, K. (2008b). Influence of limestone on the hydration of Portland cements. Cement Concrete Res. 38, 848–860. doi: 10.1016/j.cemconres.2008.01.002
Lothenbach, B., Matschei, T., Möschner, G., and Glasserb, F. P. (2008a). Thermodynamic modelling of the effect of temperature on the hydration and porosity of portland cement. Cement Concrete Res. 38, 1–18. doi: 10.1016/j.cemconres.2007.08.017
Lothenbach, B., Scrivener, K., and Hooton, R. D. (2011). Supplementary cementitious materials. Cement Concrete Res. 41, 1244–1256. doi: 10.1016/j.cemconres.2010.12.001
Mancini, A., Wieland, E., and Lothenbach, B. (2018). Interaction of Fe(II, III) With Cement Phases in Anoxic Conditions. Avignon: NUWCEM.
Matschei, T., Lothenbach, B., and Glasser, F. P. (2007). The AFm phase in Portland cement. Cement Concrete Res. 37, 118–130. doi: 10.1016/j.cemconres.2006.10.010
Morin, V., Termkhajornkit, P., Huet, B., and Pham, G. (2017). Impact of quantity of anhydrite, water to binder ratio, fineness on kinetics and phase assemblage of belite-ye'elimite-ferrite cement. Cement Concrete Res. 99, 8–17. doi: 10.1016/j.cemconres.2017.04.014
Morin, V., Walenta, G, Gartner, E, Termkhajomkit, P, Baco, I, and Casabonne, J. M (2011). “Hydration of belite calcium sulfo-aluminate cement aetherTM,” in International Congress on the Chemistry of Cement, Madrid.
Myers, R. J., Bernal, S. A., and Provis, J. L. (2014). A Thermodynamic model for C-(N-)A-S-H Gel: CNASH_ss. Derivation and validation. Cement Concrete Res. 66, 27–47. doi: 10.1016/j.cemconres.2014.07.005
Parkhust, D. L., and Appelo, C. A. J. (1999). A Computer Program for Speciation, Batch-Reaction, One-Dimensional Transport and Inverse Geochemical Calculations. USGS report.
Schwarz, W. (1995). Novel cement matrices by accelerated hydration of the ferrite phase in Portland cement via chemical activation: kinetics and cementitious properties. Advn Cem Bas Mat. 2, 189–200. doi: 10.1016/1065-7355(95)90003-9
Shinmi, T., Chabayashi, T., Kato, H., and Kawai, K. (2017). Long-term strength development, durability and environmental impact assessment of concrete using the low burning-temperature type general-purpose cement. Concrete Eng. 39, 1999–2004.
Keywords: Fe-containing phases, hydration, thermodynamic modeling, X-ray diffraction, compressive strength, setting time
Citation: Elakneswaran Y, Noguchi N, Matumoto K, Morinaga Y, Chabayashi T, Kato H and Nawa T (2019) Characteristics of Ferrite-Rich Portland Cement: Comparison With Ordinary Portland Cement. Front. Mater. 6:97. doi: 10.3389/fmats.2019.00097
Received: 11 January 2019; Accepted: 15 April 2019;
Published: 01 May 2019.
Edited by:
Miroslav Komljenovic, University of Belgrade, SerbiaReviewed by:
Frantisek Soukal, Brno University of Technology, CzechiaTongbo Sui, Sinoma International Engineering Co., Ltd., China
Copyright © 2019 Elakneswaran, Noguchi, Matumoto, Morinaga, Chabayashi, Kato and Nawa. This is an open-access article distributed under the terms of the Creative Commons Attribution License (CC BY). The use, distribution or reproduction in other forums is permitted, provided the original author(s) and the copyright owner(s) are credited and that the original publication in this journal is cited, in accordance with accepted academic practice. No use, distribution or reproduction is permitted which does not comply with these terms.
*Correspondence: Yogarajah Elakneswaran, ZWxha25lc3dhcmFuQGVuZy5ob2t1ZGFpLmFjLmpw