 Juan A. Morales
 Javier Sánchez
- “Eduardo Torroja” Institute for Construction Science, Madrid, Spain
It is commonly mentioned that corrosion of steel in presstressed concrete can induce brittle failure. It is also understood that in order to estimate the presstressed structures service life is necessary to study the pitting factor that compares the maximum corrosion pit depth with the section loss by homogeneous corrosion. Results are presented on corrosion tests to measure the corrosion depth in tendons in contact with water. In present paper, a statistical analysis has been carried out in order to obtain the pitting factor for different cross sections submerged in water. The results indicate that the pitting factor value varies between 1.20 and 1.85 depending on the confidence interval considered, which can significantly reduce the service life of the presstressed tendons as long as the exposure conditions are those set out in this study.
Introduction
Corrosion is the principal reason of durability reduction of reinforced concrete structures (Andrade et al., 2012). In the case of presstressed structures corrosion can induce stress corrosion cracking (Sanchez et al., 2007, 2008a, 2009a,b, 2011, 2013). The pit to crack transition has been studied by some authors (Turnbull et al., 2006a,b; Horner et al., 2011). To estimate the service life and the safety of the structure it is necessary to study the pit shape and the pit factor that compares the pit depth with the section loss by general corrosion (Sanchez et al., 2017a). Previous paper was focused into the mechanical behavior of corroded rebars (Sanchez et al., 2017a) in order to estimate their service life. A final tolerance diagram was obtained where it is taken into account the effect of corrosion, stress corrosion cracking, and hydrogen embrittlement effects (Sanchez et al., 2008b, 2010; Sánchez et al., 2016a; Sanchez et al., 2016b, 2017b; Castedo et al., 2011, 2012; Elices et al., 2012).
The work presented in this study attempts to quantify statistically the corrosion depth in tendons whose ducts have not been grouted with mortar. Therefore, tendons have been exposed to the weather or partially submerged in water in order to simulate similar conditions of tendons that are within the sheaths in direct contact with rainwater or other sources and which have been accumulated during the time they have not been injected.
With the aim of obtaining the pitting factor (González et al., 1995) an experimental corrosion tests have been carried out to measure the corrosion rate and the corrosion depth of tendons in contact with water.
Experimental Methodology
Materials
The bars used as test materials were of high strength steel, cold drawn, 15.24 mm diameter and 25 cm length. Each tendon is made up of seven steel wires and has a diameter of 5 mm. Twelve tendons have been tested in total.
Before and after testing, the bars were cleaned in hydrochloric acid diluted with water and degreased in acetone.
The water used in the tests has the composition given in Table 1.

Table 1. Water composition.
Experiments
The methodology take into account the following steps: (i) submerged the bars and tendons in water and measure the corrosion rate during 30 days; (ii) measure the corrosion depth at different sections with metallographic microscope.
The following experimental methods have been carried out in order to quantify the corrosion depth in tendons.
Corrosion Rate Over Time in Steel Bars and Tendons Partially Submerged in Water
Tendon and bars deterioration over time due to corrosion has been studied through electrochemical techniques for measuring potential and corrosion rate. For this purpose, Polarization Resistance Method according ASTM G 59-91 standard has been used with an ACM potentiostat (Stern and Geary, 1957; Feliu et al., 1986). It is tested isolated bars or wires and tendons in order to check the effect of the contact between central and surface wires.
In the present work potentiodynamic measurements were taken by polarizating cathodically from the Ecorr up to −10 mV, and then, anodically up to +10 mV (Andrade and González, 1978), to obtain the Rp value (Feliu et al., 1986, 1990; Andrade et al., 2000, 2012). An intermediate value of the constant B is chosen: 26 mV for steel in the active state.
Two test cells have been studied with three bars in each cell. The tests had duration of 30 days (Table 2). 3-electrode test cell is performed according ASTM G 59-91 and it is formed by the following electrodes:
- Reference electrode: Ag/AgCl has been used as reference electrode.
- Working electrode: Tendons were cut and divided in bars. Each test cell is formed by three steel bars object of study acting as working electrode.
- Counter electrode: a graphite bar has been used as auxiliary or counter electrode.
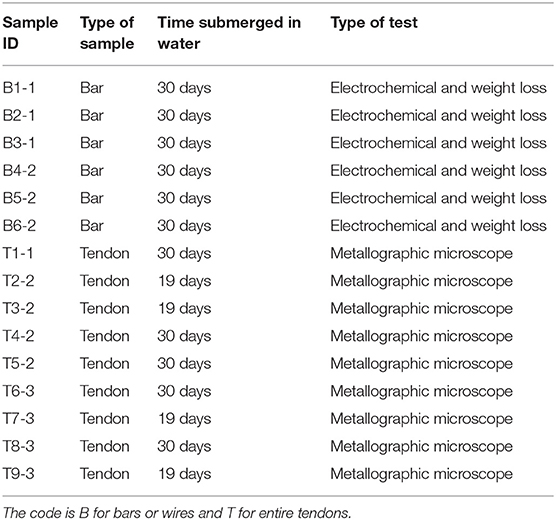
Table 2. Summary of samples and tests performed.
The total weight loss is obtained from the area integration of the Icorr-time curve (Sanchez et al., 2017a). Electrochemical weight losses have been calculated by Faraday's law, as shown in Equation (1) (Munoz et al., 2007; Apostolopoulos et al., 2013; Sanchez et al., 2017a):
where Peq Fe is the equivalent weight of iron with a valence of 2; corresponds to the area under the curve obtained in the electrochemical measurements, and F is the Faraday constant 96,500 C.
On the other hand, gravimetric weight loss has been obtained as the difference between initial and final weight of steel bars at the end of the test. Both cases, steel bars were cleaned in hydrochloric acid diluted with water and methenamine, afterwards it degreased in acetone.
Corrosion Depth in Pre-corroded Tendons
Corrosion depth in tendons has been studied with metallographic microscope at x500 magnification. This technique allows, through further image processing, measuring the pit depth due to corrosion on the surface of the steel.
Before measuring the corrosion depth, tendons have been pre-corroded partially submerging them into a container with water. Four tendons have been pre-corroded for 19 days and five tendons for 30 days (Table 2).
From each pre-corroded tendon three cross sections have been made at 3 different heights: air/water interface area (section A), submerged intermediate area (section B), and bottom tendon area (section C).
Each section is embedded in resin and polished to obtain samples as shown in Figure 1. From each steel bar 4 photos are obtained by metallographic microscopy and 10 measurements of pit depth are obtained from each photo (Figure 2). 4,500 corrosion depth have been measured and statistically studied.
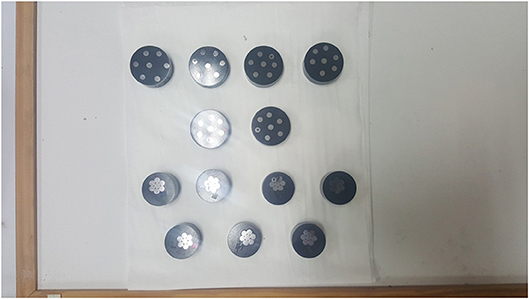
Figure 1. Embedded and polished sample after corrosion tests.
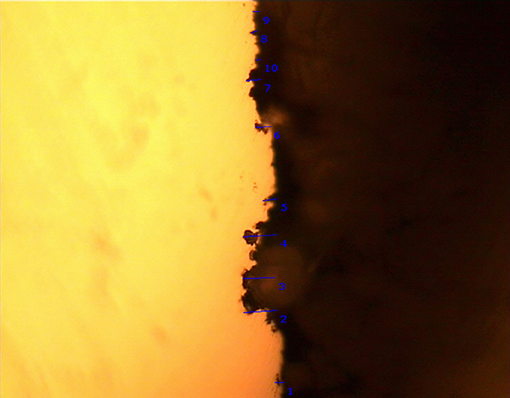
Figure 2. x500 magnification photo and measures of pit depth in pre-corroded bars.
Results
Electrochemical Measurements of Corrosion Rate and Corrosion Potential
Corrosion rate over time measurements in submerged steel bars are shown in Figure 3. And the potential values recorded over time in submerged steel bars are shown in Figure 4. Both parameters are measured in B1-1, B2-1, B3-1, B4-2, B5-2, and B6-2 bars.
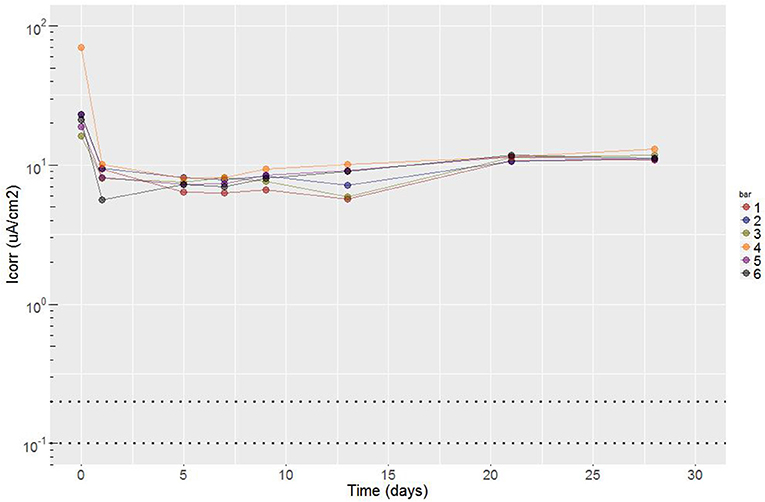
Figure 3. Corrosion rate (Icorr) over time in submerged steel bars.
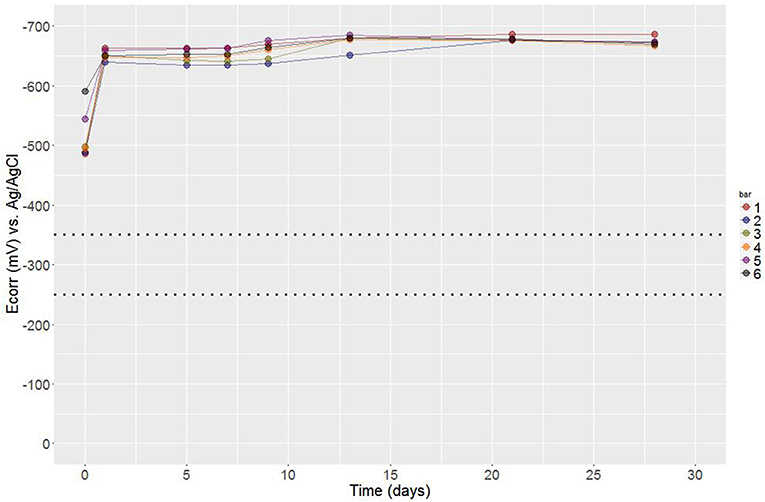
Figure 4. Corrosion potential (Ecorr) over time in submerged steel bars.
Corrosion rate stabilizes during the first 24 h and after that, it remains constant throughout the whole test, being around 10 μA/cm2, a value above the limit considered for the steel depasivation threshold, located at 0.2 μA/cm2 (Andrade et al., 2012).
All values, both in the corrosion rate and in the corrosion potential measurements, are very similar to each other, which allow deducing a representative value with little dispersion.
Gravimetric Measurements
Figure 5 shows the gravimetric and electrochemical weight losses obtained in the 6 steel bars submerged in water under study. According to Equation (2), the weight loss estimated by electrochemical measurements agrees with the gravimetric measurements, which validates the electrochemical measurements and allows using them to deduce the evolution over time of the corrosion rate.
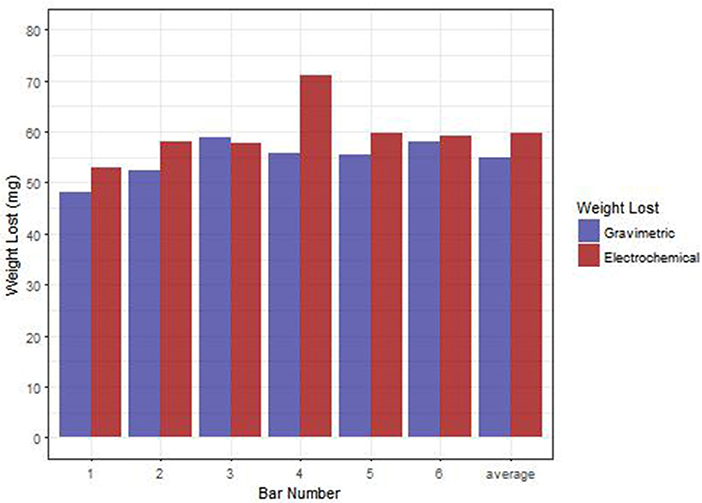
Figure 5. Gravimetric weight losses in steel bars submerged in water.
Corrosion Depth Statistical Analysis
As previously mentioned, a total of 4,500 corrosion depth measurements have been carried out by metallographic microscopy at 500 magnifications. 3 areas have been statistically studied in 9 tendons: (i) air/water interface area (section A), (ii) submerged intermediate area (section B), and (iii) bottom tendon area (section C).
Figures 6–8 show the experimental distribution of corrosion depth for each tendon cross section studied, as well as fitting to a lognormal probability density function by maximum likelihood estimation (MLE) maximizing the log-likelihood to find best values of the distribution parameters (Cullen and Frey, 1999; Vose, 2000; Venables and Ripley, 2002; Delignette-Muller and Dutang, 2015).
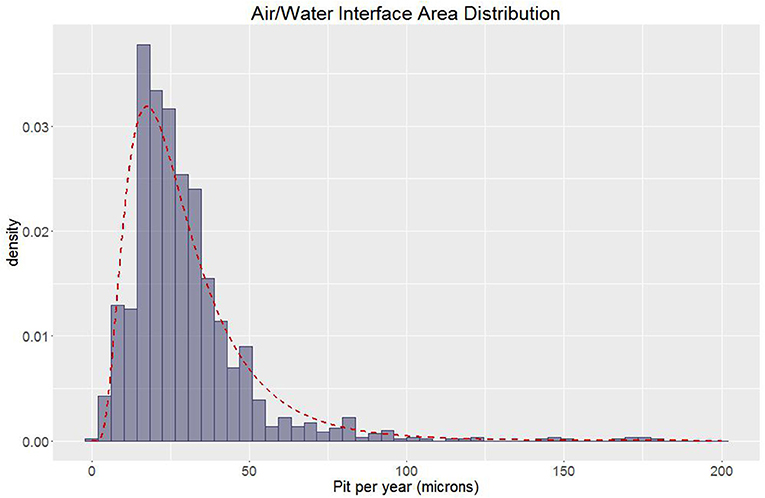
Figure 6. Corrosion depth distribution at air/water interface (section A).
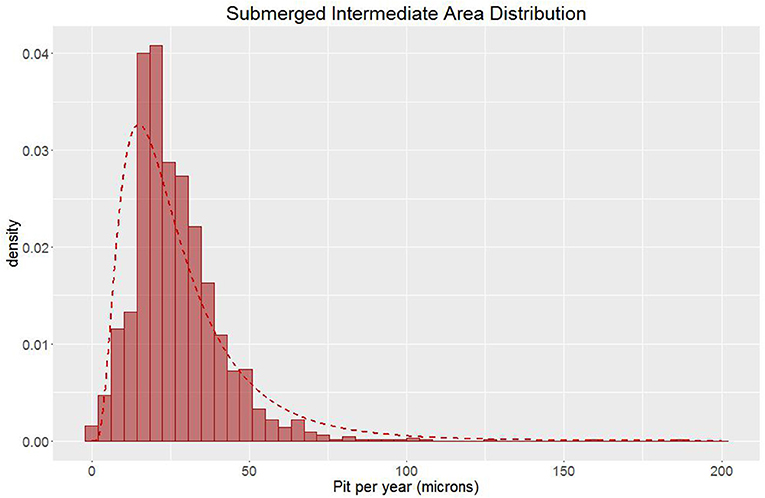
Figure 7. Corrosion depth distribution at submerged intermediate area (section B).
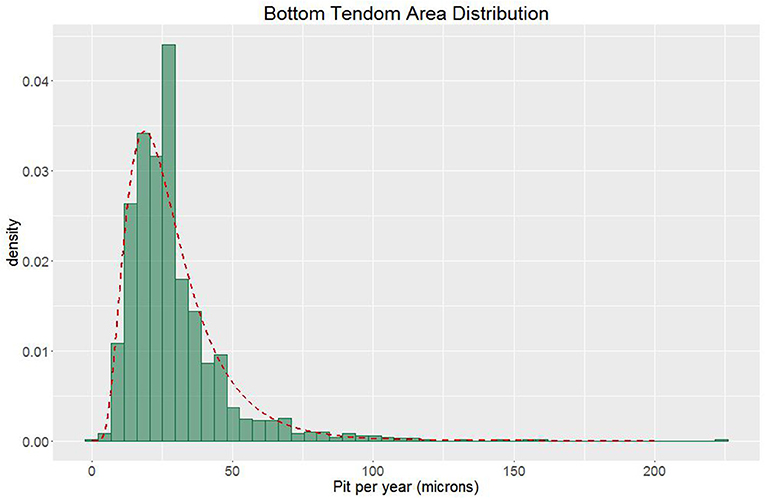
Figure 8. Corrosion depth distribution at bottom tendon area (section C).
A summary of the corrosion depth experimental distribution values by cross section are shown in Table 3 shows the main parameters of the probability density functions for air/water interface area, submerged tendon area, and bottom tendon area, fitted to a lognormal density function. There is no evidence that the corrosion depth depends on the cross section studied in tendons, since their distributions are very similar to each other.
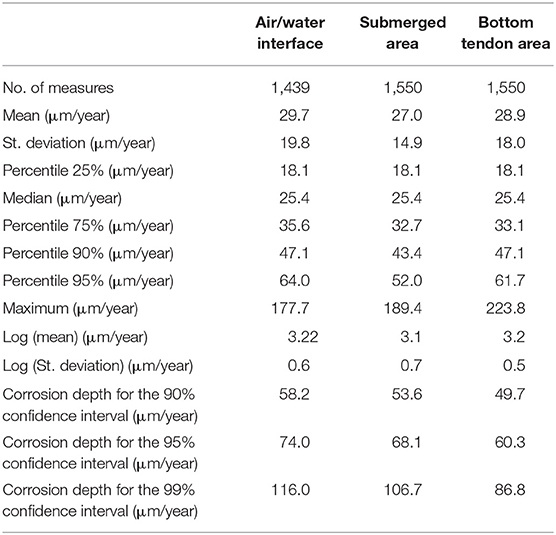
Table 3. Corrosion depth experimental distribution values and main parameters of probability density functions fitted to a lognormal density function.
Discussion
Comparison of Rates of General Corrosion and Maximum Pitting Penetration
With the data obtained from both gravimetric and electrochemical weight loss, and since there is a low dispersion in the results obtained in the different bars studied, it is possible to generalize these values and extrapolate them to other different ages. Therefore, general section loss of the reinforcement bars at later ages can be calculated from electrochemical measurements of corrosion rate (Figure 5). Parameter Pcorr represents the radio loss of the bar cross section and it can be obtained through Equation (2), where 0.0116 is a conversion factor from μA/cm2, is the corrosion rate average measured and t is the trial duration in years (Table 2).
Since the corrosion depth was measured by microscope when the tendons were pre-corroded, in order to calculate the pitting factor, α, that relates the homogeneous corrosion with the maximum pitting penetration (González et al., 1995) according to Equation (3). It is necessary to add the loss of section caused during the time that the tendons were submerged in water at the maximum value of the corrosion depth measured (Figure 9). The loss of section of the tendons during the period of submersion has been estimated as the average value of the corrosion depth according to electrochemical measurements (Table 4).
Table 5 shows the maximum pitting penetration for each stressed tendon cross section studied estimated for 50, 90, and 99% confidence intervals and the α values (pitting factor) associated with each value.
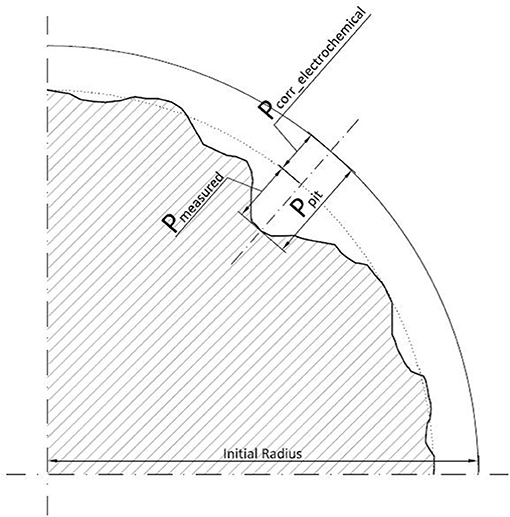
Figure 9. Outline of pitting factor α.
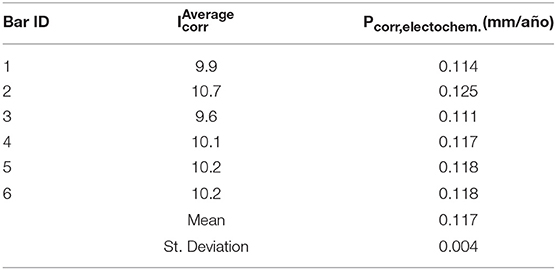
Table 4. Cross section loss by bar.
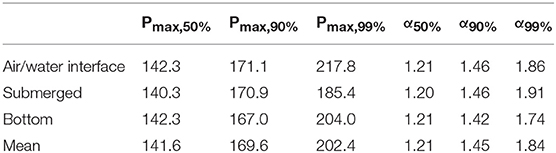
Table 5. Cross section loss by section.
Durability Predictions
Figure 10 shows the ultimate and residual load rate over time considering the average of the corrosion rate during the tests (Figure 3) (Sanchez et al., 2017a). It has been represented 50, 90, and 99% confidence intervals. Since the α values are very similar for each stressed tendon cross section studied, cross section loss has been calculated with the pitting factor averages associated to each confidence intervals.
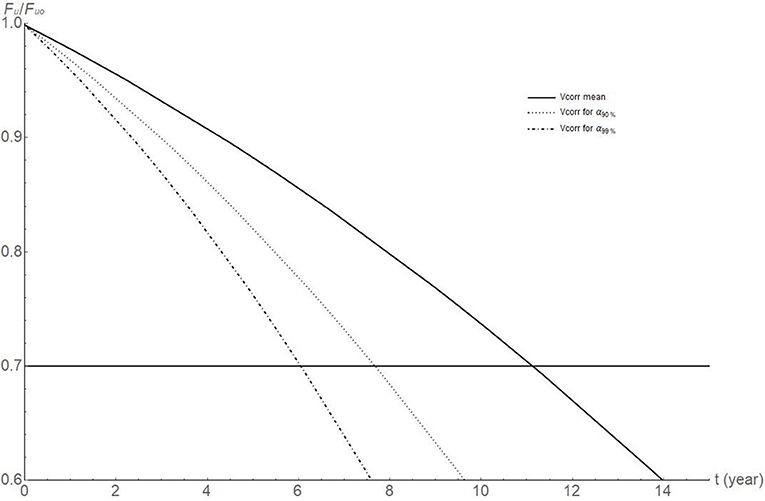
Figure 10. Durability predictions.
According to Figure 10 and considering a service stress of 70% of the bar ultimate load, the service life of the tendons would be around 7, 8, and 11 years for 50, 90, and 99% confidence intervals, respectively as long as the exposure conditions are those set out in this report, i.e., tendons in contact with water.
Conclusions
The main conclusions that may be pointed out are:
1. Tendons studied in contact with water have homogeneous corrosion. A maximum pitting factor value varies between 1.20 for a confidence interval of the 50% percentile and 1.85 for a confidence interval of the 99% percentile.
2. Durability predictions show that the service life of the tendons can be significantly reduced for a service stress of 70% of the bar ultimate load if maximum pitting factor is considered as long as the exposure conditions are those set out in this report.
3. There is no evidence that the corrosion depth depends on the submerged tendon cross section, since both their corrosion depth experimental distributions, and their probability density functions fitted are very similar to each other.
Author Contributions
JM carry out the test. JT and NR carry out metallographic analysis. JS are the advisor of the research group.
Conflict of Interest Statement
The authors declare that the research was conducted in the absence of any commercial or financial relationships that could be construed as a potential conflict of interest.
References
Andrade, C., Fullea, J., and Alonso, C. (eds.). (2000). “The use of the graph corrosion rate-resistivity in the measurement of the corrosion current,” in Measurement and Interpretation of the On-Site Corrosion Rate, Rilem Proceedings (Madrid: Springer), 157–165.
Andrade, C., and González, J. A. (1978). Quantitative measurements of corrosion rate of reinforcing steels embedded in concrete using polarization resistance measurements. Mater. Corros. 29, 515–519. doi: 10.1002/maco.19780290804
Andrade, C., Sanchez, J., and Fullea, J. (2012). On-site corrosion rate measurements: 3D simulation and representative values. Mater. Corros. 63, 1154–1164. doi: 10.1002/maco.201206775
Apostolopoulos, C. A., Demis, S., and Papadakis, V. G. (2013). Chloride-induced corrosion of steel reinforcement – Mechanical performance and pit depth analysis. Constr. Build. Mater. 38, 139–146. doi: 10.1016/j.conbuildmat.2012.07.087
Castedo, A., Sanchez, J., Fullea, J., Andrade, C., and de Andres, P. L. (2012). “Hydrogen induced changes in structural properties of iron: Ab initio calculations,” in Advances in Modeling Concrete Service Life (Madrid: RILEM Bookseries), 79–84. doi: 10.1007/978-94-007-2703-8_8
Castedo, A., Sanchez, J., Fullea, J., Andrade, M. C., and de Andres, P. L. (2011). Ab initio study of the cubic-to-hexagonal phase transition promoted by interstitial hydrogen in iron. Phys. Rev. B. 84:094101. doi: 10.1103/PhysRevB.84.094101
Cullen, A. C., and Frey, H. C. (1999). Probabilistic Techniques in Exposure Assessment: A Handbook for Dealing With Variability and Uncertainty in Models and Inputs. New York, NY: Springer.
Delignette-Muller, M. L., and Dutang, C. (2015). Fitdistrplus: an R package for fitting distributions. J. Statist. Softw. 64:34. doi: 10.18637/jss.v064.i04
Elices, M., Valiente, A., Caballero, L., Iordachescu, M., Fullea, J., Sánchez-Montero, J., et al. (2012). Failure analysis of prestressed anchor bars. Eng. Fail. Anal. 24, 57–66. doi: 10.1016/j.engfailanal.2012.03.007
Feliu, S., Gonzalez, J. A., Andrade, C., and Feliu, V. (1986). The determination of the corrosion rate of steel in concrete by a nonstationary method. Corros. Sci. 26, 961–970. doi: 10.1016/0010-938X(86)90086-7
Feliu, S., Gonzalez, J. A., Feliu, S Jr., and Andrade, M. C. (1990). Confinement of the electrical signal for in situ measurement of polarization resistance in reinforced concrete. ACI Mater. J. 87, 457–460. doi: 10.14359/1830
González, J. A., Andrade, C., Alonso, C., and Feliu, S. (1995). Comparison of rates of general corrosion and maximum pitting penetration on concrete embedded steel reinforcement. Cement Concr. Res. 25, 257–264. doi: 10.1016/0008-8846(95)00006-2
Horner, D. A., Connolly, B. J., Zhou, S., Crocker, L., and Turnbull, A. (2011). Novel images of the evolution of stress corrosion cracks from corrosion pits. Corros. Sci. 53, 3466–3485. doi: 10.1016/j.corsci.2011.05.050
Munoz, A., Andrade, C., and Torres, A. (2007). Corrosion products pressure needed to crack the concrete cover. Adv. Constr. Mater. 2007, 359–370. doi: 10.1007/978-3-540-72448-3_36
Sanchez, J., Andrade, C., and Fullea, J. (2009b). Reasons for crack arrest in stress corrosion cracking tests-crack propagation rate in high-strength steels. Corrosion 65, 368–375. doi: 10.5006/1.3319142
Sanchez, J., Fullea, J., and Andrade, C. (2008a). Fracture toughness variation induced by stress corrosion cracking of prestressing steels. Mater. Corros. Werksto. Korros. 59, 139–143. doi: 10.1002/maco.200804171
Sanchez, J., Fullea, J., and Andrade, C. (2011). High strength steels fracture toughness variation by the media. Model. Corrod. Concr. Struct. 5, 137–146. doi: 10.1007/978-94-007-0677-4_9
Sanchez, J., Fullea, J., and Andrade, C. (2013). “Stress corrosion cracking and fracture toughness of High Strength Steels,” in Proceedings of the 8th International Conference on Fracture Mechanics of Concrete and Concrete Structures (Toledo: FraMCoS), 330–338.
Sanchez, J., Fullea, J., and Andrade, C. (2017a). Corrosion-induced brittle failure in reinforcing steel. Theoret. Appl. Fract. Mech. 92, 229–232. doi: 10.1016/j.tafmec.2017.08.006
Sanchez, J., Fullea, J., and Andrade, C. (2017b). Fracto-surface mobility mechanism in high-strength steel wires. Eng. Fract. Mech. 186, 410–422. doi: 10.1016/j.engfracmech.2017.11.003
Sanchez, J., Fullea, J., Andrade, C., and Alonso, C. (2007). Stress corrosion cracking mechanism of prestressing steels in bicarbonate solutions. Corros. Sci. 49, 4069–4080. doi: 10.1016/j.corsci.2007.05.025
Sanchez, J., Fullea, J., Andrade, C., and Alonso, C. (2009a). Stress corrosion cracking behavior of duplex stainless steel by slow strain rate tests. Corrosion. 65, 154–159. doi: 10.5006/1.3319120
Sanchez, J., Fullea, J., Andrade, C., and de Andres, P. L. (2008b). Hydrogen in α -iron: Stress and diffusion. Phys. Rev. B Cond. Matt. Mater. Phys. 78:014113. doi: 10.1103/PhysRevB.78.014113
Sanchez, J., Fullea, J., Andrade, M. C., and de Andres, P. L. (2010). Ab initio molecular dynamics simulation of hydrogen diffusion in α -iron. Phys. Rev. B 81:132102. doi: 10.1103/PhysRevB.81.132102
Sanchez, J., Lee, S. F., Martin-Rengel, M. A., Fullea, J., Andrade, C., and Ruiz-Hervías, J. (2016b). Measurement of hydrogen and embrittlement of high strength steels. Eng. Fail. Anal. 59, 467–477. doi: 10.1016/j.engfailanal.2015.11.001
Sánchez, J., Ridruejo, Á., Muñoz, E., Andrade, C., Fullea, J., and de Andres, P. (2016a). Cálculo de la velocidad de propagación de la fisura debido a fragilización por hidrógeno. Hormigón y Acero. 67, 325–332. doi: 10.1016/j.hya.2016.01.002
Stern, M., and Geary, A. L. (1957). Electrochemical polarization 1. A theoretical analysis of the shape of polarization curves. J. Electrochem. Soc. 104, 56–63. doi: 10.1149/1.2428473
Turnbull, A., McCartney, L. N., and Zhou, S. (2006a). A model to predict the evolution of pitting corrosion and the pit-to-crack transition incorporating statistically distributed input parameters. Corros. Sci. 48, 2084–2105. doi: 10.1016/j.corsci.2005.08.010
Turnbull, A., McCartney, L. N., and Zhou, S. (2006b). Modelling of the evolution of stress corrosion cracks from corrosion pits. Script. Mater. 54, 575–578. doi: 10.1016/j.scriptamat.2005.10.053
Venables, W. N., and Ripley, B. D. (2002). Modern Applied Statistics With S-Plus. New York, NY: Springer. doi: 10.1007/978-0-387-21706-2
Keywords: corrosion, pitting, tendon, concrete, failure
Citation: Morales JA, Torres J, Rebolledo N and Sánchez J (2019) Experimental and Statistical Analysis of the Corrosion in Tendons in Contact With Water. Front. Mater. 6:167. doi: 10.3389/fmats.2019.00167
Received: 30 November 2018; Accepted: 26 June 2019;
Published: 11 July 2019.
Edited by:
David M. Bastidas, University of Akron, United StatesReviewed by:
Zehra Canan Girgin, Yıldız Technical University, TurkeyJian-Guo Dai, Hong Kong Polytechnic University, Hong Kong
Jose Maria Bastidas, Centro Nacional De Investigaciones Metalurgicas, Spain
Copyright © 2019 Morales, Torres, Rebolledo and Sánchez. This is an open-access article distributed under the terms of the Creative Commons Attribution License (CC BY). The use, distribution or reproduction in other forums is permitted, provided the original author(s) and the copyright owner(s) are credited and that the original publication in this journal is cited, in accordance with accepted academic practice. No use, distribution or reproduction is permitted which does not comply with these terms.
*Correspondence: Javier Sánchez, amF2aWVyLnNhbmNoZXpAY3NpYy5lcw==