 Arne Peys
 Alexios P. Douvalis
 Vincent Hallet
 Hubert Rahier3
 Bart Blanpain
 Yiannis Pontikes
- 1Department of Materials Engineering, KU Leuven, Leuven, Belgium
- 2Department of Physics, University of Ioannina, Ioannina, Greece
- 3Department of Materials and Chemistry, Vrije Universiteit Brussel, Brussels, Belgium
Belonging to the family of alternative cementitious materials, inorganic polymers are rising in importance because of the drive to decrease CO2 emissions of concrete production. A synthetic Fe-rich slag resembling industrial copper or lead slags, was mixed with a sodium silicate activating solution. 57Fe Mössbauer spectra analyses indicate that the oxidation reactions are taking place simultaneously with the polymerization reactions. The slag contains Fe2+ states and a small amount of Fe3+. During polymerization a new octahedral Fe2+ state is formed, while oxidation is manifested through the appearance of an additional Fe3+ state. The reactions continue after setting, lowering the relative contributions of the slag in the Mössbauer and FTIR spectra of the samples. The Na+/Fe3+ molar ratio in the mixture that makes up the binder after 28 days is ~1, suggesting the participation of tetrahedral Fe3+ in the silicate framework, charge balanced by Na+.
Introduction
In search for alternative cementitious materials, geopolymers (Davidovits, 2008), and alkali activated materials (AAM) (Provis and van Deventer, 2014) have received wide attention. More recently, a push for circularization of the economy encouraged metallurgical companies to find alternatives for their residues. In light of this, research in inorganic polymers (IPs) is expanding to ferrosilicate precursors, for instance slags from the non-ferrous metal industries. It was shown that these residues can be increased in reactivity by rapid cooling (Pontikes et al., 2013) or hot stage slag engineering (Van De Sande et al., 2017), while the IPs thereof obtain mechanical properties comparable to geopolymers, i.e., compressive strengths reaching up to 80 MPa (Kriskova et al., 2015). They have shown to be environmentally important, reducing environmental impacts down to 17% of that of ordinary Portland cement (OPC) (Peys et al., 2018a).
Despite these interesting properties and because of the novelty of the understanding that ferrosilicate precursors can be used in alkali-activation, fundamental knowledge on the chemistry of the system and the structural rearrangements during formation is scarce. Using isothermal calorimetry it was shown that, chemically, iron-rich inorganic polymers seem to follow a two stage reaction pattern: dissolution and polymerization (Kriskova et al., 2015; Onisei et al., 2015). As such, they are comparable to their aluminosilicate counterparts, where calorimetric techniques are often used to distinguish these two reaction stages (Rahier et al., 2007; Zhang et al., 2013) or to compare the reactivity of different formulations (Kumar et al., 2007; Lemougna et al., 2014; Peys et al., 2016). More thorough analysis of calorimetry results also enables the calculation of the reaction enthalpy and subsequent determination of the stoichiometry of the chemical system (Rahier et al., 1997) or the determination of the rate limiting step in the formation (Rahier et al., 2003). In terms of the evolution of the molecular structure, in-situ Fourier transform infrared (FTIR) spectroscopy is probably the most used technique, mainly because of its accessibility. Although success is seen for aluminosilicates (Rees et al., 2007; Hajimohammadi et al., 2010), in-situ FTIR by itself did not show the evolution of the structure (Onisei et al., 2015) sufficiently clearly and the exact reaction mechanism therefore remains unclear. However, more recent developments (Peys et al., 2017; Onisei et al., 2018) have increased the understanding of the infrared spectrum of ferrosilicate precursors and their alkali-activated products. The main interesting feature in the spectra is the Si-O stretching band. The position of this band in the precursors varies between 950 and 850 cm−1, depending on the amount of network modifiers per silicon atom in the silicate phases of the slag (Peys et al., 2017). This band shifts to ~950 cm−1 after alkali-activation (Kriskova et al., 2015; Peys et al., 2017; Onisei et al., 2018). This was attributed to a higher degree of polymerization observed in recent work (Peys et al., 2018b), because of the (at least partial) incorporation of the Fe3+ species in the network.
The aforementioned oxidation was experimentally observed using 57Fe Mössbauer spectroscopy (Lemougna et al., 2013; Onisei et al., 2018). In these works the success in providing information for the oxidation state of iron (Fe3+) in the IP binder, did not expand to the level of the exact description of the coordination of iron (Lemougna et al., 2013; Onisei et al., 2018). Both referred papers suggest an average 4- or 5-fold coordination. Similarly, X-ray absorption spectroscopy (XAS) measurements (Simon et al., 2018) confirm the oxidation state of the binder phase and suggest an average coordination number of 5. An important characteristic referred to the formation of the binder is that the evolution over time of the oxidation reaction is unknown. Mössbauer spectroscopy measurements can be performed on solutions after freezing in liquid nitrogen temperatures (Silver et al., 1979; Douglas et al., 1984). As this practically decelerates the reaction kinetics toward negligible speeds, it enables their ex-situ study (Krebs et al., 2005; Kamnev et al., 2014). In-situ kinetic studies have also been performed using synchrotron radiation techniques, e.g., X-ray/neutron total scattering on the alkali-activation of metakaolin (Bell et al., 2008; White et al., 2011, 2013a), blast furnace slag (White et al., 2013b; Garg and White, 2017) and on conventional cements (Grangeon et al., 2017; Bae et al., 2018; Cuesta et al., 2019). With these techniques, the short and intermediate range ordering can be investigated in great detail. The results of these studies are often interpreted with the help of theoretical modeling techniques (White et al., 2010; Yang and White, 2016; Geng et al., 2017; Zhou et al., 2017), which increases the understanding of the molecular structure or formation mechanism to a great extent.
In the present work, the reaction mechanism of Fe-silicate IPs is clarified with respect to the behavior of Fe in the first 28 days after mixing. A combination of 57Fe Mössbauer spectroscopy and attenuated total reflectance Fourier transform infrared (ATR-FTIR) spectroscopy is performed ex-situ to provide details on the evolution of the local environment of Fe and the connectivity of the silicate network throughout the reaction. These observations are combined to provide new information on our binder system, such as the timing of oxidation reactions. Additionally, they provide detailed information on the local atomic environment of Fe in potential intermediate stages of the material, formed between the initial slag and the final IPs studied in previous works. As such, a step is taken in unraveling the mechanism of formation of Fe-silicate IPs.
Experimental Methods and Materials
The precursor slag with chemical composition given in Table 1 was synthesized by melting iron ore, limestone, and sand in a pilot scale furnace. After a complete melt was obtained, the slag was tapped and granulated by spraying the slag with pressurized water jets into droplets to maximize the amount of glassy phase in the precursor. The precursor hereby replicates a composition often used in non-ferrous metallurgy, but including only the major elements FeO, SiO2, CaO, and Al2O3 (a minor content of MgO was detected due to impurities in the raw materials). This methodology to produce synthetic glasses at pilot scale is described in more detail in Machiels et al. (2017). Milling was performed to reach a specific surface of 4,000 ± 200 cm2/g measured by the Blaine method. The chemical composition was measured standard-less with wavelength dispersive X-ray fluorescence (XRF) on a Philips PW 2,400. The glassy phase in the precursor was quantified by X-ray diffraction (XRD) after mixing with 10 wt.% of internal zincite standard in a McCrone mill. A Bruker D2-Phaser with Cu Kα radiation was used for these measurements under 30 kV−10 mA, a slit size of 0.6 mm and an anti-scatter slit of 1 mm. With these settings, no crystalline peaks could be observed apart from those of zincite; the amount of glassy phase is estimated to be > 97 wt.%. The diffractogram is added in the supplementary information (Figure S1) for interested readers. The IP mixture consisted of the above described precursor and a sodium silicate solution with molar ratios SiO2/Na2O of 1.6 and H2O/Na2O of 20. The solution/slag mass ratio was 0.45. Pastes using these ratios were mixed by hand and used in all experimental techniques below.
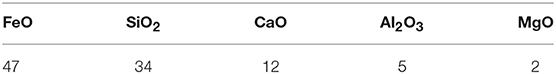
Table 1. Chemical composition of precursor slag in wt.%, obtained from XRF (estimated relative error 10%).
Isothermal calorimetry was performed using a TAM Air at 20°C. A sample with 4 g of slag was mixed for 90 s and transferred into the microcalorimeter. Data are presented after 53.5 min of stabilization in the machine to avoid the influence of the temperature difference between the calorimeter and sample (+26.5 min preparation). The first dissolution and wetting heat is not monitored, i.e., no admix ampule was used, as this information was not needed for the present study. ATR-FTIR spectroscopy was performed on a Bruker Alpha-P, which uses a diamond ATR crystal. A resolution of 4 cm−1 was selected and a measurement considered 32 scans. Before setting, for measurements after 6 h or less, a drop was measured without applying pressure on the paste in the ATR-cell. Because the powder is not pressed against the crystal, a relatively higher intensity will come from the solution, where the changes are anticipated to be the most interesting. For later reaction stages (>6 h), the reported spectrum is the average of 2 measurements on powdered samples (these were pressed against the crystal). The powdering of the samples was performed right before the FTIR (and Mössbauer) measurements, before which the pastes were stored in closed bottles at 21 ± 1°C. The FTIR spectra shown in the plots in the results section are rescaled in the y-axis to show the same maximum absorbance of the Si-O stretching band. 57Fe Mössbauer spectroscopy measurements were performed to investigate the evolution of the state and environment of the Fe atoms during reaction. Gamma rays were emitted from a source using the decay of 57Co in Rh matrix kept at room temperature. The samples were measured in transmission geometry on a constant acceleration spectrometer at 77 K. The reported isomer shift (IS) values are given relative to α-Fe at room temperature. The IMSG software (Douvalis et al., 2010) was used for the fitting of the spectra. Before setting, the samples were prepared by adding a drop of paste in the holder and freezing this in liquid nitrogen to solidify the material and stop the reactions. At later stages of the reaction after hardening, the materials were powdered and pressed in the sample holder before freezing and loading into the spectrometer. The effectiveness of this freezing to stop the reactions was tested by measuring a sample that reacted for 3 h and for 3 h + 14 days in liquid nitrogen. These two measurements resulted in spectra with no experimental difference and led to the conclusions that: (i) the reactions are halting after freezing the samples at 77 K and (ii) the samples do not change through the duration of the measurement, which has a typical length of 24 h.
Results and Discussion
Isothermal calorimetry measures the heat flow, proportional to the reaction rate, coming from the reactions in the sample. It can thereby provide the time-frame in which the different reaction stages occur. The heat flow, Figure 1, shows the exotherm which in geopolymers is often used to indicate the timing of the polymerization reactions (Rahier et al., 2007). The maximum heat flow in Figure 1 is observed around 4 h, which was also approximately the time of setting; the main part of these polymerization reactions seems to occur between 3 and 24 h after mixing. It should be mentioned that in the Fe-rich IPs the Fe2+ in the presented slag is oxidized to Fe3+ during and/or after the synthesis (Onisei et al., 2018; Simon et al., 2018). A contribution from this reaction is not distinguished here or in previous studies (Kriskova et al., 2015; Onisei et al., 2015). The oxidation most probably occurs simultaneously with the dissolution or polymerization, or occurs on a longer time-scale and it is not noticed as a separate phenomenon in the calorimetry measurements. Important to note is that no crystalline components are consumed or formed by the reactions; previous work showed that no changes are observed in X-ray diffraction, apart from the appearance of carbonate phases in certain mixtures (Machiels et al., 2014; Iacobescu et al., 2017).
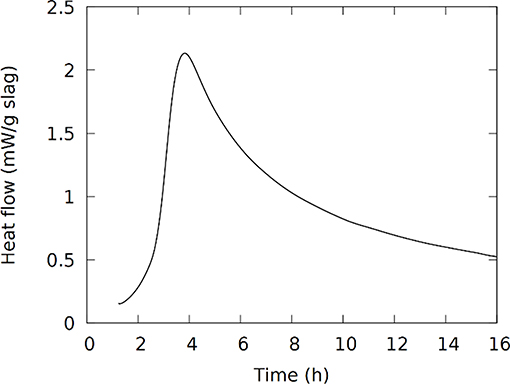
Figure 1. Heat flow in isothermal calorimetry at 20°C from the first 16 h after mixing.
The kinetics of the oxidation of iron are elucidated with 57Fe Mössbauer spectroscopy. Figure 2 presents the raw spectra of the slag and IPs with curing times up to 28 days. There it can be seen that the slag spectrum is dominated by contributions with IS values of ~1.0 mm/s and quadrupole splitting (QS) values of ~2.5 mm/s. This is an indication that the main part of the iron in this sample is of Fe2+ character (White et al., 2010; Cuesta et al., 2019), however the asymmetry of the lower and higher velocity resonant line intensities suggests that there must be at least two Fe2+ contributions that should have different characteristics, and in particular different QS values. Moreover, a minor peak at ~1.0 mm/s suggests the presence of an additional minor Fe3+ state. Thus, the lowest number of components that could fit the slag spectrum was three, two different Fe2+ (S1 and S2) and one Fe3+ (S3). The naming of these components is composed of “S” referring to Slag and a number. Similarly, new components in the IPs will be called IP1 and IP2. The fitting result using this model for the slag, in which components S1, S2, and S3 were allowed a Gaussian-type symmetric spreading of their QS values (ΔQS) to simulate the observed broadening of the absorption resonant lines, is given in Figure 3 and the Mössbauer hyperfine parameters are presented in Table 2. The IS and QS values of S1 and S2 correspond to high spin (S = 2) Fe2+ in oxides or silicates (Greenwood and Gibb, 1971; Coey, 1984), while the corresponding values for the minor S3 lie at the upper limit of high spin (S = 5/2) Fe3+ ions found in such compounds (Greenwood and Gibb, 1971; Coey, 1984). This result shows that the particular slag contains a majority of Fe2+ combined with a minority of Fe3+ species.
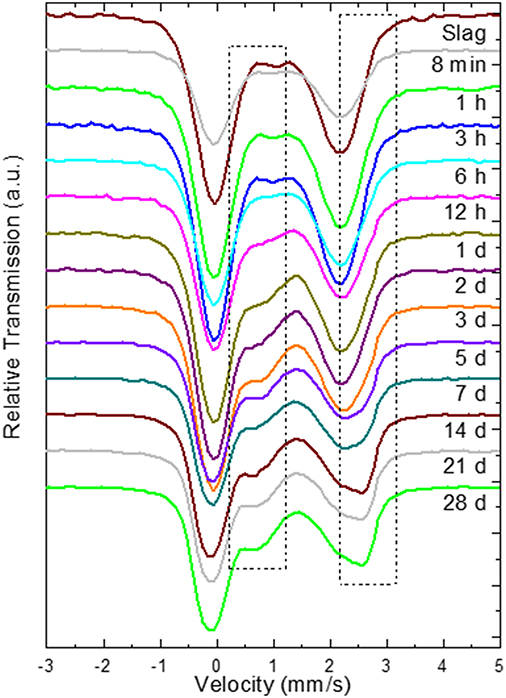
Figure 2. Raw 57Fe Mössbauer spectra during the first 28 days of reaction, where the numbers indicate the reaction time after mixing, in minutes (min), hours (h), or days (d). The dashed rectangles indicate the regions where the high velocity parts of the new Fe3+ and Fe2+ QS doublet contributions of the binder gradually appear.
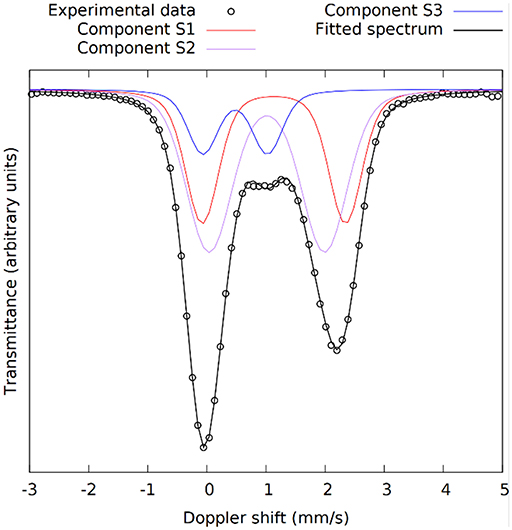
Figure 3. The 57Fe Mössbauer spectrum of the slag with the three components used in the fitting model shown in different colors. S1 and S2 are Fe2+ and S3 is Fe3+.
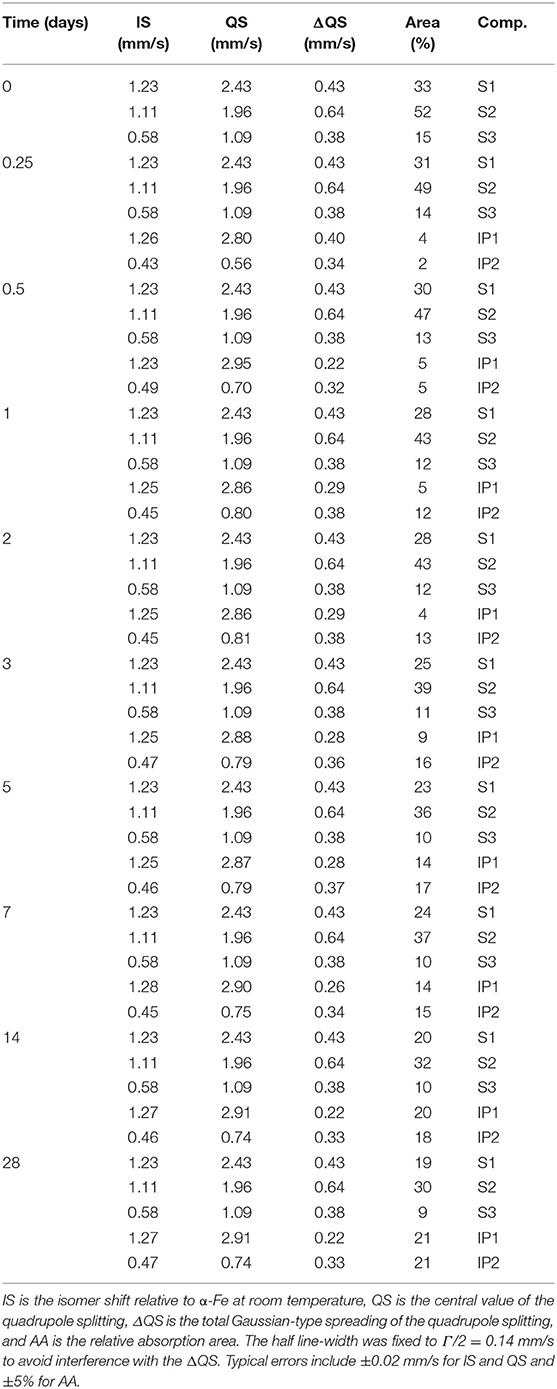
Table 2. Resulting hyperfine parameters values of the components used to fit the 57Fe Mössbauer spectra.
Moving to the IP sample spectra, a more detailed observation of Figure 2 (insert dashed rectangles) reveals the appearance and increase of the intensity of one additional absorption contribution at ~0.75 mm/s and a second at ~2.50 mm/s as the reaction time increases. These are evidences for the appearance of two additional components, one of Fe3+ and one of Fe2+ character respectively, during the reaction of the slag with the activating solution. Consequently, the fitting of the IP spectra could be performed by keeping the three contributions of the slag (S1, S2, S3) and adding one new Fe2+ (IP1) and one new Fe3+ (IP2) contribution to the fitting model, which represent the iron ions in the binder part of the newly formed IP. Gaussian spreading of the quadrupole splitting was allowed for components IP1 and IP2, i.e., the ΔQS was refined by the fitting procedure. The parameters of the slag components (S1, S2, and S3) were fixed to the values resulting from fitting the slag spectrum, the intensities and absorption areas (AAs) of components S1 and S3 were made dependent on the major S2 component to result in the same ratio of AAs as in the slag and only the intensity of component S2 was left to vary in the fits. As such, the IP spectra are fitted with a combination of the slag spectrum and the new Fe2+ and Fe3+ components, IP1 and IP2 respectively. This model thus embeds the idea that the part of the slag that has not reacted with the activating solution to form the binder phase of the IP, is conserved in the configuration it had before the start of the reactions. The described model was used to fit the IP spectra with reaction times equal or longer than 6 h, as for the frozen solutions with reaction times shorter than 6 h the spectra are essentially the same as the slag spectrum within the experimental tolerance limits and according to their fitting results. Example fitting results are shown in Figure 4.
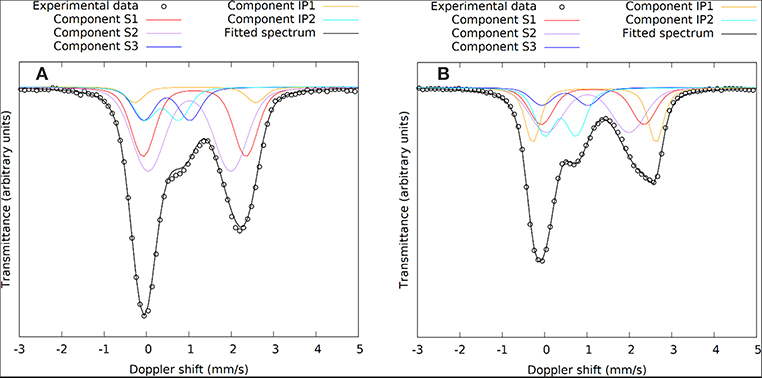
Figure 4. 57Fe Mössbauer spectra of the IPs recorded at (A) 1 day and (B) 28 days. The slag components (S1, S2, S3) are shown in the same colors as Figure 3 and the binder components (IP1, IP2) are added in yellow and cyan.
The Mössbauer parameters of the two Fe2+ sites in the slag, S1 and S2, show similarities with the slag components in our previous work (Onisei et al., 2018). However, the composition of the slag there was found to be close to fayalite, while the IS and QS values here are close to those obtained for pyroxenes toward the ferrosilite composition, in which two sites with varying QS values are observed (Greenwood and Gibb, 1971; Coey, 1984). The spread in the QS values for components S1 and S2 is quite large, showing that this is representing the glassy phase observed with XRD. Component S3 shows relatively large IS and QS values for an Fe3+ state as well as a large ΔQS, it is thus another component in the glassy phase of the slag. Based on the absorption areas, the Fe3+/ΣFe ratio of the slag was 0.14.
The Fe3+ in the IP binder (component IP2) shows IS and QS values similar to the Fe3+ component of the binder in previous work on final samples (Onisei et al., 2018) and thus suggest that an average of 5-fold or 4-fold coordination with rather high Fe-O distances is present. The low QS with respect to other glasses (Mysen, 2006) shows, for this high spin Fe3+, that the IP binder contains a higher symmetry of the ligands, i.e., a higher similarity of the species connected to Fe3+ or more symmetrically distributed around it (Greenwood and Gibb, 1971; Coey, 1984). This might be an indication of the participation of these Fe3+ ions in the silicate network as network formers, charged balanced by Na+, as the network forming character would mean (for the example of a tetrahedron) that Fe3+ is surrounded by four bridging oxygen atoms, instead of three bridging and one non-bridging. The new Fe2+ site, component IP1, has not been observed in previous measurements (Onisei et al., 2018; Simon et al., 2018), although similar Fe3+ sites as component IP2 have been found. This Fe2+ state thus seems to have been oxidized in later reaction stages or after milling these samples to a powder. Component IP1 shows larger IS and QS values than the Fe2+ components of the slag (S1 and S2), suggesting the presence of distorted, asymmetric octahedra, comparable with fayalite minerals (Coey, 1984; Vandenberghe and De Grave, 2013; Onisei et al., 2018), Fe-rich smectites (Chemtob et al., 2015), micas (Ferrow, 1987), or Fe(II) hydroxides (Génin et al., 1996). The spreading of the quadrupole splitting of IP1 is lower compared to the other components, suggesting a more ordered environment. The presence of crystalline phases has however not been observed in this material with XRD (Machiels et al., 2014; Iacobescu et al., 2017), the IP2 component is thus rather present in a nano-crystalline phase or in very small crystallite clusters.
The evolution of the absorption areas of the new contributions (IP1 and IP2) are illustrated in Figure 5. Changes in the Mössbauer spectra do not happen immediately upon dissolution. This is not because of an insignificant extent of dissolution: The immediate start of the dissolution reactions was validated by measuring the concentration of the ions with induced coupled plasma optical emission spectroscopy (Pontikes et al., 2013). No rearrangement of the Fe environment occurs during the first 3 h, there is no oxidation or coordination change. The first changes are observed from 6 h on, meaning reactions have started between 3 and 6 h. This corresponds to the time where according to calorimetry the polymerization reactions start. The Fe2+ (IP1) and Fe3+ (IP2) components both emerge at this time stage. The largest increase in absorption area of components IP1 and IP2 is observed in the first 24 h, an observation which is analogous to the heat evolution. After the first 24 h, IP1 and IP2 keep increasing in area, although at a slower rate. After 28 days, an AA of 21% is observed for the new Fe2+ state (IP1) and 21% for the Fe3+ (IP2). At this point it is interesting to check the Na/Fe3+ ratio to confirm the possibility of having Fe3+ in the silicate network of the binder, like Al3+ in geopolymers. This ratio is ~1 for the mixture presented here, making it possible that Na provides the charge balance for Fe3+. The molar ratio Si/Fe3+ provides information on the environment of Si in the network. This ratio is ~3; the dominant silicate species [using Engelhardt notation (Engelhardt et al., 1982)] are thus Q4(1Fe) and Q4(2Fe). Previous work attempted to provide such compositional information using an electron probe microanalyzer (Kriskova et al., 2015; Iacobescu et al., 2017; Onisei et al., 2018), but because of experimental limitations (e.g., interaction volume, sodium evaporation, etc.) and the inhomogeneity at the nanoscale (see for instance the two different states of Fe), no relevant compositional information could be derived from these experiments. The ratios calculated in the present paper are thus not confirmed by another experimental technique. Future work, for instance considering transmission electron microscopy coupled with electron dispersive X-ray spectroscopy might provide a more accurate and detailed view on the binder phase composition.
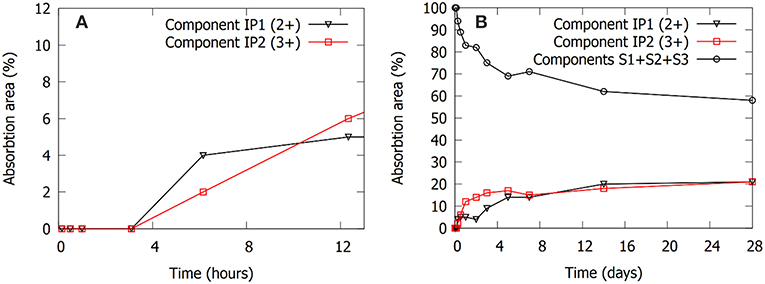
Figure 5. Evolution of the absorption areas of components IP1, IP2, and the sum of absorption areas of components S1, S2, and S3. (A) Shows the short term (≤12 h) evolution of the absorption areas of the IP1 and IP2 components. The IP binder components only start forming after 3 h (0.125 days). (B) Shows the evolution of the absorption areas up to 28 days of curing.
The kinetics of the evolution of the AA of components IP1 and IP2 follows an interesting sequence. IP1 seems to form faster initially (Figure 5A), which might suggest that the structure associated with IP2 needs IP1 as nucleation site. Between 6 h and 3 days the AA of component IP1 stays approximately constant, while IP2 evolves toward its maximum (Figure 5B). Afterwards, also the AA of IP1 gradually goes to its maximum at 28 days. It seems that after the start of formation of IP2, the structure that contains this Fe3+ component forms until the Na/Fe3+ ratio of 1 is reached, after which the reactions switch again to produce the Fe2+ component IP1.
The same time stages and samples are investigated with ATR-FTIR, Figure 6. The spectra are focused on the Si-O stretching band (700–1,200 cm−1). The “initial” spectrum, obtained after 8 min, shows two main features. The shoulder at 850 cm−1 is associated with the precursor slag, as can be derived from the dotted line representing the spectrum of the slag. The band at 984 cm−1 corresponds to the sodium silicate activating solution. The dissolution of the slag is reflected by the decrease in intensity of the shoulder around 850 cm−1. This is not only observed in the initial stages (Figure 6A), but extends to days after mixing (Figure 6B). The formation of the IP network is seen in the FTIR as the growth of a shoulder around 918 cm−1 and the shift of the band that was previously at 984 cm−1 (Figure 6A, notice the transition from 3 to 6 h). Simultaneously, the shoulder at ~1,100 cm−1 disappears, indicating the consumption of the highly connected silicate species from the activating solution. The difference plot in Figure 7 shows the changes between the starting point and the spectrum after 6 h more clearly. The emergence of the shoulder at 918 cm−1 and the shift of the band at 984 cm−1 can both be linked with the emergence of a new band around 950 cm−1. These transitions are associated with the observation from Mössbauer spectroscopy: the incorporation of Fe3+ in the silicate network (see the calculations in previous paragraph suggesting the presence of Q4(1Fe) and Q4(2Fe) Si) and thus the change from Si-O-Si linkages in the activating solution toward Si-O-Fe linkages in the IP binder results in a lower wavenumber of the Si-O stretching band in the IPs with respect to the activating solution. The position of the maximum of the Si-O stretching band after 28 days is observed at 959 cm−1, which is similar to what is observed for Si-O-Al linkages in aluminosilicate IPs (950–1,000 cm−1) (Rahier et al., 2007; Rees et al., 2007) and in previous work which suggested that Fe has a similar impact on the band (Peys et al., 2017; Onisei et al., 2018). In general, this shift of the stretching band to lower wavenumbers is due to the widening of the Si-O-T distance, compared to Si-O-Si, and is observed in a wide variety of materials (Henderson and Taylor, 1979).
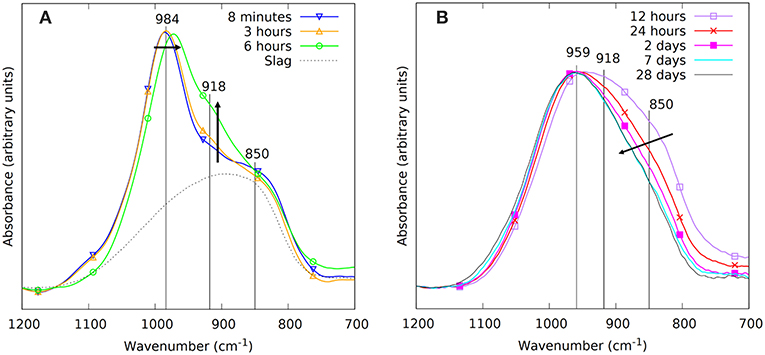
Figure 6. The FTIR spectra during the first 28 days of reaction. The spectra before setting are shown on the left in (A), these thus consider measurements in the liquid state, with the liquid in direct contact with the ATR crystal. The measurements on powdered samples after setting, pressed against the ATR crystal, are shown on the right in (B).
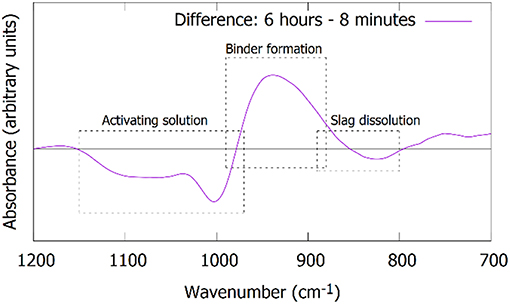
Figure 7. Difference plot of the FTIR spectra after 6 h compared to 8 min, revealing more clearly the changes: (1) transformation of the activating solution, (2) the formation of the binder phase, and (3) the dissolution of the slag.
Using the information from the above experiments it is now possible to suggest a reaction scheme for the Fe-rich IPs. A schematic representation of the reactions is shown in Figure 8. After dissolution, Fe-silicate species are present in the pregnant activating solution. The concentration of these species rises until polymerization takes place into the partially oxidized binder, which consists of tetrahedral Fe3+ and octahedral Fe2+ of which at least one should be present in the silicate framework. For the mixture studied in the present paper the starting time of polymerization-oxidation should be between 3 and 6 h at 20°C. The dissolution of the slag and polymerization and oxidation is ongoing until at least 28 days after mixing, however, it is very likely that the time-scale for finalizing the reactions is longer than the 28 days presented here. A comparison with previous work (Onisei et al., 2018; Simon et al., 2018), where the contribution of the Fe3+ binder component was much larger and no Fe2+ binder component was observed, shows that a more complete oxidation happens in later stages of the reaction or during intensive milling.
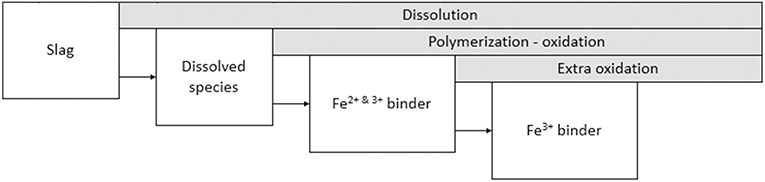
Figure 8. Schematic of the sequence of reaction stages.
Future work will study in detail the transition from the 28 days study presented here, revealing a combination of IVFe3+ and VIFe2+ in the binder, toward the fully oxidized structure observed in previous work (Onisei et al., 2018; Peys et al., 2018b; Simon et al., 2018).
Conclusions
The evolution of the molecular structure during synthesis of Fe-rich slag based IPs has been monitored with 57Fe Mössbauer spectroscopy and infrared spectroscopy. Fe-rich slags mainly consist of Fe2+ (85% absorption area in Mössbauer spectrum), whereas an IP binder was shown to contain both Fe2+ and Fe3+. The first appearance of a new Fe3+ band in Mössbauer spectroscopy occurs after 6 h of reaction at 20°C, and the main oxidation happened during the first 24 h. It is suggested that this Fe3+ is situated in tetrahedral coordination in the silicate framework. At the same time, a novel octahedral Fe2+ component is found to form in the binder phase with Mössbauer parameters similar to fayalite or clay minerals and which approximately follows the same kinetics of formation as the Fe3+ state. The fact that these new components only develop from 6 h after mixing and are mostly occurring within the first 24 h is in line with the onset of the polymerization exotherm in calorimetry, between 3 and 6 h, and the fact that the largest part of the heat from the reactions evolved in the first 24 h. ATR-FTIR spectroscopy suggested the incorporation of Fe in the silicate network. At 28 days, a total of 42% of the absorption area (AA) in the Mössbauer spectrum was attributed to the binder phase, comprised 21% of Fe2+ and 21% of Fe3+, compared to 86% Fe2+ and 14% Fe3+ in the precursor slag. This results in a Na/Fe3+ ratio of ~1 in the mixture from which the binder phase is formed, revealing an important similarity with geopolymers where a Na/Al3+ ratio of 1 is observed. The Fe2+ binder state was not observed previously, whereas the Fe3+ binder state always had a higher absorption area in previous work. This is probably associated with oxidation at later stages or/and with the milling procedures performed in previous work which increase the surface of the material exposed to air and consequently to oxidation.
Data Availability
The datasets generated for this study are available on request to the corresponding author.
Author Contributions
AP lead all parts of the paper making process. AD supported in designing, performing, analyzing, and discussing the 57Fe Mössbauer spectroscopy measurements. VH helped in designing, analyzing and discussing the FTIR, and performed the measurements. HR, BB, and YP are the supervisors of AP and provided feedback, and inspiration in all aspects.
Funding
AP is grateful to the Research Foundation–Flanders (FWO) for the Ph.D. grant. VH is thankful to VLAIO for the Baekeland scholarship.
Conflict of Interest Statement
The authors declare that the research was conducted in the absence of any commercial or financial relationships that could be construed as a potential conflict of interest.
Supplementary Material
The Supplementary Material for this article can be found online at: https://www.frontiersin.org/articles/10.3389/fmats.2019.00212/full#supplementary-material
References
Bae, S., Jee, H., Kanematsu, M., Shiro, A., Machida, A., Watanuki, T., et al. (2018). Pair distribution function analysis of nanostructural deformation of calcium silicate hydrate under compressive stress. J. Am. Ceram. Soc. 101, 408–418. doi: 10.1111/jace.15185
Bell, J. L., Sarin, P., Driemeyer, P. E., Haggerty, R. P., Chupas, P. J., and Kriven, W. M. (2008). X-ray pair distribution function analysis of a metakaolin-based, KAlSi2O6.5.5H2O inorganic polymer (geopolymer). J. Mater. Chem. 18, 5974–5981. doi: 10.1039/B808157C
Chemtob, S. M., Nickerson, R. D., Morris, R. V., Agresti, D. G., and Catalano, J. G. (2015). Synthesis and structural characterization of ferrous trioctahedral smectites: implications for clay mineral genesis and detectability on Mars. J. Geophys. Res. Planet. 120, 1119–1140. doi: 10.1002/2014JE004763
Coey, J. M. D. (1984). “Mössbauer spectroscopy of silicate minerals,” in Mössbauer Spectroscopy Applied to Inorganic Chemistry, ed G. J. Long (Boston, MA: Springer, 443–509.
Cuesta, A., Zea-Garcia, J. D., De la Torre, A. G., Santacruz, I., and Aranda, M. A. G. (2019). Synchrotron pair distribution function analyses of ye'elimite-based pastes. Adv. Cem. Res. 31, 138–146. doi: 10.1680/jadcr.18.00097
Douglas, K. T., Howlin, B., and Silver, J. (1984). Solution Chemistry and mössbauer study of iron(II) and iron(III) complexes from gallocyanine. Inorg. Chim. Acta 92, 135–140. doi: 10.1016/S0020-1693(00)80010-9
Douvalis, A. P., Polymeros, A., and Bakas, T. (2010). IMSG09: a 57Fe-119Sn Mössbauer spectra computer fitting program with novel interactive user interface. J. Phys. 217:012014. doi: 10.1088/1742-6596/217/1/012014
Engelhardt, G., Hoebbel, D., Tarmak, M., Samoson, A., and Lippmaa, E. (1982). 29Si-NMR-Untersuchungen zur Anionenstruktur von Kristallinen Tetramethylammonium-alumosilicaten und alumosilicatlösungen. Z. Anorg. Allg. Chem. 484, 22–32. doi: 10.1002/zaac.19824840103
Ferrow, E. (1987). Mössbauer effect and X-ray diffraction studies of synthetic iron bearing trioctahedral micas. Phys. Chem. Miner. 14, 276–280. doi: 10.1007/BF00307994
Garg, N., and White, C. E. (2017). Mechanism of zinc oxide retardation in alkali-activated materials: an in situ X-ray pair distribution function investigation. J. Mater. Chem. A 5, 11794–11804. doi: 10.1039/C7TA00412E
Geng, G., Myers, R. J., Qomi, M. J. A., and Monteiro, P. J. M. (2017). Densification of the interlayer spacing governs the nanomechanical properties of calcium-silicate-hydrate. Sci. Rep. 7:10986. doi: 10.1038/s41598-017-11146-8
Génin, J.-M. R., Olowe, A. A., Refait, P., and Simon, L. (1996). On the stoichiometry and Pourbaix diagram of Fe(II)-Fe(III) hydroxyl-sulphate or sulphate-containing green rust 2: an electrochemical and Mössbauer spectroscopy study. Corros. Sci. 38, 1751–1762. doi: 10.1016/S0010-938X(96)00072-8
Grangeon, S., Fernandez-Martinez, A., Baronnet, A., Marty, N., Poulain, A., Elkaïm, E., et al. (2017). Quantitative X-ray pair distribution function analysis of nanocrystalline calcium silicate hydrates: a contribution to the understanding of cement chemistry. J. Appl. Crystallogr. 50, 14–21. doi: 10.1107/S1600576716017404
Hajimohammadi, A., Provis, J. L., and van Deventer, J. S. J. (2010). Effect of alumina release rate on the mechanism of geopolymer gel formation. Chem. Mater. 22, 5199–5208. doi: 10.1021/cm101151n
Henderson, C. M. B., and Taylor, D. (1979). Infrared spectra of aluminogermanate- and aluminate-sodalites and a re-examination of the relationship between T-O bond length, T-O-T angle and the position of the main i.r. absorption band for compounds with framework structures. Spectrochim. Acta A 35, 929–953. doi: 10.1016/0584-8539(79)80016-1
Iacobescu, R. I., Cappuyns, V., Geens, T., Kriskova, L., Onisei, S., Jones, P. T., et al. (2017). The influence of curing conditions on the mechanical properties and leaching of inorganic polymers made of fayalitic slag. Front. Chem. Sci. Eng. 11, 317–327. doi: 10.1007/s11705-017-1622-6
Kamnev, A. A., Dykman, R. L., Kovacs, K., Pankratov, A. N., Tugarova, A. V., Homonnay, Z., et al. (2014). Redox interactions between structurally different alkylresorcinols and iron(III) in aqueous media: frozen-solution 57Fe Mössbauer spectroscopic studies, redox kinetics and quantum chemical evaluation of the alkylresorcinol reactivities. Struct. Chem. 25, 649–657. doi: 10.1007/s11224-013-0367-1
Krebs, C., Price, J. C., Baldwin, J., Saleh, L., Green, M. T., and Bollinger, J. M. Jr. (2005). Rapid Freeze-quench 57Fe Mössbauer spectroscopy: monitoring changes of an iron-containing active site during a biochemical reaction. Inorg. Chem. 44, 742–757. doi: 10.1021/ic048523l
Kriskova, L., Machiels, L., and Pontikes, Y. (2015). Inorganic polymers from a plasma convertor slag: effect of activating solution on microstructure and properties. J. Sustainable Metal. 1, 240–251. doi: 10.1007/s40831-015-0022-8
Kumar, S., Kumar, R., Alex, T. C., Bandopadhyay, A., and Mehrotra, S. P. (2007). Influence of reactivity of fly ash on geopolymerisation. Adv. Appl. Ceram. 106, 120–127. doi: 10.1179/174367607X159293
Lemougna, P. N., Chinje Melo, U. F., Delplancke, M.-P., and Rahier, H. (2014). Influence of the chemical and mineralogical composition on the reactivity of volcanic ashes during alkali activation. Ceram. Int. 40, 811–820. doi: 10.1016/j.ceramint.2013.06.072
Lemougna, P. N., MacKenzie, K. J. D., Jameson, G. N. L., Rahier, H., and Chinje Melo, U. F. (2013). The role of iron in the formation of inorganic polymers (geopolymers) from volcanic ash: a 57Fe Mössbauer spectroscopy study. J. Mater. Sci. 48, 5280–5286. doi: 10.1007/s10853-013-7319-4
Machiels, L., Arnout, L., Jones, P. T., Blanpain, B., and Pontikes, Y. (2014). Inorganic polymer cement from Fe-silicate glasses: varying the activating solution to glass ratio. Waste Biomass Valori. 5, 411–428. doi: 10.1007/s12649-014-9296-5
Machiels, L., Arnout, L., Yan, P., Jones, P. T., Blanpain, B., and Pontikes, Y. (2017). Transforming enhanced landfill mining derived gasification/vitrification glass into low-carbon inorganic polymer binders and building products. J. Sustainable Metall. 3, 405–415. doi: 10.1007/s40831-016-0105-1
Mysen, B. O. (2006). The structural behavior of ferric and ferrous iron in aluminosilicate glass near meta-aluminosilicate joins. Geochim. Cosmochim. Acta 70, 2337–2353. doi: 10.1016/j.gca.2006.01.026
Onisei, S., Douvalis, A. P., Malfliet, A., Peys, A., and Pontikes, Y. (2018). Inorganic polymers made of fayalite slag: on the microstructure and behavior of Fe. J. Am. Ceram. Soc. 101, 2245–2257. doi: 10.1111/jace.15420
Onisei, S., Lesage, K., Blanpain, B., and Pontikes, Y. (2015). Early age microstructural transformations of an inorganic polymer made of fayalite slag. J. Am. Ceram. Soc. 98, 2269–2277. doi: 10.1111/jace.13548
Peys, A., Arnout, L., Blanpain, B., Rahier, H., Van Acker, K., and Pontikes, Y. (2018a). Mix-design parameters and real-life considerations in the pursuit of lower environmental impact inorganic polymers. Waste Biomass Valori. 9, 879–889. doi: 10.1007/s12649-017-9877-1
Peys, A., Arnout, L., Hertel, T., Iacobescu, R. I., Onisei, S., Kriskova, L., et al. (2017). “The use of ATR-FTIR spectroscopy in the analysis of iron-silicate inorganic polymers,” in Proceedings of the 5th International Slag Valorisation Symposium (Leuven). 385–388.
Peys, A., Rahier, H., and Pontikes, Y. (2016). Potassium-rich biomass ashes as activators in metakaolin-based inorganic polymers. Appl. Clay Sci. 119, 401–409. doi: 10.1016/j.clay.2015.11.003
Peys, A., White, C. E., Olds, D., Rahier, H., Blanpain, B., and Pontikes, Y. (2018b). Molecular structure of CaO-FeOx-SiO2 glassy slags and resultant inorganic polymer binders. J. Am. Ceram. Soc. 101, 5846–5857. doi: 10.1111/jace.15880
Pontikes, Y., Machiels, L., Onisei, S., Pandelaers, L., Geysen, D., Jones, P. T., et al. (2013). Slags with a high Al and Fe content as precursors for inorganic polymers. Appl. Clay Sci. 73, 93–102. doi: 10.1016/j.clay.2012.09.020
Provis, J. L., and van Deventer, J. S. J. (2014). Alkali Activated Materials: State-of-the-Art Report, RILEM TC 224-AAM. New York, NY: Springer.
Rahier, H., Denayer, J. F., and Van Mele, B. (2003). Low-temperature synthesized aluminosilicate glasses: Part IV Modulated DSC study on the effect of particle size of metakaolinite on the production of inorganic polymer glasses. J. Mater. Sci. 38, 3131–3136. doi: 10.1023/A:1024733431657
Rahier, H., Simons, W., Van Mele, B., and Biesemans, M. (1997). Low-temperature synthesized aluminosilicate glasses: part III Influence of the composition of the silicate solution on production, structure and properties. J. Mater. Sci. 32, 2237–2247. doi: 10.1023/A:1018563914630
Rahier, H., Wastiels, J., Biesemans, M., Willem, R., Van Assche, G., and Van Mele, B. (2007). Reaction mechanism, kinetics and high temperature transformations of geopolymers. J. Mater. Sci. 42, 2982–2996. doi: 10.1007/s10853-006-0568-8
Rees, C. A., Provis, J. L., Lukey, G. C., and van Deventer, J. S. J. (2007). In situ ATR-FTIR study of the early stages of fly ash geopolymer gel formation. Langmuir 23, 9076–9082. doi: 10.1021/la701185g
Silver, J., Morrison, I. E. G., and Rees, L. V. C. (1979). A Mössbauer spectroscopic study of frozen solutions of FeCl3 – phenols. Inorg. Nuc. Chem. Lett. 15, 433–436. doi: 10.1016/0020-1650(79)80103-8
Simon, S., Gluth, G., Peys, A., Onisei, S., and Pontikes, Y. (2018). The fate of iron during the alkali-activation of synthetic (CaO-)FeOx-SiO2 slags: an Fe K-edge XANES study. J. Am. Ceram. Soc. 101, 2107–2118. doi: 10.1111/jace.15354
Van De Sande, J., Peys, A., Hertel, T., Onisei, S., Blanpain, B., and Pontikes, Y. (2017). “Glass forming ability of slags in the FeOx-SiO2-CaO system and properties of the inorganic polymers made thereof,” in Proceedings of the 5th International Slag Valorisation Symposium (Leuven), 397–400.
Vandenberghe, R. E., and De Grave, E. (2013). “Application of Mössbauer spectroscopy in earth sciences,” in Mössbauer Spectroscopy: Tutorial Book, eds Y. Yoshida and G. Langouche (Berlin Heidelberg: Springer, 91–185.
White, C. E., Page, K., Henson, N. J., and Provis, J. L. (2013a). In situ synchrotron X-ray pair distribution function analysis of the early stages of gel formation in metakaolin-based geopolymers. Appl. Clay Sci. 73, 17–25. doi: 10.1016/j.clay.2012.09.009
White, C. E., Provis, J. L., Bloomer, B., Henson, N. J., and Page, K. (2013b). In situ X-ray pair distribution function analysis of geopolymer gel nanostructure formation kinetics. Phys. Chem. Chem. Phys. 15, 8573–8582. doi: 10.1039/C3CP44342F
White, C. E., Provis, J. L., Llobet, A., Proffen, T., and van Deventer, J. S. J. (2011). Evolution of local structure in geopolymer gels: an in situ neutron pair distribution function analysis. J. Am. Ceram. Soc. 94, 3532–3539. doi: 10.1111/j.1551-2916.2011.04515.x
White, C. E., Provis, J. L., Proffen, T., Riley, D. P., and van Deventer, J. S. J. (2010). Combining density functional theory (DFT) and pair distribution function (PDF) analysis to solve the structure of metastable materials: the case of metakaolin. Phys. Chem. Chem. Phys. 12, 3239–3245. doi: 10.1039/B922993K
Yang, K., and White, C. E. (2016). Modeling the formation of alkali aluminosilicate gels at the mesoscale using coarse-grained Monte Carlo. Langmuir 32, 11580–11590. doi: 10.1021/acs.langmuir.6b02592
Zhang, Z., Provis, J. L., Wang, H., Bullen, F., and Reid, A. (2013). Quantitative kinetic and structural analysis of geopolymers. Part 2. Thermodynamics of sodium silicate activation of metakaolin. Thermochim. Acta 565, 163–171. doi: 10.1016/j.tca.2013.01.040
Keywords: alkali activated materials, geopolymers, 57Fe Mössbauer spectroscopy, non-ferrous slag, ex-situ kinetics, FTIR spectroscopy
Citation: Peys A, Douvalis AP, Hallet V, Rahier H, Blanpain B and Pontikes Y (2019) Inorganic Polymers From CaO-FeOx-SiO2 Slag: The Start of Oxidation of Fe and the Formation of a Mixed Valence Binder. Front. Mater. 6:212. doi: 10.3389/fmats.2019.00212
Received: 22 February 2019; Accepted: 14 August 2019;
Published: 28 August 2019.
Edited by:
Andrew C. Heath, University of Bath, United KingdomReviewed by:
Hongyan Ma, Missouri University of Science and Technology, United StatesZuhua Zhang, University of Southern Queensland, Australia
Rupert Jacob Myers, University of Edinburgh, United Kingdom
Copyright © 2019 Peys, Douvalis, Hallet, Rahier, Blanpain and Pontikes. This is an open-access article distributed under the terms of the Creative Commons Attribution License (CC BY). The use, distribution or reproduction in other forums is permitted, provided the original author(s) and the copyright owner(s) are credited and that the original publication in this journal is cited, in accordance with accepted academic practice. No use, distribution or reproduction is permitted which does not comply with these terms.
*Correspondence: Arne Peys, YXJuZXBleXNAaG90bWFpbC5jb20=