 Melania Reggente1†
 Livia Angeloni1,2†
 Daniele Passeri1,3*Pascale Chevallier2Stephane Turgeon2
 Diego Mantovani2
 Marco Rossi1,3
- 1Department of Basic and Applied Sciences for Engineering, University of Rome Sapienza, Rome, Italy
- 2Laboratory for Biomaterials and Bioengineering (CRC-I), Department of Min-Met-Materials Engineering, University Hospital Research Center, Laval University, Quebec City, QC, Canada
- 3Research Center for Nanotechnology Applied to Engineering of Sapienza University of Rome (CNIS), University of Rome Sapienza, Rome, Italy
Methanol plasma has been proposed as an effective way to improve the performances of fluorocarbon (CFx) ultrathin films as stent coatings as it can successfully modulate fluorine content and wettability of the films. Nevertheless, plasma treatment may affect mechanical properties of the films, which therefore need comprehensively characterizing to verify the suitability of treated films for application as stent coating materials. In this work we investigate mechanical properties of methanol plasma treated CFx ultrathin films on stainless steel. In particular, cohesion of the films and their adhesion to the substrate is investigated using small punch test combined with atomic force microscopy (AFM) imaging. Also, elastic and viscoelastic properties are investigated at the nanometer scale using two different AFM based advanced technique for nanomechanical characterization, i.e., HarmoniX™ and contact resonance AFM (CR-AFM). Overall, methanol plasma treated CFx films have been demonstrated to be suitable for application as stent coating also on the basis of their nanomechanical properties.
1. Introduction
Mechanical characterization of thin coatings is increasingly emerging as a need in the development and optimization of biomaterials. Indeed, biomaterials for medical devices are often subjected to surface modification processes, such as functionalization and deposition of thin coatings, with the aim of improving their functionality and biocompatibility, without sacrificing the high structural properties given by the bulk materials. Besides the opportune chemical, physical and biocompatibility properties, a coating for medical devices must exhibit appropriate mechanical properties in order to maintain its integrity, cohesion and adhesion to the underlying substrate, even after significant elastic and plastic deformations to which the device can undergo. Together with cohesion and adhesion to the substrate, the stiffness of the coating, i.e., the part of the biomaterial in contact with the biological medium, is emerging as key factor, in addition to chemical composition, surface energy and roughness, in the regulation of the biological response. Indeed, the stiffness of biomaterials has been demonstrated to affect adhesion, proliferation, differentiation and migration of several kind of cells (Lo et al., 2000; Guo et al., 2006; Chowdhury et al., 2010). For instance, neurons have been shown to proliferate better on soft substrates (Flanagan et al., 2002) while fibroblasts and chondrocytes exhibited maximum spread and proliferation on stiffer substrates (Subramanian and Lin, 2005; Hopp et al., 2013). Native mesenchymal stem cells undergo different differentiation behavior when interacting with surfaces with different elastic modulus (Engler et al., 2006). Endothelial cells have been observed to exhibit tube-like structures on soft substrates and high spread and proliferation on stiffer substrates (Califano and Reinhart-King, 2008, 2010); smooth muscle cells and myoblasts have been shown to have higher projected area on stiff substrates (Engler et al., 2004a,b). Moreover, substrate stiffness has been demonstrated to affect adhesion, spreading and activation of platelets, suggesting that the mechanical properties at the surface of cardiovascular devices could also have an effect on blood contact behavior and clot formation (Qiu et al., 2014). Therefore, the capability to characterize the mechanical properties of thin coatings for medical devices is fundamental, not only from the point of view of the integrity and mechanical behavior of the device, but also for the comprehension of the effect of surface stiffness on the biological events occurring at the interface of the device. Indeed, the capability of measuring and modulating the elastic modulus at the very surface of an implant might allow improved body response and implant performance. In previous studies, fluorocarbon (CFx) thin films deposited by plasma enhanced chemical vapor deposition (PECVD) with thickness of about 35 nm have been demonstrated to be effective as coatings for cardiovascular stents, thanks to their chemical inertness, high uniformity, flexibility and adhesion to the substrate (Haïdopoulos et al., 2005). These characteristics make them resistant to corrosion (Touzin et al., 2010) and able to overcome the high deformation occurring during stent deployment (about 25%) (Lewis et al., 2008). The higher hemocompatibility of CFx coatings in respect of bare metallic surfaces has been shown (Montaño-Machado et al., 2017) and can be mainly attributed to the presence of fluorine content. Nevertheless, the hydrophobic nature of these coatings could limit protein adsorption, hemocompatibility and endothelialization (Arima and Iwata, 2007; Tang et al., 2008). Recently, a novel oxidative methanol plasma treatment has been developed and demonstrated to be effective in tuning the hydrophobicity of CFx coatings without affecting their integrity, uniformity and morphology (Montaño-Machado et al., 2019). By analyzing coatings with different wettability and oxygen and fluorine content, it has been shown that the blood contact behavior of CFx coatings can be improved by modulating surface energy and fluorine species content (Montaño-Machado et al., 2019). Nevertheless, the effect of the treatment on the mechanical properties of the modified films, which could affect the cohesion and adhesion to the substrate as well as the blood contact behavior, has not been evaluated yet. The mechanical characterization of these ultrathin coatings is challenging. The capability of the coating to maintain its integrity after a determined deformation can be tested by the method developed by Lewis et al. (2008), called small punch test, consisting in the application of a known deformation and the subsequent morphological analysis of the coating.
However, the quantitative evaluation of the elastic modulus cannot be obtained by conventional techniques, such as micro- and nanoindentation, due to the limited thickness which makes the results of the measurements strongly affected by the mechanical properties of the underlying substrate (Fischer-Cripps, 2006; Reggente et al., 2017). Moreover, micro- and nanoindentation do not allow one to visualize the distribution of these surface properties because of their poor spatial resolution. Alternatives methods, based on atomic force microscopy (AFM), can be used to obtain quantitative maps of mechanical properties, such as indentation modulus, damping, adhesion and energy dissipation (Passeri et al., 2013a) as well as viscoelastic moduli, i.e., storage and loss modulus, and loss tangent (Killgore and DelRio, 2018).
In this work, we perform an exhaustive mechanical characterization of methanol plasma treated CFx ultrathin films, with thickness in the range 30–65 nm, deposited on stainless steel in order to verify the effect of plasma treatment on the mechanical properties of the films. Cohesion of the films and their adhesion to the substrate after deformation was analyzed with small punch test method combined with AFM morphological characterization. The challenging analysis of elastic and viscoelastic response of ultrathin soft films on stiff substrates was performed with two different AFM based techniques for nanomechanical characterizations, i.e., HarmoniX™ and contact resonance AFM (CR-AFM), for the latter using two different data analysis procedures, in order to cross-validate these methods.
2. Materials and Methods
2.1. Materials
2.1.1. Pre-treatment of 316L Stainless Steel Substrates
316 L stainless steel disks of 12.7 mm diameter and 0.5 mm thickness (Goodfellow, Devon, PA, USA) are used as substrates. First, they have been cleaned in an ultrasonic bath with acetone, deionized water, and methanol for 10 min for each solvent and then dried with particle-free compressed air. Then an electropolishing and an acid dipping treatment have been performed in order to reduce the surface roughness. Electropolishing has been carried out in 100 mL of solution containing glycerol, phosphoric acid and deionized water for 3 min at 90°C. Acid dipping was performed for 30 s at 50°C in a solution consisted in nitric acid, hydrofluoric acid, and deionized water (Montaño-Machado et al., 2019).
2.1.2. Plasma-Enhanced Chemical Vapor Deposition of Fluorocarbon Coating
CFx coatings with different wettability and oxygen and fluorine content have been obtained by PECVD, following the protocols previously developed (Montaño-Machado et al., 2019). Specimens were introduced into the previously described radio frequency (RF) plasma reactor (Lewis et al., 2008) at 6 cm below the electrode for a pulsed H2 plasma etching at 100 W for 100 s (ton = 100 ms; toff = 300 ms). Etching was carried out to (i) remove the layer of organic contaminants and (ii) reduce the oxide layer on the sample surface. After the plasma etching of the substrates, a fluorocarbon coating has been deposited by pulsed afterglow plasma polymerization using C2F6 and H2 as precursors. The sample was placed at 11 cm below the electrode and the coating was realized using a peak power input of 150 W, a duty cycle of 20%, a pressure of 700 mTorr and a total gas flow rate of 20 sccm for a deposition time of 5 min. An oxidation treatment with methanol plasma was then carried out with the sample at 6 cm below the electrode, using a continuous power of 50 W and a flow of 10 sccm during 30 and 90 s. In this way, three different coatings with decreasing hydrophobicity (static contact angle of 117° for the unmodified CFx coating, 87° for the coating after 30 s methanol treatment and 68° for the coating after 90 s methanol treatment) and increasing O/F ratio (0.01 for the unmodified CFx coating, 0.44 for the coating after 30 s methanol treatment and 1.08 for the coating after 90 s methanol treatment) were obtained (Montaño-Machado et al., 2019). For the sake of clarity, from herein CFx-A refers to the sample which has not been processed with methanol plasma treatment, while CFx-B and CFx-C indicate the samples modified by 30 and 90 s methanol plasma treatment, respectively.
2.2. Instrumentation and Equipment
2.2.1. X-Ray Photoelectron Spectroscopy Analysis
Chemical composition of the coating was analyzed by X-ray photoelectron spectroscopy (XPS), using an X-ray photoelectron spectrometer (XPS-PHI 5600-ci Spectrometer-Physical Electronics, Eden Prairie, MN, USA), with a base pressure below 5 × 10⁻⁷ Pa. Survey and high resolution spectra were acquired using the Kα line of a standard aluminum (Kα = 1486.6 eV) and magnesium (Kα = 1253.6 eV) X-ray sources, respectively, operated at 300 W, without charge compensation. Three spots on three samples were analyzed for each experiment.
2.2.2. Small Punch Test
A plastic deformation of 25%, i.e., the estimated maximum deformation to which a stent undergoes during deployment (Migliavacca et al., 2005), was applied to the coated samples using a custom-made small punch test device mounted on a SATEC T20000 testing machine (Instron, Norwood, MA, USA) as previously described (Lewis et al., 2007). All deformations were performed at room temperature at a displacement rate of 0.05 mm s−1 and a maximal load of 2200 N. The state of the coating, i.e., the morphology and the eventual presence of delamination or cracks, after deformation was analyzed by AFM. A Dimension™ 3100 AFM (Veeco, Woodbury, NY, USA) was used in tapping mode with a silicon tip (OTESPA, Bruker). 20 × 20 μm images in correspondence of the topmost part of the samples, where the maximum deformation (25%) occurs, were acquired and analyzed. Three specimens for each condition (CFx-A, CFx-B and CFx-C) were tested.
2.2.3. Nanomechanical Characterizations by Atomic Force Microscopy
Mechanical characterizations of the films have been performed through both CR-AFM and HarmoniX™.
HarmoniX™ has been carried out using a standard AFM apparatus (ICON, Bruker Inc.), equipped with a standard T-shape Si cantilever (HMX10, Bruker Inc.) having kc = 4 N/m (as reported by the manufacturer) and first flexural and torsional resonance frequencies in air equal to f0,1 = 52.9 kHz and t0,1 = 949 kHz, respectively. Cantilever force sensitivity has been measured from force-deflection curves performed on Si (100) single crystal. Calibration procedure has been performed using a blend of polystyrene (PS) and low-density polyethylene (LDPE) film deposited on a Si substrate (PS/LDPE, Bruker Inc.), being MPS = 1.6 GPa and MLDPE = 100 MPa the indentation modulus of PS and LDPE, respectively, as supplied by the producer.
CR-AFM has been carried out using a standard AFM apparatus (Solver, NT-MDT, Russia). The AFM setup was equipped with a Si cantilever (CSG10, NT-MDT, Russia) with spring constant kc = 0.116 N/m, determined through the method described by Sader et al. (1999). In order to evaluate the instrumental parameters required to analyze CR-AFM data, a well-established experimental procedure was followed (Reggente et al., 2015): standard force-deflection curves have been acquired on Si (100) single crystal to calibrate the cantilever force sensitivity; tip radius Rt has been evaluated by reconstructing the tip shape through the analysis of the images collected on an array of inverted tips used as reference sample (TGZ1, NT-MDT, Russia); the exact position of the tip along the cantilever axis has been determined through scanning electron microscopy (SEM) analysis. Being the tip in contact with the sample surface, contact resonance frequencies (CRFs) were detected for each sample and CRFs values and the corresponding uncertainties have been evaluated from statistics performed on not <512 points of CR-AFM images. Calibration of CR-AFM has been performed using as the reference the PS regions of the above described PS/LDPE sample. Numerical simulation of the entire experimental session was performed using Matlab (version 7.1.0.246, 2005).
3. Techniques
3.1. HarmoniX™
HarmoniX™ is a tapping mode based AFM technique in which a T-shaped cantilever with an out-of-axis tip is used (Sahin et al., 2007; Sahin and Erina, 2008). The first flexural mode of the cantilever, characterized by the first flexural resonance frequency f0,1, is used to reconstruct sample morphology, as in standard AFM tapping mode. During tapping performed at frequency f0,1, the tip periodically (with period T0 = 1/f0,1) interacts with the sample surface. The actual tip-sample interaction force depends on the instantaneous value of tip-sample separation d, i.e., is given by the van der Waals force if d > a0, and by the sum of van der Waals and repulsive (elastic) forces if d < a0, where a0 is an intermolecular distance. More explicitly, by modeling the repulsive force using the Derjaguin-Muller-Toporov (DMT) (Derjaguin et al., 1975) and assuming that the lateral extension of the sample is much bigger than the tip size (Santos et al., 2011), the tip-sample interaction force Fts is given by
where H is the Hamaker constant, Rt is the tip radius, and E* is the reduced modulus given by being Ms and Mt the indentation modulus of the sample and of the tip, respectively (Derjaguin et al., 1975; García and San Paulo, 1999). When Ms ≪ Mt as in the case of the materials investigated in this work, . This force is measured by recording the cantilever deflection Δz which is proportional to the tip-sample force through the (normal) spring constant kc. Being periodic with period T0, the force-separation curve could be, in principle, reconstructed through inverse Fourier transform after acquiring the harmonic components (multiple of f0,1) of the deflection signal. Nevertheless, the presence of higher deflection modes of the cantilever distorts the harmonic components of the force-separation curve. A smart solution consists in using a T-shaped cantilever with an out-of-axis tip. Indeed, during tapping, the tip-sample interaction produces a torque Tts = Ftslt where lt is the distance between the tip location and the cantilever axis. This results in the torsion of the cantilever of an angle Δϕ = Tts/kϕ where kϕ is the cantilever torsional spring constant (Green et al., 2004; Pettersson et al., 2007). Thus, the cantilever torsional signal is proportional to Fts and is periodic with period T0. Therefore, the periodic Fts can be reconstructed by inverse Fourier transform of the components of the torsional signal at frequencies multiple of f0,1. Being the value of the first free torsional resonance t0,1 much higher than f0,1, this allows the analysis of harmonic components of the torsional signal in an undistorted spectral region and leads signal-to-noise ratio higher than the one relative to the deflection signal. Therefore, the cantilever torsional signal can be analyzed using inverse Fourier transform analysis in order to extract a complete loading/unloading force-distance curve during each tapping cycle. Unloading force-distance curves are analyzed in real time to evaluate Ms through the DMT model (Derjaguin et al., 1975) which is currently implemented in HarmoniX™ software, although the Johnson-Kendall-Roberts (JKR) model (Johnson et al., 1971) has been demonstrated to be more accurate in the range of materials analyzed in this work (Dokukin and Sokolov, 2012). To overcome the need for accurate calibration of the cantilever geometrical and elastic parameters, a phenomenological calibration is performed using a reference sample with well-known indentation modulus Mref.
3.2. Contact Resonance Atomic Force Microscopy
In contact resonance AFM (CR-AFM) the tip is in contact with the sample surface and the system constituted by the cantilever, the tip, and a volume of the sample under the tip is set into oscillation using an ultrasonic transducer coupled to the sample (Rabe and Arnold, 1994) or to the cantilever (Yamanaka et al., 2008), or by the direct photothermal excitation of the cantilever (Wagner and Killgore, 2015). In these conditions, the resonance frequencies of the cantilever, namely the contact resonance frequencies (CRFs) fn, can be detected. When the investigated material is considered elastic, the system can be described as sketched in Figure 1A. In this model: the cantilever is considered inclined by an angle α with respect to the sample surface; the tip is located at distance L1 from the cantilever clamped end, so that the parameter r = L1/L can be defined being L the cantilever length; the height of the tip is ht; the tip interacts with the sample surface via both normal and lateral forces, and the contact is thus described by the normal and lateral contact stiffness, modeled through the linear springs k* and , respectively. The values of the CRFs are determined by k* and , which depends on the elastic parameters of the sample, i.e., on the indentation and shear moduli of the sample (Ms and Gs, respectively). Therefore, the measured values of fn can be used to evaluate the elastic properties of the sample. Nevertheless, due the complexity of the model in Figure 1A, the analysis of CRFs data are generally carried out considering the simplified model depicted in Figure 1B, in which the cantilever inclination, the tip height, and the lateral tip-sample coupling are neglected. In the standard procedure, the values of two different CRFs (say fn and fm with n ≠ m) are measured and used to determine r and k* by numerically solving (Kester et al., 2000). The value of k* is related to that of Ms through the relation
where ac is the tip-sample contact radius and assuming Ms ≪ Mt and, thus, . Using the Hertzian model to describe the tip-sample contact, Equation (2) can be rewritten as
where FN is the static normal load applied by the tip on the sample as a result of the selected deflection set point. To evaluate Ms from k*, the knowledge of the Rt is required. As Rt may change during a measurement session due to abrasion, especially when relatively stiff materials are investigated (Amelio et al., 2001), and thus the use of predetermined values of Rt in Equation (3) may result in a not accurate estimation of Ms. The uncertainty in the value of Rt is one of the major factors affecting the accuracy of CR-AFM measurements. Therefore the actual tip radius (and also the tip shape) should be determined during each experimental session by calibrating the tip radius using one sample with well-known indentation modulus as reference material (Yamanaka et al., 2000; Kopycinska-Müller et al., 2006; Marinello et al., 2010, 2011). Really, to avoid the explicit calculation of Rt, after the contact stiffness is determined on the reference material with reduced modulus , the reduced modulus of the investigated sample is calculated from the measured contact stiffness as
if measurements on the investigated sample and on the reference material are performed at the same value of FN (Rabe et al., 1996; Hurley et al., 2005; Passeri et al., 2005). For the sake of clarity, this procedure—which is admittedly the most widespread one—will be referred to as “single reference” approach in the rest of the paper. In more accurate calibration procedures not only Rt but also the indentation modulus of the tip Mt can be calibrated using two (or more) reference materials (Stan and Price, 2006). In particular, using two reference materials, Ms and Mt
and
where and are the contact stiffness measured on the first and second reference sample, respectively, and Mref1 and Mref2 are the indentation moduli of the two reference materials (Stan and Price, 2006). In particular, despite in a relatively limited range of elastic moduli, the use of multiple reference materials allows one to neglect lateral forces, thus using the model in Figure 1B instead of that in Figure 1A although apparent values of Rt and Mt (different from the real ones) are determined (Passeri et al., 2013b).
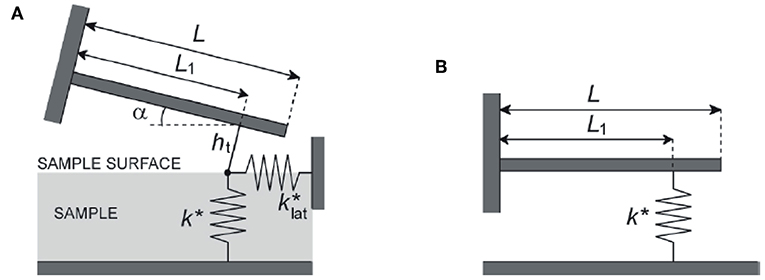
Figure 1. (A) Beam model of the cantilever with length L, inclined of an angle α respect to the sample surface; the tip is located at distance L1 from the cantilever clamped end, its height being ht; the tip interacts with the sample surface via both normal and lateral forces, and the contact is thus described by the normal and lateral contact stiffness modeled through the linear springs k* and , respectively. (B) Simplified beam model of the cantilever, supposed parallel to the sample surface; the tip, the height of which is neglected, interacts with the sample only through normal forces modeled by the contact stiffness k*. Reprinted and adapted from Passeri et al. (2013b).
In this work, results of CR-AFM data analysis through the “single reference” approach were compared to those obtained using an original method, which we refer to as the “apparent stiffness” method. In the “apparent stiffness” method, the output of numerical simulations of CR-AFM experiments performed using the model in Figure 1A is analyzed using the simplified model reported in Figure 1B in order to obtain calibration curves in which the apparent value of k* is related to that of Ms. Therefore, these calibration curves are used to evaluate Ms from the values of k* determined in the first steps of the “single reference” procedure.
Finally, not only can CR-AFM be used to study elastic but also viscoelastic materials (Killgore and DelRio, 2018). In order to account for the viscoelastic behavior of samples, a dashpot of dumping σ is included in parallel to k* in the model in Figure 1B (Yuya et al., 2008). The tip-sample contact is described by the normalized tip-sample contact stiffness α and the normalized damping coefficient β. These parameters can be evaluated measuring the frequency fn of a given contact mode of the cantilever and the corresponding quality factor Qn (Yuya et al., 2011). Finally, the values of α and β can be used to evaluate the storage and the loss modulus of the sample ( and , respectively) and the loss tangent defined as . In particular, a “single reference” approach can be followed, using a material with well-known storage and loss modulus ( and , respectively). In this case, considering the tip much stiffer than the sample, and can be calculated as and , where fn, ref, αref, and βref are measured and calculated on the reference sample (Killgore et al., 2011). Conversely, tanδ can be evaluated without the need for calibration using a reference material through the relation
where knL = 7.855 if the third mode of the cantilever is analyzed (n = 3) (Hurley et al., 2013), which we used in this work as it was demonstrated to be more sensitive than, e.g., the first one (Killgore and Hurley, 2012). In this work, we evaluated using the “single reference” approach assuming the PS as the reference material, tanδ was evaluated using Equation (7), and finally was calculated as .
4. Results
4.1. Chemical Analysis
Survey XPS spectra of CFx coatings before and after 30 and 90 s methanol plasma treatments are reported in Figure 2 and show that methanol plasma treatment produced an increase of the oxygen amount of the coating (from 0% in CFx-A to 12% in both CFx-B and CFx-C); the increase of the time of methanol plasma treatment produced the increase of carbon amount (from 32.75 in CFx-A to 61.8% in CFx-B and 77.75 in CFx-C) and the corresponding decrease of fluorine content (from 66.9 in CFx-A to 26.5% and 10.7% in CFx-B and CFx-C, respectively). No metal species were detected, demonstrating that the coating was not damaged by methanol plasma treatment.
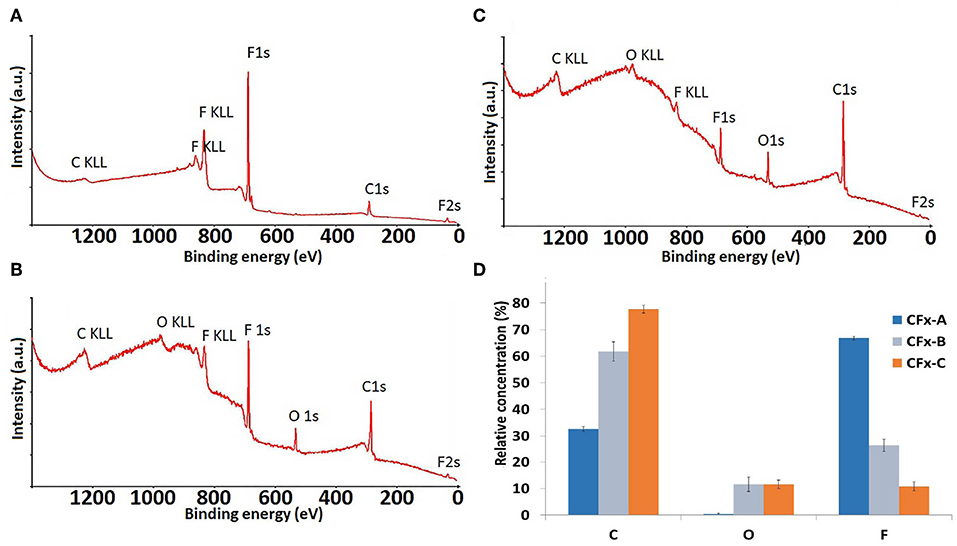
Figure 2. XPS survey spectra of the untreated CFx film (A) and CFx films treated with 30 s (B) and 90 s (C) methanol plasma treatment and histogram of the relative concentration of C, O, and F (D).
Figure 3 shows high resolution XPS spectra for C(1s) of the unmodified CFx coating (a) and CFx coatings after 30 and 90 s methanol plasma treatments. The C(1s) spectra of the CFx films are fitted with five spectral components, as assigned to C–H/C–C– (BE = 285 eV), C–CF/C–O (BE = 287), CF/C = O (BE = 289.5 eV), –CF2 (BE = 292), and CF3 (BE = 294 eV) groups, according to literature (Horie, 1995; Mackie et al., 1997; Bourgoin et al., 1999; Boehm, 2002). As a percentage of oxygen lower than 1% was detected at the surface of the untreated CFx coating, no attribution due to C–O (286.9) or C = O (288.1) is proposed, while for methanol treated samples, peaks at BE = 287 and 289.5 can be attributed to oxygen containing groups. Figure 3A shows the typical C(1s) spectrum of CFx coating without any methanol plasma treatment, which consists mainly of C–CF groups, CF2 and CF3 groups that are characteristic of fluorocarbon plasma-polymer films. High resolution spectra of CFx coating after 30 and 90 s methanol plasma treatments (Figures 3B,C) show the increasing hindrance of the CF2 and CF3 bands—characteristic of CFx coatings—with the increase of the time of oxidative treatment, from 55 to 15% and <2%, respectively, and the corresponding increase of C–C and C–O containing species. This demonstrates that methanol plasma treatments allows the deposition of oxygen species not containing fluoride on the surface of fluorocarbon coating, without damaging it. The increase of the time of methanol plasma treatment produces the increasing covering of the fluorocarbon coating by oxygen species, which is also consistent with the previously reported time-of-flight secondary ion mass spectrometry (ToF-SIMS) analysis and the previously observed increased thickness of the coating (from 30 nm for untreated CFx coating to 41 nm for 30 s and 64 nm for 90 s methanol treated samples) (Montaño-Machado et al., 2019).
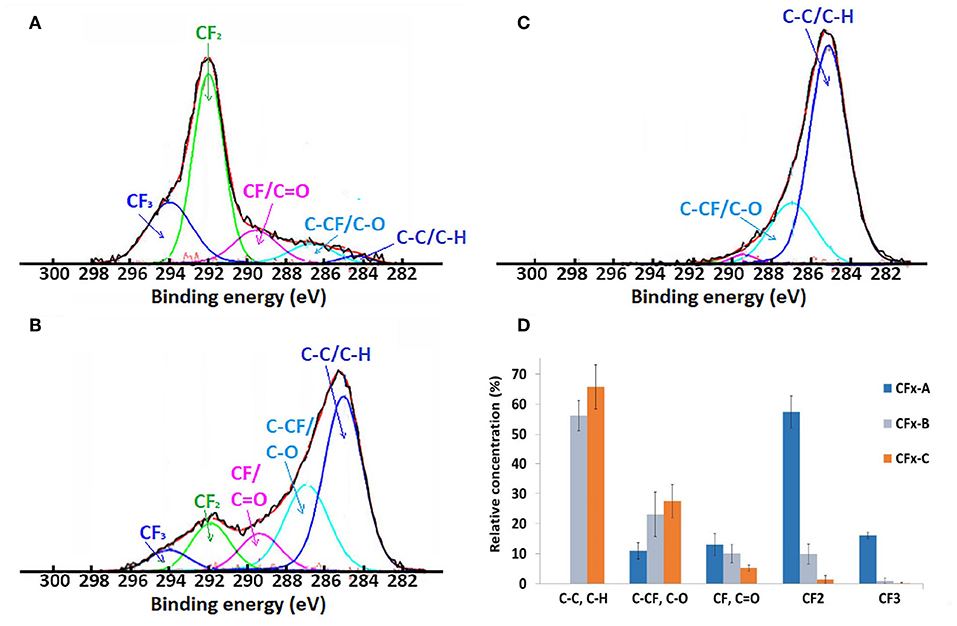
Figure 3. XPS high resolution C (1s) spectra of CFx film (A) and CFx films treated with 30 s (B) and 90 s (C) methanol plasma treatment and histogram of the relative concentration of the characteristic bands (D).
4.2. Cohesion and Adhesion After Deformation (Small Punch Test)
In Figure 4 typical AFM topographies of the areas corresponding to the topmost part of the deformed samples are reported. AFM analysis of all the deformed samples (unmodified CFx and CFx after methanol treatment of 30 and 90 s) shows the occurrence of slip bends due to the plastic deformation of the underlying stainless steel substrate, but does not show any cracks, delamination or failure. This demonstrates that the methanol treatment did not significantly affect cohesion and adhesion properties of the CFx films, which resulted in having sufficient interfacial adhesion and cohesion to be employed as stent coatings.
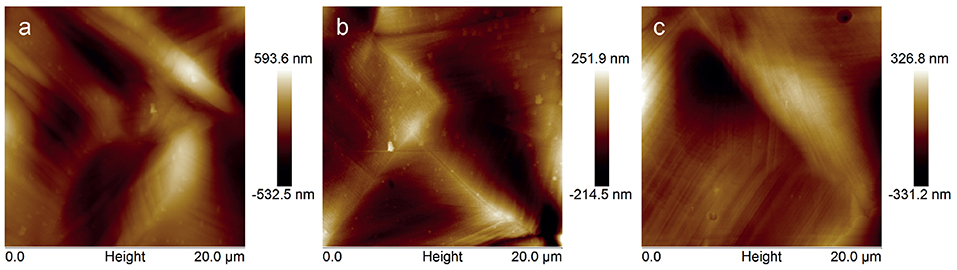
Figure 4. AFM topography images of the topmost part of CFx-A (a), CFx-B (b), and CFx-C (c) samples after application of 25% deformation.
4.3. Nanomechanical Characterizations
4.3.1. Elastic Modulus
A typical result of the characterization of CFx samples using HarmoniX™ is shown in Figure 5, where topography (Figure 5A), phase image (Figure 5B), map of the (not calibrated) indentation modulus (Figure 5C), and map of the (not calibrated) tip-sample adhesion force (Figure 5D) obtained on the sample CFx−C are shown. Morphological reconstruction shows the presence of ripples on the surface, indicating that the film reproduces the features typical of the stainless-steel substrate. These features are observed also in phase, indentation modulus, and adhesion maps, and can be ascribed to the modulation of the local value of the tip-sample contact area (Stan and Cook, 2008) and to the variation of the local inclination of the surface with respect to the tip axis (Passeri et al., 2013b). Calibration of the indentation modulus maps was performed on the PS/LDPE reference sample (Passeri et al., 2013a). More specifically, the PS regions were used for calibration purposes, while LDPE regions were used to check the calibration range by comparing the obtained value to the one indicated by the vendor (100 MPa). In Figure 6, the histograms of the indentation modulus of the investigated CFx samples and those of the reference sample are reported. The obtained value of the indentation modulus of the LPDE is compatible with that expected but lower (51 ± 1 MPa), indicating a not perfect calibration in low modulus range. Nevertheless, the moduli of CFx samples are comparable to those of PS, and thus the calibration can be considered accurate enough in the range of interest. Indentation modulus values with the corresponding uncertainty were obtained by Gaussian fitting of data in Figure 6 and are reported in Table 1.
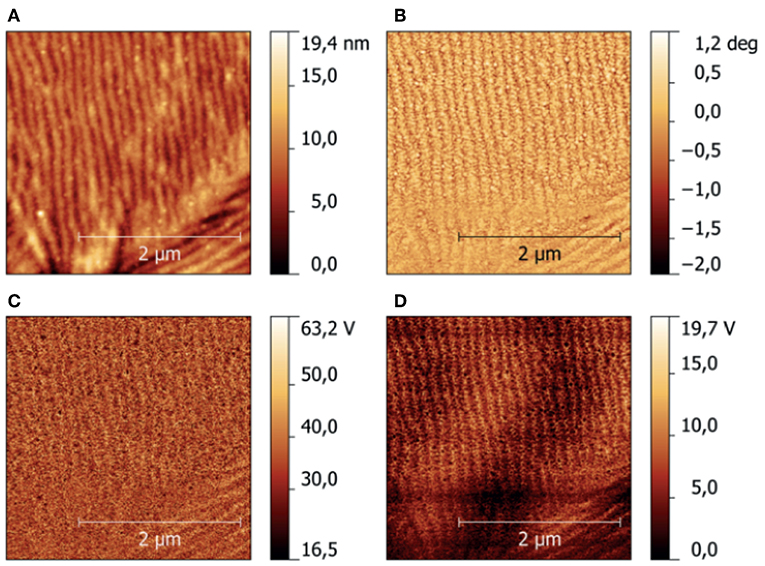
Figure 5. Example of nanomechanical mapping of the CFx−C sample using HarmoniX™: (A) height, (B) phase, (C) not calibrated indentation modulus, (D) not calibrated adhesion force.
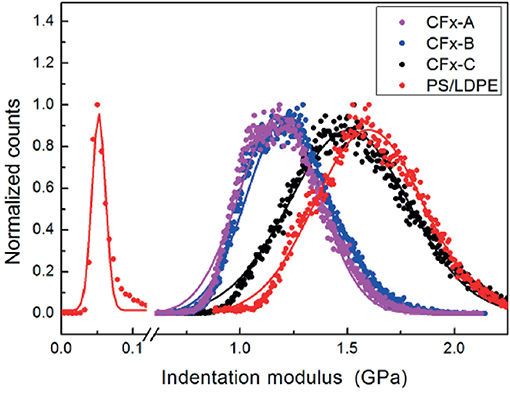
Figure 6. Distribution of the values of indentation modulus of the three CFx samples and of the PS/LDPE reference, measured using HarmoniX™.

Table 1. Result of the nanomechanical characterizations using HarmoniX™ and CR-AFM: indentation modulus obtained with HarmoniX™ (Ms); first and third flexural CRFs (f1 and f3, respectively); calculated contact stiffness k*; indentation modulus calculated using the “single reference” method and the “apparent stiffness” method ( and , respectively).
CR-AFM was first used to evaluate mechanical properties of the CFx thin films in elastic approximation. After characterization of the free cantilever resonance in air, the tip was brought in contact with the sample which was made oscillate by the piezoelectric transducer coupled with its back side. Values of f1 and f3 were obtained from statistics on the corresponding CRFs maps acquired simultaneously to the topographical images. For calibration purposes, CRFs maps on the reference sample were acquired before and after each measurement session. To limit the effect of tip wear, CFx samples were purposely analyzed following the decreasing order of their expected stiffness, i.e., starting from the sample expected to be the stiffer one. Table 1 reports the values of f1 and f3 measured on the CFx samples and the corresponding value of k* calculated using the model in Figure 1B. The corresponding values of indentation modulus calculated through the “single reference” approach () are then reported. The measured values of CRFs confirm that the mechanical properties of the CFx samples are close to those of the reference PS film (f1 = 121−123 kHz and f3 = 704−715 kHz), encouraging the use of the “single reference” approach. Conversely, CRFs measured on LDPE seemed too low to use LDPE as a second reference sample (f1 = 111−112 kHz and f3 = 660−685 kHz). To verify the accuracy of the method, experimental data were analyzed through a numerical simulation (the “apparent stiffness” method). CR-AFM experiment was first simulated using the model in Figure 1A to obtain as output the pairs of CRFs f1 and f3 with a code which received as input the mechanical properties of the cantilever and the tip, their geometrical parameters, and the mechanical properties of the sample (Passeri et al., 2013b). The characteristic parameters of the system were optimized in order to simultaneously match f1 and f3 experimentally obtained in contact with the PS film. Pair of f1 and f3 were than calculated as a function of Ms by varying Ms in the range 0.5−1.7 GPa, obtaining the curves reported in Figure 7A, where the values of CRFs corresponding to the PS reference sample are indicated (symbols). Then, assuming the model in Figure 1B, for each Ms the values of f1 and f3 were used to calculate k*, which represents the “apparent” value of the tip-sample contact stiffness. Values of the apparent contact stiffness as a function of Ms are shown in Figure 7B (red solid line). For comparison, the values of real contact stiffness calculated as (black solid line), where FN is the static normal load applied by the cantilever during the contact and Ms is used instead of the reduced modulus as Ms ≪ Mt. As expected, the apparent value of k* is bigger than the real one as a result of neglecting lateral forces (Passeri et al., 2013b). Finally, the values of k* were calculated for the CFx samples using the model in Figure 1B and the curve of the apparent stiffness was used to determine the corresponding values of Ms (symbols in Figure 7B). The procedure was repeated using the CRFs measured on the PS reference before and after the analysis of the CFx samples and the corresponding values of indentation modulus calculated using the “apparent stiffness” method () are reported in Table 1.
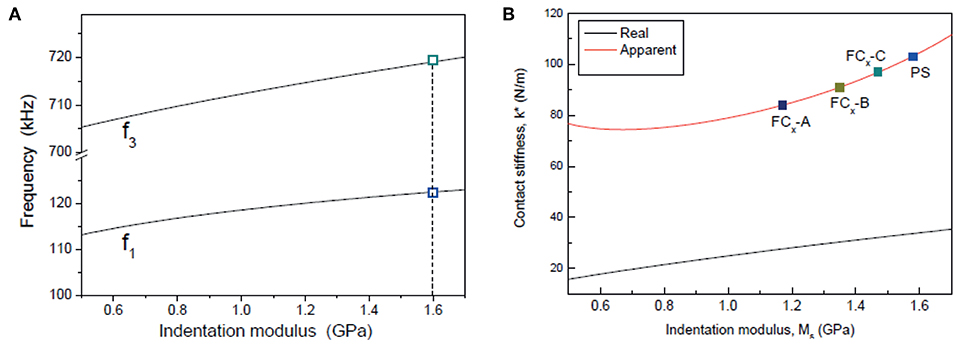
Figure 7. (A) Values of the CRFs f1 and f3 calculated as a function of the sample indentation modulus Ms using the model depicted in Figure 1A (solid lines) and values of f1 and f3 measured on the PS reference material (symbols). (B) Real and apparent contact stiffness (black and red solid line, respectively) as a function of the sample indentation modulus, and values corresponding to the CFx and PS samples (symbols).
4.3.2. Viscoelastic Modulus
To characterize the viscoelastic response of the CFx films using CR-AFM, maps of the quality factor of the third mode (Q3) have been acquired in addition to those of f3 which are reported in Table 2. First, by approximating the samples as elastic, f1 and f3 were used as described in section 4.3.1 to determine the value of r, which was eventually used to calculate α and β using a in-house written Matlab code (Passeri et al., 2013c) which are reported in Table 2 together with the values of tanδ calculated using Equation (7). The values of β were used to calculate E′ through the “single reference” approach after determining β on the PS reference sample and the values of E″ were determined as E′ × tanδ. E′ and E″ calculated for the CFx samples are reported in Table 2.

Table 2. Measured values of the contact resonance frequency and quality factor of the third mode of the cantilever (f3 and Q3, respectively), calculated values of the normalized contact stiffness (α) and the normalized damping (β) and calculated values of the loss tangent tan δ, storage modulus (E′) and loss modulus (E″).
5. Discussion
CFx materials are attractive for the use as stent coatings, in particular after oxidative methanol plasma treatment which has been demonstrated to modulate the hydrophobicity of their surface in order to improve their performances, e.g., as far as blood contact behavior is regarded, without altering integrity, uniformity, and morphology (Montaño-Machado et al., 2019). Mechanical properties of CFx coatings can undergo significant changes when changes in the chemical composition and in the thickness occur. Indeed, it has been shown that fluorocarbon coatings thicker than 100 nm do not exhibit the required cohesion and adhesion properties to resist during stent expansion (Lewis et al., 2008). Furthermore, the elastic modulus of CFx coatings has been demonstrated to be strongly dependent on fluorine and crosslinking C–C units content (Tang et al., 2005). We showed that our methanol plasma treatment produces a significant increase of coating thickness and the decrease of fluorine content at the surface, which could significantly affect adhesion, cohesion and elastic modulus of the coatings. A comprehensive mechanical characterization was therefore necessary in order to evaluate the effect of methanol plasma treatment on the mechanical properties of the modified coatings.
Small punch tests have demonstrated that the innovative methanol plasma treatment does not undermine interfacial adhesion and cohesion to be employed as stent coatings as no delamination or cracks were observed even at plastic deformations as high as 25%, corresponding to the estimated maximum deformation which a stent may undergo during deployment (Migliavacca et al., 2005).
The effect of plasma treatment on mechanical properties of CFx films is another key issue that must be assessed to evaluate the suitability of CFx thin films as stent coatings. Indeed, depending on the polymerization and the post-deposition treatments, elastic modulus of CFx film is reported to vary from hundreds of megapascals like that of polytetrafluoroethylene (PTFE) (Ianev and Schwesinger, 2001), to a few gigapascals (Sirghi et al., 2009) and up to tens of gigapascals (Tang et al., 2005; Li et al., 2008; Koumoulos et al., 2012). Results reported in the present work show a good agreement between HarmoniX™ and CR-AFM. In particular, no discrepancies were observed between the two different methods for CR-AFM data analysis, i.e., the “single reference” approach and the simulation of the actual CRFs using the more comprehensive model depicted in Figure 1A and calculating the “apparent stiffness” using the simpler model in Figure 1B. The agreement between the two different approaches can be rationalized observing that all the investigated materials (CFx and PS) correspond to a region of the curve in Figure 7B in which k* is proportional to Ms, i.e., being c = 66 nm. It must be observed that if softer materials were included among the investigated samples, the use of the single reference method using PS would imply an overestimation of their indentation modulus. Notably, considering the relatively large thickness of the coatings (i.e., in the range 30−60 nm), the similar nanometer tip-sample contact radius values typical of CR-AFM and HarmoniX™ make the results of both the techniques representative of the sole CFx thin films indentation modulus, without the effect of the stainless steel substrate (Reggente et al., 2017). This undoubtedly represents an advantage of these (and similar) techniques over AFM-based nanoindentation, which more extensively suffers from substrate effect in case of thin compliant films on stiff substrates (Kovalev et al., 2004; Shulha et al., 2004; Clifford and Seah, 2006; Passeri et al., 2011). Nevertheless, in case of thinner films are investigated and/or tip with larger Rt are used, substrate effects may affect also CR-AFM and HarmoniX™ measurements and must be subtracted to obtain the elastic modulus of the sole film (Passeri et al., 2008, 2015). The obtained indentation modulus values, in the range 1.0−1.6 GPa, are compatible with those obtained on analogous materials using AFM based nanoindentation or conventional nanoindentation. Indeed, Sirghi et al. (2009) measured by AFM nanoindentation the elastic modulus of CFx films deposited by PECVD using C2F8 as precursor and found values between 1.75 GPa and 3.2 GPa depending on the deposition parameters (power of the RF discharge and dc bias potential). Tang et al. (2005) studied, by nanoindentation, the hardness and the elastic modulus of fluorocarbon coatings deposited by RF magnetron sputtering using a PTFE target using different process parameters (RF power, Ar and H2 flux) and found a dependence of the studied properties with the fluorine and carbon content and, more specifically, on the content of CFx or C–C crosslinking units. The measured elastic modulus decreased with the increase of fluorine content (i.e., CFx units) and the decrease of carbon (i.e., crosslinking units) content from 18 GPa (for films having 33% fluorine and 67% carbon content) to 12 GPa (for films having 43% fluorine and 57% carbon content) (Tang et al., 2005). Considering the significantly higher fluorine content of our untreated CFx coating (66.9%), the value of the elastic modulus we measured by HarmoniX™ (1.18 GPa) and CR-AFM (1.26 GPa) appears to be coherent with the results of Tang et al. (2005). As shown in Table 1, indentation modulus of CFx films has been found dependent on the methanol plasma treatment. Indeed, a slight increase of the elastic modulus of the coating with the increase of the time of methanol plasma treatment was observed. An increase of about 30% is observed between the as prepared sample and that treated with methanol plasma for 90 s, which is coherent with the covering of the fluorocarbon coating by a thin layer of carbon and oxygen species not containing fluoride.
As expected, an analogous dependence with plasma exposure time is observed in the measured viscoelastic parameters, i.e., in E′, E″, and tanδ. In particular, although the comparison with PTFE properties is not always straightforward, we observe that the values of E′ obtained on both untreated and plasma treated CFx films are coherent with those reported for PTFE (Faughnan et al., 1998; Fu and Chung, 2001; Blumm et al., 2010). Conversely, the values of tanδ ad thus of E″ are definitely lower than those observed on PTFE, indicating that the mechanical behavior of the films is characterized by a very low viscous component. However, it should be observed that viscoelastic parameters generally depend on the frequency at which the mechanical response of the material is investigated, e.g., the viscous component may either increase or decrease with the frequency and depends on the specific polymer (Le Rouzic et al., 2009). Results by standard dynamical mechanical analysis (DMA) usually reported in literature are generally obtained for low frequency values, e.g., not exceeding 100 Hz, while CR-AFM investigates the sample at much higher frequencies, e.g., from tens to hundreds kilohertz or even a few megahertz (Hurley et al., 2013). In any case, plasma treatment is observed to be responsible for the reduction of the viscous component of the mechanical response of the films with respect to the untreated sample.
6. Conclusion
In conclusion, mechanical characterization of methanol plasma treated CFx ultrathin films on stainless steel demonstrated that methanol plasma treatment does not affect cohesion of the films and their adhesion to the substrate after deformation. Also, nanoscale analysis of elastic and viscoelastic response of films indicated that although these are slightly affected by methanol plasma, which is responsible for the stiffening and reduction of viscosity of the films. Nevertheless, such an effect is admittedly marginal and, especially from the point of view of the biological response, methanol plasma treatment does not significantly modify mechanical properties of the films. Thus, methanol plasma is a promising route to treat CFx ultrathin stent coating, which allows the modulation of the wettability (and fluorine content) of CFx coatings, without affecting their integrity, morphology, adhesion, and cohesion of the coatings, as well as their elastic and viscoelastic properties.
Data Availability Statement
The datasets generated for this study are available on request to the corresponding author.
Author Contributions
LA realized the CFx thin films and carried out chemical and ancillary characterizations, small punch test, and AFM morphological analysis under the supervision of PC, ST, and DM. MRe performed the AFM based mechanical nanocharacterizations with the supervision of DP. MRe and DP analyzed the results of mechanical tests, with the supervision of MRo. MRe, LA, and DP wrote the first draft of the manuscript which was then revised by all the authors.
Conflict of Interest
The authors declare that the research was conducted in the absence of any commercial or financial relationships that could be construed as a potential conflict of interest.
Acknowledgments
Dr. Francesco Mura is cordially acknowledged for his help with the characterizations of AFM cantilevers using scanning electron microscopy (SEM) platform at Research Center for Nanotechnology Applied to Engineering of Sapienza University of Rome (CNIS).
References
Amelio, S., Goldade, A. V., Rabe, U., Scherer, V., Bhushan, B., and Arnold, W. (2001). Measurement of elastic properties of ultra-thin diamond-like carbon coatings using atomic force acoustic microscopy. Thin Solid Films 392, 75–84. doi: 10.1016/S0040-6090(01)00903-8
Arima, Y., and Iwata, H. (2007). Effect of wettability and surface functional groups on protein adsorption and cell adhesion using well-defined mixed self-assembled monolayers. Biomaterials 28, 3074–3082. doi: 10.1016/j.biomaterials.2007.03.013
Blumm, J., Lindemann, A., Meyer, M., and Strasser, C. (2010). Characterization of PTFE using advanced thermal analysis techniques. Int. J. Thermophys. 31, 1919–1927. doi: 10.1007/s10765-008-0512-z
Boehm, H. P. (2002). Surface oxides on carbon and their analysis: a critical assessment. Carbon 40, 145–149. doi: 10.1016/S0008-6223(01)00165-8
Bourgoin, D., Turgeon, S., and Ross, G. G. (1999). Characterization of hydrogenated amorphous carbon films produced by plasma-enhanced chemical vapour deposition with various chemical hybridizations. Thin Solid Films 357, 246–253. doi: 10.1016/S0040-6090(99)00536-2
Califano, J. P., and Reinhart-King, C. A. (2008). A balance of substrate mechanics and matrix chemistry regulates endothelial cell network assembly. Cell. Mol. Bioeng. 1:122. doi: 10.1007/s12195-008-0022-x
Califano, J. P., and Reinhart-King, C. A. (2010). Substrate stiffness and cell area predict cellular traction stresses in single cells and cells in contact. Cell. Mol. Bioeng. 3, 68–75. doi: 10.1007/s12195-010-0102-6
Chowdhury, F., Na, S., Li, D., Poh, Y. C., Tanaka, T. S., Wang, F., et al. (2010). Material properties of the cell dictate stress-induced spreading and differentiation in embryonic stem cells. Nat. Mater. 9, 82–88. doi: 10.1038/nmat2563
Clifford, C. A., and Seah, M. P. (2006). Modelling of nanomechanical nanoindentation measurements using an AFM or nanoindenter for compliant layers on stiffer substrates. Nanotechnology 17, 5283–5292. doi: 10.1088/0957-4484/23/16/165704
Derjaguin, B. V., Muller, V. M., and Toporov, Y. P. (1975). Effect of contact deformation on the adhesion of particles. J. Colloid Interf. Sci. 53, 314–326. doi: 10.1016/0021-9797(75)90018-1
Dokukin, M. E., and Sokolov, I. (2012). Quantitative mapping of the elastic modulus of soft materials with HarmoniX and PeakForce QNM AFM modes. Langmuir 28, 16060–16071. doi: 10.1021/la302706b
Engler, A., Bacakova, L., Newman, C., Hategan, A., Griffin, M., and Discher, D. (2004a). Substrate compliance versus ligand density in cell on gel responses. Biophys. J. 86, 617–628. doi: 10.1016/S0006-3495(04)74140-5
Engler, A. J., Griffin, M. A., Sen, S., Bönnemann, C. G., Sweeney, H. L., and Discher, D. E. (2004b). Myotubes differentiate optimally on substrates with tissue-like stiffness. J. Cell Biol. 166, 877–887. doi: 10.1083/jcb.200405004
Engler, A. J., Sen, S., Sweeney, H. L., and Discher, D. E. (2006). Matrix elasticity directs stem cell lineage specification. Cell 126, 677–689. doi: 10.1016/j.cell.2006.06.044
Faughnan, P., Bryan, C., Gan, Y., and Aglan, H. (1998). Correlation between the dynamic mechanical properties and the fatigue behavior of filled and unfilled PTFE materials. J. Mater. Sci. Lett. 17, 1743–1746. doi: 10.1023/A:1006695723138
Fischer-Cripps, A. C. (2006). Critical review of analysis and interpretation of nanoindentation test data. Surf. Coat. Tech. 200, 4153–4165. doi: 10.1016/j.surfcoat.2005.03.018
Flanagan, L. A., Ju, Y. E., Marg, B., Osterfield, M., and Janmey, P. A. (2002). Material properties of the cell dictate stress-induced spreading and differentiation in embryonic stem cells. Neuroreport 13, 2411–2415. doi: 10.1097/01.wnr.0000048003.96487.97
Fu, W., and Chung, D. D. L. (2001). Vibration reduction ability of polymers, particularly polymethylmethacrylate and polytetrafluoroethylene. Polym. Polym. Compos. 9, 423–426. doi: 10.1177/096739110100900607
García, R., and San Paulo, A. (1999). Attractive and repulsive tip-sample interaction regimes in tapping-mode atomic force microscopy. Phys. Rev. B 60, 4961–4967. doi: 10.1103/PhysRevB.60.4961
Green, C. P., Lioe, H., Cleveland, J. P., Proksch, R., Mulvaney, P., and Sader, J. E. (2004). Normal and torsional spring constants of atomic force microscope cantilevers. Rev. Sci. Instrum. 75, 1988–1996. doi: 10.1063/1.1753100
Guo, W. H., Frey, M. T., Burnham, N. A., and Wang, Y. L. (2006). Substrate rigidity regulates the formation and maintenance of tissues. Biophys. J. 90, 2213–2220. doi: 10.1529/biophysj.105.070144
Haïdopoulos, M., Turgeon, S., Laroche, G., and Mantovani, D. (2005). Chemical and morphological characterization of ultra-thin fluorocarbon plasma-polymer deposition on 316 stainless steel substrates: a first step toward the improvement of the long-term safety of coated-stents. Plasma Process. Polym. 2, 424–440. doi: 10.1002/ppap.200400066
Hopp, I., Michelmore, A., Smith, L. E., Robinson, D. E., Bachhuka, A., Mierczynska, A., et al. (2013). The influence of substrate stiffness gradients on primary human dermal fibroblasts. Biomaterials 34, 5070–5077. doi: 10.1016/j.biomaterials.2013.03.075
Horie, M. (1995). Plasma-structure dependence of the growth mechanism of plasma-polymerized fluorocarbon films with residual radicals. J. Vac. Sci. Technol. A 13, 2490–2497. doi: 10.1116/1.579493
Hurley, D. C., Campbell, S. E., Killgore, J. P., Cox, L. M., and Ding, Y. (2013). Measurement of viscoelastic loss tangent with contact resonance modes of atomic force microscopy. Macromolecules 46, 9396–9402. doi: 10.1021/ma401988h
Hurley, D. C., Kopycinska-Müller, M., Kos, A. B., and Geiss, R. H. (2005). Nanoscale elastic-property measurements and mapping using atomic force acoustic microscopy methods. Meas. Sci. Technol. 16, 2167–2172. doi: 10.1088/0957-0233/16/11/006
Ianev, V., and Schwesinger, N. (2001). “Improving the adhesion of plasma polymerized thin fluorocarbon films on silicon using (CHF3 + SF6) radio-frequency discharge pretreatments,” in Adhesion Aspects of Thin Films, Vol. 1, ed K. L. Mittal (Leiden: VSP International Science), 261–270.
Johnson, K. L., Kendall, K., and Roberts, A. D. (1971). Surface energy and the contact of elastic solids. Proc. R. Soc. A 324, 301–313. doi: 10.1098/rspa.1971.0141
Kester, E., Rabe, U., Presmanes, L., Tailhades, P., and Arnold, W. (2000). Measurement of Young's modulus of nanocrystalline ferrites with spinel structures by atomic force acoustic microscopy. J. Phys. Chem. Solids 61, 1275–1284. doi: 10.1016/S0022-3697(99)00412-6
Killgore, J. P., and DelRio, F. W. (2018). Contact resonance force microscopy for viscoelastic property measurements: from fundamentals to state-of-the-art applications. Macromolecules 51, 6977–6996. doi: 10.1021/acs.macromol.8b01178
Killgore, J. P., and Hurley, D. C. (2012). Low-force AFM nanomechanics with higher-eigenmode contact resonance spectroscopy. Nanotechnology 23:055702. doi: 10.1088/0957-4484/23/5/055702
Killgore, J. P., Yablon, D. G., Tsou, A. H., Gannepalli, A., Yuya, P. A., Turner, J. A., et al. (2011). Viscoelastic property mapping with contact resonance force microscopy. Langmuir 27, 13983–13987. doi: 10.1021/la203434w
Kopycinska-Müller, M., Geiss, R. H., and Hurley, D. C. (2006). Contact mechanics and tip shape in AFM-based nanomechanical measurements. Ultramicroscopy 106, 466–474. doi: 10.1016/j.ultramic.2005.12.006
Koumoulos, E. P., Charitidis, C. A., Papageorgiou, D. P., Papathanasiou, A. G., and Boudouvis, A. G. (2012). Nanomechanical and nanotribological properties of hydrophobic fluorocarbon dielectric coating on tetraethoxysilane for electrowetting applications. Surf. Coat. Tech. 206, 3823–3831. doi: 10.1016/j.surfcoat.2012.01.034
Kovalev, A., Shulha, H., Lemieux, M., Myshkin, N., and Tsukruk, V. V. (2004). Nanomechanical probing of layered nanoscale polymer films with atomic force microscopy. J. Mater. Res. 19, 716–728. doi: 10.1557/jmr.2004.19.3.716
Le Rouzic, J., Delobelle, P., Vairac, P., and Cretin, B. (2009). Comparison of three different scales techniques for the dynamic mechanical characterization of two polymers (PDMS and SU8). Eur. Phys. J. Appl. Phys. 48:11201. doi: 10.1051/epjap/2009124
Lewis, F., Horny, P., Hale, P., Turgeon, S., Tatoulian, M., and Mantovani, D. (2008). Study of the adhesion of thin plasma fluorocarbon coatings resisting plastic deformation for stent applications. J. Phys. D Appl. Phys. 41:045310. doi: 10.1088/0022-3727/41/4/045310
Lewis, F., Maheux-Lacroix, B., Turgeon, S., and Mantovani, D. (2007). “Adhesion assessment of ultra-thin plasma polymerized coatings on stainless steel stents using the small punch test,” in Adhesion Aspects of Thin Films, Vol. 3, ed M. L. Mittal (Leiden: VSP International Science), 71–83.
Li, L., Zi, F., and Zheng, Y. (2008). The characterization of fluorocarbon films on NiTi alloy by magnetron sputtering. Appl. Surf. Sci. 255, 432–434. doi: 10.1016/j.apsusc.2008.06.174
Lo, C. M., Wang, H. B., Dembo, M., and Wang, Y. L. (2000). Cell movement is guided by the rigidity of the substrate. Biophys. J. 79, 144–152. doi: 10.1016/S0006-3495(00)76279-5
Mackie, N. M., Dalleska, N. F., Castner, D. G., and Fisher, E. R. (1997). Comparison of pulsed and continuous-wave deposition of thin films from saturated fluorocarbon/H2 inductively coupled rf plasmas. Chem. Mater. 9, 349–362. doi: 10.1021/cm960388q
Marinello, F., Schiavuta, P., Carmignato, S., and Savio, E. (2010). Critical factors in quantitative atomic force acoustic microscopy. CIRP J. Manuf. Sci. Technol. 3, 49–54. doi: 10.1016/j.cirpj.2010.05.004
Marinello, F., Schiavuta, P., Vezzù, S., Patelli, A., Carmignato, S., and Savio, E. (2011). Atomic force acoustic microscopy for quantitative nanomechanical characterization. Wear 271, 534–538. doi: 10.1016/j.wear.2010.03.032
Migliavacca, F., Petrini, L., Montanari, V., Quagliana, I., Auricchio, F., and Dubini, G. (2005). A predictive study of the mechanical behaviour of coronary stents by computer modelling. Med. Eng. Phys. 27, 13–18. doi: 10.1016/j.medengphy.2004.08.012
Montaño-Machado, V., Angeloni, L., Chevallier, P., Klak, M. C., Turgeon, S., Rossi, M., et al. (2019). Oxidative plasma treatment of fluorocarbon surfaces for blood-contacting applications. Mater. Sci. Forum 941, 2528–2533. doi: 10.4028/www.scientific.net/MSF.941.2528
Montaño-Machado, V., Noël, C., Chevallier, P., Turgeon, S., Houssiau, L., Pauthe, E., et al. (2017). Interaction of phosphorylcholine with fibronectin coatings: surface characterization and biological performances. Appl. Surf. Sci. 396, 1613–1622. doi: 10.1016/j.apsusc.2016.11.224
Passeri, D., Alippi, A., Bettucci, A., Rossi, M., Alippi, A., Tamburri, E., et al. (2011). Indentation modulus and hardness of polyaniline thin films by atomic force microscopy. Synth. Met. 161, 7–12. doi: 10.1016/j.synthmet.2010.10.027
Passeri, D., Bettucci, A., Germano, M., Rossi, M., Alippi, A., Orlanducci, S., et al. (2005). Effect of tip geometry on local indentation modulus measurement via atomic force acoustic microscopy technique. Rev. Sci. Instrum. 76:093904. doi: 10.1063/1.2044607
Passeri, D., Biagioni, A., Rossi, M., Tamburri, E., and Terranova, M. L. (2013c). Characterization of polyaniline-detonation nanodiamond nanocomposite fibers by atomic force microscopy based techniques. Eur. Polym. J. 49, 991–998. doi: 10.1016/j.eurpolymj.2013.02.003
Passeri, D., Rossi, M., Alippi, A., Bettucci, A., Manno, D., Serra, A., et al. (2008). Atomic force acoustic microscopy characterization of nanostructured selenium-tin thin films. Superlattices Microstruct. 44, 641–649. doi: 10.1016/j.spmi.2007.10.004
Passeri, D., Rossi, M., Tamburri, E., and Terranova, M. L. (2013a). Mechanical characterization of polymeric thin films by atomic force microscopy based techniques. Anal. Bioanal. Chem. 405, 1463–1478. doi: 10.1007/s00216-012-6419-3
Passeri, D., Rossi, M., and Vlassak, J. J. (2013b). On the tip calibration for accurate modulus measurement by contact resonance atomic force microscopy. Ultramicroscopy 128, 32–41. doi: 10.1016/j.ultramic.2013.02.003
Passeri, D., Tamburri, E., Terranova, M. L., and Rossi, M. (2015). Polyaniline-nanodiamond fibers resulting from the self-assembly of nano-fibrils: a nanomechanical study. Nanoscale 7, 14358–14367. doi: 10.1039/c5nr02096d
Pettersson, T., Nordgren, N., Rutland, M. W., and Feiler, A. (2007). Comparison of different methods to calibrate torsional spring constant and photodetector for atomic force microscopy friction measurements in air and liquid. Rev. Sci. Instrum. 78:093702. doi: 10.1063/1.2779215
Qiu, Y., Brown, A. C., Myers, D. R., Sakurai, Y., Mannino, R. G., Tran, R., et al. (2014). Platelet mechanosensing of substrate stiffness during clot formation mediates adhesion, spreading, and activation. Proc. Natl. Acad. Sci. U.S.A. 111, 14430–14435. doi: 10.1073/pnas.1322917111
Rabe, U., and Arnold, W. (1994). Acoustic microscopy by atomic force microscopy. Appl. Phys. Lett. 64, 1493–1495. doi: 10.1063/1.111869
Rabe, U., Janser, J., and Arnold, W. (1996). Vibration of free and surface-coupled atomic force microscope cantilevers: theory and experiment. Rev. Sci. Instrum. 67, 3281–3293. doi: 10.1063/1.1147409
Reggente, M., Natali, M., Passeri, D., Lucci, M., Davoli, I., Pourroy, G., et al. (2017). Multiscale mechanical characterization of hybrid Ti/PMMA layered materials. Colloid. Surface. A 532, 244–251. doi: 10.1016/j.colsurfa.2017.05.011
Reggente, M., Rossi, M., Angeloni, L., Tamburri, E., Lucci, M., Davoli, I., et al. (2015). Atomic force microscopy techniques for nanomechanical characterization: a polymeric case study. JOM 67, 849–857. doi: 10.1007/s11837-015-1340-9
Sader, J. E., Chon, J. W. M., and Mulvaney, P. (1999). Calibration of rectangular atomic force microscope cantilevers. Rev. Sci. Instrum. 70, 3967–3969. doi: 10.1063/1.1150021
Sahin, O., and Erina, N. (2008). High-resolution and large dynamic range nanomechanical mapping in tapping-mode atomic force microscopy. Nanotechnology 19:445717. doi: 10.1088/0957-4484/19/44/445717
Sahin, O., Magonov, S., Su, C., Quate, C. F., and Solgaard, O. (2007). An atomic force microscope tip designed to measure time-varying nanomechanical forces. Nat. Nanotechnol. 2, 507–514. doi: 10.1038/nnano.2007.226
Santos, S., Barcons, V., Christenson, H. K., Font, J., and Thomson, N. H. (2011). The intrinsic resolution limit in the atomic force microscope: implications for heights of nano-scale features. PLoS ONE 6:e23821. doi: 10.1371/journal.pone.0023821
Shulha, H., Kovalev, A., Myshkin, N., and Tsukruk, V. V. (2004). Some aspects of afm nanomechanical probing of surface polymer films. Eur. Polym. J. 40, 949–956. doi: 10.1016/j.eurpolymj.2004.01.021
Sirghi, L., Ruiz, A., Colpo, P., and Rossi, F. (2009). Atomic force microscopy indentation of fluorocarbon thin films fabricated by plasma enhanced chemical deposition at low radio frequency power. Thin Solid Films 517, 3310–3314. doi: 10.1016/j.tsf.2009.01.055
Stan, G., and Cook, R. F. (2008). Mapping the elastic properties of granular Au films by contact resonance atomic force microscopy. Nanotechnology 19:235701. doi: 10.1088/0957-4484/19/23/235701
Stan, G., and Price, W. (2006). Quantitative measurements of indentation moduli by atomic force acoustic microscopy using a dual reference method. Rev. Sci. Instrum. 77:103707. doi: 10.1063/1.2360971
Subramanian, A., and Lin, H. Y. (2005). Crosslinked chitosan: its physical properties and the effects of matrix stiffness on chondrocyte cell morphology and proliferation. J. Biomed. Mater. Res. A 75A, 742–753. doi: 10.1002/jbm.a.30489
Tang, G., Ma, X., Sun, M., and Li, X. (2005). Mechanical characterization of ultra-thin fluorocarbon films deposited by R.F. magnetron sputtering. Carbon 43, 345–350. doi: 10.1016/j.carbon.2004.09.022
Thevenot, P., Hu, W., and Tang, L. (2008). Surface chemistry influences implant biocompatibility. Curr. Top. Med. Chem. 8, 270–280. doi: 10.2174/156802608783790901
Touzin, M., Chevallier, P., Turgeon, S., Horny, P., and Mantovani, D. (2010). Evaluation of the corrosion protection of ultra-thin plasma fluorocarbon film deposited on 316l stainless steel for long-term stable stents. Mater. Sci. Forum 638, 10–15. doi: 10.4028/www.scientific.net/MSF.638-642.10
Wagner, R., and Killgore, J. P. (2015). Photothermally excited force modulation microscopy for broadband nanomechanical property measurements. Appl. Phys. Lett. 107:203111. doi: 10.1063/1.4935982
Yamanaka, K., Kobari, K., and Tsuji, T. (2008). Evaluation of functional materials and devices using atomic force microscopy with ultrasonic measurements. Jpn. J. Appl. Phys. 47, 6070–6076. doi: 10.1143/jjap.47.6070
Yamanaka, K., Tsuji, T., Noguchi, A., Koike, T., and Mihara, T. (2000). Nanoscale elasticity measurement with in situ shape estimation in atomic force microscopy. Rev. Sci. Instrum. 71, 2403–2408. doi: 10.1063/1.1150627
Yuya, P. A., Hurley, D. C., and Turner, J. A. (2008). Contact-resonance atomic force microscopy for viscoelasticity. J. Appl. Phys. 104:074916. doi: 10.1063/1.2996259
Keywords: fluorocarbon films, adhesion, elastic properties, viscoelastic properties, contact resonance atomic force microscopy, HarmoniX, methanol plasma, biomaterials
Citation: Reggente M, Angeloni L, Passeri D, Chevallier P, Turgeon S, Mantovani D and Rossi M (2020) Mechanical Characterization of Methanol Plasma Treated Fluorocarbon Ultrathin Films Through Atomic Force Microscopy. Front. Mater. 6:338. doi: 10.3389/fmats.2019.00338
Received: 28 August 2019; Accepted: 06 December 2019;
Published: 08 January 2020.
Edited by:
Admir Masic, Massachusetts Institute of Technology, United StatesReviewed by:
Dongyan Liu, Chinese Academy of Sciences, ChinaAntonio Greco, University of Salento, Italy
Copyright © 2020 Reggente, Angeloni, Passeri, Chevallier, Turgeon, Mantovani and Rossi. This is an open-access article distributed under the terms of the Creative Commons Attribution License (CC BY). The use, distribution or reproduction in other forums is permitted, provided the original author(s) and the copyright owner(s) are credited and that the original publication in this journal is cited, in accordance with accepted academic practice. No use, distribution or reproduction is permitted which does not comply with these terms.
*Correspondence: Daniele Passeri, ZGFuaWVsZS5wYXNzZXJpQHVuaXJvbWExLml0
†These authors have contributed equally to this work