 Maria del Rosario Silva Campos1*
 Carsten Blawert1
 Chamini L. Mendis2
 Marta Mohedano3
 Tristan Zimmermann4
 Daniel Proefrock4
 Mikhail L. Zheludkevich1,5
 Karl Ulrich Kainer1
- 1Magnesium Innovation Centre–MagIC, Institute of Materials Research, Helmholtz-Zentrum Geesthacht, Geesthacht, Germany
- 2BCAST, Brunel University London, Uxbridge, United Kingdom
- 3Department of Chemical and Materials Engineering, Universidad Complutense de Madrid, Madrid, Spain
- 4Institute of Coastal Research, Helmholtz-Zentrum Geesthacht, Geesthacht, Germany
- 5Faculty of Engineering, Institute for Materials Science, University of Kiel, Kiel, Germany
In 0.5 wt.% NaCl aqueous solution, Mg-10Gd alloy shows promising corrosion resistance. The microstructure of this alloy was modified via heat treatments to understand the effect of accompanying microstructural changes on the corrosion resistance. It was found that corrosion performance depends both on the amount and the distribution of the cathodic intermetallic phases. The T4 heat treatment (24 h at 540°C) caused the Gd to distribute uniformly in the matrix, which had positive effect on corrosion resistance showing a delay in the time required for the first observation of localized corrosion. The T4 heat treated specimens, specimens aged at 200°C and 300°C, showed relatively uniform degradation and thus these heat treatments are not detrimental in terms of corrosion resistance. In contrast, heat treatment at 400°C seems to increase the formation of small cuboidal particles rich in Gd, most likely to be GdH2 particles, in the matrix, resulting in a detrimental effect on the corrosion behavior.
Introduction
To date several methodologies have been used to enhance the corrosion performance of Mg based materials. The most common strategies include microstructure control, reduction of impurity levels (Fe, Cu, and Ni), addition of alloying elements, and surface modifications. The majority of alloying additions have limited solid solubility in Mg and therefore either intermetallic phases form beyond the equilibrium solubility limits or due to non-equilibrium solidification processes associated with casting (Habashi, 2008). Magnesium alloys are very susceptible to localized corrosion in chloride solutions due to their inhomogeneous microstructure (Ben-Hamu et al., 2007). The existence of intermetallic phases have a pronounced influence on the corrosion behavior of Mg alloys mainly attributed to electrochemical potential differences with the matrix (Song and Atrens, 1999; Song and Atrens, 2003). Generally, these phases are nobler (i.e., have a higher redox potential) than the Mg matrix (Ambat et al., 2000) and influence the overall corrosion behavior depending on their potential relative to Mg matrix and their efficiency as cathodic sites (Silva Campos, 2016).
The alloying additions in commercial Mg alloys that influence corrosion can be categorized as:
(a) Benign or beneficial; e.g., Al, Be, Mn, rare earth (RE) elements, Si, Zn and Zr.
(b) Moderately deleterious e.g., Ag.
(c) Severely deleterious e.g., Ni, Co, Fe and Cu (Rokhlin, 2003).
In fact, generally Mg alloys could be classified into two main groups: (1) those containing Al as the primary alloying element. To increase the tensile yield strength and the castability of Mg alloys by forming the intermetallic phase Mg17Al12 (Victoria-Hernandez et al., 2013); and (2) those free of Al and containing small additions of Zr for the purpose of grain refinement (Hu et al., 2014), besides forming intermetallics with Fe and Ni in the melt (Emley, 1966). Additions of Zn are also important as Al in the magnesium alloys to increase strengthening and castability (Meza-García, 2010). In terms of corrosion, Zn increases the tolerance limits and reduces the effect of impurities on corrosion once the tolerance limit has been exceeded (Hillis, 1998). Moreover, Si is added by design to the Mg-Al-Si alloys to promote the formation of Mg2Si, which enhance strength in the alloy and is relatively harmless to the corrosion of Mg (Carlson and Jones, 1993). Likewise, additions up to 2% Ag lead to grain refining due to formation of precipitates, increase hardness and reduce corrosion resistance in as-extruded Mg-Al-Ag alloys. In binary Mg-Ag alloys, it is mandatory to applied T4 and T6 heat treatments to maintain the general corrosion at a satisfactory level (Tie et al., 2014).
Nevertheless, additions of Ni, Fe and Cu are detrimental to corrosion resistance of Mg alloys, due to their low solid-solubility limits and their more positive potentials, which lead to formation of active/efficient cathodic sites for hydrogen evolution, thereby forming galvanic cells and enhance the corrosion rate of magnesium alloys (Hanawalt et al., 1942; NACE, 1974; Habashi, 2008). The tolerance limit of these elements depends on the alloy composition, for pure magnesium, the tolerable limits for Cu, Fe and Ni are 0.1%, 0.005, and 0.0005 wt.%, respectively. While for example, AZ91 alloy has tolerance limits of 20 ppm Fe, 12 ppm Ni and 900 ppm Cu (Hanawalt et al., 1942). In addition, these elements can be considered also as impurities if they arise from various sources; the iron from the melting crucibles and tools, copper comes from impure aluminim, while nickel is coming from the used stainless steel crucibles or traces may be contained in the used magnesium (Emley, 1966). However, additions of Mn could improve corrosion resistance of Mg alloys by reducing the effect of the impurities (Makar and Kruger, 1990, 1993; Froats et al., 1987).
It has been reported that RE additions have significant positive effects on the corrosion resistance of Mg alloys (Unsworth, 1989; Morales et al., 2003; Rosalbino et al., 2006; Takenaka et al., 2007; Birbilis et al., 2009; Hort et al., 2010; Liu et al., 2010; Nayyeri and Khomamizadeh, 2011; Silva Campos et al., 2011; Sudholz et al., 2011; Shi et al., 2013; Silva Campos, 2016). The RE elements improve the tendency of Mg to passivate and decrease the micro-galvanic effect coming from other intermetallic phases (Reichek et al., 1985; Unsworth, 1989; Zucchi et al., 2005; Liu et al., 2009).
For instance, the addition of Gd to AM50 and AZ91D alloys modified the intermetallic phases by forming Al2Gd and Al-Mn-Gd intermetallic phases thus reducing the amount of Mg17Al12 phase (Arrabal et al., 2012a, b). As a result, the corrosion rates of these alloys decreased with additions of 0.7 and 1.0 wt.% Gd by 85% and 93%, respectively (Arrabal et al., 2012b). This is mainly due to the decreased cathodic reaction kinetics caused by the suppression of micro-galvanic corrosion between primary and secondary phases (Arrabal et al., 2012b). In another study of AZ91 based alloys in humid environments, Gd reduced the effect of micro-galvanic couples and consequently the corrosion rate (Arrabal et al., 2012a). Arrabal et al. (2011) reported the beneficial effect of Gd additions on the high temperature oxidation behavior of AZ91D alloy due to formation of Al2Gd and Al-Mn-Gd phases, which reduced the amount of Mg17Al12. This lead to corrosion rates lower than 72–81% compared with Gd free AZ91D. This was associated to the improved surface passivity and suppression of micro-galvanic couples (Mohedano et al., 2014).
Shi et al. (2013) reported that the corrosion resistance observed in the as-cast and the heat treated Mg-5Gd alloy is comparable to other RE additions such as Ce, La, Nd and Y. This was attributed to the accelerated micro galvanic corrosion caused by Gd present in the intermetallic phases. Kainer et al. (2009) investigated binary Mg-Gd alloys, in the as-cast, T4 and T6 conditions and reported that T6 heat treated Mg-10Gd had the lowest corrosion rate in 1 wt.% NaCl due to a fine distribution of nano-sized Mg-Gd precipitates. The reduction in the solid solubility of Gd with reduced temperature makes Mg–Gd system suitable for heat treatments to adjust the mechanical properties in accordance with the requirements of the property profile of an specific application (Silva Campos, 2016).
However, the effect of heat treatments on the corrosion mechanism and kinetics on Mg-10Gd has not been fully investigated. Thus, the aim of this work is to modify the microstructure of Mg-10Gd alloy by heat treatments and evaluate their effect on the corrosion behavior using different corrosion test and electrochemical techniques to understand the mechanisms that control the corrosion behavior.
Experimental
Casting and Heat Treatments
Pure Mg and Gd were molten in an electrical resistance furnace under a protective gas mixture of Ar and 3% SF6. The melt was stirred for 10 min and cast into a cylindrical steel mold of 18 mm diameter and 150 mm length. The actual chemical composition of the Mg-10Gd alloy analyzed with inductively coupled plasma mass spectrometry (ICP-MS) was found to be 10.28% Gd, 0.0026% Fe, 0.0008% Ni, and 0.0040% Cu and the balance Mg (compositions in wt.%). The as-cast Mg-10Gd was solution treated at 540°C for 24 h and quenched into water held at room temperature. Solution heat treated samples were immediately aged at 200°C, 300°C and 400°C for 24 h and then quenched in cold water (∼ 8°C).
Elemental Analysis
Approx. 1 g of Mg-10Gd alloy were digested in a mixture of 30 mL Milli-Q water and 10 mL of subboiled concentrated HNO3 (65 wt.%, trace metal grade). For trace metal analysis the digests were diluted 1:100 with Milli-Q water. The determination of Gd, Fe, Ni and Cu was performed using an inductively coupled plasma tandem mass spectrometer (ICP-MS/MS) (Agilent 8800, Agilent Technologies, Tokyo, Japan). For quantification an external calibration, prepared from custom-made multi-elemental standards was used.
Microstructure Characterization
Samples for the microstructure analysis were embedded in epoxy resin (Demotec 30) and then ground with 800, 1200 and 2500 grit SiC paper using water. Then the samples were polished with 0.05 μm colloidal silica OPSTM (Struers) suspension and soapy deionized water and rinsed with ethanol and dried with hot air.
X-Ray Diffraction (XRD)
The X-ray diffraction (XRD) analysis was conducted using a Siemens D5000 X-ray Powder Diffractometer with Cu Kα radiation operating at 40 kV and 40 mA. The diffraction peaks were recorded for 2θ between 10° and 90° with a step size of 0.010 and a dwell time of 7 s and a rotation speed of 30 rpm.
Scanning Electron Microscopy (SEM)
The microstructures were observed with a Zeiss Ultra 55 scanning electron microscope equipped with energy-dispersive X-ray spectrometer (EDX) at an accelerating voltage of 20 kV. A Cambridge Stereoscan 200 SEM with an acceleration voltage between 5–10 kV was used to examine the surface appearance of the specimens before and after corrosion experiments.
Transmission Electron Microscopy (TEM)
The precipitate microstructures were examined using a Phillips CM200 transmission electron microscope operating at 200 kV. The samples for TEM analysis were prepared by punching 3 mm disks from specimens that were ∼ 200 μm in thickness and then electropolished in a Fischione twin jet electropolishing unit using a solution of 1.5% perchloric acid in methanol at ∼−45°C, 50 V, and ∼0.8–1.2 mA to perforation.
Corrosion Evaluation
The electrochemical measurements were performed using a three electrode cell containing 330 ml of electrolyte. In this cell the sample was the working electrode (WE) with an exposed area of ∼0.5 cm2, while reference (RE) and auxiliary (AE) electrodes were Ag/AgCl, and Pt mesh, respectively. An aerated and stirred solution of 0.5 wt.% NaCl was used as the electrolyte and the cell was connected to a Gill AC potentiostat from ACM Instruments. The experiments were conducted at 21.5 ± 0.5°C. This set up was used for open circuit potential (OCP), potentiodynamic polarization measurements and electrochemical impedance spectroscopy (EIS). Repeatability was tested by measuring at least three specimens.
Open Circuit Potential (OCP)
The open circuit potential (OCP) measurements were recorded for 30 min, directly after immersion into the electrolyte.
Potentiodynamic Polarization Measurements
The potentiodynamic polarization measurements were conducted from −150 mV vs. the open circuit potential using a scan rate of 12 mV/min and a current density limit of 0.1 mA/cm2. The corrosion current densities were obtained with ACM Analysis software by selecting the linear part of the cathodic curve that commenced about ≈50 mV in respect to the corrosion potential (Ecorr). Subsequently the current density (icorr) was estimated from the value where the fit intercepted the vertical through the respective Ecorr (Gandel et al., 2010).
Electrochemical Impedance Spectroscopy (EIS)
Electrochemical impedance spectroscopy (EIS) measurements were performed for immersion times up to three days in the frequency range between 104 Hz and 10–2 Hz with an amplitude of ±10 mV rms. These impedance measurements were performed after different exposure periods of 1, 3, 6, 10, 16, 24, 36, 48, 60, and 72 h. The impedance spectra were fitted using Zview software.
Hydrogen Evolution and Weight Loss
Hydrogen evolution tests were conducted in 0.5 wt.% NaCl solution using samples with dimensions of 15 mm diameter × 4 mm thickness in standard eudiometer set-ups with a total volume of 400 ml. Details of the procedure can be found in the literature (Hort et al., 2010). The samples were removed when the hydrogen has replaced the total volume of 400 ml water out the column. For the weight loss evaluations, the weight of the specimens before and after the corrosion test was cross-checked. The specimens were cleaned for 30 min in chromic acid solution (180 g/l) at room temperature then washed with ethanol and finally dried in hot air to remove the corrosion products. The corrosion rates were calculated from measurement of weight loss using the equation described in (Hort et al., 2010).
Drop Test
In order to observe the initiation and progress of corrosion process drop tests were conducted by placing drops of 0.5 wt.% NaCl solution on a polished surface of the samples for different exposure times (10 min, 30 min, 1, 3, and 5 h). After exposure, the samples were cleaned and the corrosion products removed as described above. The morphology of specimens was observed with SEM before and after the tests.
Results
Microstructure
The XRD diffraction peaks did not reveal any characteristic peaks related to Mg5Gd phase for solution treated, heat treated at 200°C and 400°C samples (Silva Campos, 2016). This is due to a lower volume fraction of the intermetallic phases and the overlapping X-ray Absorption Edges of Gd and Cu, which is described in Hort et al. (2010). However, Mg5Gd peaks could be identified for samples heat treated at 300°C (Figure 1). The typical microstructures of the specimen after various process conditions are illustrated in Figure 2. Figure 2a shows the as-cast microstructure which contain Mg dendrites (a), Mg5Gd intermetallic particles (b) and Gd segregation near the inter dendritic regions (c). The EDX spectra shows that the ratio between Mg and Gd is about 5.7 and it is likely to be Mg5Gd (see Figure 2b). After solution heat treatment, Figure 2c, the dendritic microstructure disappears and few smaller intermetallic particles remain. Based on the morphology of the particles, these particles are likely to be GdH2 phases, based on the SEM-EDS analysis (not shown here) the concentration of Gd in these particles is between 60 to 85 wt.%. Similar phases were reported in previous studies (Peng et al., 2011; Huang et al., 2013, 2016), without forming other Gd containing phases (Apps et al., 2003a, b). After heat treatment at 200°C and 400°C SEM micrographs show similar intermetallic phases to those observed in the solution treated alloy, see Figures 2d,g. The SEM micrograph did not show any solid state precipitates in the sample aged at 200°C (Figure 2c). The TEM analysis show the presence of a very fine distribution of prismatic plate precipitates forming on {100}Mg planes in sample aged at 200°C for 24 h and as illustrated in Figure 3A. These precipitates were approximately 25 ± 1.5 nm in length and only few atomic layers in thickness. Examination of the diffraction patterns and information from the previous research work by Nishijima and Hiraga (2007), and Vostrý et al. (1999) are used to identify these precipitates as β′ (c base centered orthorhombic structuredβ) phase (Gao et al., 2006). The alloy aged at 300°C for 24 h contained a coarse distribution of precipitates (1.12 ± 0.55 μm), see Figures 2e,f which could be identified as Mg5Gd phase (Figure 3B; Silva Campos, 2016). The alloy aged at 400°C did not show any solid state precipitates (Figure 2g) but contained what was identified as GdH2 particles (Figure 3C).
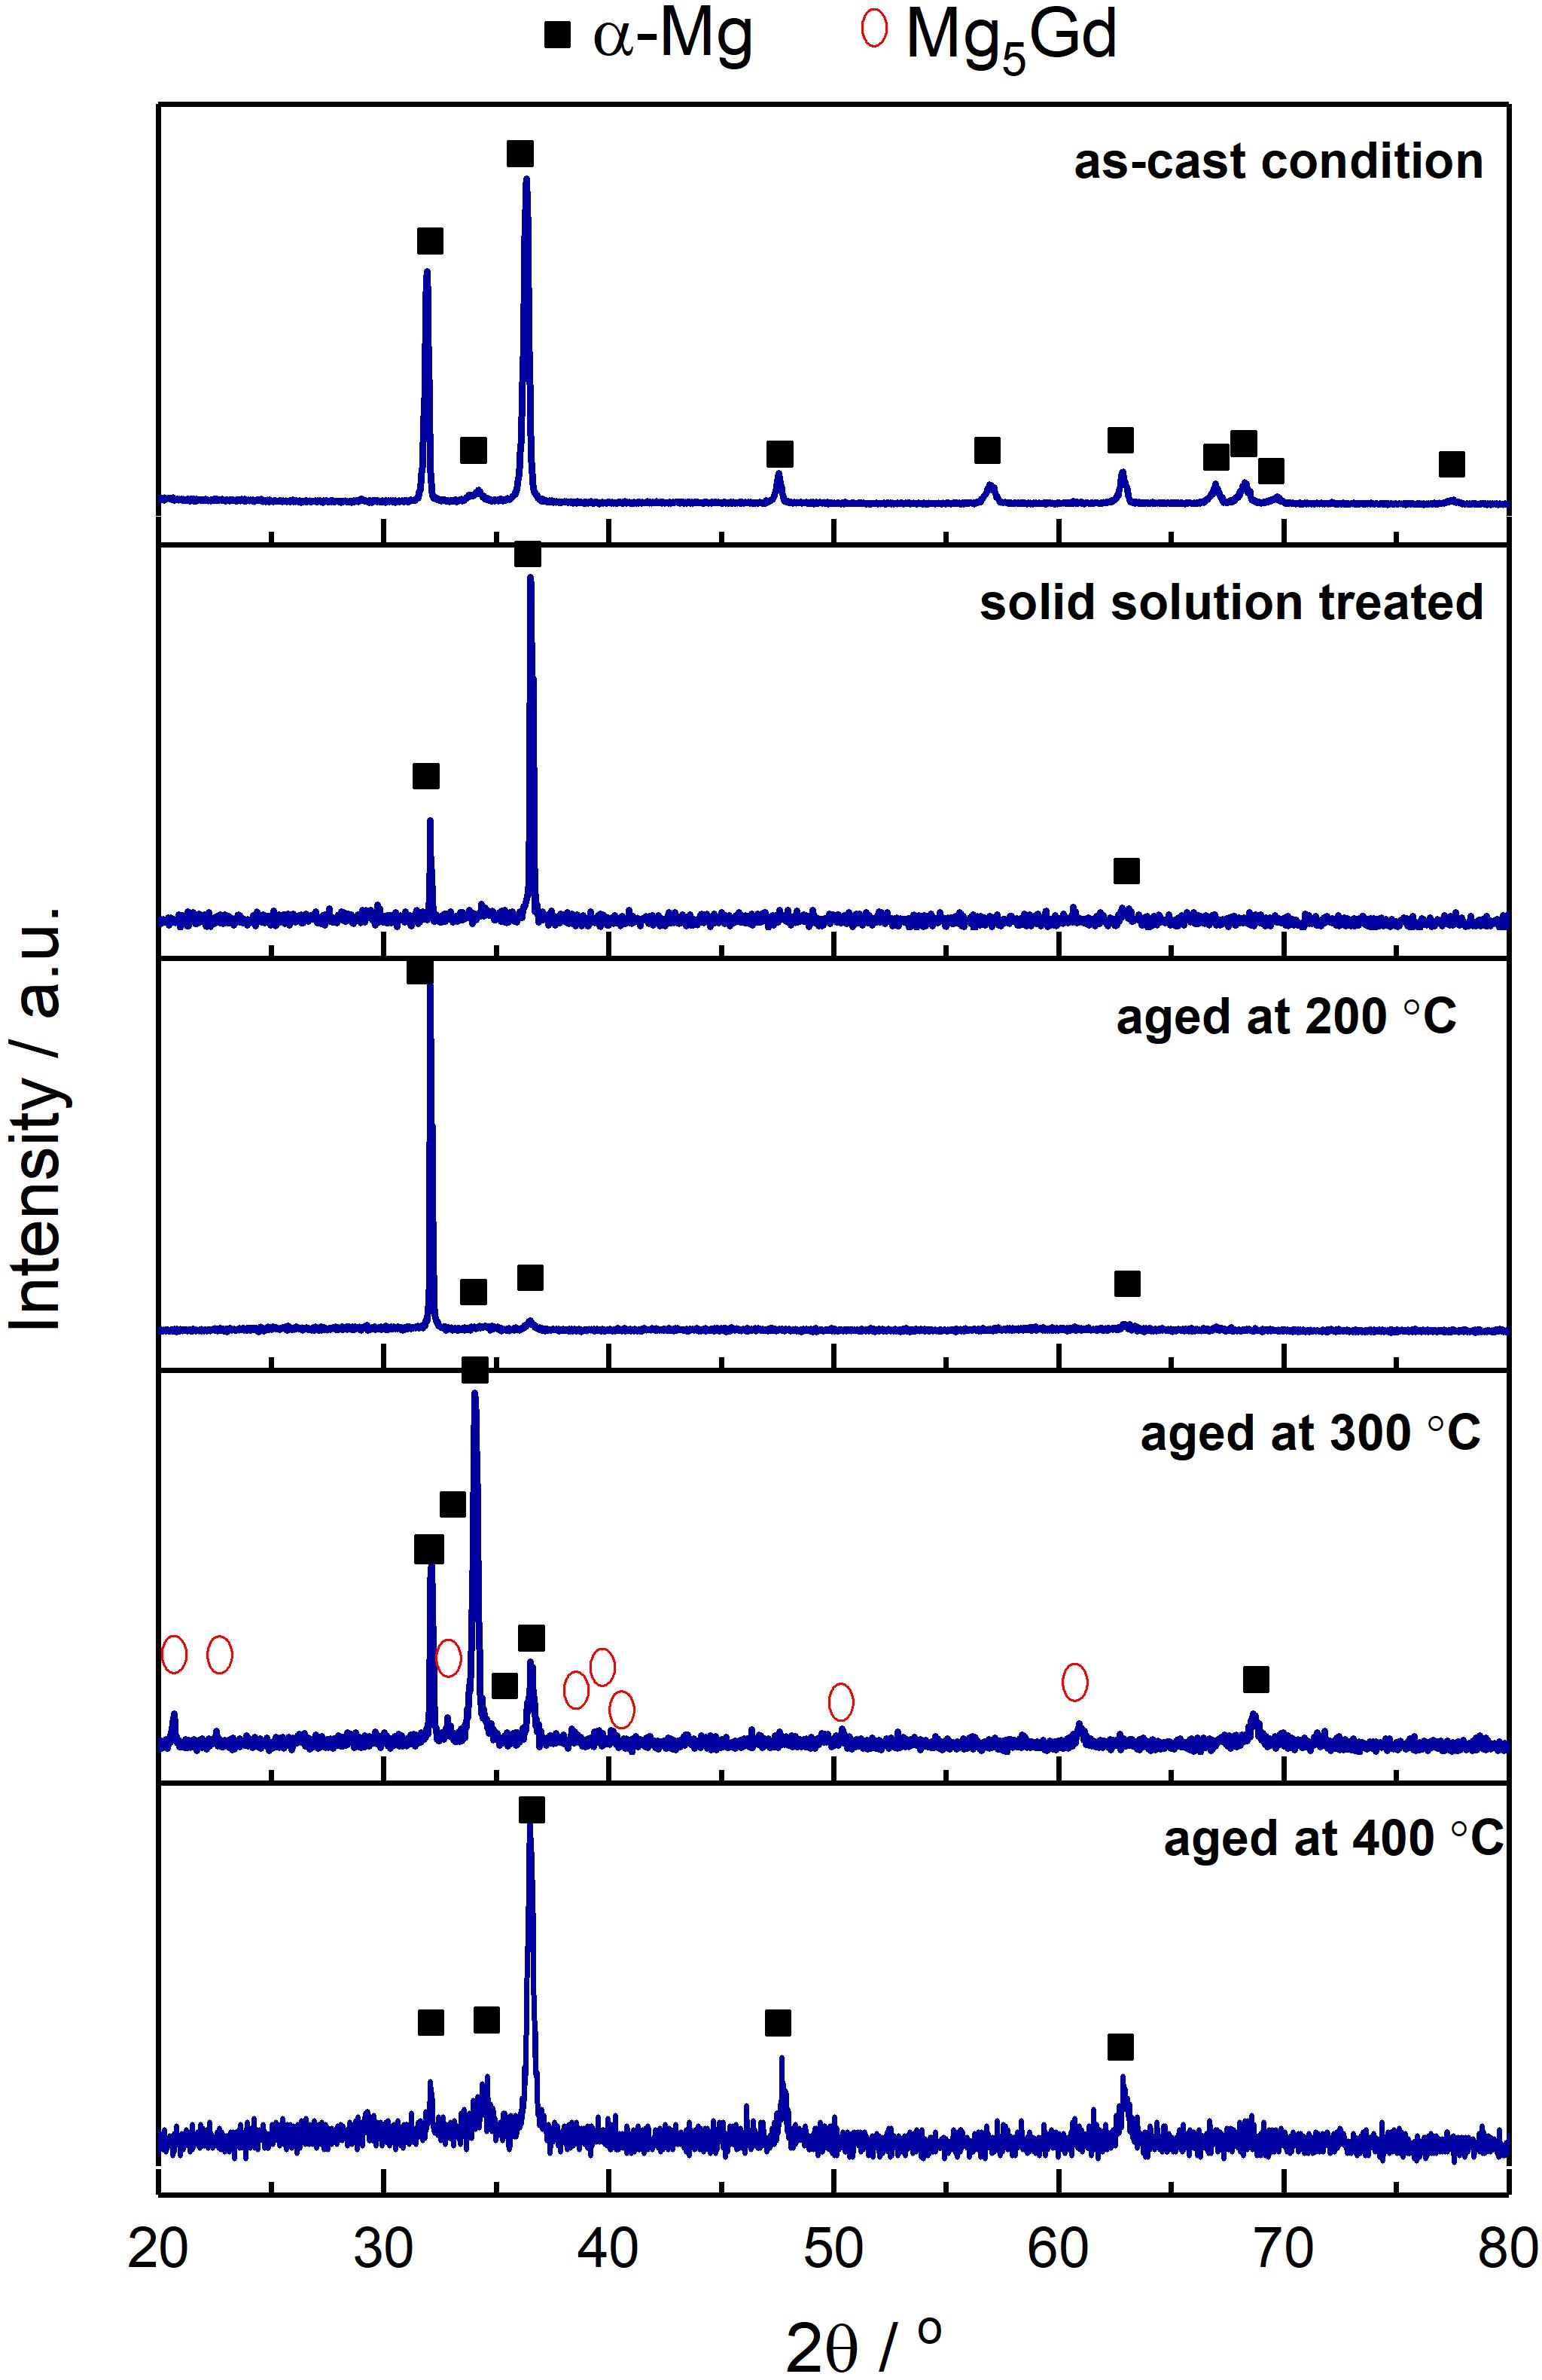
Figure 1. X-ray diffraction patterns of as-cast, solution treated and heat treated at 200°C, 300°C, and 400°C conditions of Mg-10Gd alloy (Silva Campos, 2016).
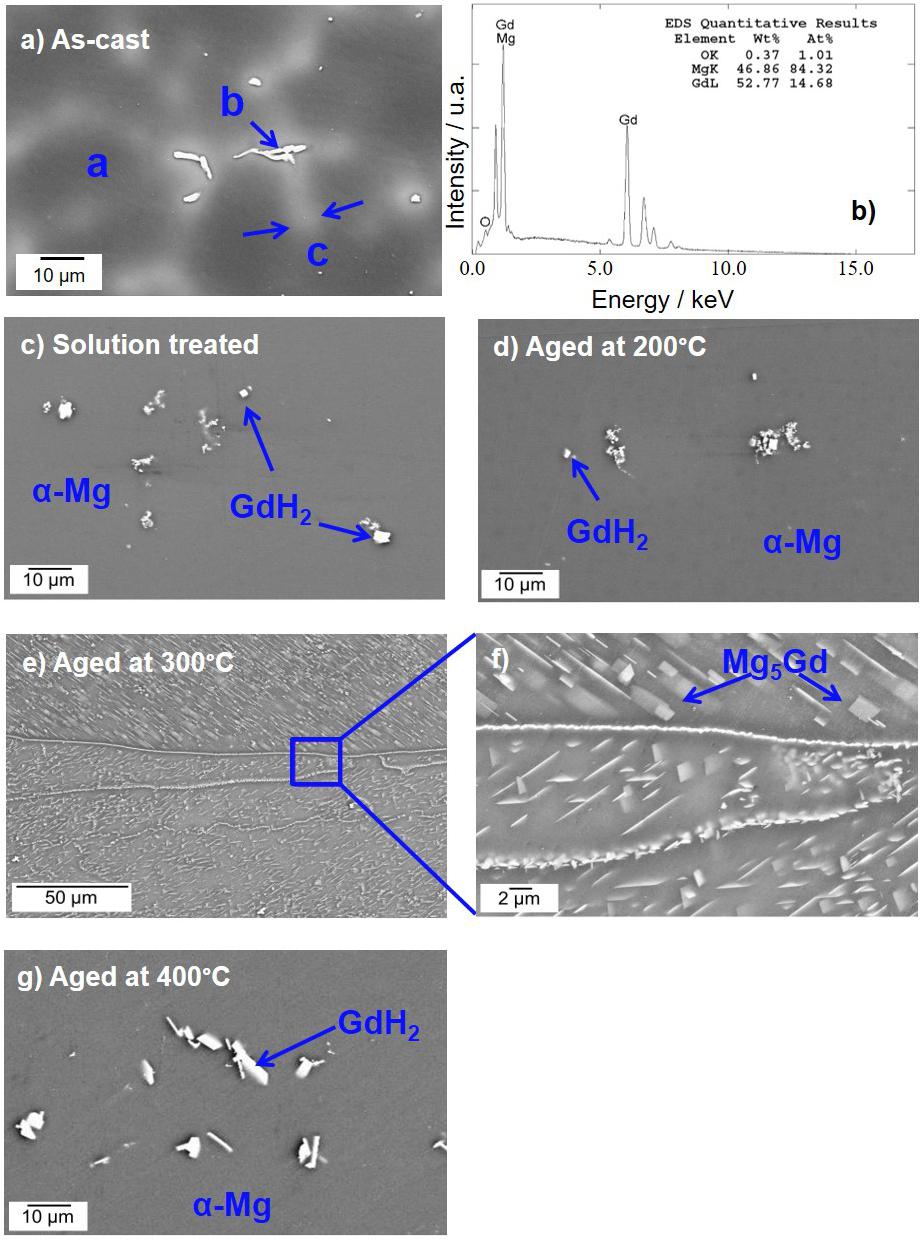
Figure 2. SEM micrographs of Mg-10Gd alloy: (a) as-cast microstructure, letters a, b, c, corresponds to α-matrix, Mg5Gd intermetallic phases and Gd enrichment zones, respectively, (b) typical EDS analysis of the “b” particles (c) solution treated microstructure, after 24 h at 540°C, heat treatments for 24 h (d) at 200°C, (e) at 300°C, (f) higher magnifications showing the precipitates of Mg5Gd phase and (g) at 400°C.
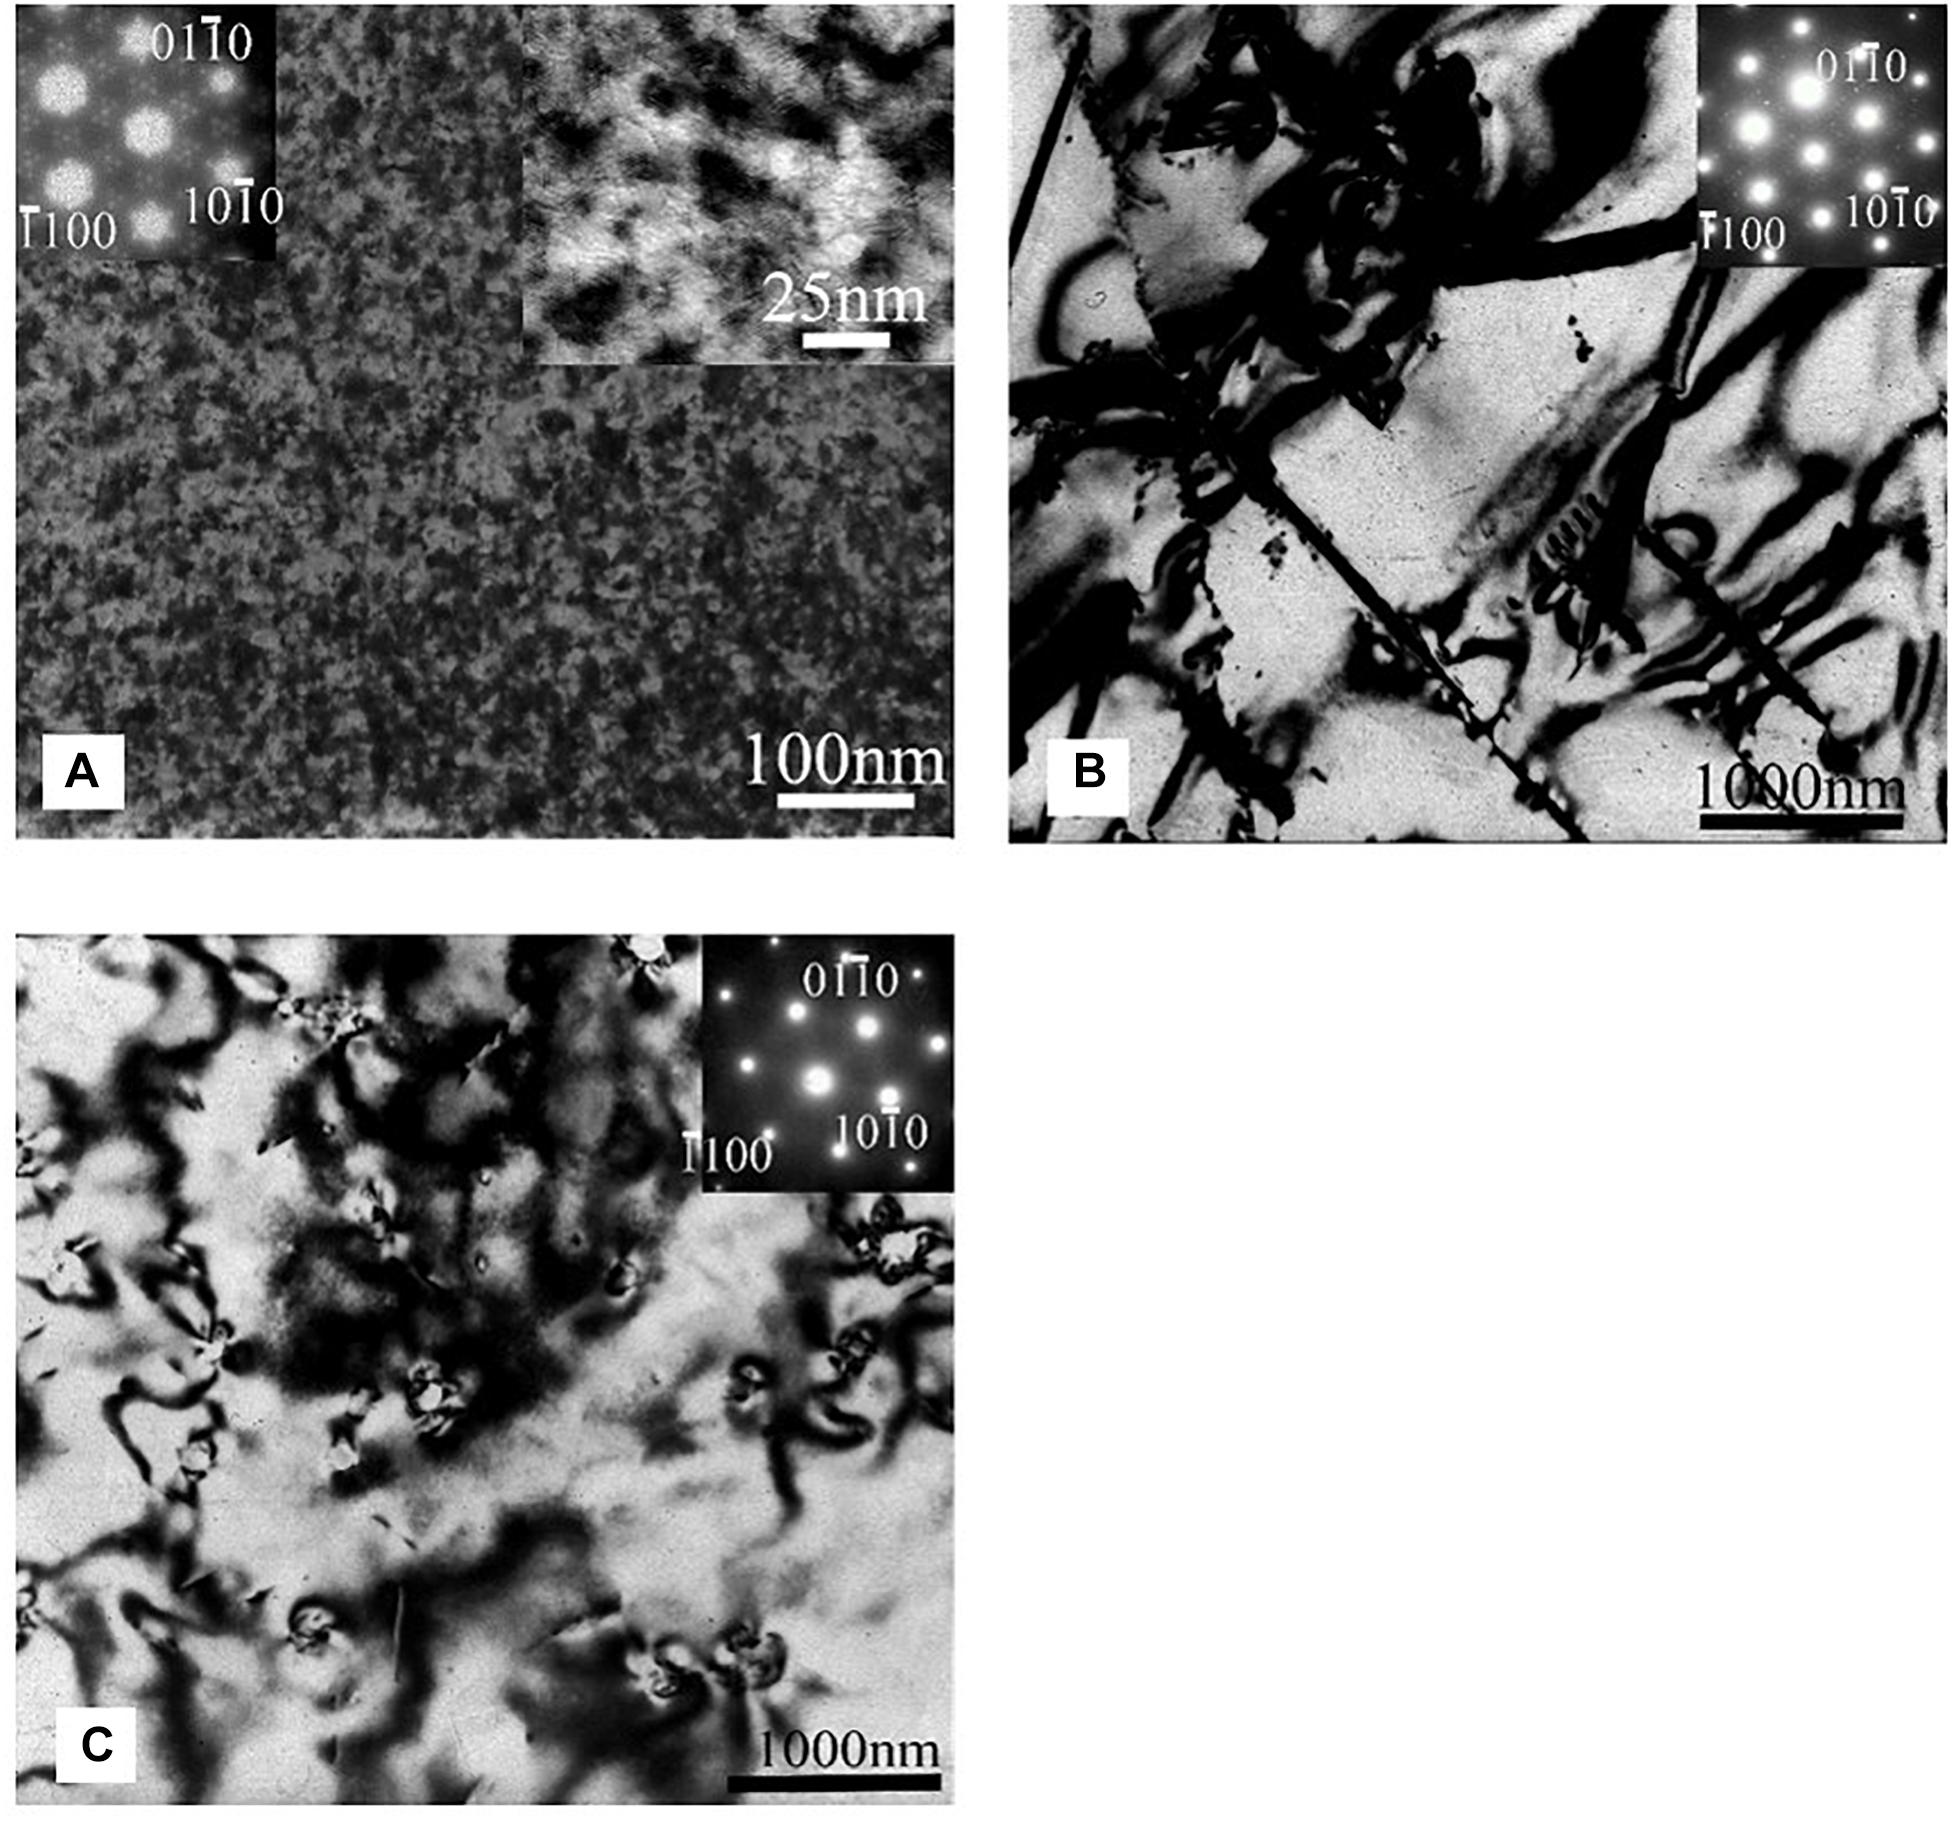
Figure 3. TEM microstructures typical of Mg-10Gd alloy heat treated for 24 h at: (A) 200°C, (B) 300°C, and (C) 400°C. The electron beam direction is approximately parallel to [0001]Mg direction.
The heat treatment results are consistent with the observations of Vostrý et al. (1999), where they reported a decomposition of α-Mg supersaturated solid solution in Mg-9.33 wt.% Gd from a metastable β″(D019) phase to stable β′(Mg5Gd f.c.c) phase using isochronal annealing from 20 to 500°C. Apps et al. (2003a, b) suggest that decomposition of Mg supersaturated solid solution Mg (SSSS) follows the sequence: β″ → β′ → β1 → β, although the compositions of the β″ and β′ phases are not fully characterized due to the small size of these precipitates and their close proximity to each other. However β1 and β phases have a stoichiometry of the Mg5RE for the Mg–7%Gd–2.25%Nd–0.6%Zr (GN72) alloy. Furthermore, they observed the presence of Mg5Gd phase as a stable intermetallic in the binary Mg–Gd system. The Mg5RE phase is dependent on formation temperature.
Corrosion Evaluation
Open Circuit Potential (OCP)
The heat treatments do not only influence the microstructure of the Mg-10Gd alloy but also their electrochemical properties. Figure 4 shows the OCP curves for the Mg-10Gd alloy before and after the heat treatments. All heat treated samples showed more negative potential compared to the as-cast condition. After 500 s only the OCP of the as-cast sample reaches a plateau and for all the other conditions, the potential continues to drift to more positive potential values. This might be a result of different growth of a protective surface film (Li et al., 2011) or possibly the heat treated samples require longer immersion periods than 30 min to stabilize their OCP. After 30 min immersion, the as-cast sample showed the most positive OCP of −1574 mV. The solution treated sample reached an OCP of around −1754 mV, heat treated at 200°C, 300°C, and 400°C samples shifted to OCP values of −1790 mV, −1708 mV, and −1717 mV, respectively. The comparison of the OCP of as-cast specimens with heat treated specimens decreased in the following order: as-cast > heat treated at 300°C > heat treated at 400°C > solution treated > heat treated at 200°C (Silva Campos, 2016). The heat treatments have a direct influence on the initial OCP and the way that corrosion product layers are forming during the first stage of the corrosion process.
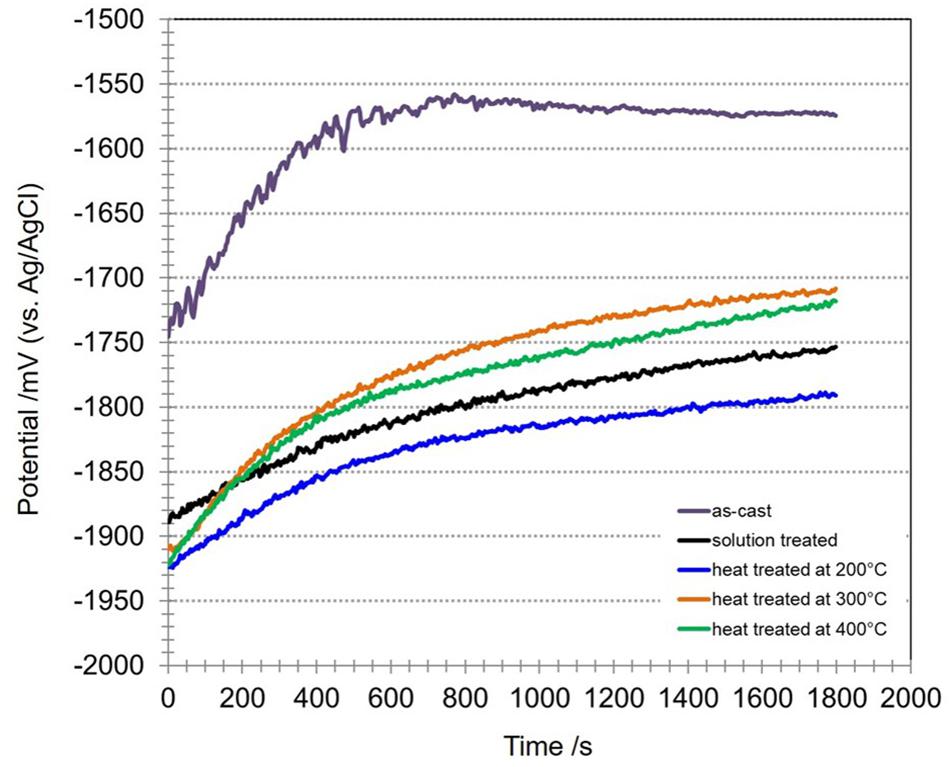
Figure 4. Open circuit potentials of Mg-10Gd alloy in as-cast, solution treated, heat treated at 200°C, 300°C, and 400°C conditions in 0.5 wt.% NaCl solution for 30 min.
Potentiodynamic Polarization Measurements
Figure 5 shows the potentiodynamic polarization curves for all the studied conditions. It shows that the values of corrosion potential (Ecorr) of the Mg-10Gd alloys after heat treatments became more negative than the corrosion potential of the as-cast Mg-10Gd alloy as observed during the OCP measurements. However, only slight differences in the current density values (icorr) were observed (Supplementary Table SA). As mention before the corrosion rates are still correlate with the volume fraction of Mg5Gd, Gd enriched zones and in some extend with the GdH2 phases in as-cast condition. Nevertheless, there is evidence of GdH2 formation especially during heat treatments, a higher volume fraction was found in the solution treated and heat treated at 400°C conditions. Both solution treated specimens and heat treated at 400°C specimens revealed the relatively higher current densities (0.10 ± 0.02 and 0.095 ± 0.05 mA/cm2, respectively) compared with 0.085 ± 0.01 mA/cm2 for heat treated at 200°C and 0.083 ± 0.009 mA/cm2 for heat treated at 300°C samples. Furthermore, the homogenization of Gd distribution appears to be not beneficial for the overall corrosion rate although pitting seems to be retarded. Although differences were small, but in the short term (around 20 to 60 min exposure, the heat-treatments could not significantly improve corrosion resistance. Since the current density of as-cast Mg-10Gd alloy was lowest (0.04 ± 0.004 mA/cm2), compared with those obtained after heat treatments (Silva Campos, 2016).
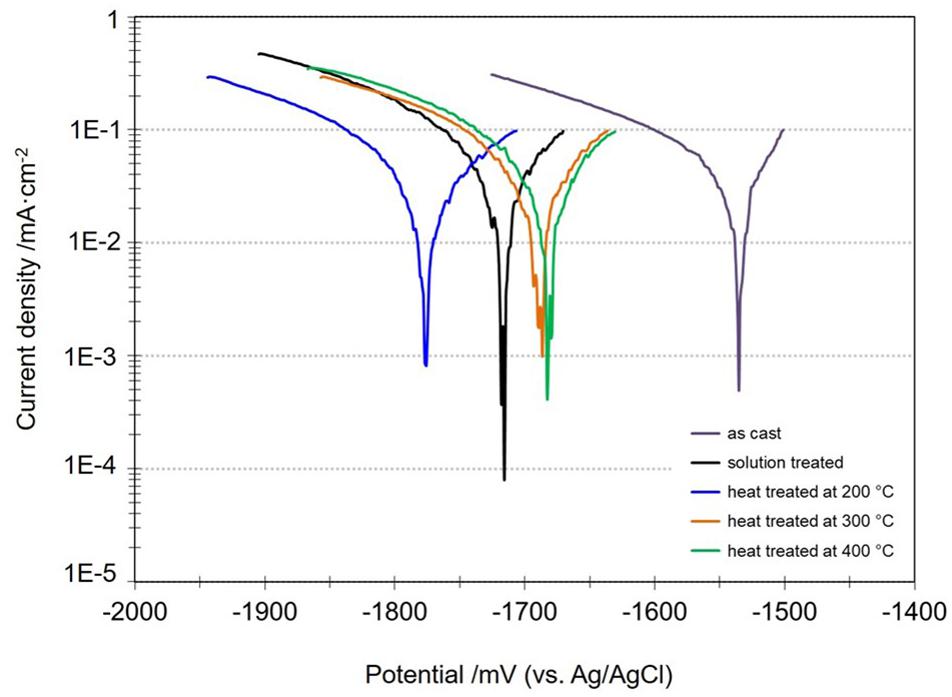
Figure 5. Potentiodynamic polarization measurements of as-cast, solution treated, heat treated at 200°C, 300°C, and 400°C of Mg-10Gd alloy in 0.5 wt.% NaCl solution after 30 min OCP at room temperature.
Electrochemical Impedance Spectroscopy (EIS)
Figure 6 depicts the Bode and Nyquist plots for all studied materials at selected exposure times according to the heat treatment, in order to avoid any overlapping in the spectra. The impedance spectra for all specimens showed two well defined time constants. The time constant at medium frequencies (≈101 Hz) is related to dense oxides/hydroxides corrosion product layers formed on the alloys surface and the second time constant at low frequencies (≈10–2 Hz) is attributed to the electrochemical activities at the interface metal/electrolyte. The equivalent circuits used for fitting the EIS spectra of the all materials are shown in Figure 7 where, Rs represents the resistance of the solution. The resistance ROxi and capacitance COxi are correlated with the oxides/hydroxides layer formed on the metal surface. The defects that formed in the oxide layers generate pathways that allow the diffusion of corrosive species to the Mg surface. Thus, the second time constant appears in the low frequency region. This is the initiation of the corrosion process and it is attributed to the existence of the double-layer capacitance at the metal/electrolyte interface, Cdl and the corresponding charge transfer resistance, RCt (Figure 7A). When the specimen starts to corrode actively, the charge transfer resistance gets very low, leading to almost complete disappearance of the respective time constant and spectra can be fitted using a simple Randles model (Figure 7B; Silva Campos, 2016). All simulated parameters from EIS spectra are listed in Table 1.
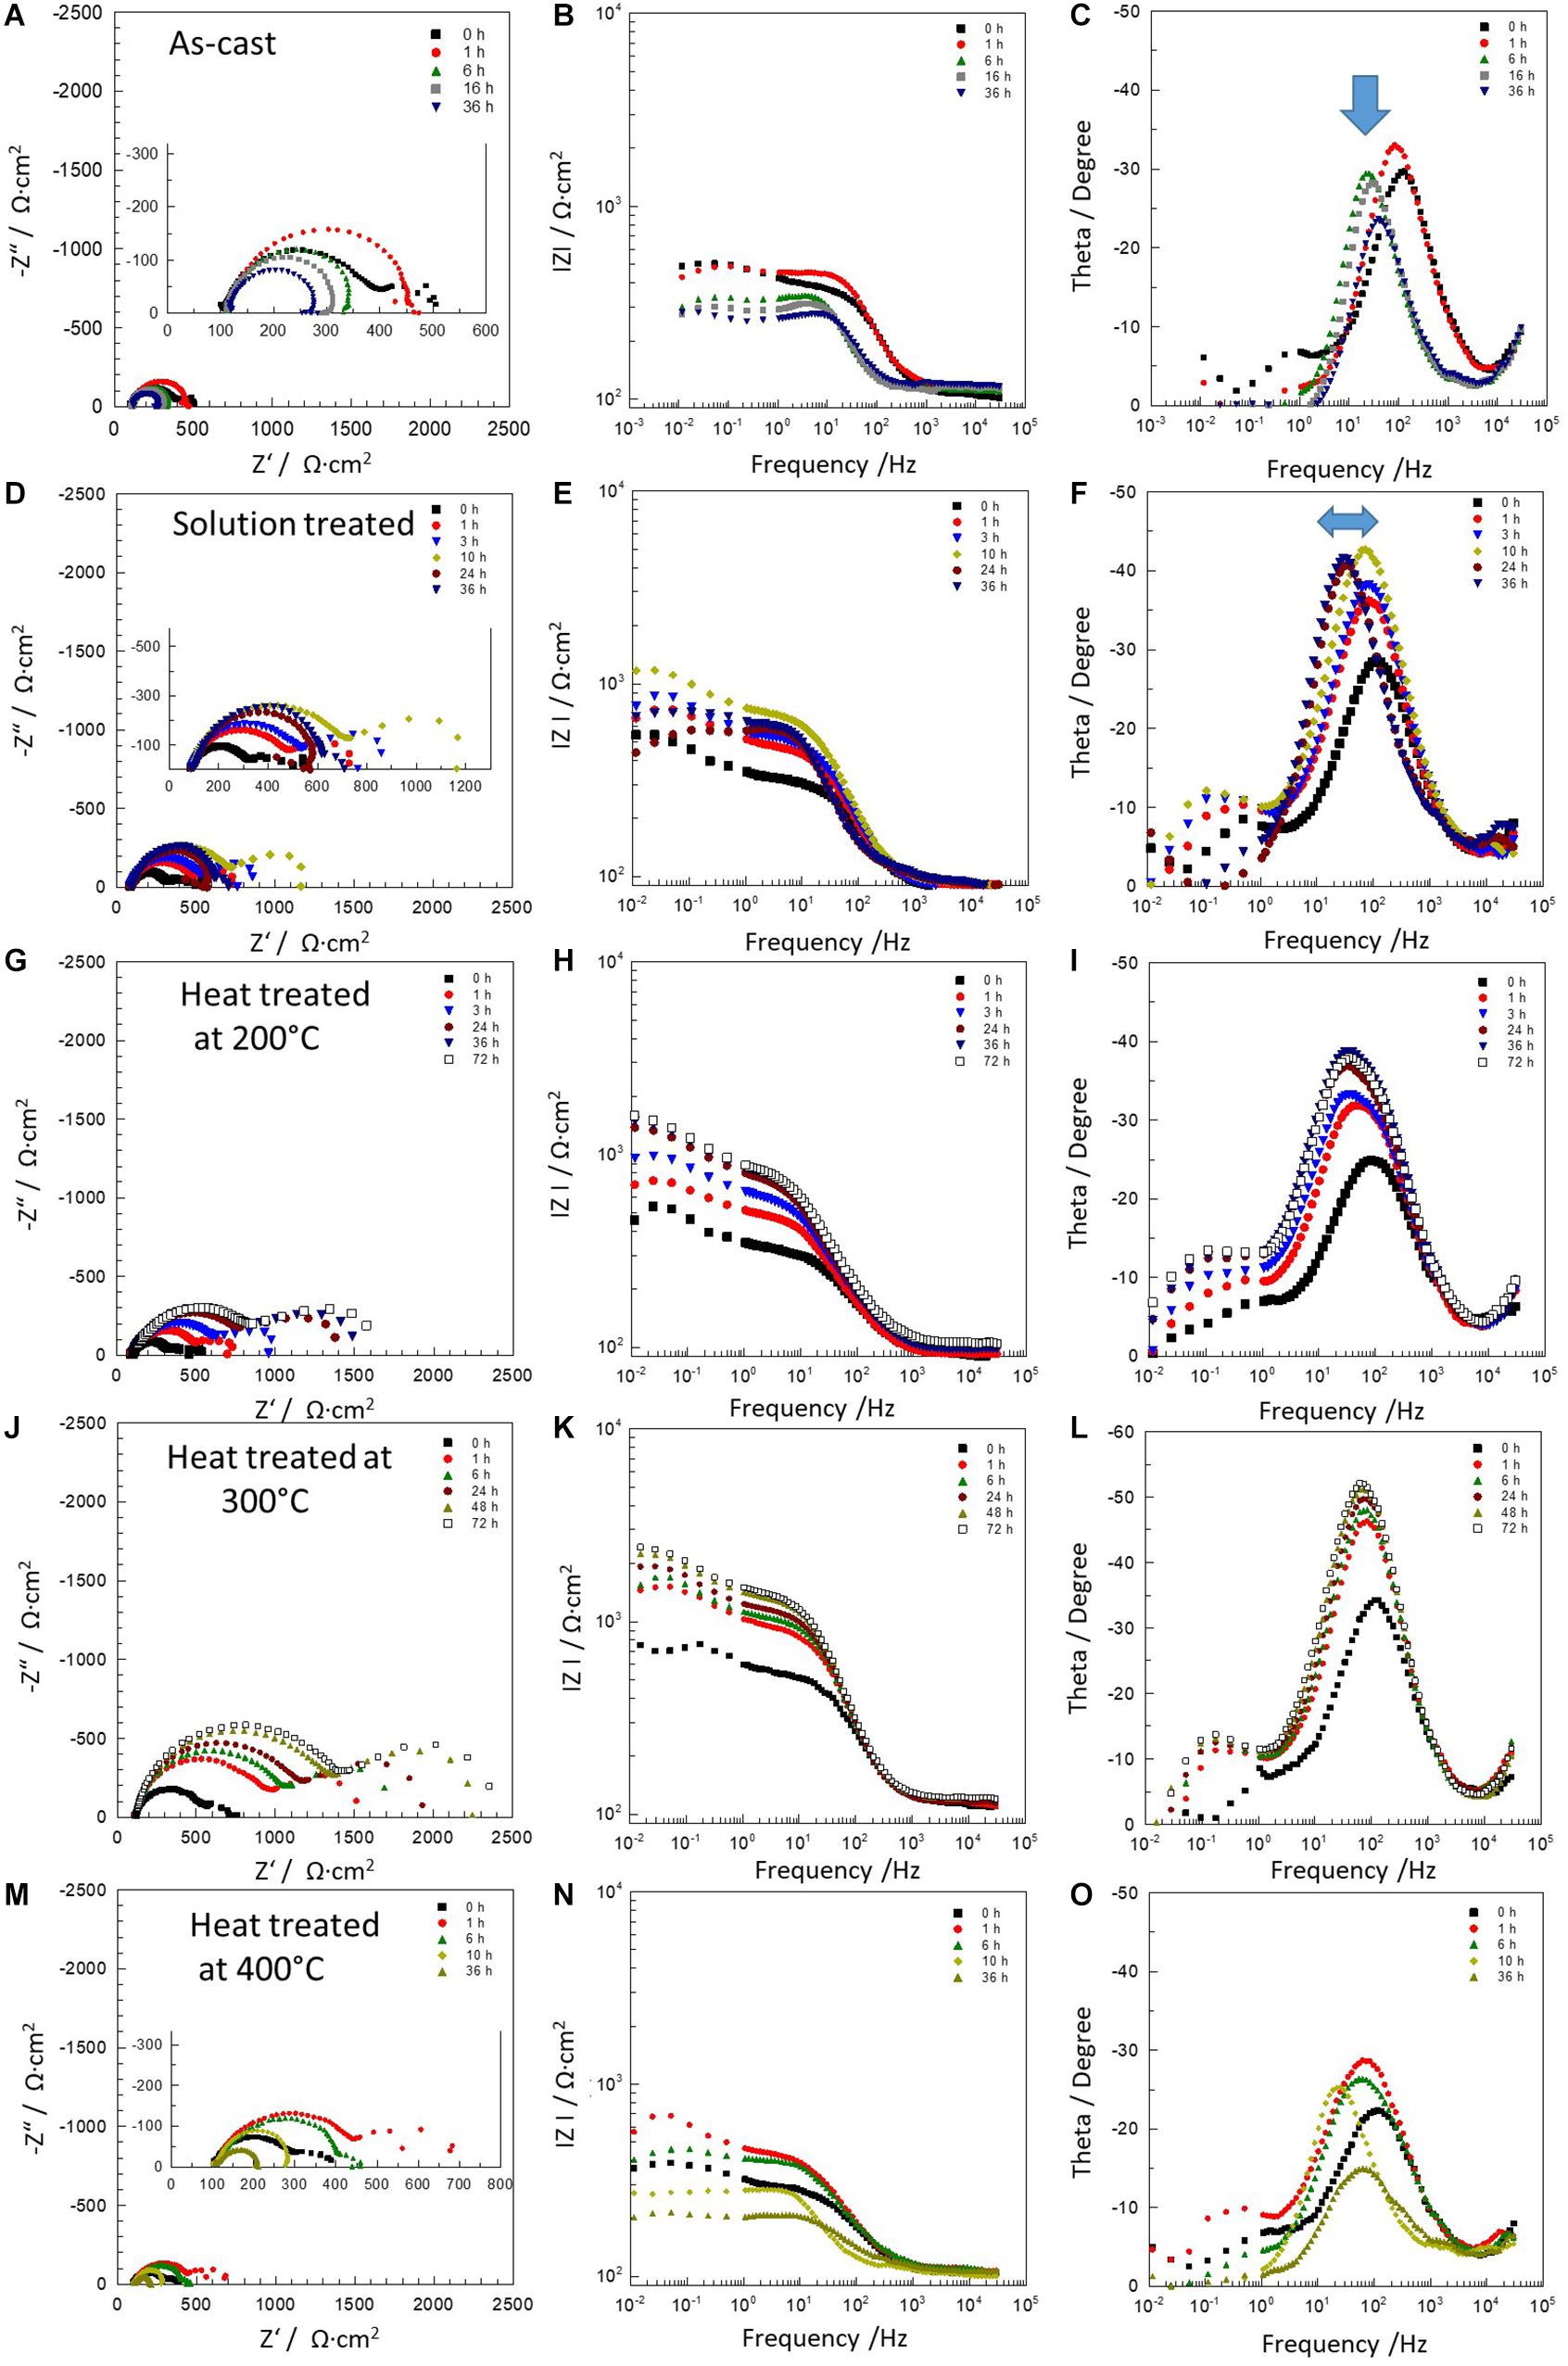
Figure 6. Electrochemical impedance spectra of Mg-10Gd alloys: as-cast (A–C), solution treated (D–F) and heat treated at 200°C (G–I), 300°C (J–L) and 400°C (M–O). Where the blue arrow indicates the displacement of the time constant from high frequencies to middle frequencies.
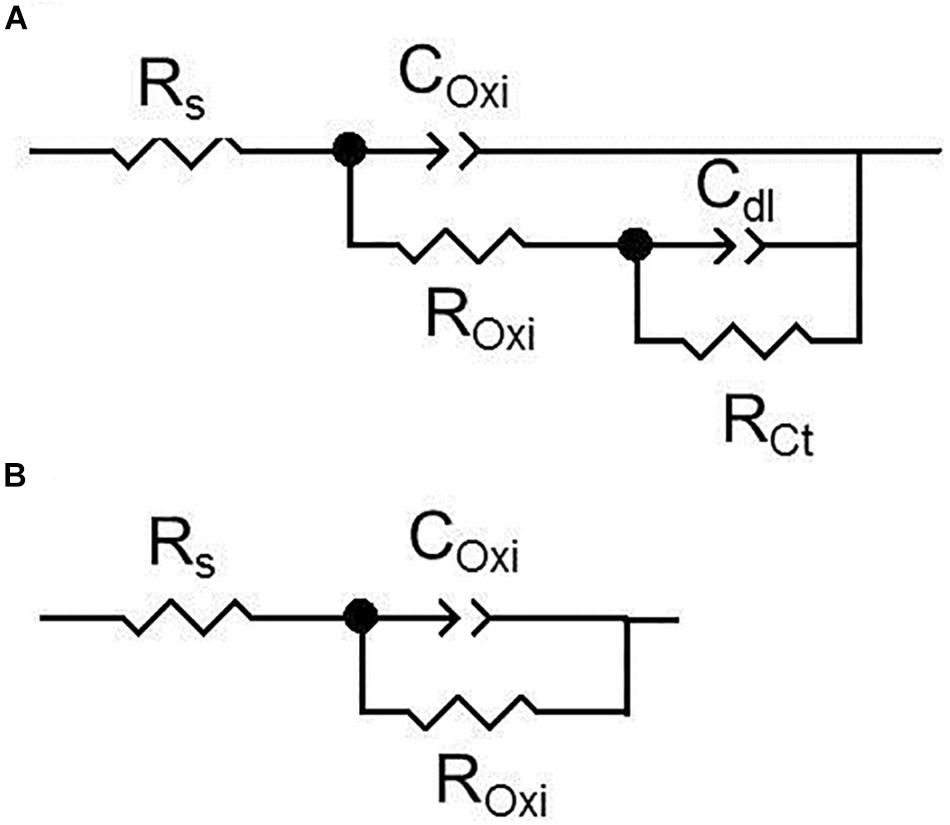
Figure 7. (A,B) Equivalent electrical circuits used to simulate EIS spectra for as-cast, solution treated and heat treatments at 200°C, 300°C and 400°C conditions of Mg-10Gd alloy during different immersion time. Where, Rs is the resistance of the solution, ROxi and COxi are the resistance and capacitance of the oxide film, respectively. RCt represents the charge transfer resistance and Cdl is attributed to the double-layer capacitance (Silva Campos, 2016).
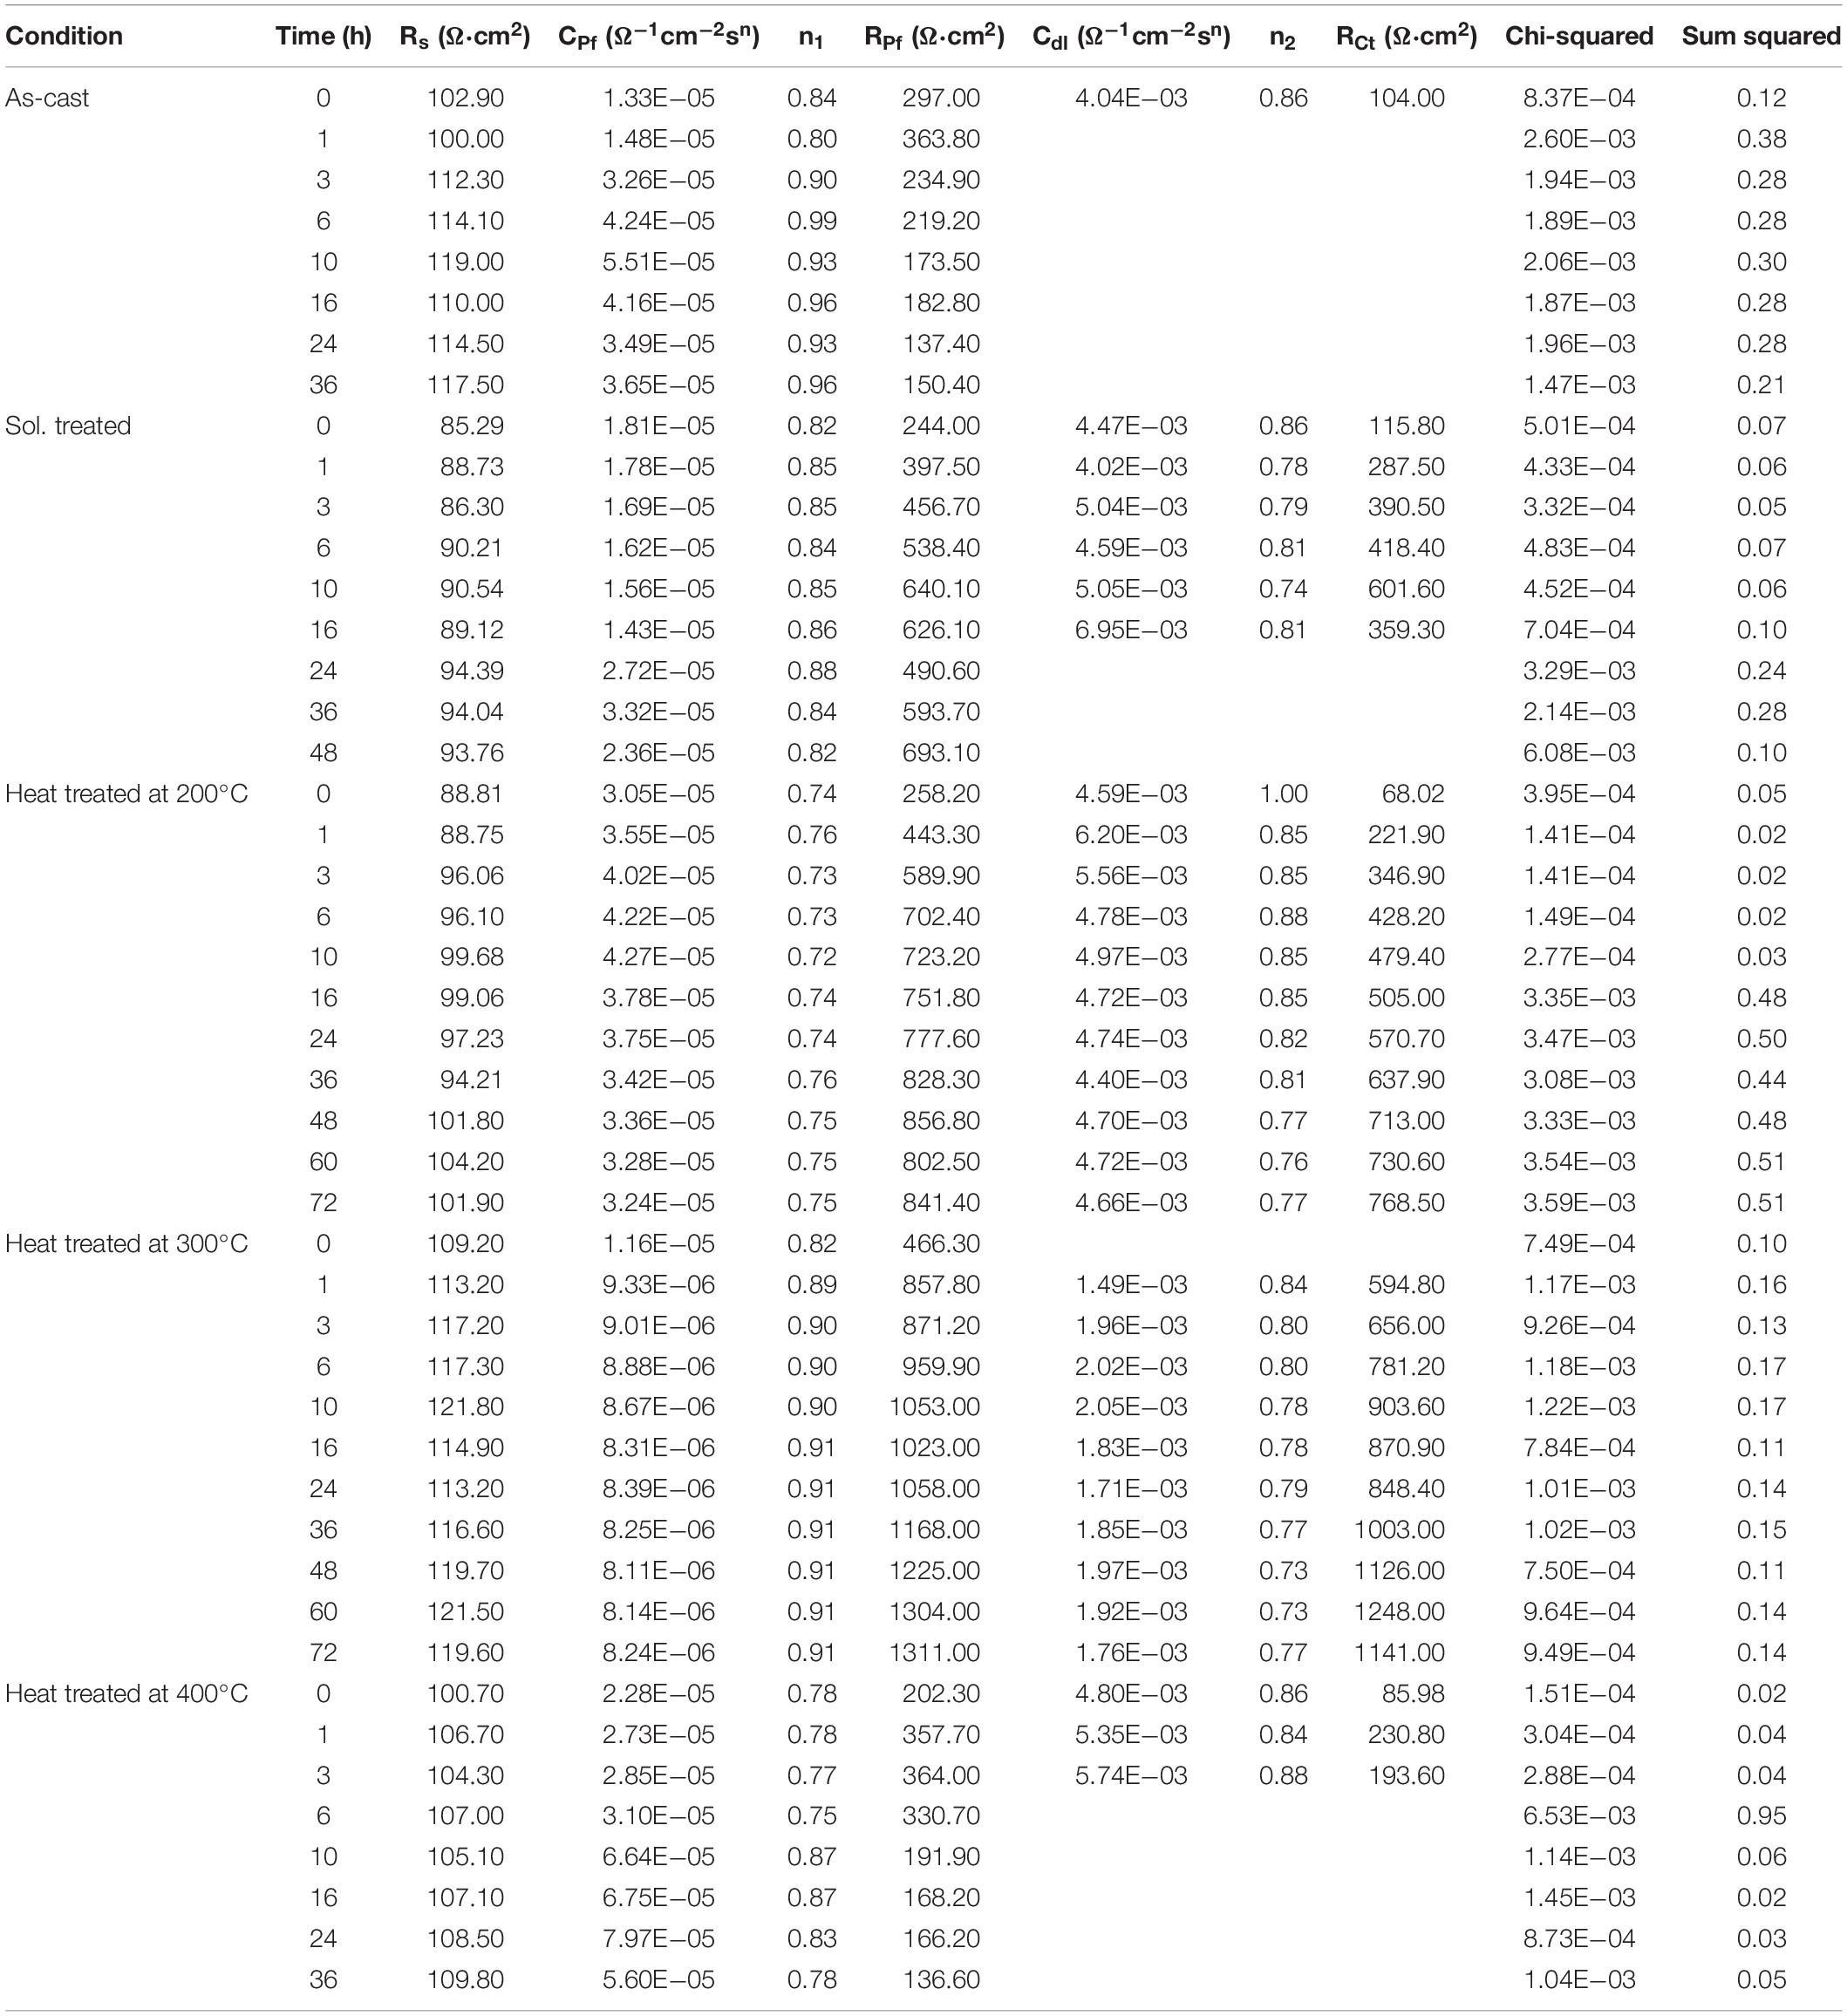
Table 1. Circuit parameters for as-cast condition, solution treated and heat treatments at 200°C, 300°C, and 400°C of Mg10Gd alloy.
For as-cast condition after 1 h immersion one time constant remained visible related to oxide layer formation, while the second time constant is less visible due to a high dissolution activity (Figures 6A–C). Furthermore after 6 h immersion the high frequencies constant (≈102 Hz) was shifted toward middle frequencies values (≈101 Hz), indicating that the surface film was less protective on the alloy surface. For solution treated sample two well defined time constants were observed during the first 10 h of immersion (Figures 6D–F). The film improved its barrier properties and thus the resistance was increased. After 24 h, the protective layer began to fail due to localized corrosion, which was related to a slight shift of the first time constant as observed in the as-cast condition. Heat treated at 200°C sample showed two time constants during full immersion period. The impedance modulus at low frequencies increased with the exposure time indicating increase of barrier properties of corrosion products on the surface (Figures 6G–I). Similar behavior was observed for the heat treated at 300°C sample. Moreover at this condition Mg-10Gd alloy showed the highest impedance modulus above 2000 Ω⋅cm2 at 0.01 Hz. The heat treatment at 300°C promotes formation of an oxide layer more stable and thicker with increased immersion times (Figures 6J–L). However, the sample heat treated at 400°C depicted strong degradation of the oxide layer already after 1 h immersion, revealing a rapid breakdown of the corrosion products layer and the corrosion process was dominated by local active areas without protective film (see Figures 6M–O).
To compare the results, the total resistance (RT) is displayed in Figure 8, as the sum of ROxi and RCt. The starting resistance values were all similar which is consistent with the polarization results. Remarkable differences are developing only with longer immersion times. Compared to the as-cast condition all heat treated specimens exhibited a better corrosion behavior. The solution treated and heat treated at 400°C specimen contained larger amounts of the GdH2 precipitates and showed less stable passive film indicated by earlier film breakdown and active local corrosion spreading with time over the whole surface. The as-cast condition had large Mg5Gd precipitates and no uniform solid solution distribution of Gd in the Mg matrix. Obviously, this is detrimental for a uniform film formation. A homogenized Gd distribution in the matrix and uniformly distributed small Mg5Gd precipitates are supporting obviously the passive film formation (heat treatments at 200°C and 300°C).
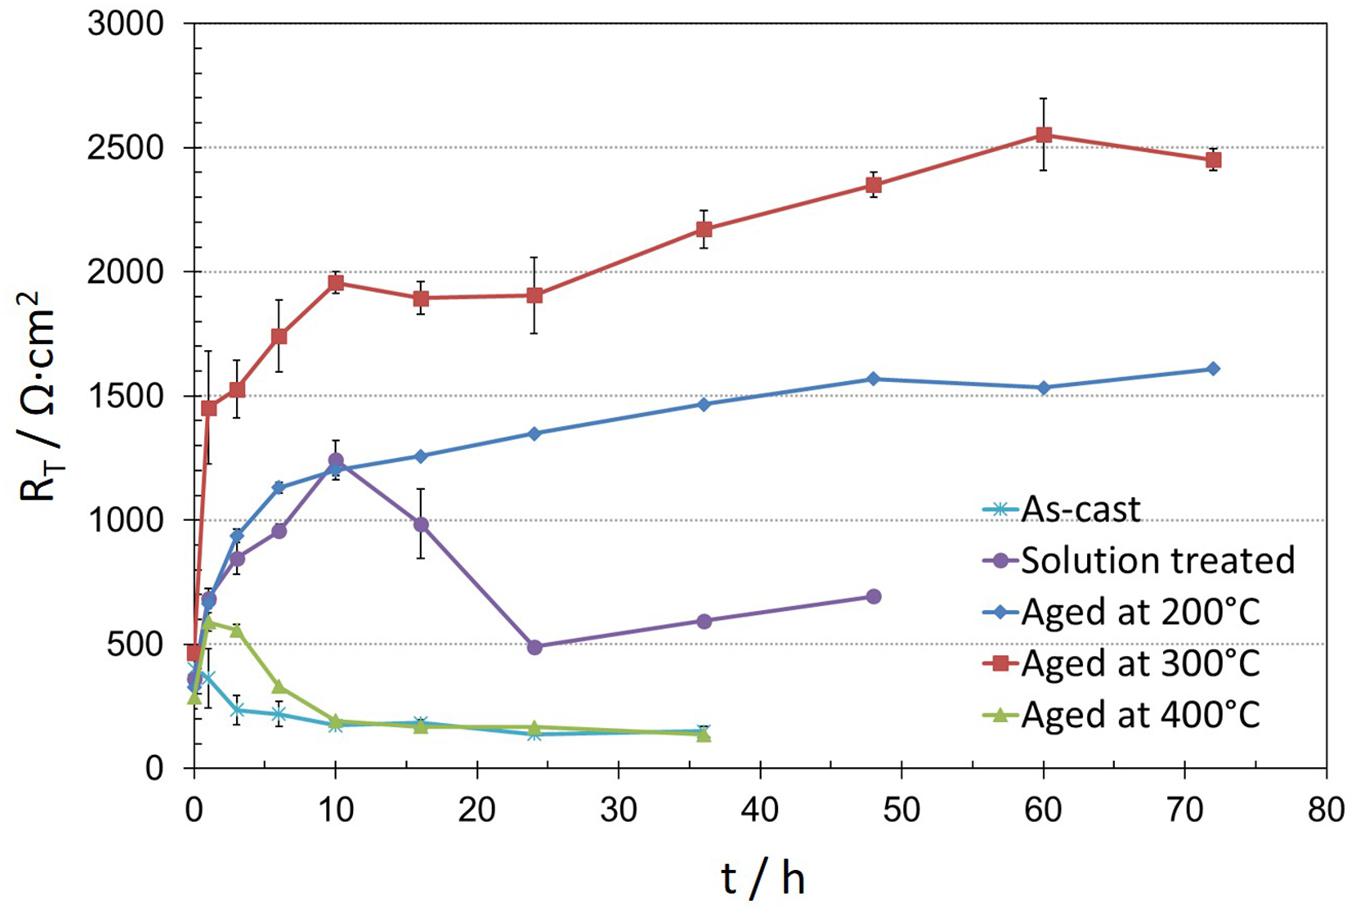
Figure 8. Average evolution of total resistance (RT) values obtained after fitting EIS spectra of as-cast, solution treated and heat treatments at 200°C, 300°C and 400°C conditions of Mg-10Gd versus immersion time in 0.5 wt.% NaCl solution.
Hydrogen Evolution and Weight Loss
Figure 9 shows the corrosion rates determined by hydrogen evolution and weight loss measurements for samples of the as-cast and the heat treated Mg-10Gd alloy. The values calculated from hydrogen evolution measurements were comparable with those obtained from mass loss results. Similar corrosion rates of about 5 mm/y were observed for the samples of Mg-10Gd alloy in the as-cast, heat treated at 200°C and 300°C conditions. While the corrosion rate in the solution treated sample increased to almost twice the rate of the as-cast alloy. The sample heat treated at 400°C showed a corrosion rate of 31.04 and 25.11 mm/year from hydrogen evolution and mass loss measurements, respectively. This is five to six times greater than the as-cast corrosion rate. Thus, the corrosion rate of the Mg-10Gd alloy is affected not only by the amount of Mg5Gd/GdH2 phases present but also their distribution. The Mg5Gd phase is found in as-cast sample and dissolves during the solid solution treatment. However, during subsequent T6 heat treatments precipitates of either Mg5Gd or other metastable phases form in solid state with the largest particle size observed at 300°C. The corrosion rates are lower for the samples in as-cast condition and heat treated at 200°C and 300°C (Silva Campos, 2016). These results are similar to the findings of Kainer et al. (2009), where they reported that the T6 condition resulted in the lowest corrosion rate due the presence of nano-sized precipitates.
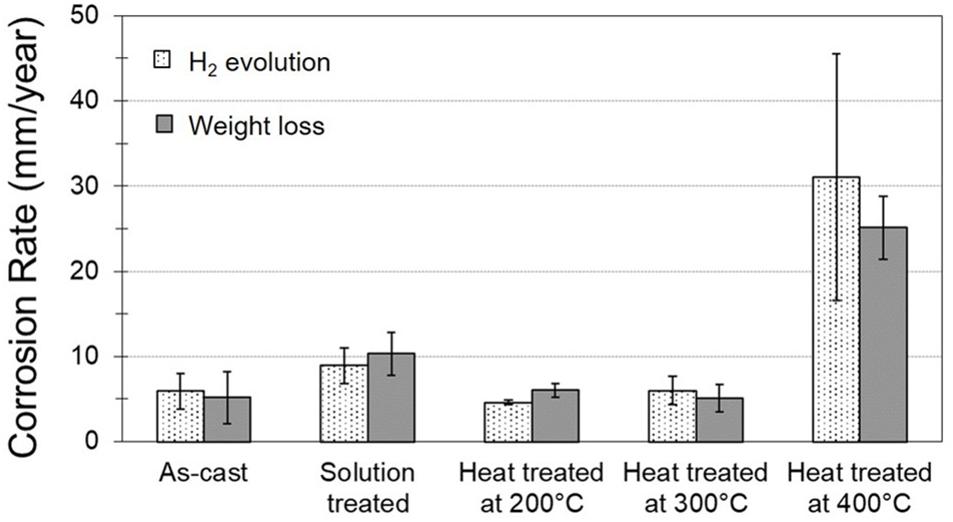
Figure 9. Hydrogen evolution and weight loss of as-cast, solution treated and heat treated at 200°C, 300°C, and 400°C conditions of Mg-10Gd alloy.
Drop Test
In this section, the results are divided into two groups, the first consisting of as-cast Mg-10Gd and the second after the all heat treatments to observe where the corrosion processes start and how they progress over time.
As-cast Mg-10Gd
Figure 10 shows the corrosion process of as-cast Mg-10Gd after different exposure times in 0.5 wt.% NaCl solution. Same selected areas before exposure were add for comparison (Figures 10a,c,e,g). After 10 min of exposure the sample shows slight attack in the α-Mg enriched with Gd areas (green arrows) and already visible attack around the secondary cubic phase (blue dotted circle), Figure 10b, which became stronger after 30 min of exposure. Cavities were generated at the base of the cubic GdH2 and Mg5Gd precipitates (blue dotted circles Figure 10d). Both phases are found close together so at the beginning of the corrosion process it is hard to define which one is more detrimental. However, some Mg5Gd particles remained and the cubic phase disappeared most likely by undermining. From one-hour exposure, the matrix presented small pits (yellow dotted line in Figure 10f). The degradation in the matrix, Mg5Gd phases and Gd enriched zones continued after 5 h exposure, in some areas severe localized corrosion was also observed (Figure 11).
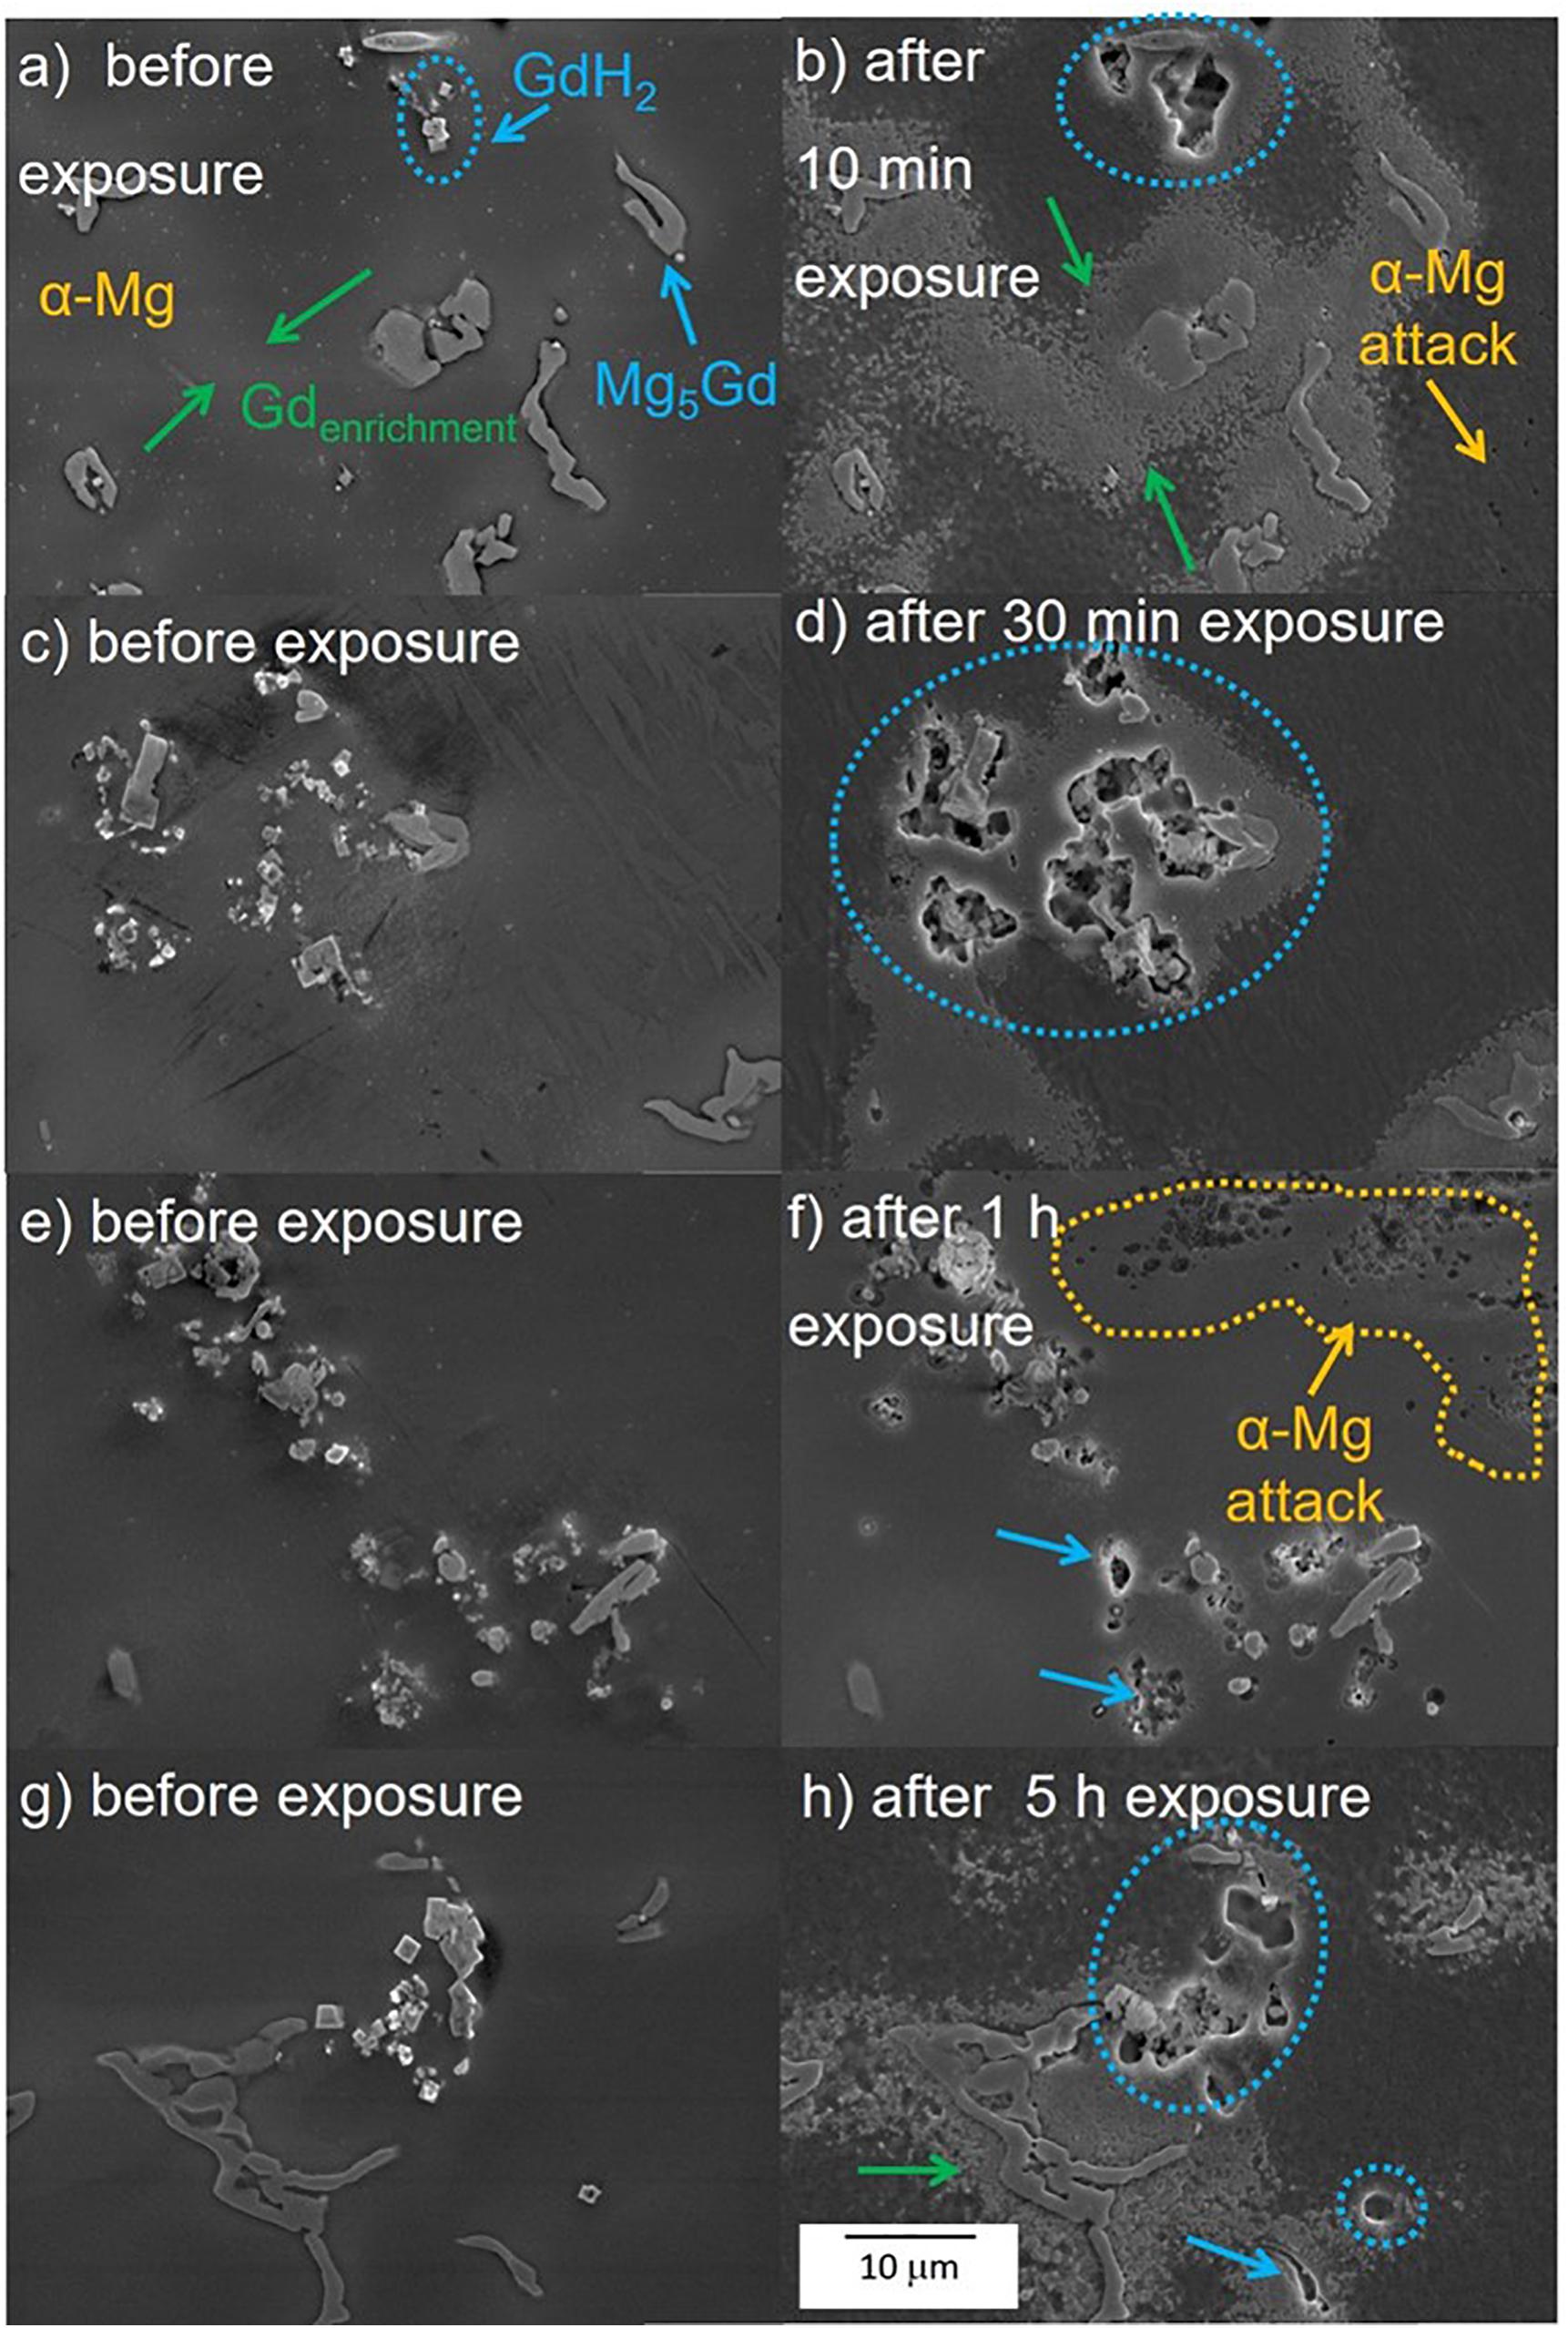
Figure 10. Corrosion monitoring using drop test of as-cast Mg-10Gd alloy (a,c,e,g) before exposure and (b,d,f,h) after different exposure times in 0.5 wt. % NaCl solution. Yellow arrows/dotted areas depict the corrosion attack on the α-Mg matrix, blue arrows/dotted circles indicate corrosion process on the Mg5Gd/GdH2 phases and the green arrows show the corrosion degradation on the Gd enrichment areas.
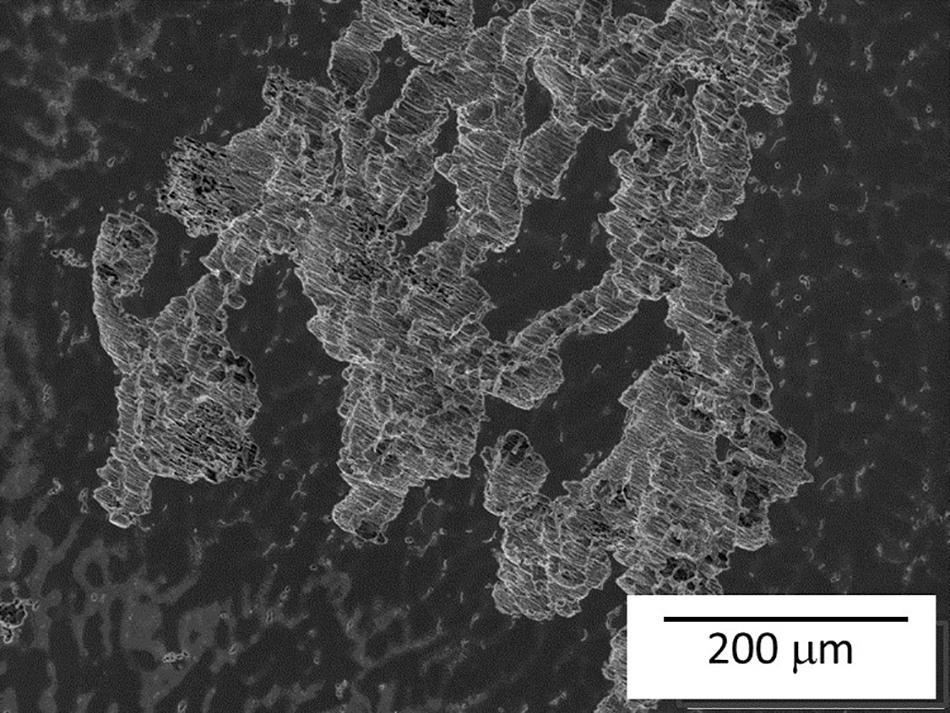
Figure 11. SEM micrograph of severe localized corrosion of as-cast Mg-10Gd alloy after 5 h exposure in 0.5 wt.% NaCl solution.
The cubic phase (GdH2) plays an important role in the corrosion of the as-cast alloy. GdH2 phase causes significantly high corrosion attack, but it is not clear if this phase is removed due to the fast dissolution of the surrounding matrix or by subsequent chromic acid cleaning. However, the larger size of the region under corrosion attack compared with the original particle size is a good indicator of the severity of the galvanic attack. The Mg5Gd phase seems to be less detrimental compared with GdH2 phase at least during the early stages of corrosion, but it still causes dissolution of the surrounding Gd-rich α-Mg (Silva Campos, 2016).
Mg-10Gd after heat treatments
In this section longer immersion periods of 30, 60 min and 3 h were used as shorter exposure periods did not reveal any visible corrosion. Figure 12 shows the corrosion process of the solution treated samples and T6 heat treated at 200°C, 300°C and 400°C samples. In the solution treated samples (Figures 12a–d) the attack began in the α-Mg matrix surrounding GdH2 particles after 60 min exposure (see orange arrows, Figure 12c). After 3 h exposure, Figure 12d, only minor changes in size and number were visible. The sample heat treated at 200°C (Figures 12e,f) showed similar attack as in the solution treated sample but it has a more widespread localized attack after exposure for 60 min (see yellow arrows Figures 12g,h). However, in the sample heat treated at 300°C (Figures 12i,j) the size of Mg5Gd precipitates was the highest and there was no visible corrosion attack for up to 1 h exposure (Figure 12k). After three hours, localized attack occurred in a comparable amount to the other conditions (Figure 12l). However, the treatment did not prevent the advance of severe localized corrosion in other areas of the specimen (Figure 13). While in heat treated at 400°C sample (Figures 12m–p), the first corrosion signal was also observed after 60 min of exposure (Figure 12o) and after 3 h immersion corrosion spread in areas close to the GdH2 precipitates (orange dotted circles) generating more degradation in the matrix, Figure 12p.
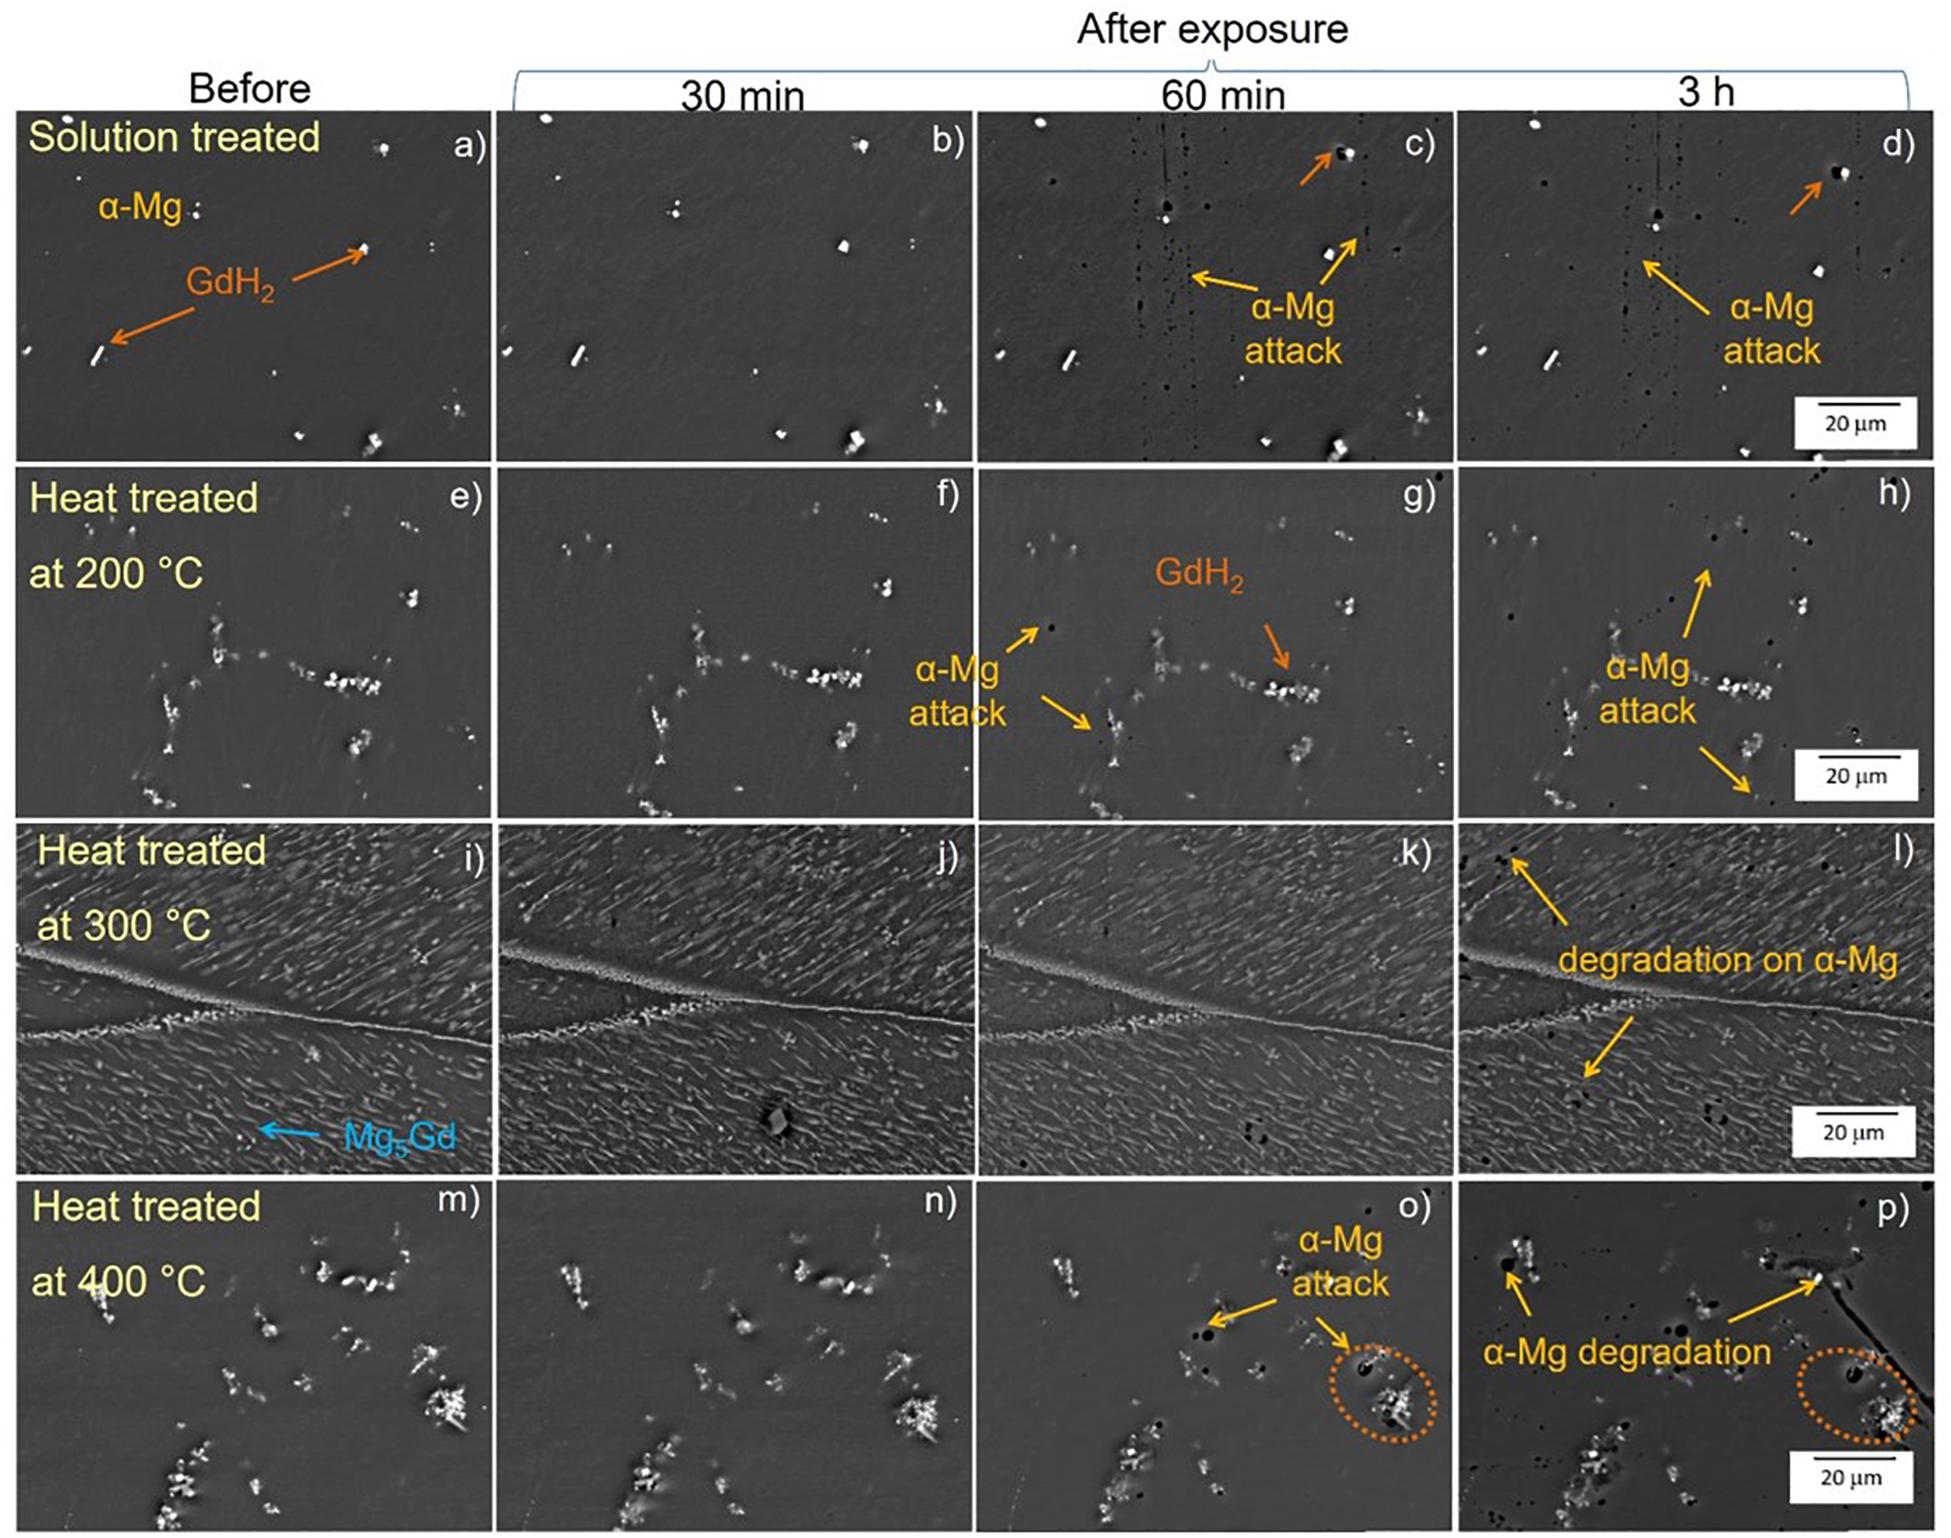
Figure 12. Corrosion monitoring using drop test of solution treated (a–d) and heat treated at 200°C (e–h), 300°C (i–l) and 400°C (m–p) of Mg-10Gd alloy after 30, 60 min and 3 h time exposure in 0.5 wt.% NaCl solution. Yellow arrows depict the corrosion attack on the α- Mg matrix, orange arrows/dotted circles indicate corrosion process on the GdH2 phases.
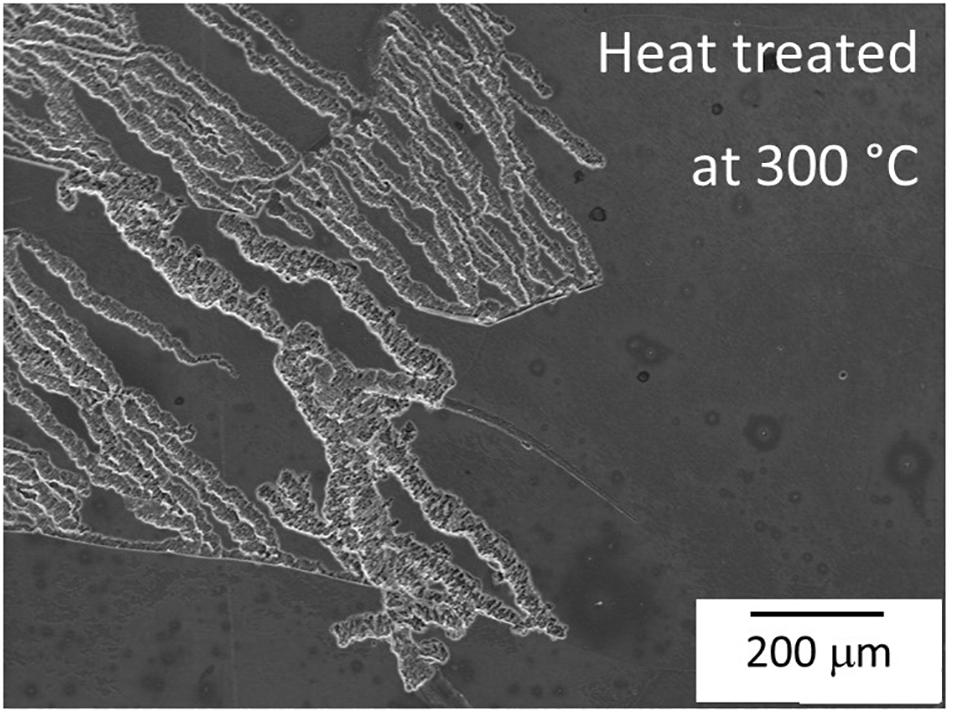
Figure 13. SEM micrograph of severe localized corrosion of heat treated Mg-10Gd at 300°C after 3 h exposure in 0.5 wt.% NaCl solution.
The homogenization of Gd distribution in the matrix has positive effect in increasing the time required for the first observation of localized corrosion. For the solution treated, heat treated at 200°C and 300°C samples, the corrosion is relatively uniform and not detrimental for the overall corrosion resistance.
In contrast, heat treatment at 400°C seems to increase the amount of GdH2 precipitates in the matrix and their presence influence the localized attack with a detrimental effect on the corrosion behavior. Localized corrosion now occurs close to the agglomeration of the bright white cubic GdH2 precipitates (Silva Campos, 2016).
Discussion
In the current work, the Mg5Gd phase has been shown to cause only minor negative effects on corrosion behavior when distributed in the following conditions:
(i) in as-cast condition with some Gd enriched zones surrounding the larger Mg5Gd precipitates, reducing the local damage due to galvanic couples, (ii) if most of the Gd is in solid solution in the matrix and there is only a moderate amount of GdH2 phase, and (iii) when the volume fraction of Mg5Gd phase is larger but this phase is uniformly distributed and precipitates are small (aged at 200 and 300°C).
The most critical phases are not Mg5Gd, but the small cubic shaped particles rich in Gd which are most likely to be GdH2. The mechanism of initiation and progress of the micro-galvanic corrosion of the as-cast, T4 and T6 heat treated Mg-10Gd alloys as observed in the current investigation is presented in Figure 14 (Silva Campos, 2016). According to this mechanism, once the specimen is exposed to the solution, two corrosion morphologies occur depending on the Gd distribution.
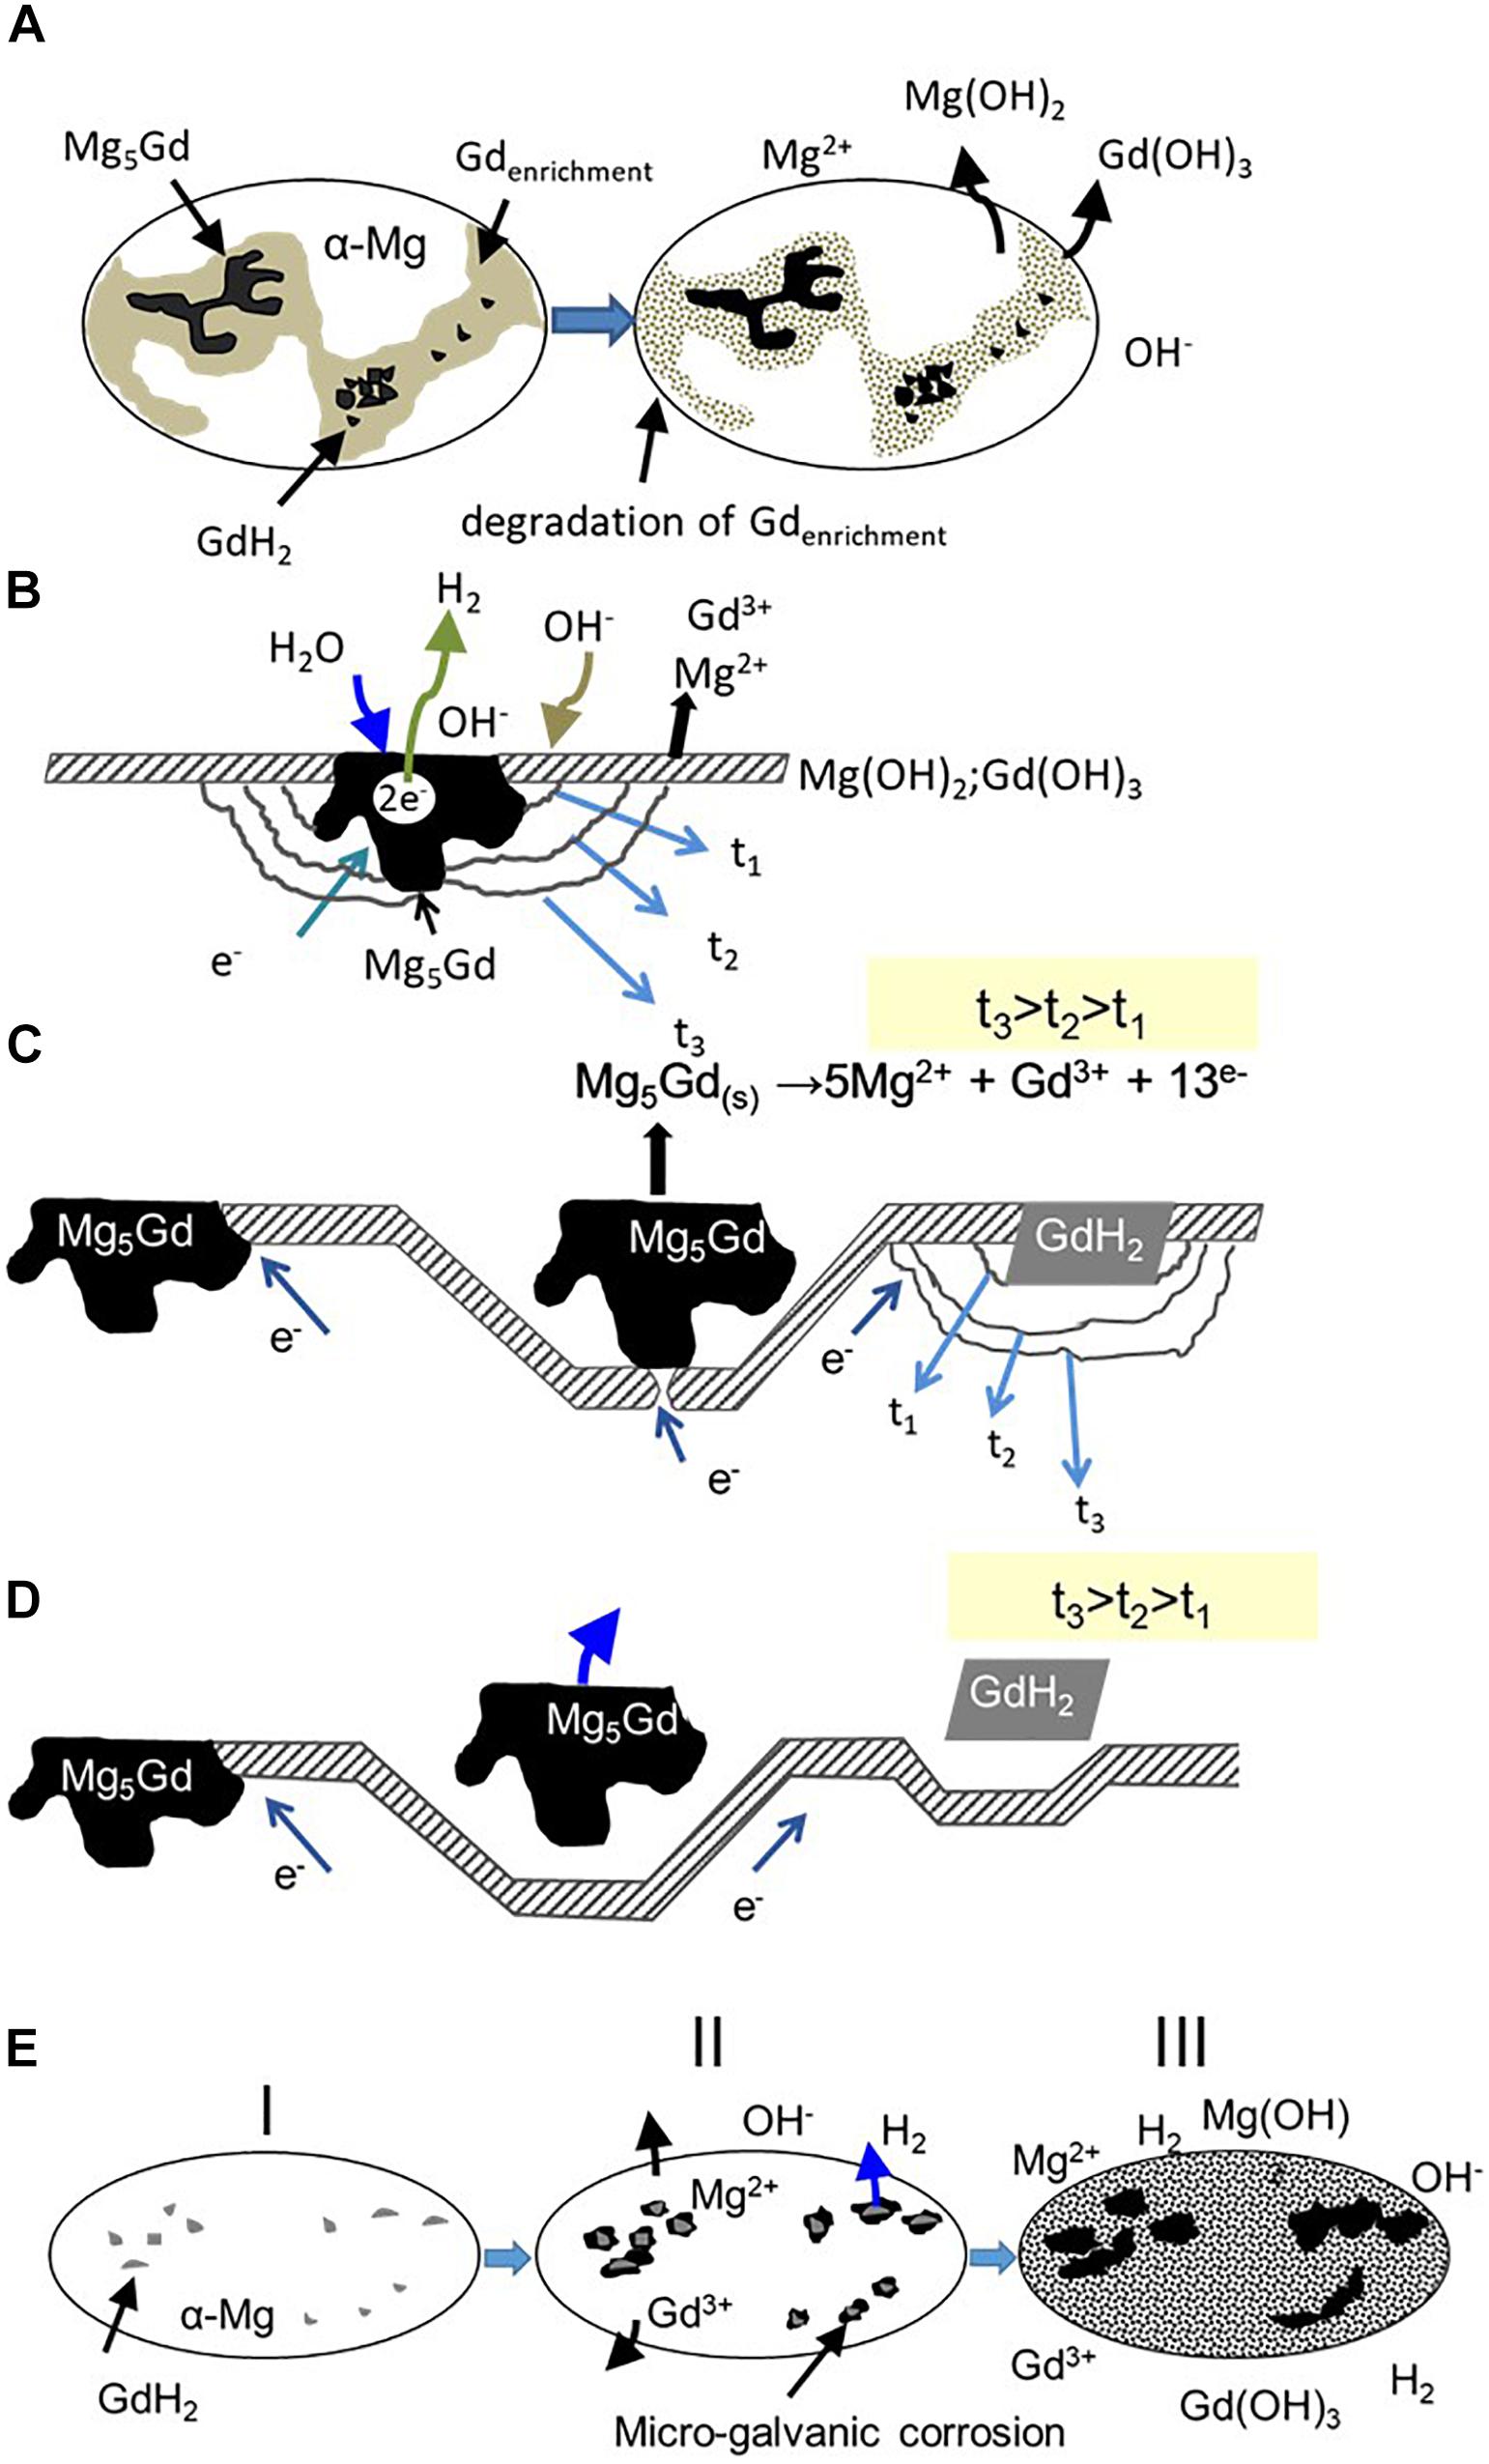
Figure 14. Mechanism of micro-galvanic corrosion proposed for Mg-10Gd alloy: (A) formation of Gd and Mg hydroxides on the surface in as-cast condition, (B) degradation of the Mg matrix adjacent to Mg5Gd phases, (C) higher dissolution of Mg matrix, exposing the Mg5Gd/GdH2 phases subsequently starts the dissolution of Mg5Gd phase due to reducing contact area, (D) detachment and dissolution of Mg5Gd/GdH2 phases, and (E) localized micro-galvanic corrosion at preferential areas for samples heat treated.
Firstly, formation of a Gd(OH)3 layer, since Gd has a more negative electrode potential compared to Mg (Pourbaix, 1974; Bala et al., 1993). Secondly Mg(OH)2 layer forms on the surface in as-cast condition due to degradation of Gd enriched areas and some α-Mg matrix, as result of metal dissolution (Pourbaix, 1974; Song et al., 1997a, b; Song and Atrens, 1999; Kainer et al., 2010), according to the reactions (1–6), Figure 14A. These layers are normally not continuous due to the presence of the intermetallic (Mg5Gd/GdH2) phases (Song and Atrens, 2003). EDX analysis of the corrosion products layer confirmed the presence of the oxide layer, which was mainly formed by MgO/Mg(OH)2 and Gd2O3/Gd(OH)3Gd, together with some carbonates. The carbonate can form from atmospheric CO2 dissolved in the aqueous electrolyte (Figure 15; Silva Campos, 2016). The noble intermetallic Mg5Gd/GdH2 phases are driving this process because they are the places where the cathodic partial reaction takes place, as there is no stable passive film on the intermetallics Figure 14B. The micro-galvanic activity continues as long as there is contact between the intermetallic Mg5Gd/GdH2 phases as cathodes and matrix as anode. If contact is lost in the latter stages the Mg5Gd/GdH2 phases are not cathodically protected anymore and starts to corrode as the phase is less stable than the matrix in NaCl solutions (Silva Campos et al., 2013). However, it is not necessary that contact is fully lost to start degradation. It is enough when the reduced contact does not allow sufficient current flow anymore to fully protect the Mg5Gd/GdH2 (Figures 14C,D).
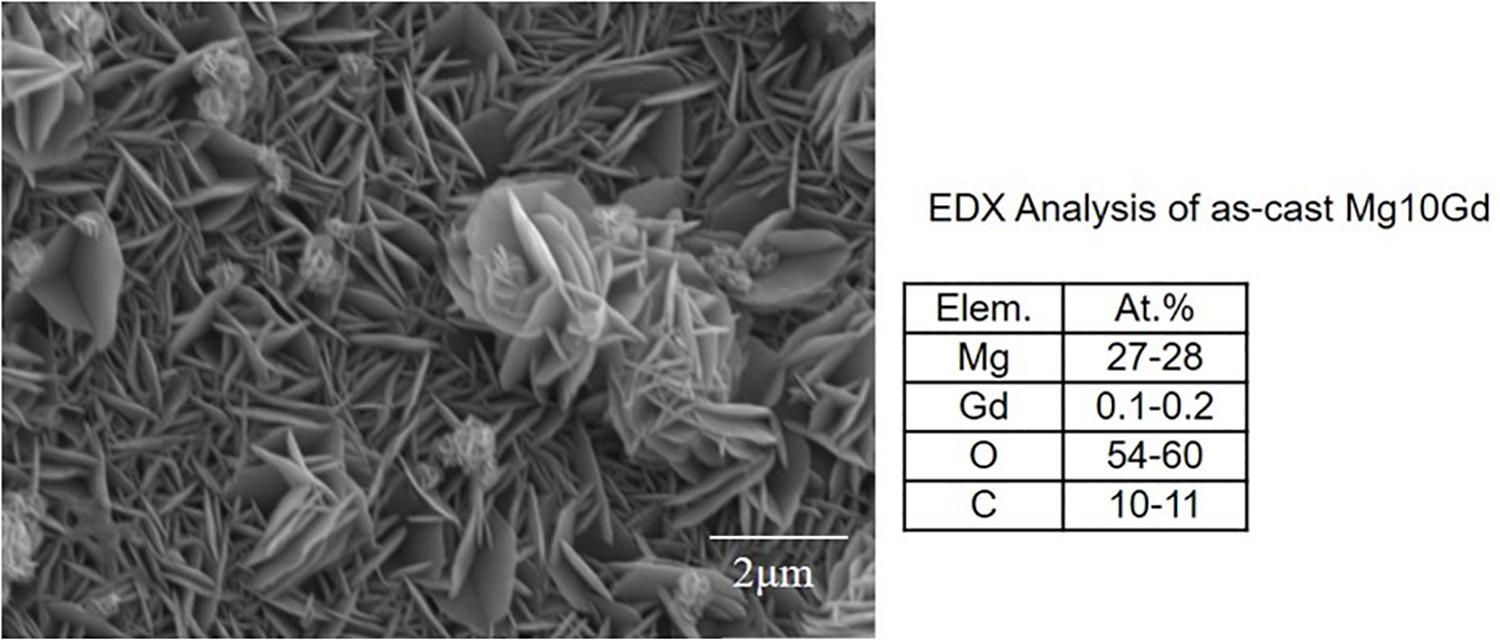
Figure 15. Surface morphology of pure as-cast Mg-10Gd and EDX analysis of the oxide layer after exposure in 0.5% NaCl solution.
When the specimens do not contain Gd enriched zones (heat treated samples), galvanic corrosion begins with hydrogen evolution (5) on the cathodic GdH2 phase, while the dissolution of Mg (4) develops at the adjacent matrix areas Figures 14E I,II. A minor contribution to the corrosion process is added due to the presence of Mg5Gd phase only in the heat treated at 200°C and 300°C conditions. In some cases a strong dissolution of adjacent matrix areas favors the intermetallic phase detachment (Figure 14E III), but also dissolution which is possible for the GdH2 phase because of own poor stability if it is not cathodically protected anymore as also shown for Mg5Gd phases (Figure 14D). Similar corrosion mechanism was proposed by Coy et al. (2010) using scanning Kelvin probe force microscopy (SKPFM) for ZE41 and WE43 alloys. They found a preferential attack of the matrix adjacent to the T-phase, after some time, Zr-rich interactions zones, including regions and intermetallic phases become the next favorable sites for corrosion in ZE41 alloy. For WE43 alloy using SKPFM evaluations a relatively higher Volta potential difference between the Mg matrix and Zr-rich precipitates was observed, which promotes localized galvanic attack at the adjacent areas to the cathodic micro-constituent phases. In that way the severity of the galvanic attack is related to the effectiveness of each micro-constituent as cathode (Coy et al., 2010).
In the present study, focused on Mg-10Gd modified by different heat treatments, the initiation and progress of the corrosion process was only monitoring by SEM and it was revealed that the galvanic corrosion mainly depends on the amount and distribution of the cathodic phases. In summary, a low amount of cathodic phases (GdH2 and impurities) without Gd enrichment zones are detrimental for corrosion resistance (in solution treated condition, Figure 14E), while the combination of large amount of Mg5Gd uniformly distributed and Gd enrichment zones enhance the corrosion behavior of this alloy. There is no negative influence of the grain boundaries as proposed in Coy et al. (2010) if Gd is presented. Altogether the situation is relatively complex with more noble but less chemically stable intermetallic phase in the Mg matrix and depending on the situation not only matrix dissolution and particle undermining/detachment can be observed but also dissolution of the intermetallics if not enough protecting current can be provided by the dissolving matrix. Latter is strongly influenced by the microstructure of the specimens.
It is important to notice that fine precipitates causes a more uniform attack and they have less negative effects on passive film formation. The EIS spectra corroborate the presence of an oxide layer at high frequencies. For as-cast specimen, this protective layer was only stable up to the first 60 min of immersion. The protective layer showed relatively better stability and protection after all heat treatments, but only at 200°C and 300°C, stable films can develop during immersion in chloride solutions. However, the layer formed after heat treatment at 200°C showed a COxi of around 3–4 × 10⁻⁵ Ω-1cm–2sn and in the sample aged at 300°C it was 8–9 × 10⁻⁶ Ω–1cm–2sn. Thus, the thin protective film is thicker on the 300°C specimen, which correlates also with the overall higher resistance values. The resistance may increase not only due to increased thickness but also the layer can be more protective with the time (denser, less porous). The same is true for the heat treated at 200°C specimens, but the layer remains less protective. For solution treated and heat treated at 400°C specimens, the film is not stable. It partially dissolves or breakdown occurs and the resistance is much lower compared to the other aged specimens. This behavior also confirms the tendency observed in the hydrogen evolution and weight loss measurements. Thus, the long-term corrosion behavior is governed by the passive film formation during immersion and breakdown (Silva Campos, 2016).
Conclusion
The higher solid solution solubility of Gd in α-Mg matrix allows tailoring the corrosion resistance of Mg-10Gd alloy. The relatively good corrosion behavior in as-cast condition is due to formation of Gd enrichment zones, which reduce the local damage due to galvanic corrosion between the Mg5Gd phase other noble phases (e.g., GdH2) and α-Mg matrix.
Among the different heat treatments, the alloy shows a better corrosion resistance when the intermetallic phases are fine and/or uniformly distributed within the specimens. Galvanic corrosion depends on the amount and the distribution of the cathodic phases, small amount of larger Mg5Gd precipitates without Gd enrichment zones is detrimental for corrosion resistance, while the combination of large amount of fine Mg5Gd precipitates uniformly distributed in a Gd enriched matrix enhance the corrosion behavior of this alloy.
The preferential attack of the matrix adjacent to small intermetallic particles promote a uniform surface without potential differences as soon as they are detached from the matrix. Alternatively, they can be covered more easily by a growing protective film. The hydroxide films have low conductivity thus they are inhibiting the water reduction reaction on the particles by reducing the exchange current.
Protective film formation is more uniform on the heat treated alloy; because the microstructure is more uniform and the larger amount of alloying elements in solid solution are ready for oxide/hydroxide formation.
Data Availability Statement
All datasets generated for this study are included in the article/Supplementary Material.
Author Contributions
MS and CB conceived and designed the study. MS, CM, TZ, and DP performed the experiments. CB, TZ, DP, and MZ contributed the reagents, materials, and analysis tools. MS, CB, CM, MM, TZ, DP, and MZ analyzed and discussed the data. MS wrote the manuscript. CB, CM, MM, TZ, DP, MZ, and KK reviewed and edited the manuscript. All authors read and approved the manuscript.
Funding
The financial support from the CONACyT-DAAD 176552/304358-A/08/72584 for Mrs. Silva Campos’s fellowship in Helmholtz-Zentrum Geesthacht is acknowledged. M. Mohedano is grateful to MICINN (Spain) RYC-2017-21843.
Conflict of Interest
The authors declare that the research was conducted in the absence of any commercial or financial relationships that could be construed as a potential conflict of interest.
Acknowledgments
The authors are grateful to Mr. W. Punessen and Mr. G. Meister for the preparation of alloys, Mr. G. Wiese, Mr. V. Heitmann, and Mr. V. Kree for SEM investigations, Mr. U. Burmester for the technical support. Partial results of the presented work are based on the Ph.D. thesis of Mrs. Silva Campos http://tubdok.tub.tuhh.de/handle/11420/1321.
Supplementary Material
The Supplementary Material for this article can be found online at: https://www.frontiersin.org/articles/10.3389/fmats.2020.00084/full#supplementary-material
References
Ambat, R., Aung, N. N., and Zhou, W. (2000). Studies on the influence of chloride ion and pH on the corrosion and electrochemical behaviour of AZ91D magnesium alloy. J. Appl. Electrochem. 30, 865–874.
Apps, P. J., Karimzadeh, H., King, J. F., and Lorimer, G. W. (2003a). Phase compositions in magnesium-rare earth alloys containing yttrium, gadolinium or dysprosium. Scripta Mater. 48, 475–481. doi: 10.1016/s1359-6462(02)00509-2
Apps, P. J., Karimzadeh, H., King, J. F., and Lorimer, G. W. (2003b). Precipitation reactions in Magnesium-rare earth alloys containing Yttrium. Gadolinium or Dysprosium. Scripta Mater. 48, 1023–1028. doi: 10.1016/s1359-6462(02)00596-1
Arrabal, R., Matykina, E., Pardo, A., Merino, M. C., Paucar, K., Mohedano, M., et al. (2012a). Corrosion behaviour of AZ91D and AM50 magnesium alloys with Nd and Gd additions in humid environments. Corrosion Sci. 55, 351–362. doi: 10.1016/j.corsci.2011.10.038
Arrabal, R., Pardo, A., Merino, M., Paucar, K., Mohedano, M., Casajus, P., et al. (2012b). Influence of Gd on the corrosion behavior of AM50 and AZ91D magnesium alloys. Corrosion 68, 398–410. doi: 10.5006/0010-9312-68.5.398
Arrabal, R., Pardo, A., Merino, M. C., Mohedano, M., Casajús, P., Paucar, K., et al. (2011). Oxidation Behavior of AZ91D Magnesium Alloy Containing Nd or Gd. Oxidation Metals 76, 433–450. doi: 10.1007/s11085-011-9265-3
Bala, H., Szymura, S., Pawłowska, G., and Rabinovich, Y. M. (1993). Effect of impurities on the corrosion behaviour of neodymium. J. Appl. Electrochem. 23, 1017–1024. doi: 10.1007/bf00266123
Ben-Hamu, G., Eliezer, D., and Shin, K. (2007). The role of Si and Ca on new wrought Mg–Zn–Mn based alloy. Mater. Sci. Eng. 447, 35–43. doi: 10.1016/j.msea.2006.10.059
Birbilis, N., Easton, M. A., Sudholz, A. D., Zhu, S. M., and Gibson, M. A. (2009). On the corrosion of binary magnesium-rare earth alloys. Corrosion Sci. 51, 683–689. doi: 10.1016/j.corsci.2008.12.012
Carlson, B. E., and Jones, J. W. (1993). “The metallurgical aspects of the corrosion behaviour of cast Mg-Al alloys,” in Proceedings of the International Symposium on Light Metals Processings and Applications, Quebec City, 833–847.
Coy, A. E., Viejo, F., Skeldon, P., and Thompson, G. (2010). Susceptibility of rare-earth-magnesium alloys to micro-galvanic corrosion. Corrosion Sci. 52, 3896–3906. doi: 10.1016/j.jmbbm.2016.11.014
Froats, A., Aune, T. K. R., Hawke, D., Unsworth, W., and Hillis, J. E. (1987). Corrosion of magnesium and magnesium alloys. ASM Handb. 13, 740–754.
Gandel, D., Birbilis, N., Easton, M., and Gibson, M. (2010). “Influence of manganese, zirconium and iron on the corrosion of magnesium,” in Proceedings of Corrosion & Prevention (Preston, VIC: Australasian Corrosion Association), 875–885.
Gao, X., He, S., Zeng, X., Peng, L., Ding, W., and Nie, J. (2006). Microstructure evolution in a Mg–15Gd–0.5 Zr (wt.%) alloy during isothermal aging at 250 C. Mater. Sci. Eng. 431, 322–327. doi: 10.1016/j.msea.2006.06.018
Hanawalt, J. D., Nelson, C. E., and Peloubet, J. A. (1942). Corrosion studies of magnesium and its alloys. Am. Inst. Mining Metall. Eng. 147, 273–299.
Hillis, J. E. (1998). The Effects of Heavy Metal Contamination on Magnesium Corrosion Performance. Warrendale, PA: SAE.
Hort, N., Huang, Y., Fechner, D., Störmer, M., Blawert, C., Witte, F., et al. (2010). Magnesium alloys as implant materials–Principles of property design for Mg–RE alloys. Acta Biomater. 6, 1714–1725. doi: 10.1016/j.actbio.2009.09.010
Hu, H., Nie, X., and Ma, Y. (2014). “Corrosion and surface treatment of magnesium alloys,” in Magnesium Alloys - Properties in Solid and Liquid States, ed. F. Czerwinski (London: IntechOpen), 67–109.
Huang, Y., Yang, L., Wang, Z., Kainer, K. U., and Hort, N. (2013). “Influences of Dy content and heat treatments on the formation of hydrides in Mg-Dy alloys,” in Proceedings of the 3rd International Conference of Engineering Against Failure (ICEAF III), Kos.
Huang, Y., Yang, L., You, S., Gan, W., Kainer, K. U., and Hort, N. (2016). Unexpected formation of hydrides in heavy rare earth containing magnesium alloys. J. Magn. Alloys 4, 173–180. doi: 10.1016/j.jma.2016.08.002
Kainer, K. U., Bala Srinivasan, P., Blawert, C., and Dietzel, W. (2010). “3.09 - corrosion of magnesium and its alloys,” in Shreir’s Corrosion, eds B. Cottis, M. Graham, R. Lindsay, S. Lyon, T. Richardson, D. Scantlebury, et al. (Oxford: Elsevier), 2011–2041.
Kainer, K. U., Hort, N., Willumeit, R., and Feyerabend, F. (2009). “Magnesium alloys for the design of medical implants,” in Proceedings of the 18th International Symposium on Processing and Fabrication of Advanced Materials, eds M. Morinaga, M. Niinomi, M. Nakai, N. Bhatnagar, and T. S. Srivatsan Sendai, 975–984.
Li, H.-Z., Liu, H.-T., Guo, F.-F., Wang, H.-J., Liang, X.-P., and Liu, C.-M. (2011). Effect of ageing time on corrosion behavior of Mg-10Gd-4.8Y-0.6Zr extruded-alloy. Trans. Nonferrous Metals Soc. China 21, 1498–1505. doi: 10.1016/s1003-6326(11)60887-x
Liu, M., Schmutz, P., Uggowitzer, P. J., Song, G., and Atrens, A. (2010). The influence of yttrium (Y) on the corrosion of Mg–Y binary alloys. Corrosion Sci. 52, 3687–3701. doi: 10.1016/j.corsci.2010.07.019
Liu, W., Cao, F., Zhong, L., Zheng, L., Jia, B., Zhang, Z., et al. (2009). Influence of rare earth element Ce and La addition on corrosion behavior of AZ91 magnesium alloy. Mater. Corrosion 60, 795–803. doi: 10.1002/maco.200805179
Makar, G. L., and Kruger, J. (1990). Corrosion studies of rapidly solidified magnesium alloys. J. Electrochem. Soc. 137, 414–421.
Meza-García, E. (2010). Influence of Alloying Elements on the Microstructure and Mechanical Properties of Extruded Mg-Zn Based Alloys. Dissertation PhD thesis, Technische Universität Berlin, Berlin.
Mohedano, M., Arrabal, R., Pardo, A., Paucar, K., Merino, M. C., Matykina, E., et al. (2014). Galvanic corrosion of rare earth modified AM50 and AZ91D magnesium alloys coupled to steel and aluminium alloys. Rev. Metal. 50:e002. doi: 10.3989/revmetalm.002
Morales, E. D., Ghali, E., Hort, N., Dietzel, W., and Kainer, K. U. (2003). Corrosion behaviour of magnesium alloys with RE additions in sodium chloride solutions. Mater. Sci. Forum 41, 867–872. doi: 10.4028/www.scientific.net/msf.419-422.867
Nayyeri, M. J., and Khomamizadeh, F. (2011). Effect of RE elements on the microstructural evolution of as cast and SIMA processed Mg–4Al alloy. J. Alloys Compounds 509, 1567–1572. doi: 10.1016/j.jallcom.2010.10.147
Nishijima, M., and Hiraga, K. (2007). Structural changes of precipitates in an Mg-5 at% Gd alloy studied by transmission electron microscopy. Mater. Trans. 48, 10–15. doi: 10.2320/matertrans.48.10
Peng, Q., Huang, Y., Meng, J., Li, Y., and Kainer, K. U. (2011). Strain induced GdH2 precipitate in Mg–Gd based alloys. Intermetallics 19, 382–389. doi: 10.1016/j.intermet.2010.11.001
Pourbaix, M. (1974). Atlas of Electrochemical Equilibria in Aqueous Solutions. Houston, TX: National Association of Corrosion Engineers.
Reichek, K. N., Clark, K. J., Hillis, J. E., and Engineers, S. O. A. (1985). Controlling the Salt Water Corrosion Performance of Magnesium AZ91 Alloy. Warrendale, PA: SAE.
Rokhlin, L. L. (2003). Magnesium Alloys Containing Rare Earth Metals: Structure and Properties. Abignton: Taylor & Francis.
Rosalbino, F., Angelini, E., De Negri, S., Saccone, A., and Delfino, S. (2006). Electrochemical behaviour assessment of novel Mg-rich Mg–Al–RE alloys (RE=Ce. Er). Intermetallics 14, 1487–1492. doi: 10.1016/j.intermet.2006.01.056
Shi, Z., Cao, F., Song, G.-L., Liu, M., and Atrens, A. (2013). Corrosion behaviour in salt spray and in 3.5% NaCl solution saturated with Mg(OH)2 of as-cast and solution heat-treated binary Mg–RE alloys: RE=Ce, La, Nd, Y, Gd. Corrosion Sci. 76, 98–118. doi: 10.1016/j.corsci.2013.06.032
Silva Campos, M. D. R., Scharnagl, N., Blawert, C., and Kainer, K. U. (2013). “Improving corrosion resistance of Mg10Gd alloy,” in Materials Science Forum, ed. Y. Zhao (Switzerland: Trans Tech Publication), 673–677. doi: 10.4028/www.scientific.net/msf.765.673
Silva Campos, R. (2016). The role of Intermetallics Phases in the Corrosion of Magnesium-Rare Earth Alloys. Dissertation PhD thesis, Hamburg University of Technology (TUHH), Hamburg HH. doi: 10.15480/882.1318
Silva Campos, R., Höche, D., Blawert, C., and Kainer, K. U. (2011). “Influence of lanthanum concentration on the corrosion behaviour of binary Mg-La alloys,” in Magnesium Technology, ed. H. E. Friedrich (Hoboken, NJ: John Wiley & Sons, Inc), 507–511. doi: 10.1002/9781118062029.ch94
Song, G., and Atrens, A. (2003). Understanding magnesium corrosion—a framework for improved alloy performance. Adv. Eng. Mater. 5, 837–858. doi: 10.1002/adem.200310405
Song, G., Atrens, A., John, D. S., Wu, X., and Nairn, J. (1997a). The anodic dissolution of magnesium in chloride and sulphate solutions. Corrosion Sci. 39, 1981–2004. doi: 10.1016/s0010-938x(97)00090-5
Song, G., Atrens, A., Stjohn, D., Nairn, J., and Li, Y. (1997b). The electrochemical corrosion of pure magnesium in 1 N NaCl. Corrosion Sci. 39, 855–875. doi: 10.1016/s0010-938x(96)00172-2
Song, G. L., and Atrens, A. (1999). Corrosion mechanisms of magnesium alloys. Adv. Eng. Mater. 1, 11–33.
Sudholz, A. D., Gusieva, K., Chen, X. B., Muddle, B. C., Gibson, M. A., and Birbilis, N. (2011). Electrochemical behaviour and corrosion of Mg–Y alloys. Corrosion Sci. 53, 2277–2282. doi: 10.1016/j.corsci.2011.03.010
Takenaka, T., Ono, T., Narazaki, Y., Naka, Y., and Kawakami, M. (2007). Improvement of corrosion resistance of magnesium metal by rare earth elements. Electrochim. Acta 53, 117–121. doi: 10.1016/j.jmbbm.2011.12.011
Tie, D., Feyerabend, F., Hort, N., Hoeche, D., Kainer, K. U., Willumeit, R., et al. (2014). In vitro mechanical and corrosion properties of biodegradable Mg–Ag alloys. Mater. Corrosion 65, 569–576. doi: 10.1002/maco.201206903
Unsworth, W. (1989). The role of rare earth elements in the development of magnesium base alloys. Int. J. Mater. Product Technol. 4, 359–378.
Victoria-Hernandez, J., Hernandez-Silva, D., Bohlen, J., Yi, S. B., and Letzig, D. (2013). Low temperature superplasticity of hydrostatically extruded Mg-Al-Zn alloys. Mater. Sci. Forum 735, 307–315. doi: 10.4028/www.scientific.net/msf.735.307
Vostrý, P., Smola, B., Stulíková, I., Von Buch, F., and Mordike, B. L. (1999). Microstructure evolution in isochronally heat treated Mg–Gd alloys. Phys. Status Sol. 175, 491–500. doi: 10.1002/(sici)1521-396x(199910)175:2<491::aid-pssa491>3.0.co;2-f
Keywords: Mg corrosion, rare earth – Gd, Mg5Gd phase, Gd enrichment, EIS
Citation: Silva Campos MR, Blawert C, Mendis CL, Mohedano M, Zimmermann T, Proefrock D, Zheludkevich ML and Kainer KU (2020) Effect of Heat Treatment on the Corrosion Behavior of Mg-10Gd Alloy in 0.5% NaCl Solution. Front. Mater. 7:84. doi: 10.3389/fmats.2020.00084
Received: 24 May 2019; Accepted: 20 March 2020;
Published: 15 April 2020.
Edited by:
Zuhua Zhang, Hunan University, ChinaReviewed by:
Liang Wu, Chongqing University, ChinaJohn L. Provis, University of Sheffield, United Kingdom
Copyright © 2020 Silva Campos, Blawert, Mendis, Mohedano, Zimmermann, Proefrock, Zheludkevich and Kainer. This is an open-access article distributed under the terms of the Creative Commons Attribution License (CC BY). The use, distribution or reproduction in other forums is permitted, provided the original author(s) and the copyright owner(s) are credited and that the original publication in this journal is cited, in accordance with accepted academic practice. No use, distribution or reproduction is permitted which does not comply with these terms.
*Correspondence: Maria del Rosario Silva Campos, bWFyaWEuc2lsdmFAaHpnLmRl