 Jan E. Schnabel
 Ingo Scheider
- Institute of Materials Research, Materials Mechanics, Helmholtz-Zentrum Geesthacht, Geesthacht, Germany
A crystal plasticity model of the creep behavior of alloys with lamellar microstructures is presented. The model is based on the additive decomposition of the plastic strain into a part that describes the instantaneous (i.e., high strain rate) plastic response due to loading above the yield point, and a part that captures the viscoplastic deformation at elevated temperatures. In order to reproduce the transition from the primary to the secondary creep stage in a physically meaningful way, the competition between work hardening and recovery is modeled in terms of the evolving dislocation density. The evolution model for the dislocation density is designed to account for the significantly different free path lengths of slip systems in lamellar microstructures depending on their orientation with respect to the lamella interface. The established model is applied to reproduce and critically discuss experimental findings on the creep behavior of polysynthetically twinned TiAl crystals. Although the presented crystal plasticity model is designed with the creep behavior of fully lamellar TiAl in mind, it is by no means limited to these specific alloys. The constitutive model and many of the discussed assumptions also apply to the creep behavior of other crystalline materials with lamellar microstructures.
1 Introduction
In high-temperature applications, the resistance to creep and thermomechanical fatigue are the key criteria for the choice of structural materials. After decades of intense research, the mechanisms behind the creep behavior of the well-established high-temperature structural materials like, for example, Ni-based super alloys are well understood, and as a result, their creep resistance has been optimized to a great extent. As the weight of components and the resulting mass forces are highly relevant in most high-temperature applications, there is, however, an ongoing search for lightweight alternatives to these commonly used alloys. In this context, intermetallic titanium aluminide (TiAl) alloys have frequently been discussed as promising candidates to replace the much heavier conventional alloys (Appel et al., 2011). Due to their beneficial combination of high specific strengths and good thermomechanical properties (Appel et al., 2011), TiAl alloys open up a significant weight-saving perspective, provided they are used to their full potential. This does, however, necessitate profound understanding of their high-temperature (creep) behavior ideally manifested in a comprehensive constitutive model.
In TiAl alloys, creep becomes relevant, starting from 650°C to 700°C Appel et al., (2011) and is influenced by many factors like composition, processing, or microstructure Appel et al., (2011), Zhang and Deevi (2003). When it comes to creep resistance, TiAl alloys with fully lamellar microstructures have consistently been reported to show the best properties with creep rates that are at least one order of magnitude smaller than in duplex microstructures Appel et al., (2011), Zhang and Deevi (2003), Maruyama et al., (1997).
1.1 Fully Lamellar Microstructures in TiAl
In TiAl alloys, fully lamellar microstructures mainly consist of two intermetallic phases, namely, the γ phase and to a minor fraction of the
Within each colony, there is a strict orientation relation between the lattices of the γ and the
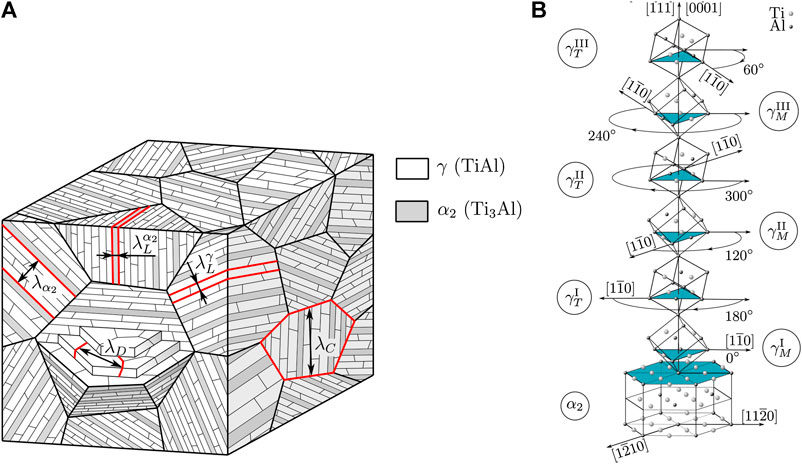
FIGURE 1. Left: Schematic depiction of the coextisting microstructural interfaces in fully lamellar TiAl.
Due to the strict orientation relation between the lattices of the γ and the
• longitudinal (
• mixed (
• transversal (
Table 1 summarizes all slip and twinning systems in the γ and the
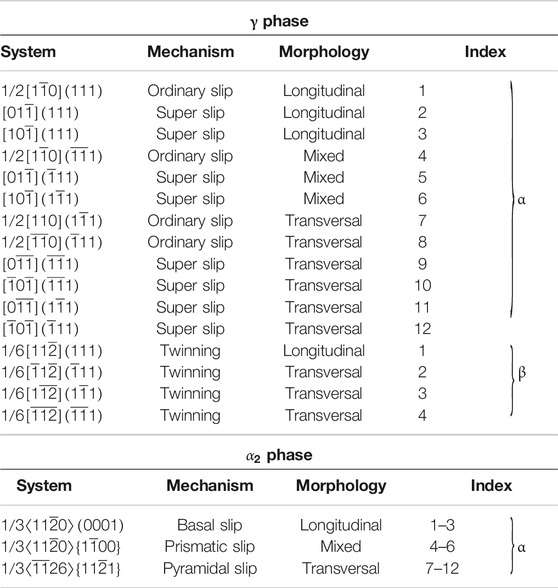
TABLE 1. Slip and twinning systems in the tetragonal γ and hexagonal
Figure 2 illustrates the deformation modes that correspond to the different morphological classes.
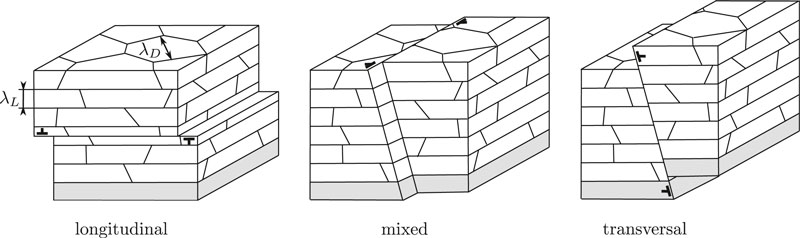
FIGURE 2. Schematic illustration of the morphological deformation modes of the lamellae. The morphological classification was introduced in Lebensohn et al., (1998).
1.1.1 Polysynthetically Twinned Crystals
Investigating the plastic deformation of fully lamellar microstructures and in particular the underlying micromechanics is a cumbersome task and often suffers from problems in separating the contributions of different microstructural boundaries or deformation mechanisms/systems. In fact, most of the understanding of the micromechanics of fully lamellar TiAl has been gained from experiments with the so-called polysynthetically twinned (PST) crystals. PST crystals are macroscopic specimens that only contain lamellae of one specific orientation, that is, they basically represent a single colony without the influence of the neighboring colonies. First reported in Fujiwara et al., (1990), PST crystals helped to reveal many of the intricate details of the highly anisotropic, plastic deformation of the lamellar colonies in fully lamellar TiAl (see, e.g., Kishida et al., (1998), Umakoshi and Nakano (1992, 1993), Fujiwara et al., (1990), Inui et al., (1992b), Yao et al., (1995), Umeda et al., (1997), Uhlenhut (1999), Bartels and Uhlenhut (1998)) and served as the starting point for most micromechanical modeling efforts (see, e.g., Lebensohn et al., (1998), Zambaldi et al., (2011), Roos et al., (2004), Parteder et al., (1995), Schlögl and Fischer (1996, 1997b, 1997a), Grujicic and Batchu (2001), Werwer and Cornec (2000, 2006)).
1.2 Creep Characteristics of Fully Lamellar TiAl
Throughout this article, creep is discussed in terms of the commonly observed three creep stages Kassner (2009), which are schematically shown in Figure 3.
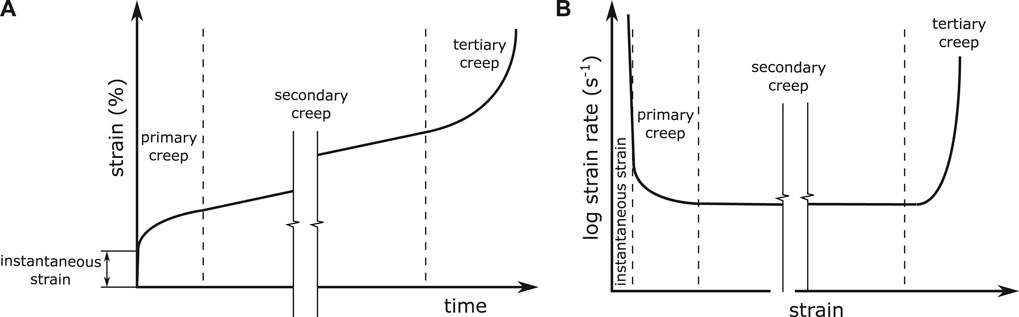
FIGURE 3. Illustration of a creep curve with the three typically observed creep stages.
During primary creep, the density of stored dislocations
1.2.1 Frequent Absence of Secondary Creep Stage
Most of a component’s life is usually spent in the secondary creep stage. Therefore, the creep resistance of different alloys is often compared in terms of their steady-state creep rates
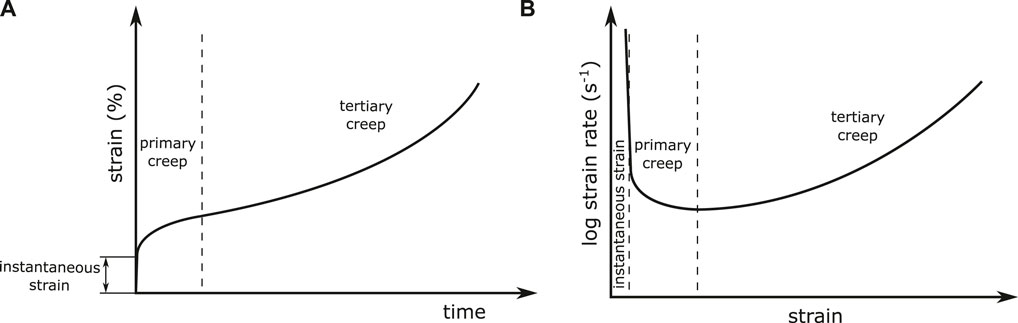
FIGURE 4. Illustration of a creep curve that does not show a secondary creep stage.
As it will become clear in the course of this article, the frequent absence of a pronounced secondary creep stage has led to some misconceptions in the theoretical assessment and comparison of creep experiments with fully lamellar TiAl.
1.2.2 Gradually Changing Stress Exponent
The stress dependence of the creep behavior is commonly discussed in terms of the creep law which relates the steady-state creep rate
In this, A is a material constant and n is the stress exponent.
For TiAl alloys, Eq. 1 has frequently been used to evaluate and discuss the stress dependence of their steady-state or minimum creep rates (see, e.g., Appel et al., (2011), Wegmann et al., (2000), Zhang and Deevi (2003), Marketz et al., (2003)). The experimentally determined stress exponents do, however, show a significant scatter and often are much higher than the values of
The gradual change in the apparent stress exponent is most likely associated with the transition between different rate-limiting creep mechanisms. For very low stresses (and reasonably high temperatures), there is evidence that interface glide is the dominant creep mechanism Zhang and Deevi (2003), Appel et al., (2011) with apparent stress exponents of
A possible explanation for the unusually high apparent stress exponents may be found in the frequent absence of a secondary creep stage or more precisely in the fact that the respective experiments are compared in terms of their minimum creep rate. The direct transition from primary to tertiary creep as it is illustrated in Figure 4—per definition—appears before a saturation state has been reached. Else at least a short steady-state plateau would occur in the creep rate vs. strain graph. Consequently, the corresponding minimum creep rate is higher than the creep rate that would occur in the saturated state if damage would not have set in already. Thus, it is to be expected that the stress exponent of the minimum creep rates is higher than the maximum value
1.2.3 Influence of Microstructural Interfaces
While it is well accepted that the strengthening by the different microstructural boundaries in fully lamellar TiAl can be described by a Hall–Petch type relation Appel et al., (2011), Umakoshi and Nakano (1993), Dimiduk et al., (1998), their influence on the creep resistance has only been reported qualitatively Zhang and Deevi (2003), Maruyama et al., (1997), Chatterjee et al., (2002), Marketz et al., (2003). In general, it has been stated that the creep resistance increases with decreasing lamella thickness
Experiments with PST crystals—as quasi prototypes of single isolated colonies—revealed a strong anisotropy in their creep behavior, that is, for a given stress, the minimum/steady-state creep rates vary with the angle between lamella plane and loading direction Parthasarathy et al., (2000), Wegmann et al., (2000), Asai et al., (2002), Kim et al., (2002). The anisotropy in the creep resistance of PST crystals shows characteristics that are similar to what has been observed for their yield stress. For the yield stress, there is a region of intermediate loading angles around 45° w.r.t. the lamella plane for which it is significantly lower than in the extreme loading angles near 0° and 90° Fujiwara et al., (1990), Uhlenhut (1999), Umeda et al., (1997), Yao et al., (1995), Inui et al., (1992b), Umakoshi and Nakano (1992). Analogously, the creep resistance of PST crystals has been found to be low for intermediate loading angles around 45° and significantly higher for loading angles near 0° and 90° Parthasarathy et al., (2000), Wegmann et al., (2000), Asai et al., (2002), Kim et al., (2002). This anisotropy is directly related to the influence of the lamella boundaries which are strong barriers to dislocation motion and twin propagation. In terms of the morphological classification, this means that mixed and transversal slip/twinning systems are generally much stronger than longitudinal systems which are only strengthened by the weak and widely spaced domain boundaries.
1.3 Modeling Creep of Fully Lamellar TiAl—State of the Art
So far, remarkably few studies have dealt with modeling creep of fully lamellar TiAl alloys. Depending on the level of pragmatism, the reported models followed a more phenomenological approach by relating the minimum/steady-state creep rate to the applied stress without considering the details of primary creep and its transition to secondary creep Marketz et al., (2003), Zhang and Deevi (2003) or were designed to explicitly consider the underlying micromechanics Chatterjee et al., (2002), Estrin and Mecking (1984). To the best of the authors’ knowledge, the onset of tertiary creep in TiAl alloys has not been modeled at all so far.
1.3.1Marketz et al., (2003)
In order to capture the anisotropy in the creep behavior of single colonies and the influence of the lamella boundaries, in Marketz et al., (2003), the material coefficient A of the classical model (i.e., Eq. 1) has been defined to be a function of the lamella thickness
While certainly being a pragmatic and to an extent successful approach, the model from Marketz et al., (2003) still lacks some generality as it largely relies on phenomenological fits. In particular, the choice of a constant stress exponent of
1.3.2Zhang and Deevi (2003)
In order to phenomenologically capture the observed increase in the stress exponent with increasing stress, Zhang and Deevi (2003) replaced the power law relation in Eq. 1 by the hyperbolic sine relation
In this,
As opposed to the classical creep law, Eq. 2 relates the applied stress to a back-stress
From an engineering point of view, the model presented in Zhang and Deevi (2003) suffers from the same lack of generality as the model from Marketz et al., (2003). While successfully fitting the steady-state/minimum creep rates of a variety of experimental studies including the gradual change in the apparent stress exponent, the model from Zhang and Deevi (2003) does not allow any statements on the extent of the primary or the onset of the tertiary creep stage and is thus only of limited use for predictive purposes.
1.3.3Chatterjee et al., (2002)
In order to overcome the limitations of classical creep laws to only model the constant creep rate in the secondary creep stage (or the minimum creep rate respectively), the model from Chatterjee et al., (2002) explicitly takes into account the competititon between work hardening and recovery, which causes the transition from primary to secondary creep stage.
In order to model the gradual change of the strain rate from primary to secondary creep stages, in Chatterjee et al., (2002), an evolution equation for the stored dislocation density
with
Evolution equations in the form of Eq. 3 have been successfully applied in many dislocation density–based models (see, e.g., Anand et al., (2015), Evers et al., (2004), Beyerlein and Tomé (2008)). As their mutual interaction is one of the main causes for dislocations to get immobilized, the free path length L in Eq. 3 is commonly assumed to be correlated to the dislocation spacing
with ζ being a fitting constant.
The hybrid one parameter model from Estrin and Mecking (1984) on which the model from Chatterjee et al., (2002) is largely based does, however, take into account that in most materials there are additional obstacles for dislocation motion such as point defects or grain boundaries all with their own spacing L. These different coexisting obstacles all increase the rate at which dislocations become immobilized, that is, contribute to
Consequently, the influence of the lamella interfaces on the dislocation storage was modeled in Chatterjee et al., (2002) by introducing an additional free path length
with ξ again being a fitting constant.
Following Estrin and Mecking (1984),
has been introduced into Eq. 3 in order to model the combined effect of dislocation interaction and lamella interfaces on the dislocation storage.
In addition to Eq. 3, the kinetic equation
has been set up in Chatterjee et al., (2002), where
In this,
Combining Eqs. 3, 7, and 8, integrating the resultant equation and solving for
As the model explicitly considers the evolution of the dislocation density toward the saturated state, it is capable of reproducing the transition from primary to secondary creep stage and thus is—from an engineering point of view—of much more relevance than the classical creep laws.
Unfortunately, the model was calibrated in such a way that the saturation state coincides with the minimum creep rates that have been found in the respective experiments. As discussed earlier, this is not physical as the minimum creep rate occurs at the onset of tertiary creep and is thus not related to the saturated state. Furthermore, neither interface glide nor the tertiary creep stage is considered in Chatterjee et al., (2002), so that the model consequently fails to describe the respective deformation regimes.
However, the model from Chatterjee et al., (2002) still represents an important step toward a comprehensive model of the creep behavior of fully lamellar TiAl, and many of the underlying assumptions will be adopted in the course of the present article.
1.3.4 Conclusion
In the context of the frequent absence of a secondary creep stage and the gradual change in the apparent stress exponent, classical creep models that are based on Eq. 1 are not well suited to describe the creep behavior of fully lamellar TiAl. While to a certain extent being successful in describing the stress dependence of the minimum creep rates by using different stress exponents for different stress regimes, these models miss some vital details of the creep behavior. Even if correctly predicting the minimum creep rate for a given stress, the corresponding creep strain is not known from models based on Eq. 1. As the minimum creep rate does, however, occur at the onset of tertiary creep and thus marks a deformation state the occurrence of which has to be avoided by any means in engineering design, such models are of little use for engineering purposes. Thus, a precise description of the primary creep stage is vital for modeling the creep behavior of fully lamellar TiAl.
2 Crystal Plasticity Model
As the micromechanics of fully lamellar TiAl alloys largely determines their macroscopic behavior, micromechanical and in particular crystal plasticity–based models have been very successful in describing and investigating the intricate details of their plastic deformation Kad et al., (1995b, 1995a), Kad and Asaro (1997), Parteder et al., (1995), Schlögl and Fischer (1996, 1997b, 1997a), Lebensohn et al., (1998), Uhlenhut (1999), Grujicic and Batchu (2001), Grujicic et al., (2003), Grujicic and Zhang (1999), Grujicic and Cao (2002), Brockmann (2003), Werwer and Cornec (2000), Werwer (2005), Werwer and Cornec (2006), Roos et al., (2004), Kowalczyk-Gajewska (2011), Zambaldi et al., (2011), Chen et al., (2019), Chowdhury et al., (2018). However, to the best of the author’s knowledge, the creep behavior of fully lamellar TiAl has not yet been modeled by crystal plasticity.
Thus, some of the ideas of the previously reported models (especially Chatterjee et al., (2002), Estrin and Mecking (1984)) will be picked up in the following and extended to a crystal plasticity framework in order to model the creep behavior of fully lamellar TiAl in a microstructure sensitive way.
2.1 Base Model
In previous works, Schnabel and Bargmann (2017), Schnabel et al., (2019), a thermomechanically coupled, defect density-based crystal plasticity model has been set up with the focus on precisely capturing the microstructure sensitivity of the yield and work hardening behavior of fully lamellar TiAl. This model incorporates the Hall–Petch strengthening effect of the different coexisting microstructural boundaries as well as the work hardening interactions between twins and dislocations in the γ phase. Furthermore, the evolution of the dislocation density in this model takes into account dynamic and static recovery.
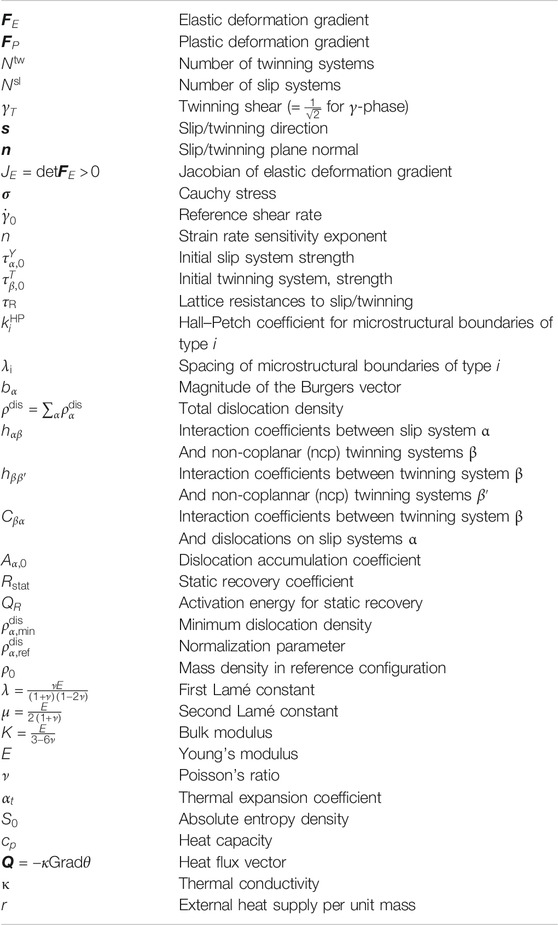
As this model has been extensively discussed elsewhere (Schnabel and Bargmann (2017), Schnabel et al., (2019)), the governing equations are just briefly summarized in the following. The meaning of the used symbols can be found in Table 2.
Kinematics:
Plastic velocity gradient2
Stress measures:
Flow/twinning rule: Slip shear rate3
Twinning rate4
CRSS/Work Hardening (WH):
WH of slip systems5
WH of twinning systems6
Defect density evolution:Dislocation densities7
Twinned volume fractions8
Thermomechanical coupling Helmholtz free energy9
As the
The model that is described by Eqs. 9–28 has been successfully applied to investigate different aspects of the plastic deformation of fully lamellar TiAl alloys from room to operating temperature Schnabel and Bargmann (2017), Schnabel et al., (2019), Schnabel (2018). However, in order to capture the creep behavior of fully lamellar TiAl, this model needs to be extended as it will be shown in the following.
2.2 Model Extension to Creep
Most equations and assumptions of the base model are valid also for modeling creep deformation. It has to be noted, however, that in Equation (11), the kinematics of dislocation climb is neglected. This appears reasonable as long as the creep deformation is dominated by (climb-assisted) glide. In line with the arguments of the one-parameter model from Chatterjee et al., (2002) and Estrin and Mecking (1984), the work hardening behavior only depends on the dislocation densities and the twinned volume fractions, that is, the respective work hardening model Eqs.18–23 is applicable without any changes. The same holds for the thermomechanical coupling and the resultant stress as well as the temperature evolution.
The only parts of the model that will be altered/enhanced in the following are the flow rule (Eq. 16 in the base model) and the dislocation density evolution model (Eq. 24 in the base model).
2.2.1 Shear Rates
In crystal plasticity, the kinematics of the plastic deformation of a crystal’s lattice is described in terms of shear (rates) on its crystallographic slip and twinning planes; cf. Eq. 11. In this, the shear rates
In order for a dislocation to become mobile, there has to be a sufficient driving force (stress and/or thermal activation) that supports the dislocation to overcome obstacles and/or the local stress field that hinders its motion. Depending on the combination of stress and temperature, different characteristic types of dislocation mobilization can become rate limiting. The intricate details of the discrete motion of dislocation line segments and their interactions with point defects and the surrounding dislocation network are naturally beyond the scope of continuum mechanics. However, it is still possible to incorporate different rate-limiting micromechanical effects into a crystal plasticity model by additively decomposing the shear rate
In the context of creep, essentially two different strain rate limiting mechanisms of dislocation mobilization occur:
• Instantaneous plasticity: If the applied (macroscopic) stress is above the (macroscopic) yield stress at the given temperature, the resolved shear stress on at least one slip system is sufficiently high to force the dislocations on that slip system to move through/past any obstacles or local stress fields. This (yield) deformation takes place with a—in the context of creep—very high strain rate and is thus referred to as instantaneous plasticity in the following.
• Viscous glide: If the (macroscopic) stress is below the yield point, the resolved shear stress on neither of the slip systems is sufficient for the dislocations to break free from any pinning points or local stress fields. If the temperature is, however, sufficiently high, pinned dislocations may climb to parallel slip planes to bypass obstacles or escape local stress fields. Once a dislocation has climbed to a slip plane above the obstacle or with a (locally) relaxed stress field, it may glide even under the given resolved shear stress until getting pinned again. The strain rate of this climb-assisted glide is thus limited by the diffusion kinetics.
Considering these two rate limiting cases, the slip shear rates are written as the sum (cf. Staroselsky and Cassenti (2008, 2011))
As twinning partial dislocations are bound to their glide plane, the corresponding twinning rates do not have a viscoplastic creep part and thus simply read
2.2.2 Instantaneous Plasticity
Instantaneous plasticity occurs whenever the resolved shear stress τ on a slip or twinning system approaches its current strength. This behavior is modeled by Eqs. 16and17 in the base model, which are consequently adapted here to model the instantaneous shear rates for slip
and twinning
Unless stated otherwise,
2.2.3 Viscoplastic Response
The viscous shear rates on slip systems α are modeled by (cf. Staroselsky and Cassenti (2008, 2011))
in order to represent the temperature-dependent climb behavior which is rate limiting for the viscoplastic response. In this,
2.2.4 Defect Density Evolution
The work hardening relations, that is, Eqs. 22and23, describe the strength of slip and twinning systems as a function of their current surrounding microstructure. As this microstructure evolves with plastic strain, temperature, and time, an evolution model for the corresponding internal variables—namely, the dislocation densities
In the following, the evolution of the dislocation density on a slip system α is modeled by the generation recovery format
As opposed to the dislocation density evolution models in, for example, Chatterjee et al., (2002), Estrin and Mecking (1984), Evers et al., (2004), Beyerlein and Tomé (2008) which incorporate the accumulation of dislocations
The dislocation accumulation term
In the following, some of the ideas from Estrin and Mecking (1984), Chatterjee et al., (2002) are adapted in order to make Eq. 35 microstructure sensitive. In the model from Chatterjee et al., (2002), Estrin and Mecking (1984), the free path length L was defined by combining the dislocation spacing and the obstacle/lamella interface spacing as shown in Eq. 6. While this is an inevitable (and by no means bad) assumption to combine both effects in an analytical, macroscopic model, crystal plasticity models allow the individual definition of the spacing of obstacles for every slip system (thus the subscript α in
The free path length
Following Eq. 5, the free path length of longitudinal slip systems is thus defined as
while the free path length of mixed and transversal systems reads
However, the free path length is only defined by the domain or lamella boundaries as long as the dislocation density on the respective slip system is low. With ongoing plastic deformation, dislocations begin to pile up against these boundaries, steadily reducing the free path length. This effect is modeled in a continuum sense by adapting the dislocation spacing from Eq 4, that is,
and evaluating the free path length
for each slip system α in each time step of the simulation.
The stored dislocation density may also decrease by dynamic and static recovery (see Eq. 34). Dynamic recovery describes the recombination of dislocations that move on the same slip plane and thus only takes place for a non-zero slip shear rate
The dynamic recovery rate
As the recombination of dislocations can only take place between dislocations on the same slip system, the dislocation density
The static recovery behavior is modeled according to the base model (cf. Anand et al., (2015) and Roters et al., (2010), Ma et al., (2006))
The expression
Throughout this work, the dislocation density is assumed to evolve starting from an initial value of
3 Application to PST Crystals
In the following, the modified thermomechanically coupled, defect density–based crystal plasticity model is applied to reproduce and discuss some aspects of the creep deformation of PST TiAl crystals.
3.1 Simulation Setup
As in previous studies Schnabel and Bargmann (2017), Schnabel et al., (2019), a simplified representative volume element (RVE) of a PST crystal is set up (see Figure 5).
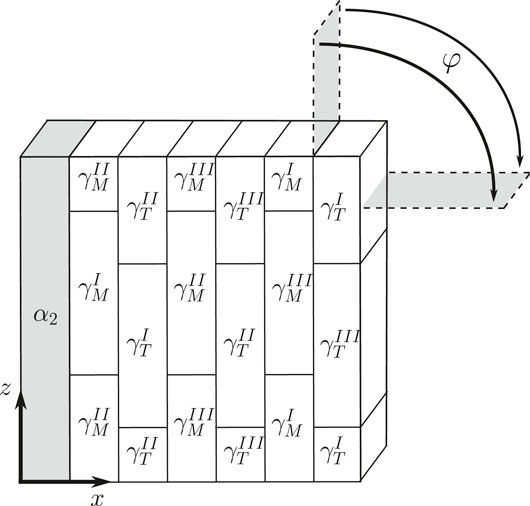
FIGURE 5. RVE of PST crystal. φ: angle between uniaxial load and lamella plane;
In this, the thickness of the single modeled
The geometry is meshed using 42 linear hexahedral finite elements. The RVE is subjected to periodic boundary conditions in order to mimic an infinite repetition of the RVE in all directions.11 The periodic RVE is then embedded into a dummy element with negligible stiffness. The displacements of the periodic RVE’s master nodes are coupled to the averaged deformation of the dummy element via a rotation relation as introduced in Werwer and Cornec (2000), Werwer (2005) and described in Schnabel (2018). This rotation relation allows the investigation of the RVE’s constitutive response as a function of the loading angle φ (i.e., its anisotropy in the xz-plane) by applying a uniaxial deformation to the dummy element.
3.2 Thermoelasticity
Although the elastic deformation is usually not discussed in detail in the context of plasticity, the (thermo-) elastic model parameters still have to be chosen properly as they, e.g., occur in the work hardening relation via the shear modulus μ. The thermoelastic parameters (i.e.,
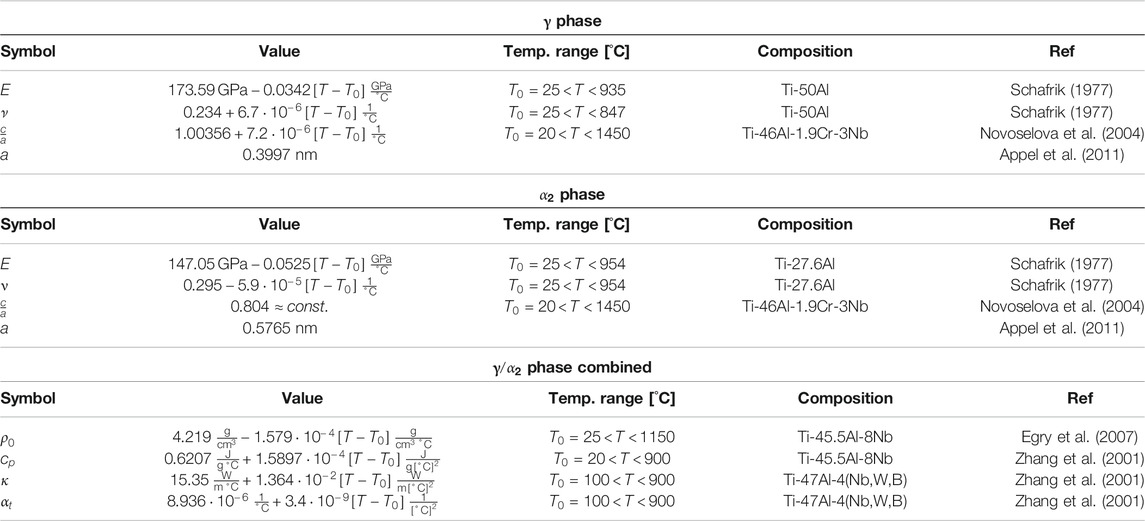
TABLE 3. Thermoelastic model parameters used in this study. The reported experiments were carried out in the indicated temperature range. Where necessary, the linear approximations of the temperature dependences are extrapolated to the temperatures of interest. If no parameters for the single phases are available, the parameters of two phase alloys were used instead. The lattice constants a and the
3.3 Instantaneous Plasticity
As discussed earlier, the constitutive response is dominated either by instantaneous or by viscoplastic deformation depending on stress level, applied strain rate, and temperature. Instantaneous plasticity occurs whenever the resolved shear stress on any slip/twinning system is above its current strength. Thus, instantaneous plasticity dominates the deformation behavior for experiments with applied stresses above the yield stress and constant strain rate experiments with strain rates that are above typical creep rates at the given temperature. Furthermore, the instantaneous plastic deformation depends on temperature only through the temperature dependence of the yield stress and the thermoelastic parameters.
Making use of this fact, it is possible to separately calibrate and evaluate the parts of the model that describe the instantaneous plasticity by only considering load scenarios that favor this deformation behavior.
3.3.1 Constant Strain Rate Room Temperature Experiment
Classical uniaxial tensile/compression tests at room temperature are naturally dominated by instantaneous elastic–plastic deformation. Correspondingly, such room temperature experiments are a good starting point to calibrate the respective parts of the discussed model.
At room temperature, static recovery and viscoplastic (creep) deformation are negligible. Consequently,
The parameters for the work hardening model (Eqs. 22 and 23) and the dislocation density evolution (Eq. 34) are calibrated against the room temperature compression tests with differently oriented PST crystals that are reported in Uhlenhut (1999). The corresponding calibration procedure has extensively been discussed before Schnabel and Bargmann (2017), Schnabel et al., (2019) and will therefore not be revisited here. A summary of the corresponding simulation results can, however, be found in the Supplementary Material, and some details about the identified parameter set are given in the following.
The work hardening due to the interaction of slip dislocations is modeled by classical Taylor hardening (cf. Eq. 22), and thus do not require any model parameters to be identified. The work hardening interaction between slip and twinning systems does, however, require the calibration of the corresponding interaction coefficients in Eqs. 22 and 23 (i.e.,
For fully lamellar TiAl, it has been shown by several studies that the number of model parameters of the crystal plasticity formulation can be drastically reduced by making use of the morphological classification (see, e.g., Lebensohn et al., (1998), Werwer and Cornec (2006), Zambaldi et al., (2011)). By assuming that the hardening interaction between all slip/twinning systems of one morphological class with all slip/twinning systems of another morphological class can be described by the same coefficient, the number of parameters reduces to the interaction matrix that is shown in Table 4. The calibration against the experiments from Uhlenhut (1999) (cf. Supplementary Material) moreover reveals that only 6 of the 16 remaining work hardening interaction coefficients are actually needed (i.e., have values
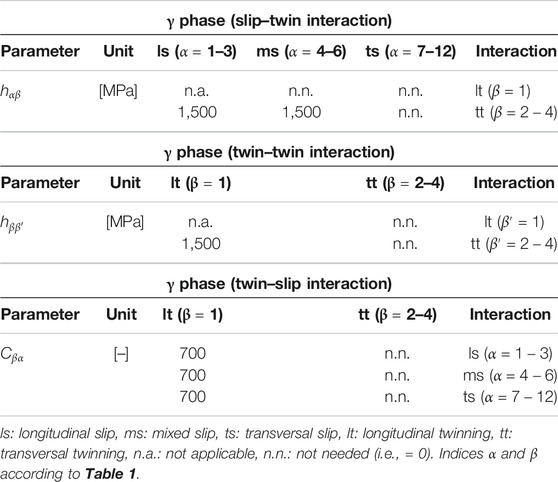
TABLE 4. Identified model parameters for the work hardening interaction model between slip and twinning systems.
The parameters of the dislocation density evolution (i.e.,
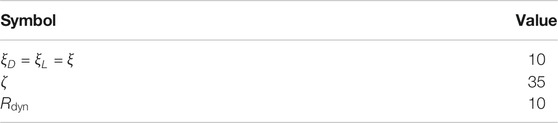
TABLE 5. Model parameters of the dislocation density evolution model. These parameters are used irrespective of the morphological class of the slip system at hand. Due to previous arguments concerning the contribution of the minor
3.3.2 Constant Strain Rate High Temperature Experiment
Although thermally activated processes become increasingly relevant with increasing temperature, uniaxial tensile/compression tests at elevated temperatures are still dominated by instantaneous elastic–plastic deformation as long as the strain rate is sufficiently high. Therefore, the viscoplastic (creep) deformation remains negligible and is thus again set to
As discussed above, instantaneous plastic deformation occurs as soon as the resolved shear stress on any deformation system reaches its current strength. In preparation for the next section in which the creep behavior of differently oriented PST crystals will be discussed at the example of the experiments from Parthasarathy et al., (2000), it is thus crucial to capture the temperature dependence of the model parameters that determine the current strength of deformation systems.
The work hardening as described by Eqs. 22 and 23 is not explicitly depending on temperature. Equations, 22 and 23 are only indirectly depending on temperature through the shear modulus μ and the magnitudes of the Burgers vectors
The yield stress of PST crystals and thus the initial slip/twinning system strengths
In Butzke and Bargmann (2015), this yield stress anomaly of PST crystals has been modeled according to the experimental findings from Umakoshi and Nakano (1992) by making the Hall–Petch coefficients
Thus, the temperature-dependent initial critical resolved shear stresses
Figure 6 shows the simulated yield stresses of PST crystals under the characteristic loading angles of 0°, 45°, and 90° over temperature in comparison to the experimental results from Parthasarathy et al., (2000). The corresponding initial critical resolved shear stresses for the γ phase are gathered in Table 6.
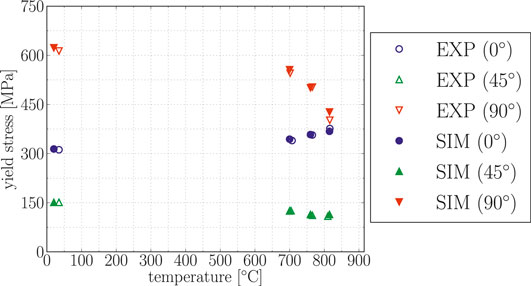
FIGURE 6. Yield stress (
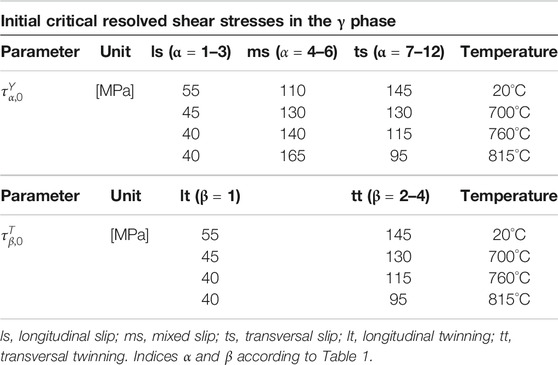
TABLE 6. Identified initial critical resolved shear stresses in the γ phase as a function of temperature for the PST crystals tested in Parthasarathy et al., (2000).
Although only covering the discrete temperatures from the creep experiments in Parthasarathy et al., (2000), Figure 6 clearly shows the yield stress anomaly of PST crystals. While for a loading angle of 90°, the peak respectively plateau temperature has obviously been already reached below 700°C (cf. Umakoshi and Nakano (1992), Inui et al., (1995)), the yield strength for loading angles of 0° is still increasing even at 815°C. For loading angles of 45°, the yield stress basically remains constant over temperature, as it has been found in other studies Umakoshi and Nakano (1992), Inui et al., (1995).
3.4 Viscoplastic Creep Deformation
In the following, the presented model is applied to reproduce the creep experiments from Parthasarathy et al., (2000). In Parthasarathy et al., (2000), PST crystals of the characteristic orientations 0°, 45°, and 90° were subjected to compressive stresses at temperatures of 700°C, 760°C, and 815°C.
As the dislocation density evolution (and thus the work hardening rate) has been modeled in a microstructure sensitive way (cf. Eqs. 36 and 37), the microstructural parameters
The instantaneous shear rates
With these assumptions, only the viscoplastic shear rates
In the creep experiments from Parthasarathy et al., (2000), PST specimens have been subjected to a constant creep load until the strain rate vs. time plots reached a plateau. Once such a plateau has been reached, the load was increased. By repeating this stepwise stress increase procedure, it has been possible to extract the creep rates that correspond to the observed plateaus as a function of applied stress by using the same specimen. By applying different stress series to different specimens, it has further been shown in Parthasarathy et al., (2000) that the creep rates that correspond to the observed plateaus only depend on the applied stress irrespective of the load history. From this experimental procedure, a stress exponent of
With the stress exponent at hand, only the two Arrhenius type terms
In the simulations, the creep load is applied via a linear ramp over a time of 1 s in order to facilitate numerical handling of the load jump. As soon as the simulations reached the creep strain that corresponds to the primary creep strain that has been reported in Parthasarathy et al., (2000), the load has been increased to the next level, again over a period of 1 s. If for a given creep load, the simulation did not show saturation behavior up to the experimentally determined primary creep strain, the load was kept on the respective level until a plateau appears in the strain rate vs. time plot. Figure 7 shows the steady-state creep rate vs. stress plot as extracted from the respective simulation results in comparison to the experimental results from Parthasarathy et al., (2000) for different lamella orientations and temperatures.
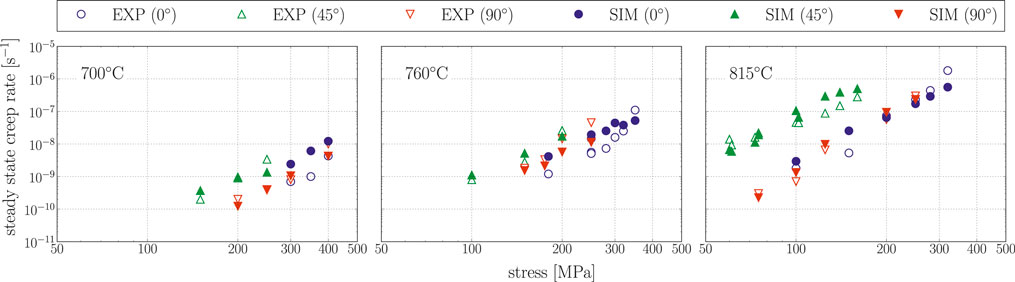
FIGURE 7. Steady-state creep against stress. Comparison of simulations to experiments from Parthasarathy et al., (2000).
Figure 8 shows the simulated strain rate vs. time plots that have been used to identify the steady-state creep rates in Figure 7 as well as the corresponding strain rate vs. strain plots.
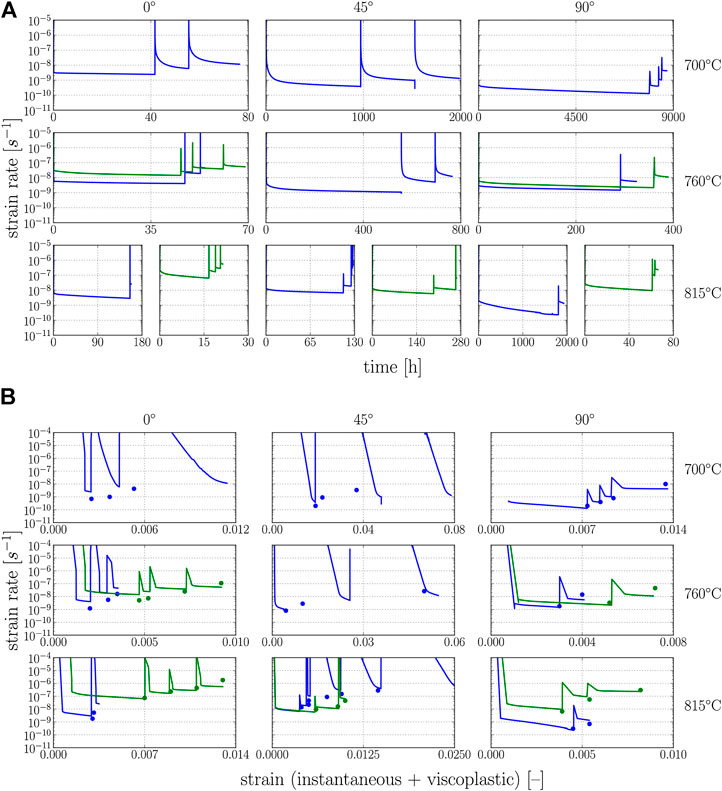
FIGURE 8. Simulation results for differently oriented PST crystals at the temperatures and stress levels from the experimental results in Parthasarathy et al., (2000). Symbols: experimentally determined steady-state strain rates at the corresponding strain, that is, at the end of primary creep stage. Solid lines: simulations.
The parameters that were applied to produce the simulation results from Figures 7,8 are gathered in Table 7.
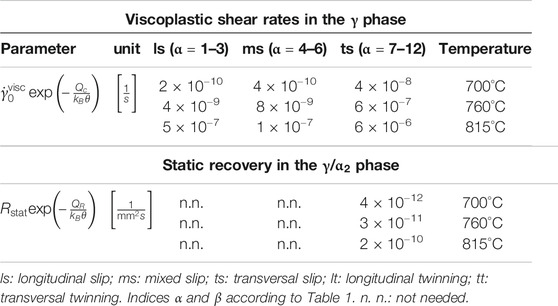
TABLE 7. Viscoplastic shear rates and static recovery rates that have been identified to reproduce the PST crystals tested in Parthasarathy et al., (2000) as a function of temperature.
3.5 Discussion
In the following, the simulation results that have been shown in the previous section will be critically discussed and compared to the experimental findings from Parthasarathy et al., (2000) and other literature.
3.5.1 Creep Simulations
The comparison of the creep simulations to the experimental results from Parthasarathy et al., (2000) allows two observations:
(1) The presented model is capable of reproducing the steady-state creep rates of differently oriented PST crystals reasonably well as a function of stress, loading angle, and temperature for the identified set of model parameters (see Figure 7).
(2) For certain load cases and orientations, the primary creep strain is significantly overestimated by the model (see Figure 8).
Having a closer look on the load cases/orientations for which the model overestimates the primary creep strain (i.e., the strain at which the saturation state is reached), it becomes apparent that a significant part of the estimated primary creep strain accumulates within the 1 s in which the load is applied/increased in the simulations. In all cases for which the primary creep strain is overestimated, the applied stress exceeds the current yield strength in the model; that is, the resolved shear stress on at least one slip/twinning system is higher than its current strength. Thus, the overestimated primary creep strain is closely related to the occurrence of instantaneous plasticity in the model.
In order to identify/quantify the contribution of the instantaneous strain to the primary creep strain, an additional series of simulations is set up. For these simulations, the model set up as well as all identified model parameters remain unchanged. Only the strain that accumulates during loading, that is, during the 1 s linear load increase, is subtracted when plotting the simulation results. The simulation times at which the load is increased are adjusted accordingly so that the load increase is again taking place once the primary creep strain from the experiments in Parthasarathy et al., (2000) has been reached.
The corresponding strain rate vs. strain and strain rate vs. time plots are shown in Figure 9. The secondary creep rates of this second series of simulations essentially remain the same as in the first series of simulations (cf. Figure 7) and are therefore not plotted here again.
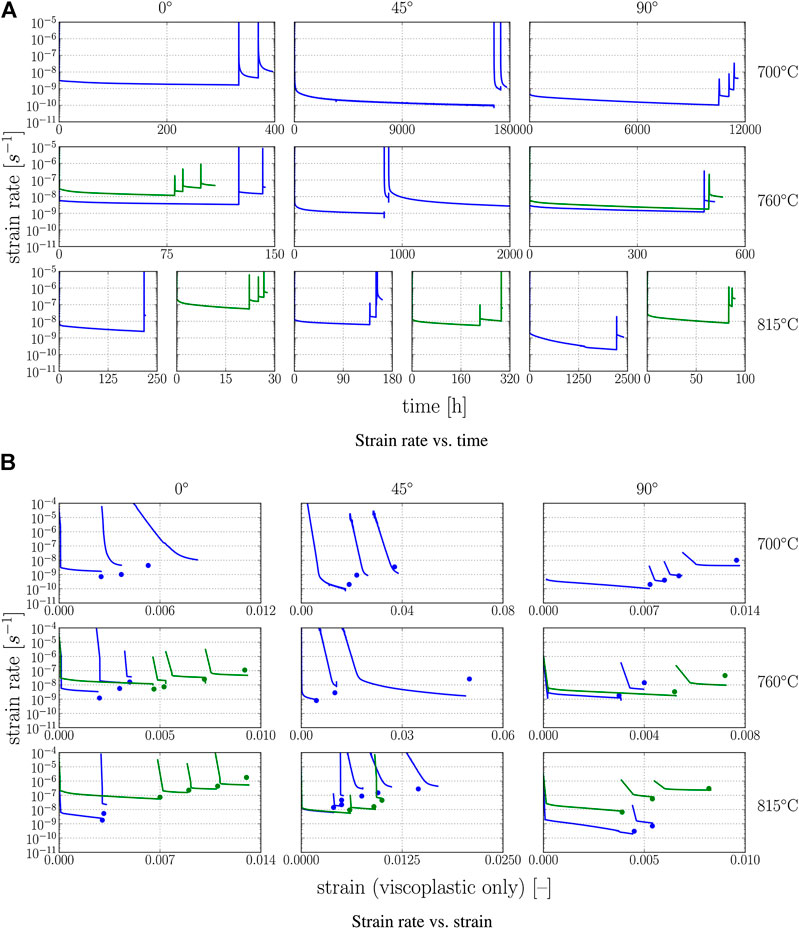
FIGURE 9. Simulation results for differently oriented PST crystals at the temperatures and stress levels from the experimental results in Parthasarathy et al., (2000). Second simulation series, that is, the creep strain that accumulates during the 1 s loading periods is subtracted. Symbols: experimentally determined steady-state strain rates at the corresponding strain, that is, at the end of primary creep stage. Solid lines: simulations.
By the results in Figure 9, that is, by subtracting the instantaneous strain that accumulates during the time span in which the load is applied, most of the differences between the primary creep strain in the simulations and the experiments can be rationalized without a negative effect on the predicted steady-state creep rates and the simulation results for the load cases/orientations for which the primary creep strain was correctly predicted in the first place.
Obviously, the occurrence of instantaneous plasticity in the model could also be reduced/suppressed by increasing the initial yield strength (and thus the creep stress to yield strength ratio) or by increasing the work hardening rate (and thus the creep stress to current strength ratio). The former approach is, however, not reasonable as the model has been calibrated to match the yield strengths of the PST crystals tested in the same study (i.e., Parthasarathy et al., (2000)) at the temperatures that have also been used for the creep experiments (see Figure 6). The (athermal) work hardening behavior on the other hand has been calibrated against results from a different experimental study (see Supplementary Material). However, the drastic increase of the work hardening rate that would be necessary to sufficiently reduce the instantaneous plastic response for the load cases in which the model overestimates the primary creep strain would in turn negatively affect the simulation results for the majority of load cases for which the model estimates the primary creep strains reasonably well.
The fact that the discrepancy between the experimentally determined and the simulated primary creep strain can largely be eliminated by subtracting the instantaneous strain does suggest that there is systematic cause.
Although not frequently discussed in the literature, much of the information on the instantaneous deformation is probably lost in typical creep experiments due to apparative limitations (Estrin and Mecking, 1984). First, the instantaneous strain during loading accumulates with a strain rate that is several orders of magnitude higher than the viscoplastic creep rates and is thus not detectable with equipment that is optimized for measuring creep strain rates. This does, however, not explain why the instantaneous strain might not be captured in creep experiments. Instead, this may result from the typical loading procedure. The disturbance of the sensitive strain measurement during manually applying dead loads impedes a precise determination of the strain during loading. In the context of the long duration of creep measurements, it is thus a pragmatic approach to start the measurement only after the load has been applied, consequently losing all information on the instantaneous deformation.
The instantaneous strain that accumulates during the load application is the sum of elastic strain and instantaneous plastic strain. While losing the information of the elastic part of the instantaneous strain is justifiable because the elastic strains remain small and can be estimated analytically, not detecting potentially occurring instantaneous plastic strains can lead to dramatic misinterpretation of the experimental results and in worst case leads to a drastic overestimation of the time that is needed to reach the admissible creep strain for a given stress. As many experimental studies (including the study discussed here (i.e., Parthasarathy et al., (2000))) did, actually, not exclusively apply creep stresses below the yield point, this hypothesis even rationalizes the frequent occurrence of mechanical twins in creep experiments Appel et al., (2011), Wegmann et al., (2000) as twins do naturally evolve when the load exceeds the yield strength (i.e., in the instantaneous plastic deformation regime).
In the end, this hypothesis cannot be unambiguously proven without further experimental investigation. However, the occurrence of (undetected) instantaneous plastic strains would rationalize many of the observed discrepancies and is supported by the fact that even the (analytically determined) elastic strain due to a load increase would in many cases be higher than the primary creep strains for the reported load cases in Parthasarathy et al., (2000).
3.5.2 Activation Energy for Creep
Numerous experimental studies reported the activation energy for creep in polycolony fully lamellar TiAl, however, with a significant scatter between 320 kJ/mol
However, these activation energies are determined from Arrhenius graphs, that is, by plotting the minimum/steady-state creep rate against the (inverse) temperature. Thus, the reported activation energies can be called apparent in the sense that they represent the macroscopic result of the thermally activated micromechanisms that lead to creep. The plotted macroscopic minimum/steady-state creep rates are, however, related to the creep shear rates on the slip systems via the Schmid/Taylor factor so that the slope in the Arrhenius plot (and thus the activation energy) is different when resolved to the single slip systems. Thus, the experimentally determined apparent activation energies and especially their apparent anisotropy for PST crystals may be rationalized by taking the crystallography into account. While this is obviously not easily done or even impossible in experiments, the simulation results presented here can help to relate the apparent macroscopic activation energies to their slip system resolved representation.
Therefore, the Arrhenius term
A detailed discussion of the dislocation mobilization mechanisms that are reflected in the activation energy for creep of PST crystals is naturally beyond the scope of continuum mechanics. However, plotting the identified
• All identified values
• Longitudinal and mixed slip systems can be described by nearly the same choice of
• The activation energy for transversal slip systems is much lower than the one for longitudinal and mixed slip systems.
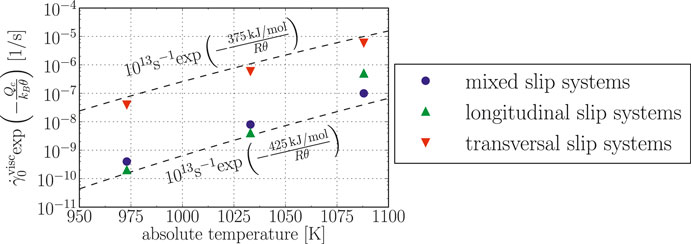
FIGURE 10. Identified Arrhenius terms
The fact that the identified
As the predominantly activated deformation systems in PST crystals vary with the loading angle, it is possible to phenomenologically relate the identified viscoplastic model parameters (and thus the tendencies in the activation energies) for longitudinal, mixed, and transversal slip systems to the observed creep behavior of PST crystals.
For a loading angle of 45°, mainly longitudinal deformation systems become active (even under creep conditions) as they have the highest Schmid factors and the lowest strength. For a loading angle of 90°, only transversal deformation systems have Schmid factors
At first glance, the identified
However, in the current model, the viscoplastic creep behavior has been described by Eq. 33, that is, in a slip system resolved manner in which the viscoplastic shear rate on a slip system is determined by normalizing the classical creep model (i.e., Eq. 1) by the slip system strength. Thus, the creep resistance of longitudinal, mixed, and transversal deformation systems is in fact not given solely by the activation energy but also incorporates the slip system strengths and is related to the experimentally observed values via the Schmid factors as already mentioned above.
Thus, the identified
3.5.3 The Role of Static Recovery
As opposed to other alloys for which static recovery can often be neglected Estrin and Mecking (1984), TiAl alloys have been found to exhibit a fast static recovery behavior Paul and Appel (2003), Lindemann et al., (2006), Schnabel et al., (2019), Appel et al., (1999). In Paul and Appel (2003), Appel et al., (1999), the fast static recovery kinetics of TiAl has been associated to the annealing-out of dipoles and debris. In fact, it has been shown in Lindemann et al., (2006) that these defects even recover during constant strain rate deformation at sufficiently high temperatures. Thus, the recovery of these thermally unstable defects can be considered as instantaneous in the context of creep deformation so that these defects do not contribute to the work hardening during primary creep. A possibility to model the additional work hardening that is provided by dipoles (and consequently their separate, fast recovery) is introduced via a separate dislocation evolution term in Ma et al., (2006). However, in the present work, dipoles are not modeled separately as they do not contribute to the work hardening in primary creep. Still, the static recovery behavior is not neglected here as the thermally more stable defect structures may also recover although with a significantly slower recovery kinetics.
Interestingly, the recovery term
4 Conclusion and Outlook
The results that are shown in the present work lead to the following conclusions regarding the creep behavior of PST crystals and the presented model:
• The climb-assisted glide model from this work is able to reproduce the creep experiments with differently oriented PST crystals from Parthasarathy et al., (2000) reasonably well for a viscoplastic stress exponent of
• The results of the presented numerical study indicate that the instantaneous (plastic) strain that accumulates during application of the creep load may not be captured in creep experiments due to apparative limitations.
• The apparent anisotropy of the activation energy for creep that has been observed in experiments with differently oriented PST crystals changes its characteristics when resolving the shear rates to the predominantly activated deformation systems and normalizing the results to the different strengths of deformation systems.
• Differences in the identified activation energies for creep of deformation systems from different morphological classes can potentially be rationalized in the context of the yield stress temperature anomaly of PST crystals.
• The role of the fast static recovery kinetics in creep of TiAl alloys needs further experimental investigation in order to backup or—if necessary—refine the model.
In consequence, the present study shows that interpreting/modeling the steady-state/minimum creep rates of PST crystals using models in the form of Eq. 1 leads to misconceptions in both the stress exponents n and the activation energies
In its present form, the derived model is capable of reproducing the transition from primary to secondary creep stage for PST crystals of TiAl12 in a microstructure sensitive way. However, the modeled processes of dislocation creep only describe the bulk creep behavior. For very low stresses, the present model will thus underestimate the secondary creep rate as under this conditions interface glide may become the dominant creep mechanism. In addition, the steady state is not reached for certain load cases in fully lamellar TiAl due to the early onset of damage/tertiary creep. While the presented evolution model for the dislocation density is not invalidated in the tertiary creep stage, the creep rate for the respective deformation state will still be underestimated as damage is not yet incorporated in the model. Thus, in a next step, the here presented model may be extended to account for damage in the bulk of the lamellae. The interface related effects, that is, interface glide and interface damage, cannot be reasonably captured in the context of crystal plasticity. In order to incorporate these interface related effects, the cohesive element formulation presented in Scheider et al., (2020) can be introduced to the RVE of the lamellar microstructure.
Data Availability Statement
The raw data supporting the conclusions of this article will be made available by the authors, without undue reservation.
Author Contributions
JS developed and implemented the model, conducted the simulations, and analyzed the resultant data. JS and IS discussed necessary model assumptions, simulation results, and the resultant conclusions. JS prepared the manuscript. IS did proof reading.
Funding
This work received internal funding by the VirMat project of the Helmholtz Association of German Research Centres and the IDEA project Modeling the effect of interfaces on creep of lamellar TiAl from a multiscale perspective of the Helmholtz‐Zentrum Geesthacht.
Conflict of Interest
The authors declare that the research was conducted in the absence of any commercial or financial relationships that could be construed as a potential conflict of interest.
Supplementary Material
The Supplementary Material for this article can be found online at: https://www.frontiersin.org/articles/10.3389/fmats.2020.581187/full#supplementary-material.
Footnotes
1see Chatterjee et al., (2002) and Estrin and Mecking (1984) for details and further assumptions regarding the temperature dependence.
2cf. Rice (1971), Kalidindi (1998). Note that as opposed to the original model from Kalidindi (1998), no reorientation of the twinned region and subsequent slip within the twins is considered here. This assumption is reasonable as long as the twins remain very thin as it is the case in lamellar microstructures.
4cf. Kalidindi (1998).
5cf. Kowalczyk-Gajewska (2011).
6cf. Beyerlein and Tomé (2008), Kowalczyk-Gajewska (2011).
7cf. Anand et al., (2015), McBride et al., (2015).
8cf. Kalidindi (1998).
9cf. Anand et al., (2015), McBride et al., (2015).
10In the
11Note that this simplifies the RVE to a columnar structure in y-direction.
12Or potentially any other crystalline material with lamellar microstructure, that is, with microstructural features with extreme aspect ratios like, for example, lamellae, layered platelets, or even rolling textures.
References
Anand, L., Gurtin, M. E., and Reddy, B. D. (2015). The stored energy of cold work, thermal annealing, and other thermodynamic issues in single crystal plasticity at small length scales. Int. J. Plast. 64, 1–25. doi:10.1016/j.ijplas.2014.07.009
Appel, F., Paul, J., and Oehring, M. (2011). Gamma titanium aluminide alloys. (Weinheim, Germany: Wiley-VCH Verlag & Co. KGaA).
Appel, F., Sparka, U., and Wagner, R. (1999). Work hardening and recovery of gamma base titanium aluminides. Intermetallics 7, 325–334. doi:10.1016/s0966-9795(98)00109-5
Asai, T., Hirata, S., Takeyama, M., and Matsuo, T. (2002). Microstructure in Ti-48at.%Al PST crystal subjected to creep deformation. Mater. Sci. Eng. A329–331, 828–834. doi:10.1016/S0921-5093(01)01635-5
Bartels, A., and Uhlenhut, H. (1998). Anisotropy of plastic flow in strongly textured γ-TiAl-based alloys. Intermetallics 6, 685–688. doi:10.1016/s0966-9795(98)00029-6
Beyerlein, I. J., and Tomé, C. N. (2008). A dislocation-based constitutive law for pure Zr including temperature effects. Int. J. Plast. 24, 867–895. doi:10.1016/j.ijplas.2007.07.017
Brockman, R. A. (2003). Analysis of elastic-plastic deformation in TiAl polycrystals. Int. J. Plast. 19, 1749–1772. doi:10.1016/s0749-6419(02)00102-x
Butzke, J. E., and Bargmann, S. (2015). Thermomechanical modelling of polysynthetically twinned TiAl crystals. Phil. Mag. 95 (24), 2607–2626. doi:10.1080/14786435.2015.1070968
Chatterjee, A., Mecking, H., Arzt, E., and Clemens, H. (2002). Creep behavior of γ-TiAl sheet material with differently spaced fully lamellar microstructures. Mater. Sci. Eng. 329–331, 840–846. doi:10.1016/s0921-5093(01)01639-2
Chen, L., James Edwards, T. E., Di Gioacchino, F., CLegg, W. J., Dunne, F. P. E., and Pham, M.-S. (2019). Crystal plasticity analysis of deformation anisotropy of lamellar TiAl alloy: 3D microstructure-based modelling and in-situ micro-compression. Int. J. Plast. 119, 344–360. doi:10.1016/j.ijplas.2019.04.012
Chowdhury, H., Naumenko, K., Altenbach, H., and Krüger, M. (2018). Critical stresses estimation by crystal viscoplasticity modeling of rate-dependent anisotropy of Al-rich TiAl alloys at high temperature. Arch. Appl. Mech. 88, 65–81. doi:10.1007/s00419-017-1291-4
Dimiduk, D. M., Hazzledine, P. M., Parthasarathy, T. A., Mendiratta, M. G., and Seshagiri, S. (1998). The role of grain size and selected microstructural parameters in strengthening fully lamellar TiAl alloys. Metall. Mater. Trans. 29, 37–47. doi:10.1007/s11661-998-0157-3
Egry, I., Brooks, R., Holland-Moritz, D., Novakovic, R., Matsushita, T., Ricci, E., et al. (2007). Thermophysical properties of γ-titanium aluminide: the European IMPRESS project. Int. J. Thermophys. 28, 1026–1036. doi:10.1007/s10765-007-0219-6
Evers, L., Brekelmans, W., and Geers, M. (2004). Non-local crystal plasticity model with intrinsic SSD and GND effects. J. Mech. Phys. Solid. 52, 2379–2401. doi:10.1016/j.jmps.2004.03.007
Fujiwara, T., Nakamura, A., Hosomi, M., Nishitani, S. R., Shirai, Y., and Yamaguchi, M. (1990). Deformation of polysynthetically twinned crystals of TiAl with a nearly stoichiometric composition. Philos. Mag. A 61(4), 591–606. doi:10.1080/01418619008231937
Grujicic, M., and Batchu, S. (2001). A crystal plasticity materials constitutive model for polysynthetically-twinned γ-TiAl +
Grujicic, M., Cao, G., and Batchu, S. (2003). Crystal plasticity-based finite element analysis of deformation and fracture of polycrystalline lamellar γ-Ti3Al +
Grujicic, M., and Cao, G. (2002). Crack growth in lamellar titanium aluminides containing beta phase precipitates. J. Mater. Sci. 37, 2949–2963. doi:10.1023/a:1016017014355
Grujicic, M., and Zhang, Y. (1999). Crystal plasticity analysis of the effect of dispersed β-phase on deformation and fracture of lamellar γ+α2 titanium aluminide. Mater. Sci. Eng. 265, 285–300. doi:10.1016/s0921-5093(98)00858-2
Ilyas, M., and Kabir, M. (2020). Modelling high temperature deformation of lamellar TiAl crystal using strain-rate enhanced crystal plasticity. Mater. Sci. Eng., A 788, 139524. doi:10.1016/j.msea.2020.139524
Inui, H., Kishida, K., Misaki, M., Kobayashi, M., Shirai, Y., and Yamaguchi, M. (1995). Temperature dependence of yield stress, tensile elongation and deformation structures in polysynthetically twinned crystals of Ti-Al. Philos. Mag. A 72 (6), 1609–1631. doi:10.1080/01418619508243933
Inui, H., Oh, M. H., Nakamura, A., and Yamaguchi, M. (1992a). Ordered domains in tial coexisting with ti3al in the lamellar structure of ti-rich tial compounds. Philos. Mag. A 66 (4), 539–555. doi:10.1080/01418619208201574
Inui, H., Oh, M. H., Nakamura, A., and Yamaguchi, M. (1992b). Room-temperature tensile deformation of polysynthetically twinned (PST) crystals of TiAl. Acta Metall. Mater. 40 (11), 3095–3104. doi:10.1016/0956-7151(92)90472-q
Kad, B. K., and Asaro, R. J. (1997). Apparent hall-petch effects in polycrystalline lamellar TiAl. Philos. Mag. A 75 (1), 87–104. doi:10.1080/01418619708210284
Kad, B. K., Dao, M., and Asaro, R. J. (1995a). Numerical simulations of plastic deformation and fracture effects in two phase γ-TiAl + α2-Ti3Al lamellar microstructures. Philos. Mag. A 71 (3), 567–604. doi:10.1080/01418619508244469
Kad, B. K., Dao, M., and Asaro, R. J. (1995b). Numerical simulations of stress-strain behavior in two-phase α2 + γ lamellar TiAl alloys. Mater. Sci. Eng. 192–193, 97–103. doi:10.1016/0921-5093(94)03210-6
Kalidindi, S. R. (1998). Incorporation of deformation twinning in crystal plasticity models. J. Mech. Phys. Solid. 46 (2), 267–290. doi:10.1016/s0022-5096(97)00051-3
Kim, H. Y., Wegmann, G., and Maruyama, K. (2002). Effect of stress axis orientation on the creep deformation behavior of Ti-48Al polysynthetically twinned (PST) crystals. Mater. Sci. Eng. 329–331, 795–801. doi:10.1016/s0921-5093(01)01636-7
Kishida, K., Johnson, D. R., Masuda, Y., Umeda, H., Inui, H., and Yamaguchi, M. (1998). Deformation and fracture of PST crystals and directionally solidified ingots of TiAl-based alloys. Intermetallics 6, 679–683. doi:10.1016/s0966-9795(98)00055-7
Kowalczyk-Gajewska, K. (2011). Micromechanical modelling of metals and alloys of high specific strength. Warsaw, Poland: Instytut Podstawowych Problemów Techniki Polskiej Akademii Nauk.
Lebensohn, R., Uhlenhut, H., Hartig, C., and Mecking, H. (1998). Plastic flow of γ-TiAl-based polysynthetically twinned crystals: micromechanical modeling and experimental validation. Acta Mater. 46 (13), 4701–4709. doi:10.1016/s1359-6454(98)00132-3
Lindemann, J., Buque, C., and Appel, F. (2006). Effect of shot peening on fatigue performance of a lamellar titanium aluminide alloy. Acta Mater. 54, 1155–1164. doi:10.1016/j.actamat.2005.10.043
Ma, A., Roters, F., and Raabe, D. (2006). A dislocation density based constitutive model for crystal plasticity FEM including geometrically necessary dislocations. Acta Mater. 54, 2169–2179. doi:10.1016/j.actamat.2006.01.005
Marketz, W. T., Fischer, F. D., and Clemens, H. (2003). Deformation mechanisms in TiAl intermetallics-experiments and modeling. Int. J. Plast. 19, 281–321. doi:10.1016/s0749-6419(01)00036-5
Maruyama, K., Yamamoto, R., Nakakuki, H., and Fujitsuna, N. (1997). Effects of lamellar spacing, volume fraction and grain size on creep strength of fully lamellar TiAl alloys. Mater. Sci. Eng. 239–240–240, 419–428. doi:10.1016/s0921-5093(97)00612-6
McBride, A., Bargmann, S., and Reddy, B. D. (2015). A computational investigation of a model of single-crystal gradient thermoplasticity that accounts for the stored energy of cold work and thermal annealing. Comput. Mech. 55, 755–769. doi:10.1007/s00466-015-1134-5
Novoselova, T., Malinov, S., Sha, W., and Zhecheva, A. (2004). High-temperature synchrotron X-ray diffraction study of phases in a gamma TiAl alloy. Mater. Sci. Eng. 371, 103–112. doi:10.1016/j.msea.2003.12.015
Parteder, E., Siegmund, T., Fischer, F. D., and Schlögl, S. (1995). Numerical simulation of the plastic behavior of polysynthetically twinned Ti Al crystals. Mater. Sci. Eng. 192–193, 149–154. doi:10.1016/0921-5093(94)03229-7
Parthasarathy, T. A., Subramanian, P. R., Mendiratta, M. G., and Dimiduk, D. M. (2000). Phenomenological observations of lamellar orientation effects on the creep behavior of Ti–48at.%Al PST crystals. Acta Mater. 48, 541–551. doi:10.1016/S1359-6454(99)00347-X
Paul, J. D. H., and Appel, F. (2003). Work-hardening and recovery mechanisms in gamma-based titanium aluminides. Metall. Mater. Trans. 34, 2103–2111. doi:10.1007/s11661-003-0275-x
Pierce, D., Asaro, R., and Needleman, A. (1983). Material rate dependence and local deformation in crystalline solids. Acta metallurgica 31, 1951–1976. doi:10.1016/0001-6160(83)90014-7
Rice, J. R. (1971). Inelastic constitutive relations for solids: an internal-variable theory and its application to metal plasticity. J. Mech. Phys. Solid. 19, 433–455. doi:10.1016/0022-5096(71)90010-x
Roos, A., Chaboche, J.-L., Gélébart, L., and Crépin, J. (2004). Multiscale modelling of titanium aluminides. Int. J. Plast. 20, 811–830. doi:10.1016/j.ijplas.2003.08.005
Roters, F., Eisenlohr, P., Hantcherli, L., Tjahjanto, D. D., Bieler, T. R., and Raabe, D. (2010). Overview of constitutive laws, kinematics, homogenization and multiscale methods in crystal plasticity finite-element modeling: theory, experiments, applications. Acta Mater. 58, 1152–1211. doi:10.1016/j.actamat.2009.10.058
Schafrik, R. E. (1977). Dynamic elastic moduli of the titanium aluminides. Mta, 8, 1003–1006. doi:10.1007/bf02661586
Scheider, I., Li, M., and Cyron, C. (2020). Generalized cohesive interface model combining fracture, fatigue and creep in materials. In Preparation.
Schlögl, S., and Fischer, F. (1996). Micromechanical modelling of TiAl intermetallics. Comput. Mater. Sci. 7, 34–39. doi:10.1016/S0927-0256(96)00057-2
Schlögl, S. M., and Fischer, F. D. (1997a). Numerical simulation of yield loci for pst crystals of TiAl. Mater. Sci. Eng. 239–240, 790–803. doi:10.1016/s0921-5093(97)00668-0
Schlögl, S. M., and Fischer, F. D. (1997b). The role of slip and twinning in the deformation behaviour of polysynthetically twinned crystals of TiAl: a micromechanical model. Philos. Mag. A 75 (3), 621–636. doi:10.1080/01418619708207193
Schnabel, J., and Bargmann, S. (2017). Accessing colony boundary strengthening of fully lamellar TiAl Alloys via micromechanical modeling. Materials 10, 896. doi:10.3390/ma10080896
Schnabel, J. E., Bargmann, S., Paul, J. D. H., Oehring, M., and Pyczak, F. (2019). Work hardening and recovery in fully lamellar tial: relative activity of deformation systems. Phil. Mag. 99, 148–180. doi:10.1080/14786435.2018.1532121
Schnabel, J. E. (2018). Crystal plasticity modeling of fully lamellar titanium aluminide alloys. PhD thesis. Hamburg (Germany): Technische Universität Hamburg.
Seetharaman, Y., and Mecking, H. (1984). A unified phenomenological description of work hardening and creep based on one-parameter models. Acta Metall. 32, 57–70. doi:10.1016/0001-6160(84)90202-5
Staroselsky, A., and Cassenti, B. (2011). Creep, plasticity, and fatigue of single crystal superalloy. Int. J. Solid Struct. 48 (13), 2060–2075. doi:10.1016/j.ijsolstr.2011.03.011
Staroselsky, A., and Cassenti, B. (2008). Mechanisms for tertiary creep of single crystal superalloy. Mech. Time-Dependent Mater. 12, 275–289. doi:10.1007/s11043-008-9065-6
Uhlenhut, H. (1999). Ursachen Plastischer Anisotropie von γ-TiAl-Basislegierungen. PhD thesis. Hamburg (Germany): Technische Universität Hamburg-Harburg.
Umakoshi, Y., and Nakano, T. (1992). Plastic behaviour of TiAl crystals containing a single set of lamellae at high temperatures. ISIJ Int. 32, 139–1347. doi:10.2355/isijinternational.32.1339
Umakoshi, Y., and Nakano, T. (1993). The role of ordered domains and slip mode of α2 phase in the plastic behaviour of TiAl crystals containing oriented lamellae. Acta Metall. Mater. 41 (4), 1155–1161. doi:10.1016/0956-7151(93)90163-m
Umeda, H., Kishida, K., Inui, H., and Yamaguchi, M. (1997). Effects of Al-concentration and lamellar spacing on the room-temperature strength and ductility of PST crystals of TiAl. Mater. Sci. Eng. 239–240, 336–343. doi:10.1016/s0921-5093(97)00601-1
Veyssière, P. (2001). Yield stress anomalies in ordered alloys: a review of microstructural findings and related hypotheses. Mater. Sci. Eng. 309–310, 44–48. doi:10.1016/s0921-5093(00)01662-2
Wegmann, G., Suda, T., and Maruyama, K. (2000). Deformation characteristics of polysynthetically twinned (PST) crystals during creep at 1150 K. Intermetallics 8, 165–177. doi:10.1016/s0966-9795(99)00081-3
Werwer, M., and Cornec, A. (2000). Numerical simulation of plastic deformation and fracture in polysynthetically twinned (PST) crystals of TiAl. Comput. Mater. Sci. 19, 97–107. doi:10.1016/s0927-0256(00)00144-0
Werwer, M., and Cornec, A. (2006). The role of superdislocations for modeling plastic deformation of lamellar TiAl. Int. J. Plast. 22, 1683–1698. doi:10.1016/j.ijplas.2006.02.005
Werwer, M. (2005). Mikromechanische modellierung des verformungs- und bruchverhaltens von lamellarem TiAl. PhD thesis. Hamburg (Germany): University of Technology Hamburg.
Yao, K.-F., Inui, H., Kishida, K., and Yamaguchi, M. (1995). Plastic deformation of V- and Zr-alloyed PST TiAl in tension and compression at room temperature. Acta Metall. Mater. 43, 1075–1086. doi:10.1016/0956-7151(94)00317-b
Zambaldi, C., Roters, F., and Raabe, D. (2011). Analysis of the plastic anisotropy and pre-yielding of (γ/α2)-phase titanium aluminide microstructures by crystal plasticity simulation. Intermetallics 19, 820–827. doi:10.1016/j.intermet.2011.01.012
Zhang, W. J., and Deevi, S. C. (2003). Analysis of the minimum creep rates of TiAl alloys. Mater. Sci. Eng. 362, 280–291. doi:10.1016/s0921-5093(03)00589-6
Keywords: crystal plasticity, creep, titanium aluminide, polysynthetically twinned crystal, lamellar microstructure, CPFEM
Citation: Schnabel JE and Scheider I (2021) Crystal Plasticity Modeling of Creep in Alloys with Lamellar Microstructures at the Example of Fully Lamellar TiAl. Front. Mater. 7:581187. doi: 10.3389/fmats.2020.581187
Received: 08 July 2020; Accepted: 16 September 2020;
Published: 22 February 2021.
Edited by:
Seunghwa Ryu, Korea Advanced Institute of Science and Technology, South KoreaReviewed by:
Hojun Lim, Sandia National Laboratories (SNL), United StatesLorenzo Bardella, University of Brescia, Italy
Copyright © 2021 Schnabel and Scheider. This is an open-access article distributed under the terms of the Creative Commons Attribution License (CC BY). The use, distribution or reproduction in other forums is permitted, provided the original author(s) and the copyright owner(s) are credited and that the original publication in this journal is cited, in accordance with accepted academic practice. No use, distribution or reproduction is permitted which does not comply with these terms.
*Correspondence: Jan E. Schnabel, amFuLWVpa2Uuc2NobmFiZWxAaHpnLmRl