 Carlos A. Vivas-Lopez1
 Juan C. Tudon-Martinez1*
 Alfonso Estrada-Vela2
 Jorge de Jesus Lozoya-Santos2
 Ruben Morales-Menendez2
- 1School of Engineering and Technologies, Universidad de Monterrey, San Pedro Garza García, Mexico
- 2School of Engineering and Sciences, Tecnológico de Monterrey, Monterrey, Mexico
Semi-active vehicle suspensions are used to improve the limited comfort performance of passive vehicle suspensions by varying the damping coefficient according to a control strategy. These benefits have been usually studied in a transient and frequency domain, but rarely in a multi-body dynamic analysis considering the mechanical components and their joints. In this study, the controllability effects of a magnetorheological (MR) damper on the mechanical components of a McPherson automotive suspension are investigated using a stress concentration analysis. Finite element analysis was used with a Quarter of Vehicle (QoV) suspension model configured with an MR damper, and then compared with the passive damper. The simulation results show that an SA damper in the suspension not only improves the dynamic behavior of a road vehicle, but it also has the positive effect of reducing the stress concentrations in a critical suspension element, the knuckle, that are generated by high amplitude road profiles such as rough roads or dangerous street bumps.
1 Introduction
Semi-active (SA) suspension systems have become one of the best options for improving the performance of conventional passive dampers (Lord-Corporation, 2018). They have a wide range of applications, from home appliances to transportation vehicles, to structural applications (Kumar et al., 2019). Magnetorheological (MR) dampers are the most used type of SA suspension system in the industry (Jiang et al., 2012). These types of dampers have the advantages of a continuously adjustable damping coefficient with a fast transition response, a relatively low energy input to operate, and require minimal packaging (Alghamdi et al., 2014).
SA and active suspension systems are appearing more frequently in passenger vehicles and with current market demands, the automotive industry requires original equipment manufacturers (OEMs) to achieve shorter product development process times (Vinodh et al., 2013), especially with the incursion of startups disrupting this field (Ferràs-Hernández et al., 2017). In order to cope with rapidly changing market demands and bigger competition, one of the main ways to achieve shorter product development times is to use concurrent techniques instead of a linear process (Kus̆ar et al., 2004). In this process, rapid prototyping, computer-aided design, and engineering are essential tools. One of the most critical steps in this process is the virtual validation of the design, which is achieved by finite element methods (FEM).
FEM tools are used for different areas of the suspension system. One focus is to represent the nonlinear behavior of the viscous fluid inside the damper, as in (Guo et al., 2019), where the authors proposed a 2D flow model to predict the transition of the MR fluid to the post-yield region. The other main topic is to analyze the mechanical behavior of suspension components. In (Ossa et al., 2011), the authors used a FEM analysis to predict failure in ball joints. In (Kulkarni et al., 2016), the authors analyzed the effects of increased vehicle mass on the suspension system element life of in-wheel motor vehicles; and in (Lee and Yang, 2013), the authors developed a method to evaluate the torsional stiffness of a torsional beam under different load applications.
The effects of the controllable damping coefficient, on how the vehicle behaves regarding handling and ride comfort, is also being studied (Jugulkar et al., 2016). evaluated a damper design capable of changing its coefficient by actively opening or closing flow holes (Alexandru, 2020), studied different control strategies to improve driving performance, and (Tudon-Martinez et al., 2019) analyzed how the damper model affects the control strategy performance. In addition (Tudón-Martínez and Morales-Menendez, 2015), proposed a method to use the controllability characteristics to compensate when a failure occurs in the damper.
From the presented review, it is clear that the focus in literature has been on the effects on vehicle dynamics generated by an adaptable suspension system, rather than on the mechanical implications on its components. Thus, an analysis of the mechanical effects of controllability in suspension elements equipped with an MR damper was conducted in this study. This case study included a quarter of the vehicle multi-body model evaluated by LS-DYNA®, which is a general-purpose finite element program capable of simulating highly non-linear and transient dynamic problems.
Recently, some studies have researched the force, strength and/or stress analysis in automotive suspensions with passive dampers for particular vehicle designs, such as solar vehicles or racing cars, and especially for fatigue analysis purposes (Ijagbemi et al., 2016; Odabaşi et al., 2019; Rui et al., 2019). All of these analyses have been carried out in simulation scenarios using different multi-Physics software. In this study, a multi-physics software is also used to perform the FEM analysis. The main contribution of this paper is a stress concentration analysis of an automotive SA suspension control system in tandem with a dynamic behavior analysis (in both time and frequency), showing how these results may complement the performance evaluation task in the design process of new SA suspension products (e.g., dampers, sensors, controllers, etc.).
The article is structured as follows: In Section 2, the model description, FEM considerations, controllers to be used as the study case, and the proposed tests are presented. Then, in Section 3, the results are presented, first detailing the characteristics of the experimental MR damper, then its frequency and time performance compared to a passive damper, and finally a stress concentration analysis using FEM for a multi-body model of a McPherson automotive suspension. Finally, Section 4 concludes that the semi-activity property of an MR damper can reduce the stress concentrations in the suspension components in contrast to a passive damper and introduces further work from this research group.
2 Materials and Methods
A multi-body dynamic model of a Quarter of Vehicle (QoV) was used with FEM simulations of the suspension system at different damping configurations. Figure 1 illustrates the general elements of a typical McPherson suspension assembly, also it is the multi-body model representation programmed in the LS-DYNA® software.
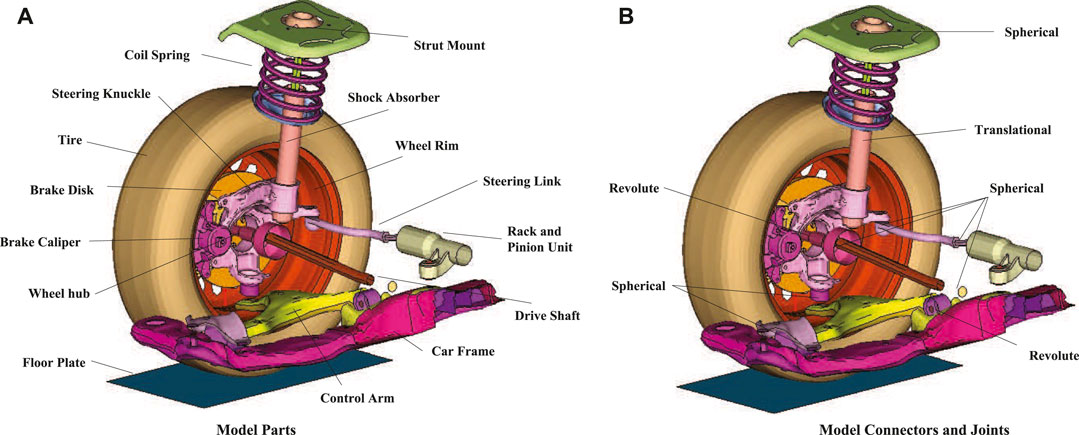
FIGURE 1. McPherson suspension in a QoV model of a sedan vehicle showing its components.
2.1 QoV Model
The FEM simulations used to analyze the stress concentration of an SA suspension system are based on a decentralized QoV topology. A typical QoV model is represented by a sprung mass (
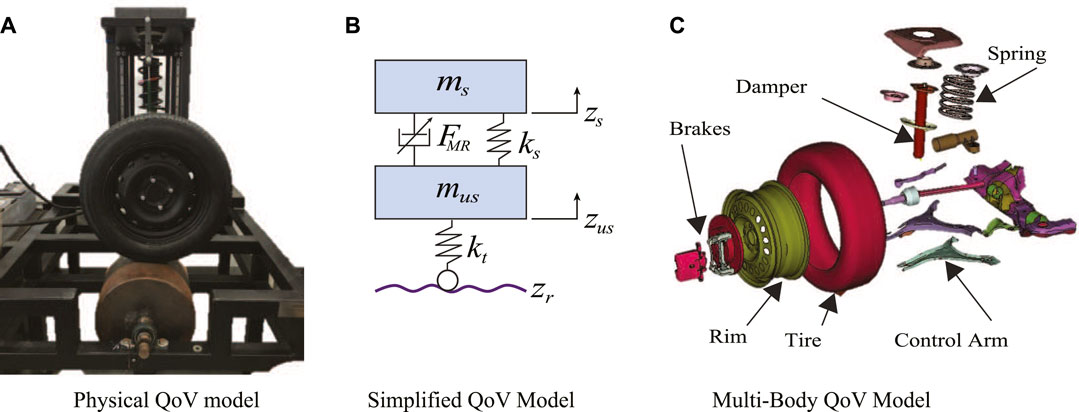
FIGURE 2. Different QoV model conceptualizations: (A) physical platform, (B) 2-dimension simplified representation and (C) the multi-body model used in the study.
The QoV model parameters of Eq. 1 are identified on the experimental platform in Figure 2A. Figure 3A presents the real characteristic curve of the coil spring, the linear zone of the spring stiffness is marked with a green line and its corresponding jounce/rebound stop regions marked with dashed-gray lines. From this figure two data points where obtained, a constant parameter (43.2 N/mm) for the simplified QoV simulations and a look-up table for the finite element analysis (FEA) model. Figure 3B shows the variable damping force of an experimental MR damper whose actuation varies from 0 to 2.5 A. The damper stroke is 40 mm, and it has asymmetric performance in its compression/extension effects. The characterization of these components was performed independently of the QoV topology using a universal material testing machine. Figure 2C shows an exploded view of the QoV model with all suspension components to illustrate the mechanical joints considered in this study for the FEA tests.
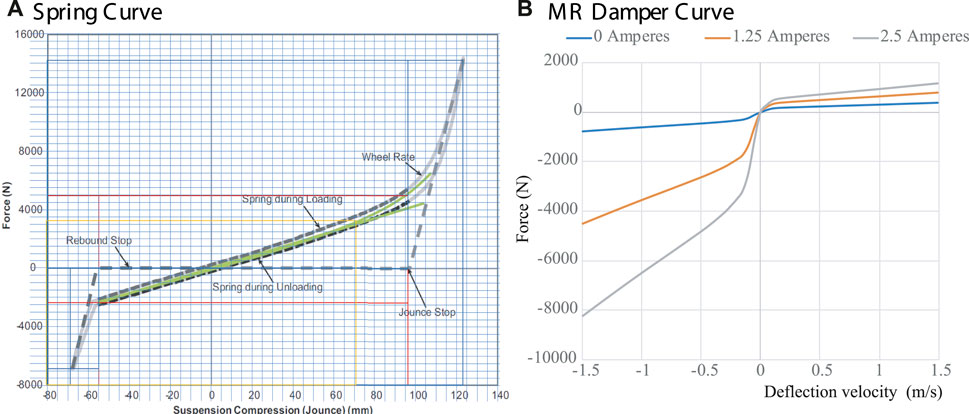
FIGURE 3. (A) Stiffness force of the coil spring [Solid-Gray—Real curve, Dashed-Gray—Linearized curves and Solid-Green proposed value] and (B) variable damping force of an MR damper [Blue—0A, Orange—1.25 A and Gray—2.5 A].
In order to estimate the values of the
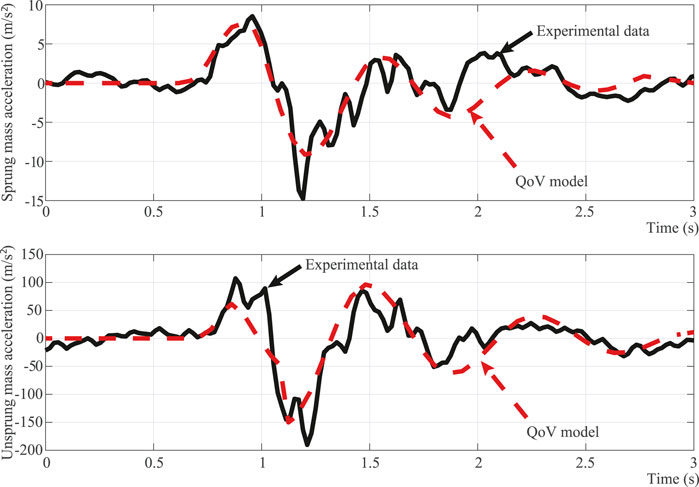
FIGURE 4. Performance of the identified QoV model (dashed-red) parameters compared to experimental data (solid-black). (A) Sprung. (B) Unsprung mass curve.
2.2 MR Damper Characterization and Modeling
The MR damper considered in this study is manufactured by BWI, Figure 5A, and it uses electric current levels (u) from 0 to 2.5 A, with 0 A being associated with the lowest damping coefficient and 2.5 A with the maximum level. The MR damper has an approximate rod stroke of ±40 mm and a calculated transient response of 39 m Figure 5B. The time response presented in Figure 5B was obtained using a triangular displacement input to the damper to ensure a constant speed neglecting other dynamical effects, then at the middle of the displacement a change in current was introduced to the damper coil to modify the generated damping force. The resultant time reported is from the moment the current signal is commanded to the time force, reaching 90% of its final value.
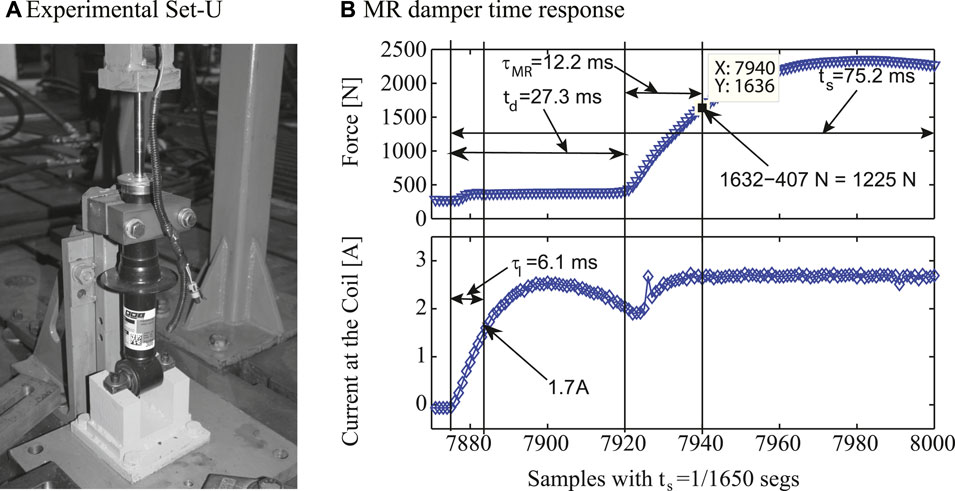
FIGURE 5. Experimental MR damper tested in a universal material testing machine and its time-response dynamics.
Figure 6 shows the general controllability characteristics of the MR device and its variable energy absorption capacity. A key characteristic the damping force of an MR shock-absorber is that it can be increased by means of the current signal, but also by increasing the excitation frequency. For instance, Figures 6A,B show that the force increments when the electric current is changed, and this effect is consistent when the frequency of motion increases. Figure 6C clearly shows the direct proportionality between the electric current and MR force as well as the direct proportionality between the excitation frequency and MR force. Similarly, Figure 6D shows how the maximum force value changes depending on the electric current input and the excitation frequency, in a directly proportional manner. Figures 6E,F show the Force-Displacement (FD) characteristic maps. It should be noted that the MR damper has asymmetrical behavior, that is, the maximum achievable force level is lower when the damper is subjected to a compression force than when it is in extension, this effect is especially noted when increasing the frequency. Extension behavior, the positive force part of the graph, has a more linear increment than compression behavior, which increments tend to flatten faster, as it can be seen in Figure 4B.
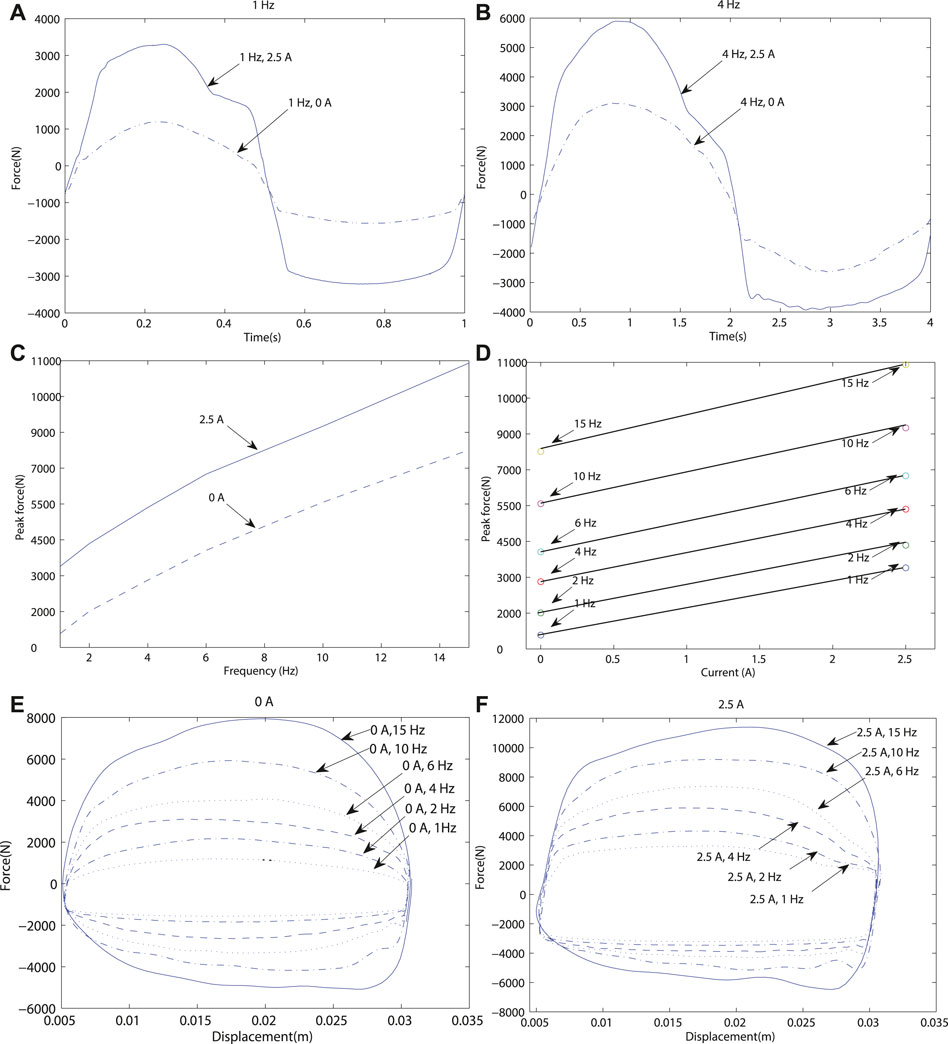
FIGURE 6. Operational characteristics of the MR damper.
Figure 7 presents in further detail the force dependency on the excitation frequency by analyzing the Force-Velocity (FV) characteristic curves. For this characterization, a fixed amplitude sinusoidal signal, which only changes its frequency, was applied to the damper deflection. It is also worth mentioning that the velocity scale in each figure is different, so the full effect of the frequency could be observed. Figure 7 presents the FV diagrams for two electric current levels, 0 and 2.5 A, at frequency set of {1, 2, 4, 6, 10, 15} Hz. It can be observed that as the frequency increases, the hysteresis of the force also increases; this effect is caused by the turbulent flow generated inside the tube (Zhang et al., 2016). It can also be observed that the asymmetry between the jounce/rebound effects increases at a higher frequency of motion (de J Lozoya-Santos et al., 2012), and (Vivas-Lopez et al., 2015).
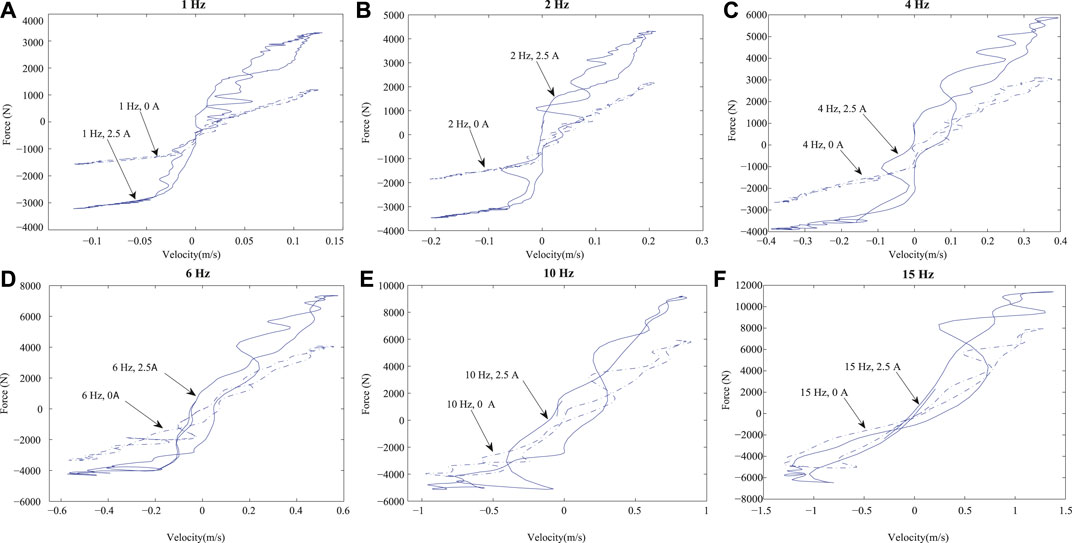
FIGURE 7. FV characteristic curves of the MR damper at different frequencies [1, 2, 4, 6, 10, and 15 Hz] and electric current inputs [0 A (dashed-blue) and 2.5 A (solid-blue)].
This experimental characterization was used to propose approximated FV curves, as shown in Figure 3B, for the MR damper, which was then programmed into the LS-DYNA® software for the FEM simulations.
The MR damper model used for the FEM analysis was proposed by Guo et al. (Guo et al., 2006). This model focuses on reproducing the nonlinear bi-viscous and hysteretic behaviors of the MR fluid. The nonlinear MR damping force (
where the five coefficients have physical meaning,
To represent the asymmetry of the MR damper in Eq. 2, two sets of parameters were estimated, one for when the damper is under compression and the other set for when the damper is under extension. The parameters are listed in Table 1.
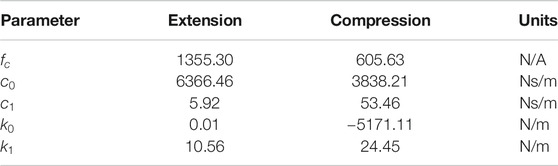
TABLE 1. Estimated parameters for the asymmetric algebraic model of (Guo et al., 2006).
Figure 8 shows a qualitative evaluation of the fit performance of the estimated model in comparison to the experimental data. In these plots, it can be observed that the considered model captures most of the behavior of the real data, with slight saturation near the maximum forces achieved by the real damper. For a more extensive modeling and qualitative evaluation study of the performance of the algebraic model of (Guo et al., 2006) for the MR damper, readers can refer to the work by (Tudón-Martínez et al., 2012).
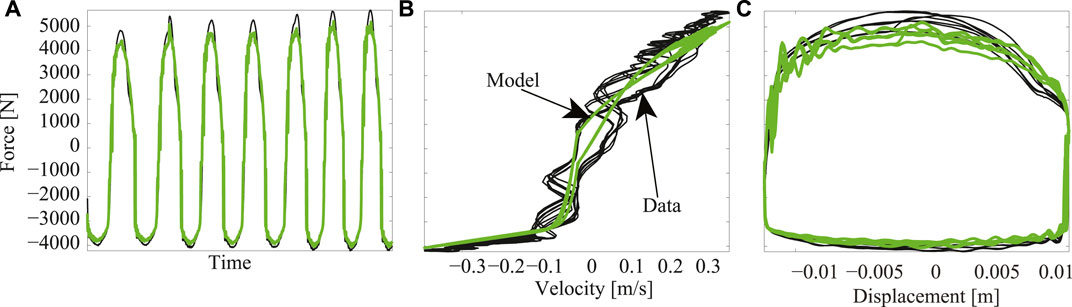
FIGURE 8. MR damper model (green) performance evaluation vs measured data (black): (A) Transient response of the model, (B) FV characteristic curve, and (C) FD characteristic curve. In this case, the experiment was performed with electric current of 2.5 A as damper control input and 4 Hz as frequency of excitation of the shock absorber deflection.
2.3 FEM Considerations
The developed model includes most of the parts of the front suspension. It was simplified by using a shell mesh with an average size of 8 mm for most of the parts, as shown in Figure 9B, while the knuckle and brake caliper are modeled using a solid tetra mesh with an average size of 5 mm, as shown in Figure 9A.
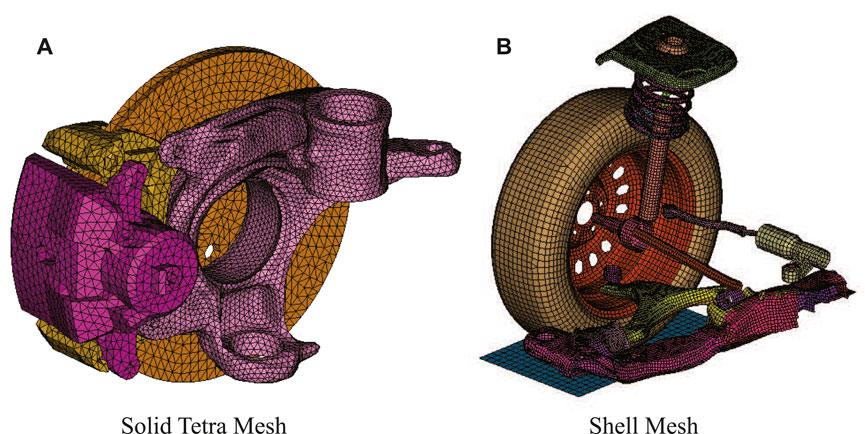
FIGURE 9. Mesh used on the different elements for the FEA analysis of the QoV model.
The QoV model was constrained by allowing only vertical displacement on the car frame and strut mount. All other parts were constrained only by their mechanical connections, which were simplified with revolute, spherical, and translational joints to properly model the load transfer and kinematics of the suspension mechanism. Contact mechanics were defined for all parts and gravity was implemented. Motion along the z-axis was prescribed to the rigid floor plate to simulate road input.
Because the steering knuckle takes most of the load by supporting the wheel, tire, brakes, and sprung mass of the vehicle during vertical dynamics, the analysis focused on this part, which was modeled as cast iron with material properties: density = 7.850e-09 kg/m3, Young’s modulus = 170 GPa, yield stress = 304 MPa, ultimate stress = 502 MPa, and Poisson ratio = 0.29.
The suspension spring and damper were simplified using 1D elements that allow a direct input of the force vs. displacement and force vs. velocity curves, respectively. The tire was simplified as well using a 1D spring element to maintain consistency within the model.
2.4 SA Controller Assessment
In this study, two semi-active QoV-based control strategies were considered to regulate the MR damper actuation in the FEM simulations. The frequency estimation based (FEB) controller proposed in (de Jesus Lozoya-Santos et al., 2011) and the Mix-1 sensor (Mix 1) control algorithm proposed by Savaresi and Spelta (2009) were selected to regulate the MR damper actuation in this study. Both controllers have better comfort performance than the classical Sky-Hook controller, and their actuation is softer.
The FEB control algorithm is given by
where the MR damping force is soft/hard at the minimum/maximum actuation (electric current), and
The Mix 1 controller requires two states of the damper, and the control law is given by
where α is a frequency parameter of design.
Note that both controllers are extremely simple to design and operate. At each sampling interval, the controllers select a soft or hard damping force according to the dominant frequency content in the vertical motion of the chassis (sprung mass).
The assessment of the SA controller in this study is divided into three sections:
• Comfort and road-holding performance in the time response of the SA suspension controllers in comparison to a passive damper. Passenger comfort can be measured by the vertical motion of the sprung mass (position or acceleration) and the road-holding performance by the tire deflection (
• Comfort and road-holding performance in the frequency response of the SA suspension controllers in comparison to a passive damper.
• Stress concentrations in the mechanical elements of a SA suspension system due to the MR damper controllability compared to those caused by a passive damper, analyzed by FEM simulations.
2.5 Simulation Tests
Two different simulation tests were used in the aforementioned SA controller assessment:
• Test 1: A 50 mm amplitude bump at 20 km/h vehicle velocity. This test allows the evaluation of the transient performance of the suspension under a typical bump disturbance.
• Test 2: An ISO 8608 road profile test (type D) at a vehicle velocity of 60 km/h. This test was used to assess the MR damping force in a typical suspension environment by considering the normal frequency content of the vehicle vertical movement (from 0 to 20 Hz).
As a benchmark for the controller assessment, both tests were also performed on a passive suspension. Time and frequency response analyses were carried out in a Matlab/Simulink® environment and the FEM simulations with the LS-DYNA® software.
3 Results and Discussion
In this section, the simulation results in the time and frequency domains for the SA controller are discussed along with the FEM simulation results.
3.1 QoV Controllers Evaluation
The considered MR damper model, defined in Eq. 2, was embedded in the QoV model dynamics of Eq. 1 to assess the time and frequency performance of the SA suspension controllers. This evaluation was carried out using the Matlab-Simulink® software.
Because the FEB and Mix-1 control algorithms use the frequency response analysis of the SA suspension for design, Figure 10 illustrates the frequency response of the open-loop QoV model dynamics at several electric current inputs;
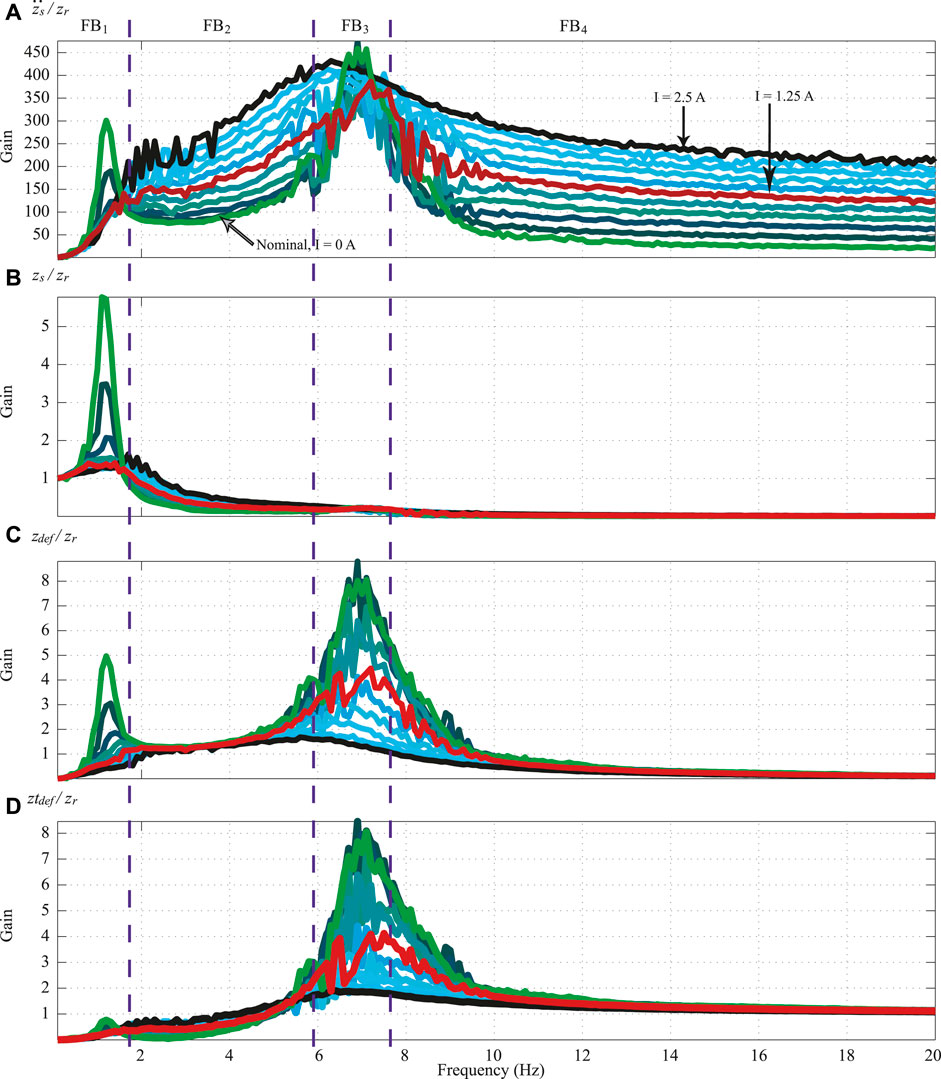
FIGURE 10. Frequency response analysis for the simplified QoV model dynamics at different electric current inputs [open-loop] (0 A light green, 1.25 A red, 2.5 A black, intermediated levels different tones of blue).
In these plots of Figure 10, it can be observed that there are four frequency bands of interest. For example, in FB1 (that encloses the resonance frequency of
Figure 11 illustrates the assessment of the transient response of the SA controllers for Test 1, considering two bumps. Clearly both SA controllers have better comfort and road-holding performance than the passive suspension, because the motion is lower and softer in the
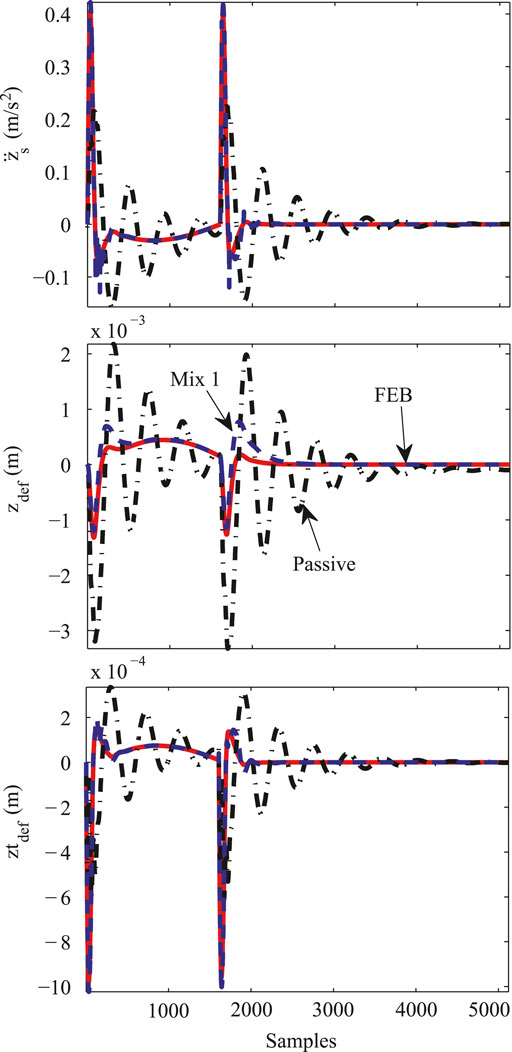
FIGURE 11. Time domain response of the simplified QoV model for a bump test, comparing the performance of Mix-1 (dashed-blue) and FEB (dashed-red) controllers vs. a passive damper (dashed-black).
For Test 2, the time response of the different damping configurations is shown in Figure 12. In this case, the SA suspension controllers offer better passenger comfort and less suspension deflection movements than the passive damper. However, because the road profile is sufficiently rough, the tire deflection is similar for all damping configurations.
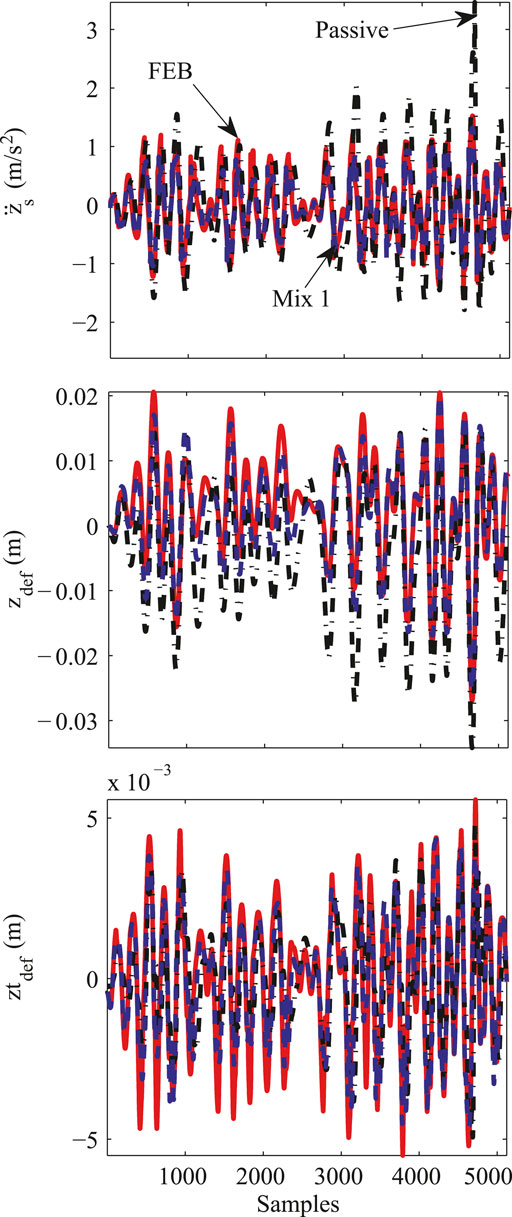
FIGURE 12. Time domain response of the simplified QoV model for Test 2, comparing the performance of Mix-1 (dashed-blue) and FEB (dashed-red) controllers with respect to a passive damper (dashed-black).
To assess the frequency performance of the SA suspension controllers, sinusoidal signals in
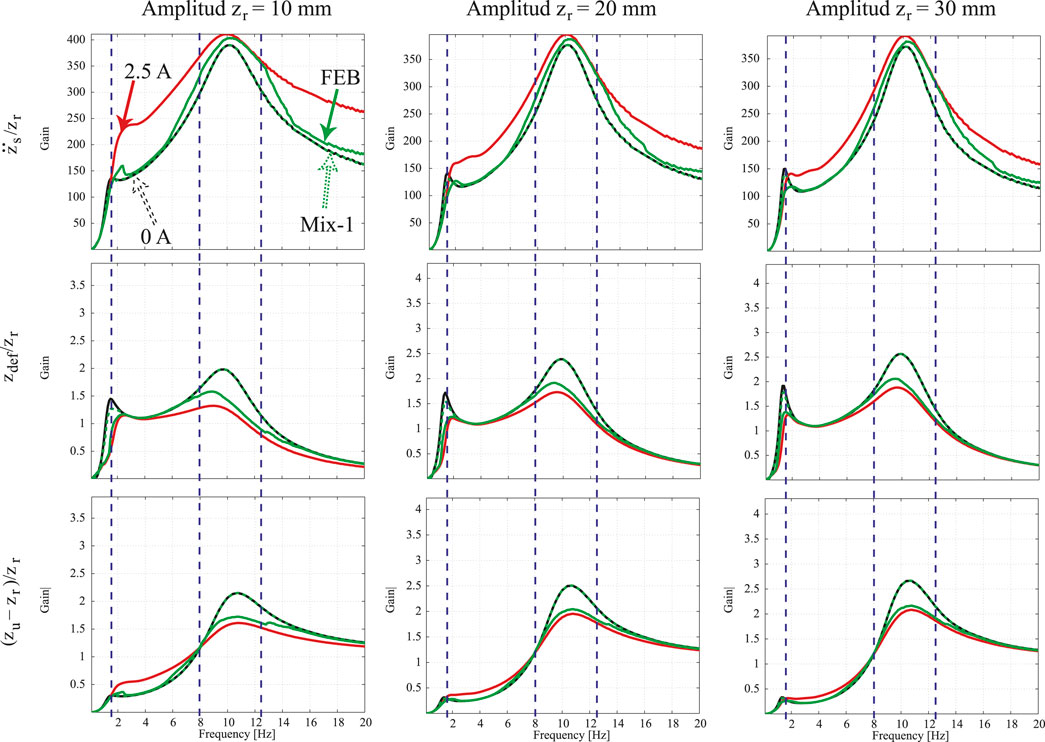
FIGURE 13. Frequency response analysis of the QoV model at different excitation signals comparing the performance of the Mix-1 (dashed-green) and FEB (solid-green) controllers with respect to the softest [0 A] (dashed-black) and hardest [2.5 A] (solid-red) suspension system.
3.2 FEM Evaluation
The QoV model parameters, including the MR damper model coefficients, were introduced into the LS-DYNA® software for the FEM simulations. As in Matlab/Simulink, in the multi-physics program LS-DYNA®, the same tests were performed considering the two SA suspension controllers in comparison with the passive damper.
Figure 14 shows the time domain response of the SA suspension controllers for both tests compared to the passive suspension. The results are congruent with the simulations in Matlab/Simulink, i.e., the SA controllers improve the suspension performance compared to a passive damper. The passive damper shows a higher suspension deflection
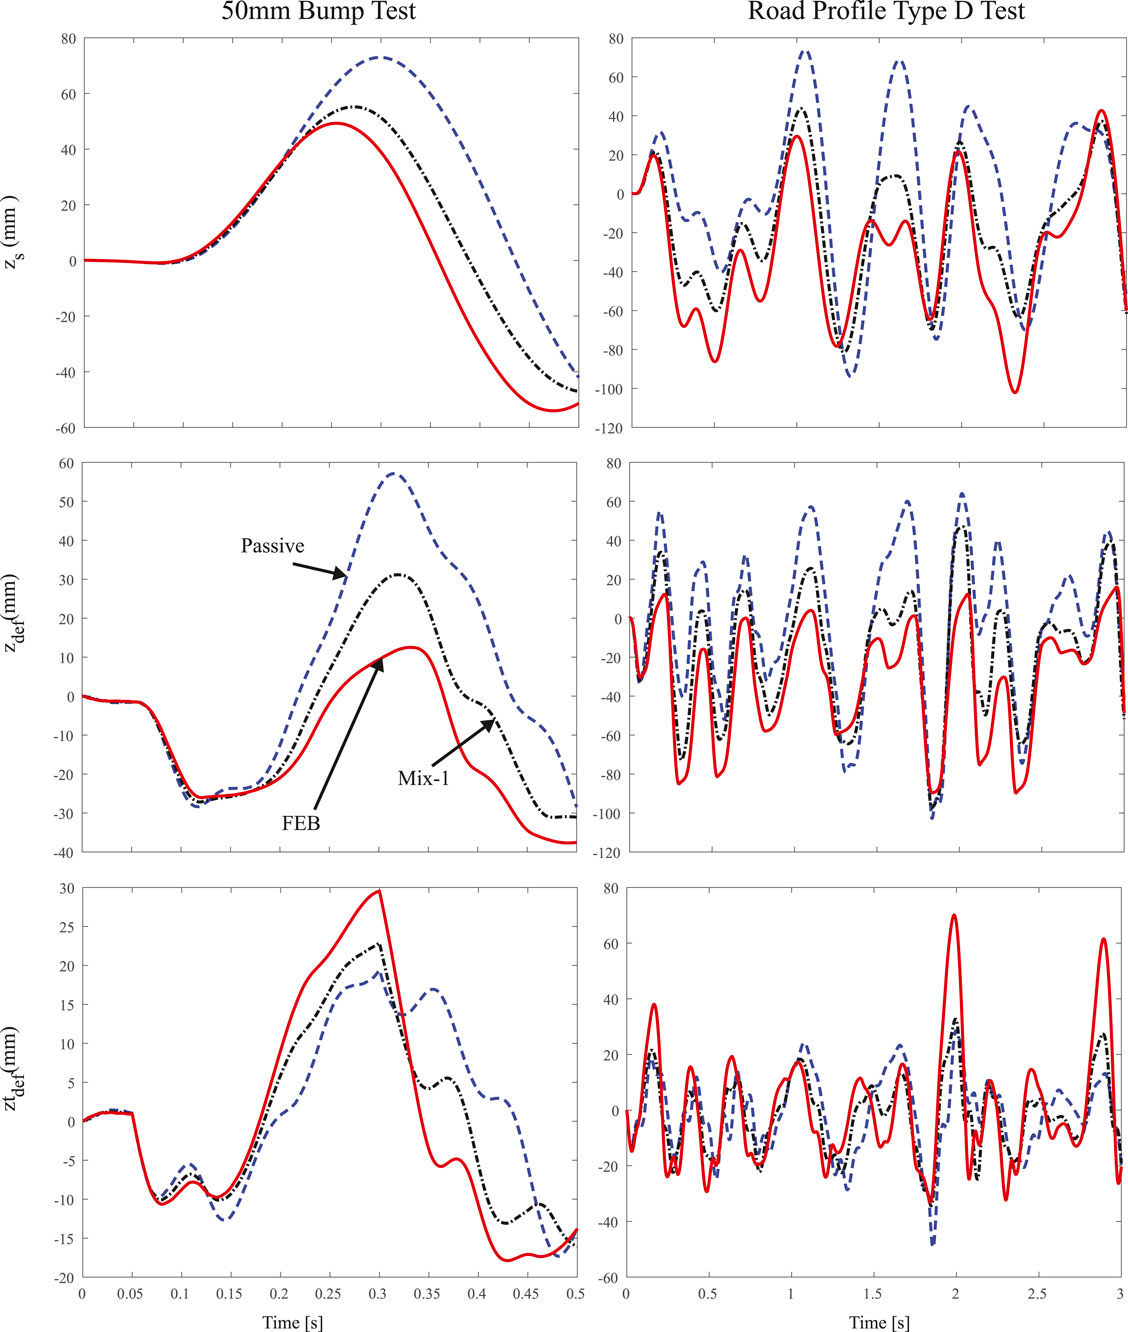
FIGURE 14. Time domain response for Test 1 and Test 2 performed with the FEM simulation. Performance comparison of Mix-1 (dashed-black) and FEB (solid-red) controllers with respect to a passive damper (dashed-blue).
To evaluate the effect of the MR damper in the mechanical suspension elements, the three McPherson suspension components with the most stressed concentrations were selected in this analysis: steering knuckle, control arm, and wheel mount. Figure 15 presents the stress concentrations at the steering knuckle of the suspension caused by different road profiles. Figure 15A represents the stress concentration for the bump test and Figure 15B for the ISO road profile test. It can be seen from these figures that having an SA suspension control strategy helps to decrease the stress concentration at the knuckle, possibly contributing to extended life of the component.
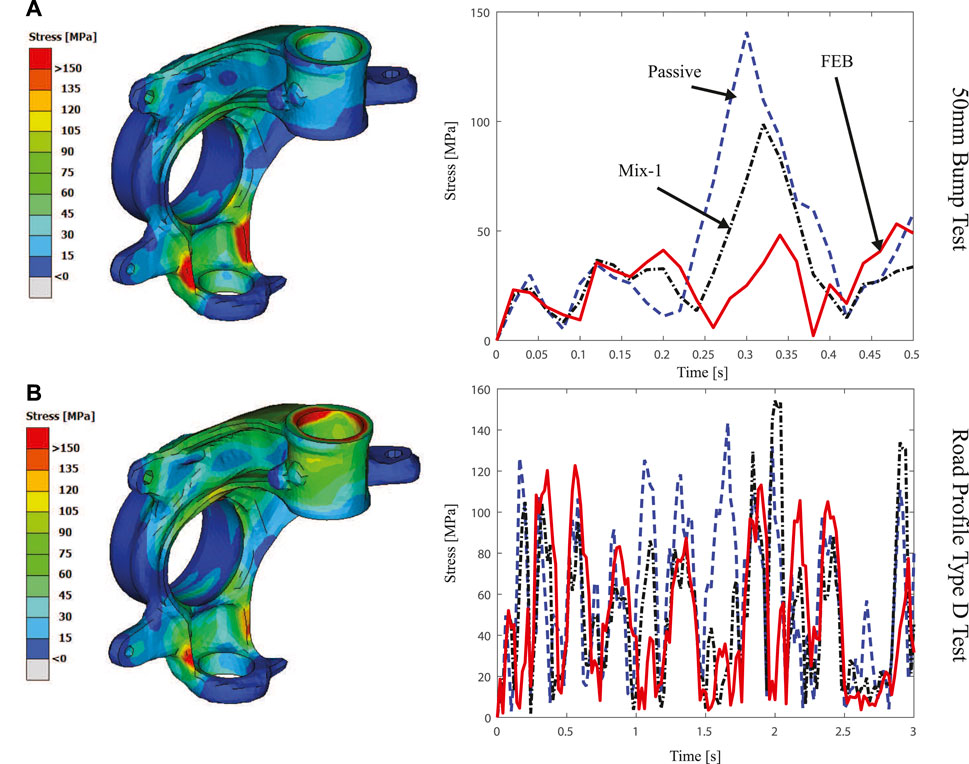
FIGURE 15. Average Von Mizes stress generated in the knuckle due to different road profiles [(A) 50 mm bump road test (top) and (B) Type D road profile (bottom)] under different control strategies [Passive (dashed-blue), FEB (solid-red) and Mix-1 (dashed-black)].
Figure 16 presents the stress concentrations at the control arm of the suspension. Figure 16A represents the stress concentration for the bump test, here, having any control strategy contributes to reducing the rebound effect after the abrupt movement caused by the bumper at 0.3 s. Figure 16B shows the effects of the ISO road profile test, in this case having a control strategy reduces the maximum generated stress in comparison with respect to the passive damper, e.g. the 450 MPa generated by the passive damper around the 2 s are reduce up to 350 MPa using the FEB controller. For this element, the biggest concentration is located at the base of the arm, where it assembles with the chassis.
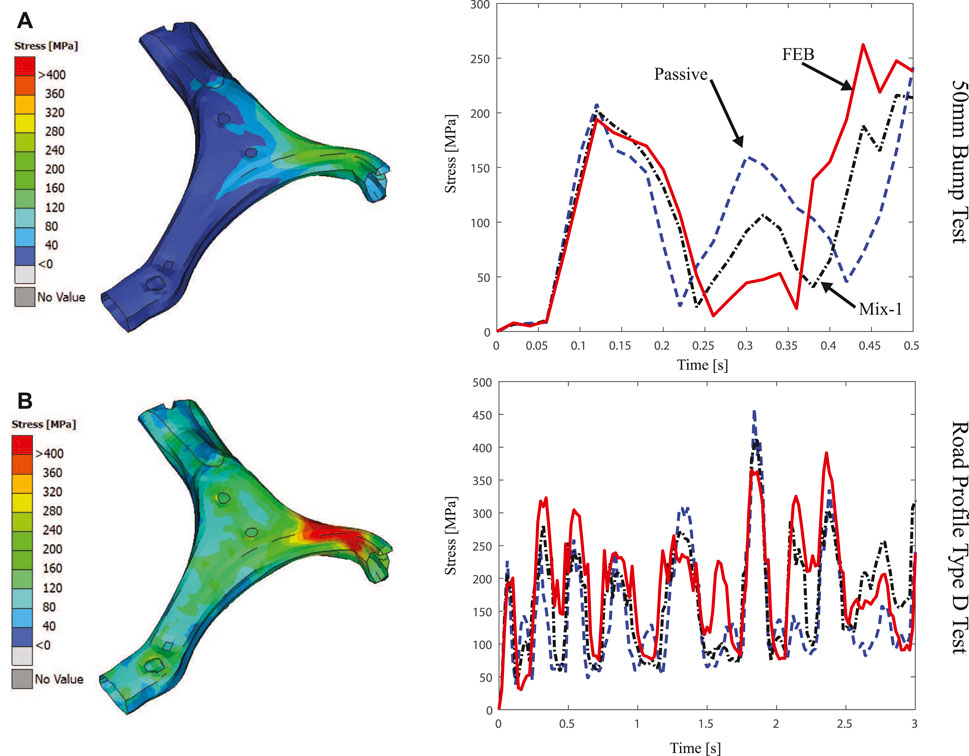
FIGURE 16. Average Von Mizes stress generated in the Control Arm due to different road profiles [(A) 50 mm bump road test (top) and (B) Type D road profile (bottom)] under different control strategies [Passive (dashed-blue), FEB (solid-red) and Mix-1 (dashed-black)].
The third element is the wheel mount, in Figure 17 the stress concentrations at this element are presented. Figure 17A represents the stress concentration for the bump test, for this one the Mix-1-sensor strategy achieves a better overall performance, maintaining low stress during the rebound after the bump, as well as during the setting movement at the end of the test. Figure 17B shows that by having a passive damper the mean stress value remains lower, but reaches bigger values at peak moments, while the control strategies have a slightly higher average stress during the test but with lower maximums.
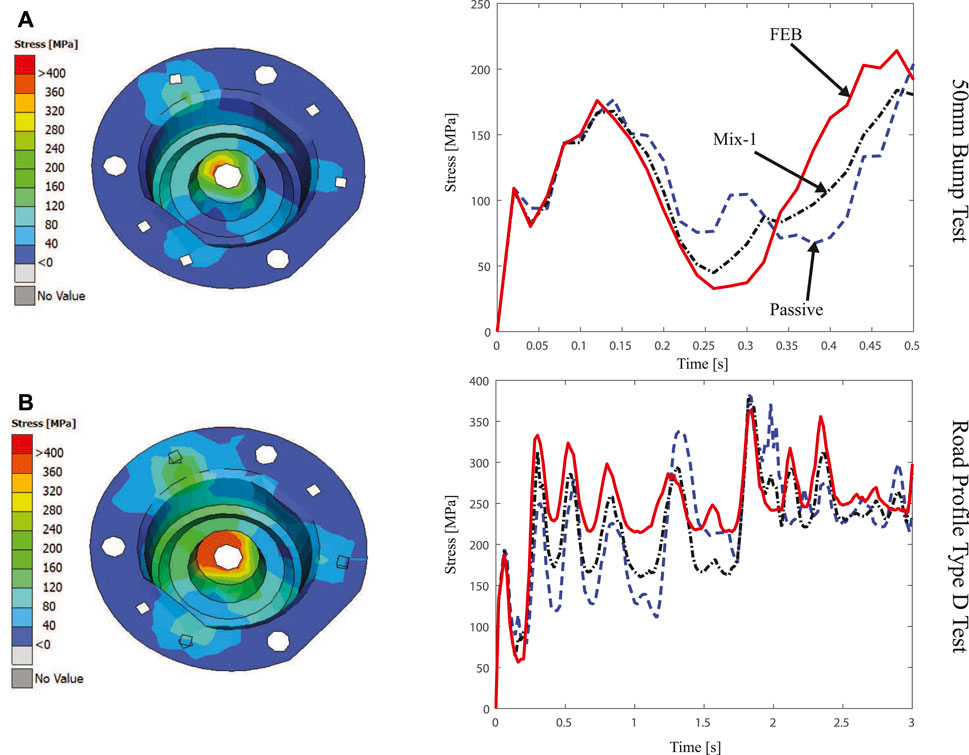
FIGURE 17. Average Von Mizes stress generated in the Wheel Mount due to different road profiles [(A) 50 mm bump road test (top) and (B) Type D road profile (bottom)] under different control strategies [Passive (dashed-blue), FEB (solid-red) and Mix-1 (dashed-black)].
The material used for these elements was HSLA steel with a yield stress of 550 MPa and an ultimate stress of 650 MPa, considering those numbers, in none of the elements the stress exceeds the linear deformation limit. Also, it can be appreciated that a rougher road profile generates more stress in the component than a single bump, even when the bump is much more aggressive than the profile. The location of the stress concentrations in these suspension components also depend on the road disturbance conditions. The steering knuckle has the largest stress concentration in the section used to assemble it with the lower control arm, when the road has abrupt irregularities such as a bump the vehicle goes at low velocity. Whereas the front strut that assembles the steering knuckle with the damper, is the section with the most stress concentrations when the road irregularities are high and persistent, such as an ISO road profile type D, and the vehicle goes at 60 km/h. For the control arm element, the largest stress concentration, for both road tests, is located at the base of the arm used to assemble the suspension McPherson with the chassis. However, the ISO type D road profile test generates more stress (up to 450 MPa) than the bump test (up to 260 MPa). Similar to the control arm, the wheel mount element has the biggest stress concentration in the same location for both road tests, in this case the section used to assemble it with the damper rod. The ISO type D road profile test generates more stress (up to 380 MPa) than the bump test (up to 215 MPa).
A well-balanced SA suspension control strategy, such as the FEB controller, demonstrates not only the reduction of undesirable movement in the cabin, but also reduces the stresses generated in the suspension elements caused by high amplitude road profiles. The Mix-1-Sensor control law also behaves better than a passive suspension; however, being oriented to comfort, it causes much higher stresses on the suspension elements than the FEB controller.
4 Conclusions and Future Work
During the course of this study, the benefits of a semi-active (SA) suspension system equipped with a magneto-rheological (MR) damper were confirmed using a simplified Quarter of Vehicle (QoV) model and with a complex multibody model evaluated using sophisticated multi-physics software. Using different SA control strategies, a semi-active damper can truly improve the dynamic performance of a passenger vehicle. In addition, an effect that is not well-known is the possibility of reducing stress concentrations in the suspension elements. Although the stress concentration analysis in automotive suspensions is not widely described in the literature, this paper demonstrates, with simulations based on a Finite Element Method (FEM), that a SA suspension control strategy helps to decrease the stress concentration at the knuckle, contributing to extending the life of the suspension components. FEM simulations in a quarter of cars illustrate that a rough road profile concentrates more stress in the McPherson suspension components than a single bump, i.e., the constant vibration caused by the rough road will wear the suspension components more than sudden bumps in the road.
On the other hand, the selection of the SA suspension control strategy is also an important key to decreasing the stress concentrations at the suspension components. When the SA suspension controller is road-holding oriented, the stress concentrations will be reduced but the comfort performance can be deteriorated. It is therefore recommended to use a balanced or hybrid control strategy between comfort and road holding objectives.
In future work, the authors will extend this study to evaluate not only stress concentrations at a single point in time but will also carry out a fatigue analysis to describe the controllability effects on the suspension elements in the long term for a full vehicle. In addition, in light of the new generation of electric vehicles, this study may also be extended to include in-wheel motor electric vehicles because the extra mass attached to the unsprung mass represents an additional challenge.
Data Availability Statement
The raw data supporting the conclusion of this article will be made available by the authors, without undue reservation.
Author Contributions
All authors of this paper contributed equally to this work. All authors have read and agreed to the published version of the manuscript.
Conflict of Interest
The authors declare that the research was conducted in the absence of any commercial or financial relationships that could be construed as a potential conflict of interest.
References
Alexandru, C. (2020). A study on the semi-active suspension systems used for motor vehicles. Jriss 2, 16–25. doi:10.33727/JRISS.2020.1.3:16-25
Alghamdi, A. A., Lostado, R., and Olabi, A.-G. (2014). Magneto-rheological fluid Technology. chapter 3. Berlin, Germany: Springer. 43–62. doi:10.1007/978-3-642-45176-8˙3
de Jesus Lozoya-Santos, J., Morales-Menendez, R., Tudón-Martínez, J. C., Sename, O., Dugard, L., and Ramirez-Mendoza, R. (2011). Control strategies for an automotive suspension with a mr damper. IFAC Proc. Volumes 44, 1820–1825. doi:10.3182/20110828-6-it-1002.03641
de-J Lozoya-Santos, J., Morales-Menendez, R., Ramirez-Mendoza, R., Tudón-Martinez, J. C., Sename, O., and Dugard, L. (2012). Magnetorheological damper-an experimental study. J. Intell. Mater. Syst. Structures 23, 1213–1232. doi:10.1177/1045389X12445035
Ferràs-Hernández, X., Tarrats-Pons, E., and Arimany-Serrat, N. (2017). Disruption in the automotive industry: a cambrian moment. Business Horizons 60, 855–863. doi:10.1016/j.bushor.2017.07.011
Guo, P., Xie, J., Dong, X., and Huang, Y. (2019). A two-dimensional axisymmetric finite element analysis of coupled inertial-viscous-frictional-elastic transients in magnetorheological dampers using the compressible herschel-bulkley fluid model. Front. Mater. 6, 293. doi:10.3389/fmats.2019.00293
Guo, S., Yang, S., and Pan, C. (2006). Dynamic modeling of magnetorheological damper behaviors. J. Intell. Mater. Syst. Structures 17, 3–14. doi:10.1177/1045389X06055860
Ijagbemi, C. O., Oladapo, B. I., Campbell, H. M., and Ijagbemi, C. O. (2016). Design and simulation of fatigue analysis for a vehicle suspension system (vss) and its effect on global warming. Proced. Eng. 159, 124–132. doi:10.1016/j.proeng.2016.08.135
Jiang, X.-z., Wang, J., and Hu, H.-s. (2012). Semi-active control of a vehicle suspension using magneto-rheological damper. J. Cent. South. Univ. 19, 1839–1845. doi:10.1007/s11771-012-1217-9
Jugulkar, L. M., Singh, S., and Sawant, S. M. (2016). Analysis of suspension with variable stiffness and variable damping force for automotive applications. Adv. Mech. Eng. 8, 168781401664863. doi:10.1177/1687814016648638
Kulkarni, A., Ranjha, S. A., and Kapoor, A. (2016). Fatigue analysis of a suspension for an in-wheel electric vehicle. Eng. Fail. Anal. 68, 150–158. doi:10.1016/j.engfailanal.2016.05.020
Kumar, J. S., Paul, P. S., Raghunathan, G., and Alex, D. G. (2019). A review of challenges and solutions in the preparation and use of magnetorheological fluids. Int. J. Mech. Mater. Eng. 14, 13. doi:10.1186/s40712-019-0109-2
Kus̆ar, J., Duhovnik, J., Grum, J., and Starbek, M. (2004). How to reduce new product development time. Robot Comput. Integr. Manuf. 20, 1–15. doi:10.1016/S0736-5845(03)00049-8
Lee, D., and Yang, C. (2013). An analytical approach for design and performance evaluation of torsion beam rear suspension. Finite Elem. Anal. Des. 63, 98–106. doi:10.1016/j.finel.2012.09.002
Lord-Corporation (2018). Magneto-rheological (mr) suspension systems—for industrial applications. Cary, NA: Lord-Corporation.
Odabaşi, V., Maglio, S., and Sorrentino, S. (2019). Static stress analysis of suspension systems for a solar-powered car. FME Trans. 47, 70–75. doi:10.5937/fmet1901070O
Ossa, E. A., Palacio, C. C., and Paniagua, M. A. (2011). Failure analysis of a car suspension system ball joint. Eng. Fail. Anal. 18, 1388–1394. doi:10.1016/j.engfailanal.2011.03.013
Rui, R., Gong, B., and Fang, Z. (2019). Force and strength analysis of fsae racing suspension based on spatial analytic geometry. IOP Conf. Ser. Mater. Sci. Eng. 612, 032022. doi:10.1088/1757-899x/612/3/032022
Savaresi, S. M., and Spelta, C. (2009). A single-sensor control strategy for semi-active suspensions. IEEE Trans. Contr. Syst. Technol. 17, 143–152. doi:10.1109/tcst.2008.906313
Tudon-Martinez, J. C., Hernandez-Alcantara, D., Amezquita-Brooks, L., Morales-Menendez, R., Lozoya-SantosLozoya-Santos, J. d. J. J., and Aquines, O. (2019). Magneto-rheological dampers-model influence on the semi-active suspension performance. Smart Mater. Struct. 28, 105030. doi:10.1088/1361-665X/ab39f2
Tudón-Martínez, J. C., Lozoya-Santos, J. J., Morales-Menendez, R., and Ramirez-Mendoza, R. A. (2012). An experimental artificial-neural-network-based modeling of magneto-rheological fluid dampers. Smart Mater. Struct. 21, 085007. doi:10.1088/0964-1726/21/8/085007
Tudón-Martínez, J. C., and Morales-Menendez, R. (2015). Adaptive vibration control system for mr damper faults. Shock and Vibration 2015, 1. doi:10.1155/2015/163694
Vinodh, S., Devadasan, S. R., Vimal, K. E. K., and Kumar, D. (2013). Design of agile supply chain assessment model and its case study in an indian automotive components manufacturing organization. J. Manufacturing Syst. 32, 620–631. doi:10.1016/j.jmsy.2013.04.001
Vivas-Lopez, C. A., Hernández-Alcantara, D., Morales-Menendez, R., Ramírez-Mendoza, R. A., and Ahuett-Garza, H. (2015). Method for modeling electrorheological dampers using its dynamic characteristics. Math. Probl. Eng. 2015, 1. doi:10.1155/2015/905731
Keywords: magneto-rheological damper, finite element analyses, semi-active suspension, quarter of vehicle, vehicle dynamics
Citation: Vivas-Lopez CA, Tudon-Martinez JC, Estrada-Vela A, de Jesus Lozoya-Santos J and Morales-Menendez R (2021) Damping Variation Effects in Vehicle Semi-active MR Suspensions: A Stress Concentration Analysis. Front. Mater. 8:590390. doi: 10.3389/fmats.2021.590390
Received: 01 August 2020; Accepted: 15 February 2021;
Published: 22 April 2021.
Edited by:
Ramin Sedaghati, Concordia University, CanadaReviewed by:
Xiaomin Dong, Chongqing University, ChinaJiong Wang, Nanjing University of Science and Technology, China
Masoud Hemmatian, Concordia University, Canada
Copyright © 2021 Vivas-Lopez, Tudon-Martinez, Estrada-Vela, de Jesus Lozoya-Santos and Morales-Menendez. This is an open-access article distributed under the terms of the Creative Commons Attribution License (CC BY). The use, distribution or reproduction in other forums is permitted, provided the original author(s) and the copyright owner(s) are credited and that the original publication in this journal is cited, in accordance with accepted academic practice. No use, distribution or reproduction is permitted which does not comply with these terms.
*Correspondence: Juan C. Tudon-Martinez, anVhbi50dWRvbkB1ZGVtLmVkdQ==