 Sohei Sukenaga1*
 Takahiko Endo1,2Tsuyoshi Nishi3
 Hiroki Yamada4
 Koji Ohara4Toru Wakihara5Koji Inoue6Sakiko Kawanishi1Hiromichi Ohta3
 Hiroyuki Shibata1
- 1Institute of Multidisciplinary Research for Advanced Materials (IMRAM), Tohoku University, Sendai, Japan
- 2Graduate School of Environmental Studies, Tohoku University, Sendai, Japan
- 3Graduate School of Science and Engineering, Department of Materials Science and Engineering, Ibaraki University, Hitachi, Japan
- 4Japan Synchrotron Radiation Research Institute (Spring-8/JASRI), Sayo, Japan
- 5Institute of Engineering Innovation, School of Engineering, The University of Tokyo, Tokyo, Japan
- 6Institute for Materials Research, Tohoku University, Sendai, Japan
The thermal conductivity of silicate melts and glasses is an important physical property for understanding the temperature distribution in high-temperature metallurgical processes; however, the mechanism of heat conduction in these non-crystalline materials remains unclear. Two types of vibration modes must be considered to understand the mechanism of heat conduction, namely, propagative and diffusive vibration modes. In the present study, we carefully derived the thermal conductivity of pure silica and sodium disilicate glasses and melts, and estimated the contribution of the diffusive vibration mode using a recently developed model. The results indicated that the diffusive vibration mode was not dominant in the silicate non-crystalline materials, whereas the propagative vibration mode (i.e., phonons) was dominant in the heat conduction of silicate glasses and melts, which is in contrast with borate glasses.
Introduction
The thermal conductivity of silicate melts and glasses is one of the least understood properties among the physical properties of non-crystalline materials, despite its importance in the design of industrial plants and processes at elevated temperatures (such as glass-making and metallurgical processes) (Glaser and Sichen, 2013; Pilon et al., 2014; Wang and Sohn, 2020; Li et al., 2021). Owing to the limited data on their thermal conductivity, a larger number of reliable measurements and an in-depth interpretation of the thermal conductivities are required to improve the precision of the process control (e.g., slag cooling) and the development of the thermophysics of these disordered materials. Empirically, it is known that the thermal conductivity of silicate melts and glasses is influenced by the overall polymerization degree (Susa et al., 2001; Aune et al., 2002; Eriksson et al., 2003; Eriksson and Seetharaman, 2004; Kang and Morita, 2006; Hasegawa et al., 2012a; Hasegawa et al., 2012b; Kang et al., 2012; Hofmeister et al., 2016; Park and Sohn, 2016; Mills and Däcker, 2017; Wang et al., 2020), type of non-framework (e.g., Na+, Ca2+) (Hayashi et al., 2001; Hiroshima et al., 2008; Ozawa et al., 2007; Wang et al., 2020), framework cations (Si4+, B3+, Al3+) (Kim et al., 2015; Kim and Morita, 2015; Wang et al., 2019; Shirayama et al., 2020), and temperature (Chebykin et al., 2020; Wang et al., 2020); however, the detailed mechanism of the compositional- and temperature-dependences of the thermal conductivity of silicate melts and glasses remains unclear (Varshneya and Mauro, 2019). Kittel (1949) proposed that phonons are carriers of intrinsic heat conduction. The thermal conductivity (κ) is commonly related to the phonon mean free path (MFP, l) as given in Eq. 1:
where Cv (J m−3 K−1) denotes the volumetric heat capacity and v (m s−1) denotes the velocity of sound. Recently, it has been found that both propagative (propagons) and diffusive modes (diffusons) contribute to the thermal conductivity of disordered materials (e.g., glasses) (Agne et al., 2018; Sørensen et al., 2020; Sørensen et al., 2021). According to the definition by Allen and Feldman (Allen et al., 1999), “propagons” are similar to propagating phonons with a definable vector, whereas “diffusons” are vibrational modes without a definable vector. Additionally, it has been reported that the thermal conductivity of borate glasses is dominated by the diffusive vibration mode (Sørensen et al., 2020), whereas the contribution of the propagative vibration mode (phonon) is significant in silicate glasses. However, the contribution of the diffusive vibration mode has not been investigated for silicate systems over a wide temperature range from room temperature (∼300 K) to elevated temperatures higher than their liquidus. Although the thermal conductivity of silicate glasses and melts has been associated with the MFP of phonons for a long time, it remains unclear whether this classical concept is applicable to non-crystalline silicate materials at elevated temperatures. In addition, the temperature dependence of the MFP for the silicate melts has not been carefully discussed from the viewpoint of the structure. To carefully consider the contribution of the two types of vibration modes, the physical properties of the target sample (i.e., the density, heat capacity, and velocity of sound) are required. Among the wide variety of silicate systems, unary silica (SiO2) and binary sodium silicate (Na2O–SiO2) are well-studied systems in terms of their thermophysical properties (such as density and heat capacity) and structure, where silica (SiO2) acts as a network former and sodium oxide (Na2O) acts as a network modifier. Previous studies (Manako et al., 2018; Nishi et al., 2019) have measured the thermal effusivity of sodium disilicate melts (Na2O·2SiO2, NS2) at temperatures higher than their liquidus. In the present study, we carefully derived the thermal conductivity of the NS2 melt from the reported thermal effusivity, density and heat capacity. The obtained thermal conductivity of NS2 melts was compared with that of NS2 glass at room temperature (300 K) as well as that of silica glass and melt. Additionally, the contribution of the diffusive and propagative vibration modes to the thermal conductivity was investigated.
Experimental Methods
Thermal Conductivity of Glasses at Room Temperature
The thermal conductivities of the SiO2 and Na2O·2SiO2 (NS2) glasses were evaluated at room temperature (room temperature was assumed to be 300 K in the present study). High-purity synthetic silica (Suprasil F300) was shaped into a plate (5

TABLE 1. Composition and properties of the glass samples at room temperature. The analyzed composition of the NS2 glass is indicated in parentheses. Assuming the uncertainty in the Cp is ±1%, the possible error range for the derived κ value is ±2.2%.
The thermal conductivity of these glasses at 300 K was determined using Eq. 2 considering three types of properties of the samples: thermal diffusivity [α (m2 s−1)], density [ρ (kg m−3)], and specific heat capacity [Cp (J kg−1 K−1)]:
where κ denotes the thermal conductivity (W m−1 K−1). The α values of the samples were determined using the laser flash method (Shibata et al., 1996). Since the temperature response of the sample was measured using an infrared ray detector, a laser beam absorber and an infrared ray emitter were required for measurements involving transparent materials, such as oxide glasses. Therefore, the sample glass plate was coated with a thin gold film (≈150 nm) and carbon powder spray. The samples were placed in a vacuum chamber of the apparatus, and the upper side of the sample was heated using a Nd:YAG laser with a wavelength of 1,064 nm under vacuum. The temperature variation at the bottom of the sample was measured using an infrared detector at room temperature. The value of α was derived by analyzing the temperature response curve according to a well-established procedure (Shibata et al., 1996). The measurement of α was repeated at least five times for each sample. The obtained α values are listed in Table 1. The density (ρ) of the glass samples was measured using a conventional Archimedean method with ethanol fluid at 300 K. Density measurements were performed five times for each sample. The average values are presented in Table 1. The specific heat capacity (Cp) of the NS2 glass sample was measured using differential scanning calorimetry (DSC, Netzsch 3,500 Sirius) during the continuous heating process in the temperature range of 278–873 K, whereas the reported Cp value (Richet et al., 1982) for silica glass was used to determine its κ value. The obtained values of ρ and Cp are listed in Table 1.
Thermal Conductivity of Molten Samples at Elevated Temperatures
In previous studies, the thermal effusivity [b (m2 s−1)] of the NS2 melts was measured using a front-heating front-detection laser flash method at temperatures above their liquidus (Manako et al., 2018; Nishi et al., 2019). The relationship between b and κ is expressed by Eq. 3:
The thermal conductivity (κ) of the NS2 melt was derived using the reported density (Shartsis et al., 1952) and the estimated specific heat capacity (Cp) based on the model proposed by Richet and Bottinga (1985). It is well known that their model reproduces the Cp of alkali silicate systems. For the thermal conductivity of pure SiO2 glass and melt, the values measured by Hofmeister and Whittington (2012) using a laser flash method were employed for comparison.
Structural Characterization of NS2 Glass
The thermal conductivity of silicate materials should be structure-sensitive. The synchrotron X-ray total scattering was measured for the NS2 glass at the BL04B2 beamline in SPring-8 (Japan) to obtain the total correlation function T(r), which provides the correlation length between two atoms. The crushed NS2 glass powder was packed in polyimide capillary tubes (diameter: 3 mm), and the scattering patterns of the samples were collected using a horizontal two-axis diffractometer under vacuum at room temperature with an incident X-ray energy of 61 keV (λ = 0.0202 nm). This high-energy X-ray enables the collection of scattering patterns with wave vectors (q) as high as 260 nm−1, which are sufficiently high to accurately determine the interatomic distance in non-crystalline solids. To obtain a Faber–Ziman structure factor (S(q)), scattering patterns were handled according to a well-established procedure (Ohara et al., 2020). In an X-ray scattering experiment on glasses containing n chemical components, the total structure factor S(q) is represented by Eqs 4–6:
where q is the wave vector, cβ is the atomic fraction of the chemical component β; wβ(q) is a q-independent atomic form factor with dispersion terms in X-ray scattering, Sβγ(q) is a partial structure factor, λ is the wavelength of the X-ray, and
where ρ0 (m−3) denotes the number of atoms per unit volume and g(r) represents the weighted sum of the partial functions.
Results
Equations 2, 3 indicate that the thermal conductivity of the glasses and melts is the product of the density, heat capacity, and thermal diffusivity of the samples. Understanding these three parameters is essential for interpreting the compositional and temperature dependences of thermal conductivity. Figure 1A illustrates the temperature dependence of the density of silica and the NS2 glasses and melts. The measured density of the pure silica glass at 300 K was 2,200 ± 2 kg m−3, which agrees well with the reported value for synthetic silica glass (e.g., 2,202 kg m−3 (Mazurin et al., 1983)) at room temperature, validating our methodology for density measurements. The measured density of the NS2 glass at 300 K was 2,490 ± 10 kg m−3, which is larger than that of silica glass and lies in the range of reported values for similar compositions (2,488–2,495 kg m−3) (Morey and Merwin, 1932; Verweij et al., 1979), confirming the presence of a bubble-free sample. As depicted in Figure 1A, the density of silica exhibited a small temperature dependence because of its small linear thermal expansion coefficient (≈10−6 K−1 (Kobayashi et al., 2011; Hofmeister and Whittington, 2012). However, the reported densities of the NS2 melts (Shartsis et al., 1952) were considerably smaller than those of the NS2 glass and exhibited a negative temperature dependence, indicating a larger thermal expansion coefficient of the sodium-containing system than that of pure silica.
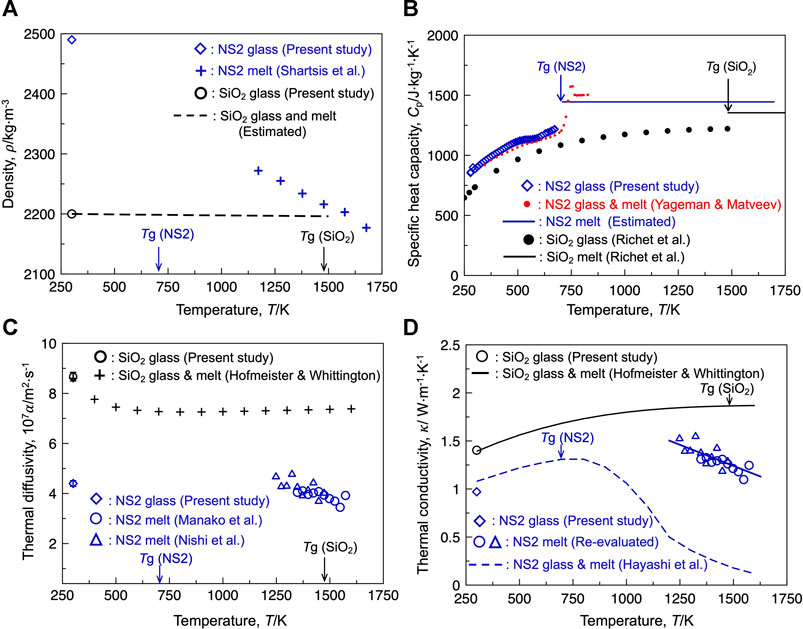
FIGURE 1. (A) Temperature dependence of the density of the silica and sodium disilicate (NS2) compositions. Reported value by Shartsis et al. (1952) was plotted as the density of the NS2 melt. The dashed line indicates the estimated density of silica glass based on the thermal expansivity. (B) Specific heat capacity of the silica and NS2 compositions. (C) Thermal diffusivity of the silica and NS2 compositions. The blue triangle and circle represent the thermal diffusivities of the NS2 melts, which are derived from the thermal effusivity reported by Nishi et al. (2019) and Manako et al. (2018), respectively. (D) Thermal conductivity of the silica and NS2 compositions. The blue dashed line represents the thermal conductivity of NS2 melt and glass obtained using the transient hot-wire method (Hayashi et al., 2001). Applying the uncertainty in the reported thermal effusivity (±5%, Nishi et al., 2019), density (±1%, Mazurin, 2005), and specific heat capacity (±1%, Richet and Bottinga, 1985) for the NS2 melt, the propagation of error in the thermal conductivity of the NS2 melt obtained using the laser flash method should be ±7.2%.
Figure 1B depicts the temperature dependence of the specific heat capacity (Cp) for silica and NS2 glasses and melts. The Cp value reported for silica glass (Richet et al., 1982) and the measured values for the NS2 glass gradually increased with increasing temperature up to its glass transition temperature (Tg). The measured values for the present NS2 glass were close to the values reported by Yageman and Matveev (1982) at temperatures higher than 346 K. This agreement validates the reasonability of the measured Cp of the NS2 glass at temperatures close to room temperature (300 K). In general, the Cp value of silicate glass significantly increases at temperatures close to Tg, and the Cp value of the silicate melts is almost constant at temperatures higher than its Tg unless it does not contain alumina or boron oxide (Sugawara et al., 2013). The Cp values reported for silica melt and the estimated values for NS2 melts based on the well-known Richet and Bottinga model (Richet and Bottinga, 1985) are depicted in Figure 1B. The Cp value of the NS2 glass and melt was higher than that of silica in the temperature range of 300–1750 K.
The thermal diffusivities (α) of the silica and NS2 glasses and melts are shown in Figure 1C. The measured α value of the silica glass was higher than that of the NS2 glass at room temperature. It has been reported that the value of α for silica glass decreases as the temperature is elevated and plateaus at temperatures above 750 K (Hofmeister and Whittington (2012)). The value of α for NS2 glass has not been reported for temperatures close to the glass transition temperature. The α value for the NS2 melt was calculated from the reported thermal effusivity (b) of the melt (Manako et al., 2018; Nishi et al., 2019). The derived α values of the NS2 melt based on the reported value of b in the two different studies (Manako et al., 2018; Nishi et al., 2019) agreed well. It was found that the α values of the NS2 melt at 1250 K (Manako et al., 2018; Nishi et al., 2019) were close to that of the NS2 glass at 300 K; however, the α value of the NS2 melts exhibited a negative temperature dependence at temperatures higher than their liquidus (i.e., 1147 K).
Using Eqs 2, 3, the thermal conductivity (κ) of the NS2 composition obtained by the laser flash method was carefully derived in the present study and is depicted in Figure 1D. For comparison, the reported κ value of silica obtained using the laser flash method (Hofmeister and Whittington, 2012) is also shown in the figure. The κ value of silica gradually increased with increasing temperature from 300 K and plateaued at temperatures above 1250 K. The measured κ value of the NS2 glass in the present study was lower than that of silica glass at 300 K. The derived κ value of the NS2 melt at temperatures above 1250 K was close to that of the NS2 glass; however, it was found that the κ value of the NS2 melt exhibited a negative temperature dependence, which was not observed for pure silica. This contrasting temperature dependence can be attributed to the difference in the thermal expansivities of the two samples. The negative temperature dependence of the NS2 melt is due to its higher thermal expansion coefficient, which should be correlated with the smaller average bond strength of the NS2 melt than that of silica (Mysen and Richet, 2019). A comparison of the derived κ value of the NS2 melt (obtained using the laser flash method) with that obtained using the transient hot-wire method (Hayashi et al., 2001) revealed that the κ values obtained using the two measurement techniques agreed well at temperatures close to 300 K, whereas the κ value obtained using the transient hot-wire method significantly decreased at temperatures higher than 750 K. At 1250 K, the κ value of the NS2 melt obtained using the laser flash method was more than three times higher than that obtained using the transient hot-wire method. This difference, depending on the measurement technique, has long been discussed by researchers, and the following indications have been suggested (Mills, 2016; Mills and Däcker, 2017):
1) The κ value obtained using the laser flash method would contain the contribution of radiation conduction, in comparison with that obtained using the transient hot-wire method.
2) The κ value measured using the transient hot-wire method is expected to be influenced by electrical leakage from the hot wire to the melt.
The former indication was examined by Shibata et al. (2005), who concluded that radiative components do not significantly affect the obtained thermal conductivity. In addition, previous reports (Takeuchi et al., 1983; Kang et al., 2013) have confirmed that the experimental error caused by current leakage during thermal conductivity measurement is insignificant for sodium silicate melts. The reason for the disagreement between the observed values remains unclear; however, both methods typically demonstrate a similar tendency in terms of compositional dependence. The present study considered the κ value obtained using the laser flash method for the discussion.
Discussion
Contribution of Diffusive Vibration Mode
Hiroshima et al. (2008) proposed that the heat conduction of silicate melts and glasses is dominated by propagative vibration modes (i.e., phonons), which have been successfully used to explain the heat conduction in crystalline materials with high rigidity. In contrast, heat conduction in low-rigidity non-crystalline solids tends to be controlled by diffusive vibration modes (i.e., diffusons), which do not have well-defined wave vectors, limiting their contribution to heat conduction (Sørensen et al., 2021). To clarify whether phonons are the main carriers of heat in silicate melts and glasses, the present study estimates the contribution of the diffusive mode (κdiff) based on a recently developed model (Agne et al., 2018):
where ρ0 denotes the atomic number density, kB denotes the Boltzmann’s constant, ν represents the velocity of sound, T denotes the temperature,
Figure 2A depicts the temperature dependence of the sound velocity (ν) of the silica and NS2 compositions. The value of ν for the silica glass and melt was estimated using the reported Young’s modulus (Carnevale et al., 1964), as shown in Eq. 11 (Inaba et al., 2001):
where E represents the Young’s modulus. For the NS2 composition, the reported ν values of the glass (Hiroshima et al., 2008) and melt (Hayashi et al., 2011) are shown in the figure. The ν for silica gradually increased with increasing temperature, whereas that for NS2 decreased with increasing temperature. The estimated κdiff values were compared with the experimental thermal conductivities (κexp) of the silica and NS2 compositions obtained using the laser flash method (Figure 2B). As shown in the figure, the contribution of κdiff to κexp is less than 30%, indicating that the contribution of the diffusive vibration mode is limited to the thermal conduction of the selected silicate systems, whereas the propagative mode (i.e., phonons) contributes significantly to the heat conduction.
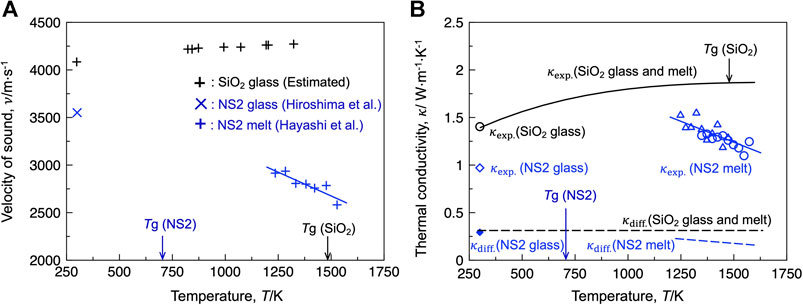
FIGURE 2. (A) Velocity of sound for the silica and NS2 glass and melt. (B) Comparison of the estimated contribution of the diffusive vibration mode
Phonon Mean Free Path
When the phonon is the main carrier of heat in the system, it is meaningful to relate the phonon MFP to the structure. Assuming that the heat conduction in the non-crystalline silica and NS2 composition is completely dominated by the propagative mode (i.e., phonon), the phonon MFP is estimated using Eq. 1. Figure 3A depicts the estimated phonon MFP (l) of the silica and NS2 compositions. The value of l for the silica glass was approximately 0.6 nm at 300 K, whereas that for the NS2 glass was close to 0.4 nm at 300 K. Figures 3B,C depict the total structure factor S(q) and total correlation function (T(r)) derived from S(q). As shown in Figure 3C, T(r) exhibited major peaks at 0.163, 0.233, 0.264, and 0.316 nm, which could be assigned to the Si-O, Na-O, O-O, and Si-Si correlations (Saito et al., 2016), respectively. The l value of the NS2 glass was slightly larger than the length of the Si-Si correlation (Figure 3C). The l value of the silica glass was close to 0.6 nm, which is close to the distance from a silicon atom to its second neighbor silicon atom (Si-Si2nd) (Waseda and Toguri, 1978). These results indicate that the value of l should be decreased by breaking the silicate network structure with the addition of a modifier cation (i.e., sodium cation). This tendency agrees with the general interpretation of the contribution of network modifiers to the thermal conductivity of non-crystalline silicate materials (Nishi et al., 2018). Based on the temperature dependence of l (Figure 3A), the l value of the silica composition slightly decreased with increasing temperature, whereas the opposite tendency was observed for the NS2 composition. The l values of the silica and NS2 compositions were similar in the temperature range of 1,250–1500 K. Although the detailed mechanism of these contrasting temperature dependences remains unresolved, it has been reported that the number of small ring species (“e.g., 3-membered ring”) increases with increasing temperature for the silica melt, which is mainly composed of larger ring species, such as 4–6 membered rings (McMillan et al., 1994; Zhou et al., 2021). The formation of such a “defect” structure (i.e., 3-membered ring) is expected to decrease the phonon MFP of silica by elevating the temperature. In the case of the NS2 melt, previous in situ Raman experiments (Maehara et al., 2005; Malfait et al., 2008; Mysen and Frantz, 1992) have quantified the Qn species [i.e., SiO4 unit with (n = 0, 1, 2, 3, or 4) bridging oxygen atoms connected to the silicon atom] in sodium silicate melts. They suggest that NS2 glass is mainly composed of Q3 species and the speciation reaction 2Q3 = Q2 + Q4 proceeds to the right-hand side with an increase in temperature, resulting in an increase in Q4 species. The Q4 species is expected to contribute to an increase in the l value of the sodium silicate melts. To prove the reasonability of these speculations, the influence of the ring structure and Qn distribution on the l value of non-crystalline silicate materials should be carefully examined in future work.
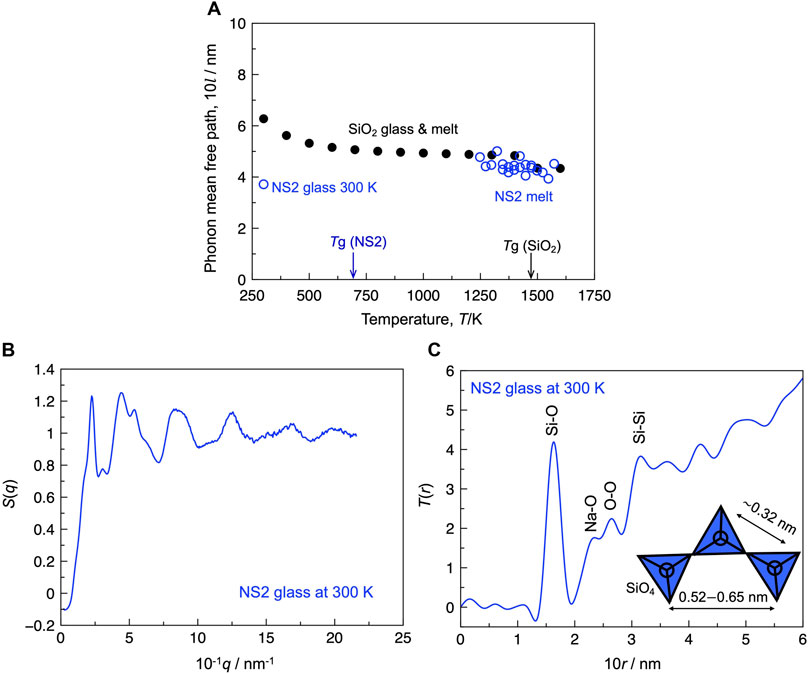
FIGURE 3. (A) Estimated phonon mean free path of the silica and NS2 glass and melt. (B) S(q) of the NS2 glass at 300 K. (C) Total correlation function [T(r)] of the NS2 glass at 300 K. Inset: schematic illustrations of the structure composed of SiO4 tetrahedra with the typical range of interatomic distance between two silicon atoms (Waseda and Toguri, 1978).
Conclusion
The thermal conductivities of the silica and NS2 glasses and melts were carefully derived based on the data obtained using the laser flash method. The experimental data was compared with the estimated contributions of the diffusive vibration mode. The present study confirms that the contribution of the diffusive vibration mode is insignificant for the present silicate system, indicating that the propagative vibration mode (i.e., phonons) mainly contributes to heat conduction. The decrease in the thermal conductivity of the silica glass with the addition of Na2O can be attributed to the decrease in the phonon MFP of the glass at 300 K. Although the phonon MFP of silica is similar to that of the NS2 melt at temperatures higher than 1250 K, the thermal conductivity of the silica melt is higher than that of the NS2 melt, which can be attributed to the difference in the velocity of sound. Experimental data on the velocity of sound for the molten oxide are quite limited; however, this data is expected to be essential for understanding the mechanism of heat conduction in silicate melts at elevated temperatures. Thus, more measurements are required for the sound velocity of silicate melts at elevated temperatures.
Data Availability Statement
The original contributions presented in the study are included in the article, further inquiries can be directed to the corresponding author.
Author Contributions
SS designed and drafted the manuscript. TE, TN, HO, and KI measured the density and thermal conductivity of the glasses. HY, KO, and TW measured and analyzed the synchrotron X-ray total scattering of the glass. SS, SK, and HS discussed the interpretation of the results. All authors contributed to the writing of the manuscript.
Funding
This work was performed under the Cooperative Research Program of “NJRC Mater. and Dev.” This work was also partially supported by JSPS KAKENHI (Grant Number 19K05106).
Conflict of Interest
The authors declare that the research was conducted in the absence of any commercial or financial relationships that could be construed as a potential conflict of interest.
Publisher’s Note
All claims expressed in this article are solely those of the authors and do not necessarily represent those of their affiliated organizations, or those of the publisher, the editors and the reviewers. Any product that may be evaluated in this article, or claim that may be made by its manufacturer, is not guaranteed or endorsed by the publisher.
Acknowledgments
The synchrotron X-ray total scattering of the glass sample was measured at the BL04B2 beamline at Spring-8 with the approval of JASRI (Proposal No. 2017B1400). We would like to thank Masanori Tashiro (Tohoku University) for his technical support in the wavelength-dispersive X-ray spectroscopy measurements of the NS2 glass.
References
Agne, M. T., Hanus, R., and Snyder, G. J. (2018). Minimum thermal Conductivity in the Context of Diffuson-Mediated thermal Transport. Energy Environ. Sci. 11, 609–616. doi:10.1039/C7EE03256K
Allen, P. B., Feldman, J. L., Fabian, J., and Wooten, F. (1999). Diffusons, Locons and Propagons: Character of Atomie Yibrations in Amorphous Si. Philosophical Mag. B 79, 1715–1731. doi:10.1080/13642819908223054
Aune, R. E., Hayashi, M., Nakajima, K., and Seetharaman, S. (2002). Thermophysical Properties of Silicate Slags. JOM 54, 62–69. doi:10.1007/BF02709753
Carnevale, E. H., Lynnworth, L. C., and Larson, G. S. (1964). Ultrasonic Measurement of Elastic Moduli at Elevated Temperatures, Using Momentary Contact. The J. Acoust. Soc. Am. 36, 1678–1684. doi:10.1121/1.1919264
Chebykin, D., Heller, H.-P., Saenko, I., Bartzsch, G., Endo, R., and Volkova, O. (2020). Effect of Glass Transition: Density and thermal Conductivity Measurements of B2O3. High Temp. High Press 49, 125–142. doi:10.32908/hthp.v49.801
Eriksson, R., Hayashi, M., and Seetharaman, S. (2003). Thermal Diffusivity Measurements of Liquid Silicate Melts. Int. J. Thermophys. 24, 785–797. doi:10.1023/A:1024048518617
Eriksson, R., and Seetharaman, S. (2004). Thermal Diffusivity Measurements of Some Synthetic CaO-Al2O3-SiO2 Slags. Metall. Mater. Trans. B 35, 461–469. doi:10.1007/s11663-004-0047-z
Glaser, B., and Sichen, D. (2013). Thermal Conductivity Measurements of Ladle Slag Using Transient Hot Wire Method. Metall. Mater. Trans. B 44, 1–4. doi:10.1007/s11663-012-9773-9
Hasegawa, H., Hoshino, Y., Kasamoto, T., Akaida, Y., Kowatari, T., Shiroki, Y., et al. (2012a). Thermal Conductivity Measurements of Some Synthetic Al2O3-CaO-SiO2 Slags by Means of a Front-Heating and Front-Detection Laser-Flash Method. Metall. Mater. Trans. B 43, 1405–1412. doi:10.1007/s11663-012-9702-y
Hasegawa, H., Kowatari, T., Shiroki, Y., Shibata, H., Ohta, H., and Waseda, Y. (2012b). Thermal Conductivity of Molten Silicate of Al2O3-CaO-Na2O-SiO2 Measured by Means of a Front Heating-Front Detection Laser Flash Method. Metall. Mater. Trans. B 43, 1413–1419. doi:10.1007/s11663-012-9745-0
Hayashi, M., Ishii, H., Susa, M., Fukuyama, H., and Nagata, K. (2001). Effect of Ionicity of Nonbridging Oxygen Ions on thermal Conductivity of Molten Alkali Silicates. Phys. Chem. Glasses 42, 6–11.
Hayashi, M., Matsuzono, Y., and Nagata, K. (2011). Ultrasonic Velocities of Molten Alkali Silicates. ISIJ Int. 51, 689–695. doi:10.2355/isijinternational.51.689
Hiroshima, Y., Hamamoto, Y., Yoshida, S., and Matsuoka, J. (2008). Thermal Conductivity of Mixed Alkali Silicate Glasses at Low Temperature. J. Non-Cryst. Solids 354, 341–344. doi:10.1016/j.jnoncrysol.2007.08.082
Hofmeister, A. M., Sehlke, A., Avard, G., Bollasina, A. J., Robert, G., and Whittington, A. G. (2016). Transport Properties of Glassy and Molten Lavas as a Function of Temperature and Composition. J. Volcanol. Geotherm. Res. 327, 330–348. doi:10.1016/j.jvolgeores.2016.08.015
Hofmeister, A. M., and Whittington, A. G. (2012). Effects of Hydration, Annealing, and Melting on Heat Transport Properties of Fused Quartz and Fused Silica from Laser-Flash Analysis. J. Non-Cryst. Solids 358, 1072–1082. doi:10.1016/j.jnoncrysol.2012.02.012
Inaba, S., Oda, S., and Morinaga, K. (2001). Equation for Estimating the thermal Diffusivity, Specific Heat and thermal Conductivity of Oxide Glasses. J. Jpn. Inst. Met. Mater. 65, 680–687. doi:10.2320/jinstmet1952.65.8_680
Kang, Y., Lee, J., and Morita, K. (2013). Comment on "Thermal Conductivity Measurements of Some Synthetic Al2O3-CaO-SiO2 Slags by Means of a Front-Heating and Front-Detection Laser-Flash Method". Metall. Mater. Trans. B 44, 1321–1323. doi:10.1007/s11663-013-9933-6
Kang, Y., and Morita, K. (2006). Thermal Conductivity of the CaO-Al2O3-SiO2 System. ISIJ Int. 46, 420–426. doi:10.2355/isijinternational.46.420
Kang, Y., Nomura, K., Tokumitsu, K., Tobo, H., and Morita, K. (2012). Thermal Conductivity of the Molten CaO-SiO2-FeO X System. Metall. Mater. Trans. B 43, 1420–1426. doi:10.1007/s11663-012-9706-7
Kim, Y., and Morita, K. (2015). Thermal Conductivity of Molten B2O3, B2O3–SiO2, Na2O–B2O3, and Na2O–SiO2 Systems. J. Am. Ceram. Soc. 98, 1588–1595. doi:10.1111/jace.13490
Kim, Y., Yanaba, Y., and Morita, K. (2015). The Effect of Borate and Silicate Structure on thermal Conductivity in the Molten Na2O-B2O3-SiO2 System. J. Non-Cryst. Solids 415, 1–8. doi:10.1016/j.jnoncrysol.2015.02.008
Kittel, C. (1949). Interpretation of the thermal Conductivity of Glasses. Phys. Rev. 75, 972–974. doi:10.1103/PhysRev.75.972
Kobayashi, Y., Shimizu, T., Miyashita, S., Endo, R., and Susa, M. (2011). Determination of Refractive Indices and Linear Coefficients of thermal Expansion of Silicate Glasses Containing Titanium Oxides. ISIJ Int. 51, 186–192. doi:10.2355/isijinternational.51.186
Kohara, S. (2017). Atomistic and Electronic Structures of Functional Disordered Materials Revealed by a Combination of Quantum-Beam Measurements and Computer Simulations. J. Ceram. Soc. Jpn. 125, 799–807. doi:10.2109/jcersj2.17101
Li, Q., Wang, Q., Zhang, J., Wang, W., and Liu, J. (2021). Transition Temperature and thermal Conduction Behavior of Slag in Gasification Process. Energy 222 (9), 119940. doi:10.1016/j.energy.2021.119940
Maehara, T., Yano, T., and Shibata, S. (2005). Structural Rules of Phase Separation in Alkali Silicate Melts Analyzed by High-Temperature Raman Spectroscopy. J. Non-Cryst. Solids 351, 3685–3692. doi:10.1016/j.jnoncrysol.2005.10.003
Malfait, W. J., Zakaznova-Herzog, V. P., and Halter, W. E. (2008). Amorphous Materials: Properties, Structure, and Durability: Quantitative Raman Spectroscopy: Speciation of Na-Silicate Glasses and Melts. Am. Mineral. 93, 1505–1518. doi:10.2138/am.2008.2783
Manako, T., Nishi, T., Ohta, H., Sukenaga, S., and Shibata, H. (2018). Measurement of the Thermal Effisivities for AlO1.5-R2O-SiO2(R=Li, Na) Melts. J. Jpn. Inst. Met. Mater. 82, 419–422. doi:10.2320/jinstmet.JAW201803
Mazurin, O. V. (2005). “Chapter 7 Density of Glass Melt,” in Properties of Glass-Forming Melts. Editors L. D. Pye, A. Montenero, and I. Josef (Milton Park, Oxfordshire: Taylor & Francis), 193–226.
Mazurin, O. V., Streltsina, M. V., and Shvaiko-Shvaikovskaya, T. P. (1983). “Part A Silica Glass and Binary Silicate Glasses” in Hand Book of Glass Data. Amsterdam, Netherlands: Elsevier, 16–17.
Mcmillan, P. F., Poe, B. T., Gillet, P. H., and Reynard, B. (1994). A Study of SiO2 Glass and Supercooled Liquid to 1950 K via High-Temperature Raman Spectroscopy. Geochim. Cosmochim. Acta 58, 3653–3664. doi:10.1016/0016-7037(94)90156-2
Mills, K. C., and Däcker, C.-A. (2017). Heat Transfer in the Mould and Shell Solidification” in the Casting Powders Book. New York, United States: Cham: Springer International Publishing, 59–108. doi:10.1007/978-3-319-53616-3_3
Mills, K. C. (2016). Structure and Properties of Slags Used in the Continuous Casting of Steel: Part 1 Conventional Mould Powders. ISIJ Int. 56, 1–13. doi:10.2355/isijinternational.ISIJINT-2015-231
Morey, G. W., and Merwin, H. E. (1932). The Relation between the Composition and the Density and Optical Properties of Glass I the Soda-Lime-Silica Glasses. J. Opt. Soc. Am. 22, 632–662. doi:10.1364/JOSA.22.000632
Mysen, B. O., and Frantz, J. D. (1992). Raman Spectroscopy of Silicate Melts at Magmatic Temperatures: Na2O-SiO2, K2O-SiO2 and Li2O-SiO2 Binary Compositions in the Temperature Range 25-1475°C. Chem. Geol. 96, 321–332. doi:10.1016/0009-2541(92)90062-A
Mysen, B. O., and Richet, P. (2019). Chapter 6 Properties of Metal Oxide-Silica Systems,” in Silicate Glasses and Melts. 2nd ed. Amsterdam, Netherlands: Elsevier, 203–206.
Nishi, T., Ohnuma, K., Tanaka, K., Manako, T., Yamato, Y., Ohta, H., et al. (2019). Thermal Conductivities of Alkali-Silicate and Calcium-Alkali-Silicate Melts. J. Non-Cryst. Solids 511, 36–40. doi:10.1016/j.jnoncrysol.2019.01.038
Nishi, T., Ohta, H., Sukenaga, S., and Shibata, H. (2018). Estimation of thermal Conductivity of Silicate Melts Using Three-Dimensional thermal Resistor Network Model. J. Non-Cryst. Sol. 482, 9–13. doi:10.1016/j.jnoncrysol.2017.11.014
Ohara, K., Onodera, Y., Kohara, S., Koyama, C., Masuno, A., Mizuno, A., et al. (2020). Accurate Synchrotron Hard X-ray Diffraction Measurements on High-Temperature Liquid Oxides. Int. J. Microgravity Sci. Appl. 37, 370202. doi:10.15011/jasma.37.2.370202
Ozawa, S., Endo, R., and Susa, M. (2007). Thermal Conductivity Measurements and Prediction for R2O-CaO-SiO2 (R=Li, Na, K) Slags. Tetsu-to-Hagan 93, 416–423. doi:10.2355/tetsutohagane.93.416
Park, S., and Sohn, I. (2016). Effect of Na2O on the High-Temperature Thermal Conductivity and Structure of Na2O-B2O3 Melts. J. Am. Ceram. Soc. 99, 612–618. doi:10.1111/jace.14013
Pilon, L., Janos, F., and Kitamura, R. (2014). Effective Thermal Conductivity of Soda-Lime Silicate Glassmelts with Different Iron Contents between 1100°C and 1500°C. J. Am. Ceram. Soc. 97, 442–450. doi:10.1111/jace.12768
Richet, P., Bottinga, Y., Denielou, L., Petitet, J. P., and Tequi, C. (1982). Thermodynamic Properties of Quartz, Cristobalite and Amorphous SiO2: Drop Calorimetry Measurements between 1000 and 1800 K and a Review from 0 to 2000 K. Geochim. Cosmochim. Acta 46, 2639–2658. doi:10.1016/0016-7037(82)90383-0
Richet, P., and Bottinga, Y. (1985). Heat Capacity of Aluminum-free Liquid Silicates. Geochim. Cosmochim. Acta 49, 471–486. doi:10.1016/0016-7037(85)90039-0
Saito, Y., Yonemura, T., Masuno, A., Inoue, H., Ohara, K., and Kohara, S. (2016). Structural Change of Na2O-Doped SiO2 Glasses by Melting. J. Ceram. Soc. Jpn. 124, 717–720. doi:10.2109/jcersj2.16028
Shartsis, L., Spinner, S., and Capps, W. (1952). Density, Expansivity, and Viscosity of Molten Alkali Silicates. J. Am. Ceram. Soc. 35, 155–160. doi:10.1111/j.1151-2916.1952.tb13090.x
Shibata, H., Emi, T., Waseda, Y., Kondo, K., Oiita, H., and Nakajima, K. (1996). Thermal Diffusivities of Continuous Casting Mold Fluxes for Steel in the Glassy and Crystalline States. Tetsu-to-Hagan 82, 504–508. doi:10.2355/tetsutohagane1955.82.6_504
Shibata, H., Suzuki, A., and Ohta, H. (2005). Measurement of thermal Transport Properties for Molten Silicate Glasses at High Temperatures by Means of a Novel Laser Flash Technique. Mater. Trans. 46, 1877–1881. doi:10.2320/matertrans.46.1877
Shirayama, S., Aoki, H., Yanaba, Y., Kim, Y., and Morita, K. (2020). Relationship Between Thermal Conductivity and Structure of the CaO–BO1.5–AlO1.5 System. ISIJ Int. 60, 392–399. doi:10.2355/isijinternational.ISIJINT-2019-251
Sørensen, S. S., Bødker, M. S., Johra, H., Youngman, R. E., Logunov, S. L., Bockowski, M., et al. (2021). Thermal Conductivity of Densified Borosilicate Glasses. J. Non-Cryst. Solids 557, 120644. doi:10.1016/j.jnoncrysol.2021.120644
Sørensen, S. S., Pedersen, E. J., Paulsen, F. K., Adamsen, I. H., Laursen, J. L., Christensen, S., et al. (2020). Heat Conduction in Oxide Glasses: Balancing Diffusons and Propagons by Network Rigidity. Appl. Phys. Lett. 117, 031901. doi:10.1063/5.0013400
Sugawara, T., Hamano, Y., Yoshida, S., and Matsuoka, J. (2013). Heat Capacity Measurements of 75SiO2-6B2O3-10Al2O3-9MO (M=Mg, Ca, Sr and Ba) Glasses and Melts. J. Ceram. Soc. Jpn. 121, 972–980. doi:10.2109/jcersj2.121.972
Susa, M., Kubota, S., Hayashi, M., and Mills, K. C. (2001). Thermal Conductivity and Structure of Alkali Silicate Melts Containing Fluorides. Ironmaking Steelmaking 28, 390–395. doi:10.1179/irs.2001.28.5.390
Takeuchi, M., Suzuki, M., and Nagata, K. (1983). Analytical Discussion on the Transient Hot Wire Method : Applicability to Measurement of an Electrically Conductive Medium. Trans. JSME, Ser.B 49, 1468–1476. doi:10.1299/kikaib.49.1468
Varshneya, A. K., and Mauro, J. C. (2019). “Thermal Conductivity and Acoustic Properties of Glass,” in Fundamentals of Inorganic Glasses. Editors A. K. Varshneya, and J. C. Mauro. 3rd ed. (Amsterdam, Netherlands: Elsevier), 283–291. doi:10.1016/b978-0-12-816225-5.00012-2
Verweij, H., Buster, J. H. J. M., and Remmers, G. F. (1979). Refractive index and Density of Li-, Na- and K-Germanosilicate Glasses. J. Mater. Sci. 14, 931–940. doi:10.1007/BF00550724
Wang, Q., Wang, D., Li, Q., and Zhang, J. (2019). Relationship between Microstructure and thermal Conductivity in Coal Slags with Variable Silica and Alumina. Energy Fuels 33, 6226–6233. doi:10.1021/acs.energyfuels.9b01090
Wang, Q., Zhang, J., Liu, J., Wu, W., Qi, X., and Deng, H. (2020). Thermal Conduction Mechanism Based on Microstructural Transformations of Molten Slag: The Role of Calcium Oxide. Int. J. Heat Mass Transfer 160, 120167. doi:10.1016/j.ijheatmasstransfer.2020.120167
Wang, Z., Wen, G., Liu, Q., Huang, S., Tang, P., and Yu, L. (2020a). Estimating the thermal Conductivity of CaO-Al2O3-SiO2 Slags by Equilibrium Molecular Dynamics Simulations. J. Non-Cryst. Solids 531, 119851. doi:10.1016/j.jnoncrysol.2019.119851
Wang, Z., Huang, S., Wen, G., Jiang, W., Chen, F., and Tang, P. (2020b). Effects of Temperature on the thermal Conductivity of Amorphous CaO-SiO2-Al2O3 Slags: a Computational Insight. Phys. Chem. Chem. Phys. 22, 8808–8816. doi:10.1039/d0cp00382d
Wang, Z., and Sohn, I. (2020). Review on the High-Temperature Thermophysical Properties of Continuous Casting Mold Fluxes for Highly Alloyed Steels. ISIJ Int. 60, 2705–2716. doi:10.2355/isijinternational.ISIJINT-2019-522
Waseda, Y., and Toguri, J. M. (1978). The Structure of the Molten FeO-SiO2 System. Met. Trans. B 9, 595–601. doi:10.1007/BF03257207
Yageman, V. D., and Matveev, G. M. (1982). Thermal Capacity of Glasses in SiO2-Na2O·2SiO2 System. Sov. J. Glass Phys. Chem. 8, 168–175.
Keywords: silicate glass and melt, thermal conductivity, heat capacity, density, propagons, diffusons, phonon mean free path, laser-flash method
Citation: Sukenaga S, Endo T, Nishi T, Yamada H, Ohara K, Wakihara T, Inoue K, Kawanishi S, Ohta H and Shibata H (2021) Thermal Conductivity of Sodium Silicate Glasses and Melts: Contribution of Diffusive and Propagative Vibration Modes. Front. Mater. 8:753746. doi: 10.3389/fmats.2021.753746
Received: 05 August 2021; Accepted: 01 October 2021;
Published: 01 November 2021.
Edited by:
Wangzhong Mu, Royal Institute of Technology, SwedenReviewed by:
Neven Ukrainczyk, Darmstadt University of Technology, GermanyAilar Hajimohammadi, University of New South Wales, Australia
Qifeng Shu, University of Oulu, Finland
Copyright © 2021 Sukenaga, Endo, Nishi, Yamada, Ohara, Wakihara, Inoue, Kawanishi, Ohta and Shibata. This is an open-access article distributed under the terms of the Creative Commons Attribution License (CC BY). The use, distribution or reproduction in other forums is permitted, provided the original author(s) and the copyright owner(s) are credited and that the original publication in this journal is cited, in accordance with accepted academic practice. No use, distribution or reproduction is permitted which does not comply with these terms.
*Correspondence: Sohei Sukenaga, c29oZWkuc3VrZW5hZ2EuZDNAdG9ob2t1LmFjLmpw