 Alexandra Cantarano1
 Denis Testemale1Estelle Homeyer2Hanako Okuno3
 Audrey Potdevin4Christophe Dujardin2Alain Ibanez1
 Geraldine Dantelle1*
- 1Univ. Grenoble Alpes, CNRS, Grenoble INP, Institut Néel, Grenoble, France
- 2Institut Lumière Matière, Univ. Lyon 1 - CNRS – 10, Villeurbanne, France
- 3Univ. Grenoble Alpes, CEA, IRIG-MEM, Grenoble, France
- 4Université Clermont Auvergne INP, CNRS, Institut de Chimie de Clermont-Ferrand, Clermont–Ferrand, France
Y3Al5O12 (YAG) nanocrystals have been synthesized by a modified solvothermal method (300°C) allowing the incorporation of cerium ions in much larger proportion (up to 30 mol.% with respect to yttrium ions) than ever published. The reasons are the nanometric size of the produced nanocrystals, allowing to accommodate Ce3+ ions in the rigid YAG structure thanks to the presence of local distortions, and also the soft synthesis route, at low temperatures and far from the thermodynamic equilibrium, which favors the cerium insertion. As a consequence, Ce3+ photoluminescence spectrum can be tuned with the doping concentration, from 541 nm for low Ce3+ concentration to 580 nm for a cerium concentration of 30 mol.%. The internal quantum yield reaches 40 ± 5% before decreasing due to concentration quenching. The nanocrystal brightness, which combines the internal quantum yield and the cerium concentration, has been found optimal for a doping of 2 mol.% Ce3+.
Introduction
Ce3+-doped yttrium aluminum garnet (Y3Al5O12:Ce3+, YAG:Ce) is a well-known luminescent material, studied both at the macroscopic scale (large single crystals, ceramics, micron-sized powder, films) and at the nanometric scale (nanocrystals) for artificial lighting generation as phosphor-converted white LEDs (pc-wLEDs) (Ryu and Kim, 2010; Cantore et al., 2016). Currently, YAG:Ce remains the major phosphor used in pc-LEDs to partially convert blue light emitted from GaN/InGaN diode into yellow light. Optimizing the packaging of these YAG:Ce phosphors is of great interest as it can influence the ageing properties of the wLED devices, affect their external efficiency and have an influence on their thermal management (Sun et al., 2014; Ye et al., 2012). The most common phosphor shaping consists currently in dispersing YAG:Ce micron-sized particles into an epoxy or silicone resin and placing the composite in a remote configuration referred to the diode1. However, the use of the resin, which deteriorates over time under intense blue light excitation, induces a color drift of the pc-wLEDs, (Deng et al., 2019) while the micron-sized YAG:Ce particles generate light scattering that reduces the external efficiency of the pc-wLED devices. These drawbacks have encouraged researchers and industrials to find alternative materials and shaping (transparent/translucent ceramics, nanocrystals), allowing better ageing properties and stronger control of light propagation, (Schimpke et al., 2016; Nishiura et al., 2011) bearing in mind that these alternate materials should remain competitive in terms of emission efficiency, also called “brightness.”
A phosphor brightness depends on both its absorption and emission efficiency and characterizes the capacity of a material to emit photons in the good direction under a given incident excitation. High brightness requires a large number of emitting species (related to a strong absorption capability) and a high photoluminescence (PL) efficiency, also called internal quantum yield (iQY), which is defined by the ratio of emitted to absorbed photons. iQY strongly depends on the emitter environment and may be affected by the temperature. In particular, the presence of high energy phonons in the host matrix itself or at the material surface, but also of non-radiative energy transfers in-between luminescent centers or between a luminescent species and a defect, induce non radiative de-excitations dissipating energy through heat, thus reducing the PL iQY. Hence, too many luminescent species are detrimental for the PL, leading to a phenomenon called concentration quenching (Blasse and Grabmaier, 1994).
For that reason, in macroscopic and microscopic YAG:Ce phosphors (cm-sized single crystals, ceramics, and micron-sized powders), the luminescent species concentration is usually kept low, to favor the highest iQY, while high absorption is provided by increasing the quantity of matter, e.g., the ceramic thickness (Waetzig et al., 2014; Yuan et al., 2018). At the nanoscale, where the goal is to use individual nanoparticles as luminescent nanoprobes for instance, or to make nanostructured phosphor devices, the problem shall be approached differently as the quantity of matter should be kept low. It thus results in a necessary optimization of the material brightness, i.e., optimization of the material absorption capacity without affecting too drastically its iQY. In this regard, higher doping concentration is of interest, as discussed for the design of lanthanide-doped nanocrystals for photocatalysis, photovoltaics and bio-imaging (Sarkar et al., 2019; Wen et al., 2018; Chen and Wang, 2020). It has led to the development of some specific and complex nanomaterial design: 1) grafting of antenna-like molecules with a higher absorption coefficient allowing the excitation of lanthanides by energy transfer, 2) coupling with plasmonic structures for enhanced absorption (Hussain et al., 2015), 3) elaboration of complex core-shell structures, 4) heterogeneous dopant distribution, etc. Such issue is also at the core of the elaboration of bright nanophosphors, which are strongly promising with the tendency towards miniaturization and the development of nanostructured blue micro-LEDs (Taki and Strassburg, 2020).
In this paper, we report the study of YAG:Ce nanocrystals brightness as a function of cerium concentration. These nanocrystals have been elaborated by a solvothermal method, which is, among all proposed synthesis methods, as coprecipitation, combustion, sol-gel, etc., (Li et al., 2009; Jiao et al., 20102010; Gaiser et al., 2019; Cantarano et al., 2020a), one of the most promising as it allows to obtain non-agglomerated nanocrystals that can be used individually or deposited in a controlled manner using additive techniques such as ink-jet printing. The structure of the YAG:Ce nanocrystals, their ability to incorporate cerium ions and their PL properties will be discussed. As luminescence is generated by Ce3+ emitting centers, particular attention will be given to the oxidation state (Ce3+ vs. Ce4+) of cerium.
Materials and Methods
Ce-Doped YAG Nanocrystal Synthesis
Yttrium acetate tetrahydrate, cerium acetate hydrate and aluminum isopropoxide were dispersed in stoichiometric proportion in 1,4-butanediol (100 ml). The aluminum concentration was fixed at 0.18 mol.L−1. The nominal cerium doping concentration, xnom, has been varied from 0.5 to 50 mol.% with respect to yttrium. This corresponds to the usual notation in doped luminescent materials where the dopant concentration is defined in mole % relatively to the ion substituted by the dopant. The mixture is stirred for 48 h to get a homogeneous solution, which is then poured into a 0.5 L autoclave with a filling factor of 20%. After a purge with Ar to provide an inert atmosphere, an Ar pressure of 60 bar is set in the autoclave and the heating is launched. After a 30 min heating ramp, the solution reaches 300°C under a pressure of 200 bar. These stationary conditions are maintained for 2 h 30 min. The heating is then stopped and the solution is cooled down overnight. It is then centrifugated and washed three times with ethanol. An alcoholic dispersion is obtained with a typical concentration of nanocrystals of 10 mg ml−1. Powder samples are also prepared by drying the dispersion at 100°C for 1 h for further analysis. These samples are labelled “as-synthesized.” For further characterizations, thermal annealing was performed at 1000°C and at 1400°C in air for 12 h.
Structural Characterizations
Inductively Coupled Plasma—Atomic Emission Spectroscopy (ICP-AES, Crealins, Lyon, France) analysis was performed to determine the effective cerium concentration, xeff, in the nanopowders. Powder X-ray diffraction patterns have been recorded on a Siemens D8 Advance diffractometer (λCu = 1.54056 Å). Le Bail fits were carried using WinPLOTR software. Transmission electron microscopy (TEM) images were recorded using a Philips CM300 microscope, operating at 300 kV and equipped with a TemCam F416 TVIPS camera. Scanning Transmission electron microscopy (STEM) analyses were performed using a Cs-corrected FEI-Titan Themis microscope, operating at 200 kV and allowing high angle annular dark field (HAADF) imaging and subsequent energy-dispersive X-ray (EDX) chemical mapping.
X-ray Absorption Near Edge Spectroscopy (XANES) experiments were performed at the L3 edge of cerium in high energy resolution fluorescence-detected (HERFD) mode at the FAME-UHD beamline of the European Synchrotron Radiation Facility (ESRF Grenoble) (Proux et al., 2017). The photon energy was scanned from 5.68 to 5.85 keV using a Si(220) double crystal monochromator. A helium chamber was used between the autoclave, the crystal analyzer spectrometer and the detector to avoid partial beam absorption by air. The signal was recorded with a five-Ge(331) crystal analyzer and a Vortex-Ex detector. The beam size was 300 × 100 µm (Cantore et al., 2016) (horizontal × vertical FWHM). The energy calibration was done using the CeO2 spectrum. The Ce3+/Ce4+ ratio in each sample was determined by linear combination of XANES spectra of standards, i.e., CeO2 nanopowder as a reference for Ce4+ and Ce3+-doped YAG single crystal as a reference for Ce3+. The experimental data were analyzed using the Demeter software2.
Optical Characterizations
Photoluminescence (PL) was recorded on powder samples under a 445 nm excitation (PLP-10 laser diode from Hamamatsu). Optical detection was insured by an ANDOR Shamrock500i spectrograph connected to an electron-multiplying CCD Newton 970 from ANDOR operated in conventional mode. In addition, quantitative PL measurements were carried out with YAG:Ce nanocrystals dispersed in alcoholic solutions (c = 0.1 mg/ml) using a Xenius spectrofluorimeter (Safas), at room temperature and under a 457 nm excitation.
Photoluminescence iQY was measured on nanophosphor powder, using an integrating sphere (Quantaurus-QY Hamamatsu). More specifically, a small amount of powder was deposited in a quartz cuvette placed at the bottom of an integrating sphere. The powder was excited at 460 nm and the emission was collected from 480 to 800 nm. The iQY was obtained after measuring a blank sample, consisting in the same empty cuvette. The iQY measurements were repeated three times for each sample to ensure good repeatability leading to iQY values with an uncertainty of ±5%.
Time-resolved experiments were recorded on YAG:Ce powders using a 445-nm pulsed laser. The emission was selected above 500 nm by a high pass filter (FEL 500 from Thorlabs) and further collected and amplified by a photomultiplier (SMA-650 from Picoquant). The signal was then histogrammed using a multichannel analyzer (MCS6A from Fastcomtec) operating at a time per bin of 800 ps.
Results
Incorporation of Cerium into YAG Nanocrystals
The effective cerium concentration, xeff, in the as-synthesized nanopowders was determined by ICP and is presented as a function of the nominal cerium concentration, xnom, initially introduced in solution (Supplementary Figure S1). The relationship between xeff and xnom is linear with a slope of 1 ± 0.05. This indicates that the cerium incorporation rate in the solid phase is constant for the whole studied Ce concentration range (0–50 mol.%) and very close to the nominal concentration. This indicates that we do not have notable losses of Ce in solution during solvothermal syntheses. Thus, in the following, the cerium concentration will be labeled x and given in mol.%.
The Ce incorporation rate in YAG nanocrystals was characterized by analyzing powder X-ray patterns of the different as-synthesized nanopowders (Figure 1A). Only diffraction peaks corresponding to the YAG crystal structure are observed up to x = 30 mol.%, without any significant X-ray scattering background. This confirms that in this range of cerium concentrations (x ≤ 30 mol.%), the nanopowders consist only of pure YAG:Ce nanocrystals, i.e., Y3(1-x)Ce3xAl5O12 solid solution, without any notable crystalline or amorphous impurities. For highest doping concentrations (x = 50 mol.%), extra diffraction peaks attributed to Al2O3 and CeAlO3 phases are also observed (Supplementary Figure S2A) (Deshpande et al., 2011). For each sample, the unit cell parameter, a, was determined using Le Bail fit (Supplementary Figure S2B) and is reported Figure 1B. Up to x = 30 mol.%, a varies linearly with x, in agreement with a Vegard’s law and the formation of a homogeneous incorporation of cerium ions inside YAG nanocrystals. For x = 50 mol.%, the unit cell parameter is equal to the one obtained for x = 30 mol.%, confirming that the limit of cerium incorporation in the crystalline YAG matrix is reached for x = 30 mol.%, in accordance with the observation of additional crystalline phases for x > 30 mol.% (Supplementary Figure S2A). This validates that x = 30 mol.% corresponds to the limit of the Y3(1-x)Ce3xAl5O12 solid solution, where the effective segregation coefficient, keff., corresponding to the ratio xeff/xnom (ratio of the Ce concentration in nanocrystals to that in initial solutions) is constant in the whole Y3(1-x)Ce3xAl5O12 solid solution and very close to 1.
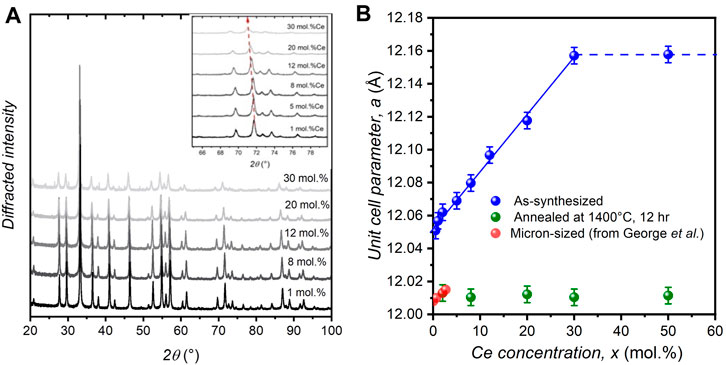
FIGURE 1. (A) Powder X-ray diffraction patterns of different YAG:Ce: (α) x = 1 mol.% Ce, (β) x = 8 mol.% Ce, (χ) x = 12 mol.% Ce, (δ) x = 20 mol.% Ce and (ε) x = 30 mol.% Ce. The inset shows a zoomed view which highlights the peak shift with x. (B) Evolution of the unit cell parameter, a, of as-synthesized (blue) and annealed (green) YAG:Ce nanocrystals as a function of the cerium concentration, x. For comparison, the cell parameter values obtained in micron-sized YAG:Ce are also shown, data from George et al. (2013) (red).
The unit cell parameter of all YAG:Ce (blue dots, Figure 1B) exceeds significantly the one of micron-sized YAG:Ce (red dots, Figure 1B), (George et al., 2013) attesting for local structural disorder in the nanocrystals as it will be discussed in the next section. When annealed at 1400°C for 12 h in air, the formation of additional CeO2 phase is observed for samples with x > 2 mol.% (Supplementary Figure S3B). Meanwhile, annealed YAG:Ce nanocrystals exhibit a unit cell parameter in good agreement with that of micron-sized crystals having a similar Ce concentration, x = 2 mol% Ce in Figure 1B. This shows that the annealing step induces a structural rearrangement in YAG:Ce nanocrystals and a simultaneous expelling a significant part of cerium ions which are partially oxidized in Ce4+ upon annealing in air.
Furthermore, the cerium distribution inside as-synthesized YAG:Ce nanocrystals was studied by EDX mapping for two different cerium doping concentrations: x = 1 mol.% and 12 mol.% (Figure 2). For both samples, the locations of Y and Ce atoms in the crystal structure are in similar sites, thus favoring a homogeneous Ce dispersion in the YAG matrix, even at high doping concentration. Indeed, the color contrast observed on Y and Ce maps of both samples are only due to the nanocrystal morphology (thickness variations) rather than to any Ce segregation.
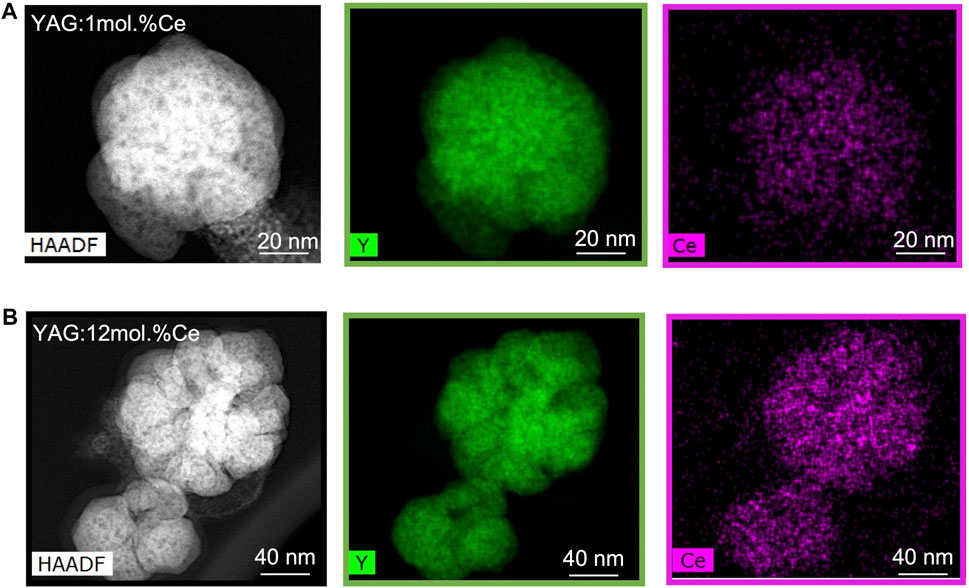
FIGURE 2. HAADF-STEM images of YAG:1mol.%Ce (A) and YAG:12mol.%Ce (B) and the associated EDX map for Y and Ce.
Size and morphology of YAG nanocrystals have been studied by Transmission Electron Microscopy (Supplementary Figures S4A,B). The average size, histogrammed from TEM images over more than 100 nanoparticles, is similar for all samples (30 ± 7.5 nm for YAG:2mol.%Ce, 38 ± 12.5 nm for YAG:12mol.%Ce, Supplementary Figures S5A,B). High magnification images (Supplementary Figure S4B) evidence high crystal quality of the nanocrystals, with atomic planes running through the whole particles, which is also confirmed by HAADF-STEM imaging (Figure 3A). However, HAADF-STEM imaging also exhibits strong contrast variations (Figure 3), attributed to an internal porosity (pore size evaluated between 2 and 5 nm). Surprisingly, this porosity of nanocrystals does not disrupt their crystallinity, as the atomic structure is very well preserved (Figures 3B,C). This porosity is compatible with the growth mechanism as described by Ramanujam et al. (2016) and further confirmed by Cantarano et al. (2020b): primary particles grow through a self-oriented aggregation and coalescence, which could result in voids trapped in-between primary particles.
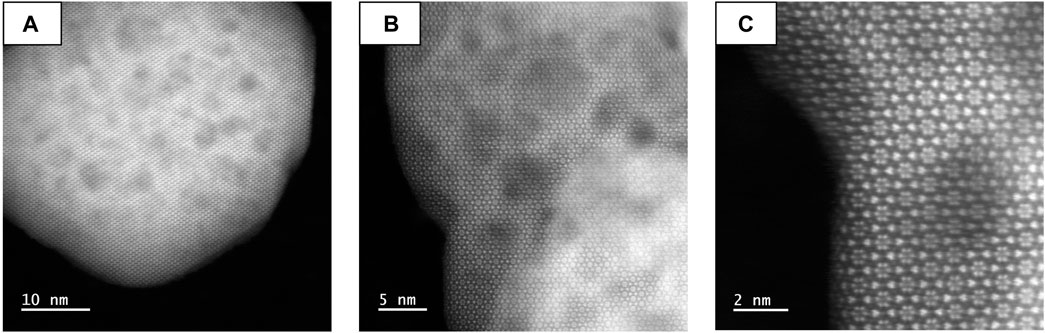
FIGURE 3. HAADF STEM images of YAG:1mol.%Ce nanocrystals at different magnifications (A‐C).
When nanocrystals are annealed at 1000°C for 12 h in air (Supplementary Figures S4C,D), the presence of porosity is clearly observed by TEM images. When annealed at 1400°C for 12 h, this porosity disappears; however, sintering has occurred, leading to larger YAG:Ce crystals whose size is submicronic (Supplementary Figures S4E,F).
Optical Properties of YAG:Ce Nanocrystals
The optical properties of YAG:Ce nanocrystals were assessed to determine both the spectroscopic characteristics of these nanocrystals, along with their PL brightness. First, the study of the emission spectra as a function of x (Figure 4A) shows a wavelength shift (Δλ) of the PL peak from 541 nm for x = 0.5 mol.% to 580 nm for x = 30 mol.%. This red-shift upon increasing cerium concentration has been already observed, to a lesser extent, in micron-sized YAG (from 541 nm for 1 mol.% Ce to 553 nm for 3 mol.% Ce) (Lin et al., 2018) and in other garnet phases (Haranath et al., 2006; Lin et al., 2019; Devys et al., 2017). It is attributed to crystal field modification due to the increase in local distortions in the CeO8 entities, (Xia and Meijerink, 2017; Ueda and Tanabe, 2019; Wu et al., 2007; Bachmann et al., 2009) as evidenced by the dependence with the unit cell parameter (Figure 4B). An interesting point here is that, given the large doping concentration in these nanocrystals, the shift is much more significant than that already reported (Δλ = + 39 nm).
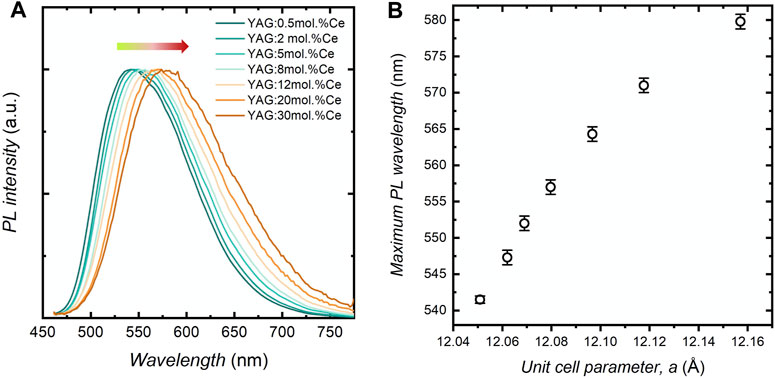
FIGURE 4. (A) Emission spectra of YAG:Ce nanopowders as a function of the cerium concentration, x. (B) Evolution of the position of the PL peak maximum as a function of the unit cell parameter for the corresponding YAG:Ce nanopowders.
The PL decay curves are recorded for all emitting wavelengths and represented as spectrally-resolved 2D maps (Figure 5A). Additionally, PL decay curves, integrating all emission wavelengths above 500 nm, are presented in Supplementary Figure S6. Spectra, corresponding to different gate delays, are extracted from these maps (Figure 5B). PL shift with x increase is again observed, especially at long delays, evidencing local inhomogeneities. PL decay curves at 540 nm, shown in Supplementary Figure S6, can be fitted by two exponential decays, leading to an average excited state lifetime τ (calculations detailed in the SI file). τ variation as a function of x is shown on Figure 5C. The decrease in τ with x results from Ce3+–Ce3+ energy transfer. At low Ce concentration (0.5 mol.%), the lifetime τ (122 ns) is larger than the typical one of bulk YAG:Ce (65 ns). This is commonly encountered when reducing a material size (Aubret et al., 2016). Indeed, the radiative de-excitation probability of the emitting centers is sensitive to the refractive index of the dielectric environment, which, at the micron scale, corresponds to an effective refractive index involving the emitter and its surrounding. At the nanoscale [<100 nm (LeBihan et al., 2008)], the definition of the surrounding environment is more complicated and an average refractive index can be considered, resulting from a mixture of the matrix refractive index and of the surrounding environment (air, in this case). As a result, the radiative lifetime of the emitters increases, leading to a longer measured lifetime, τ, compared to micro-sized or single crystals counterparts. In this study, as the nanocrystal size remains constant for all samples, the radiative lifetime can be considered as constant. The decrease in τ is thus directly related to the increase in non-radiative de-excitations, which become predominant at high Ce concentrations.
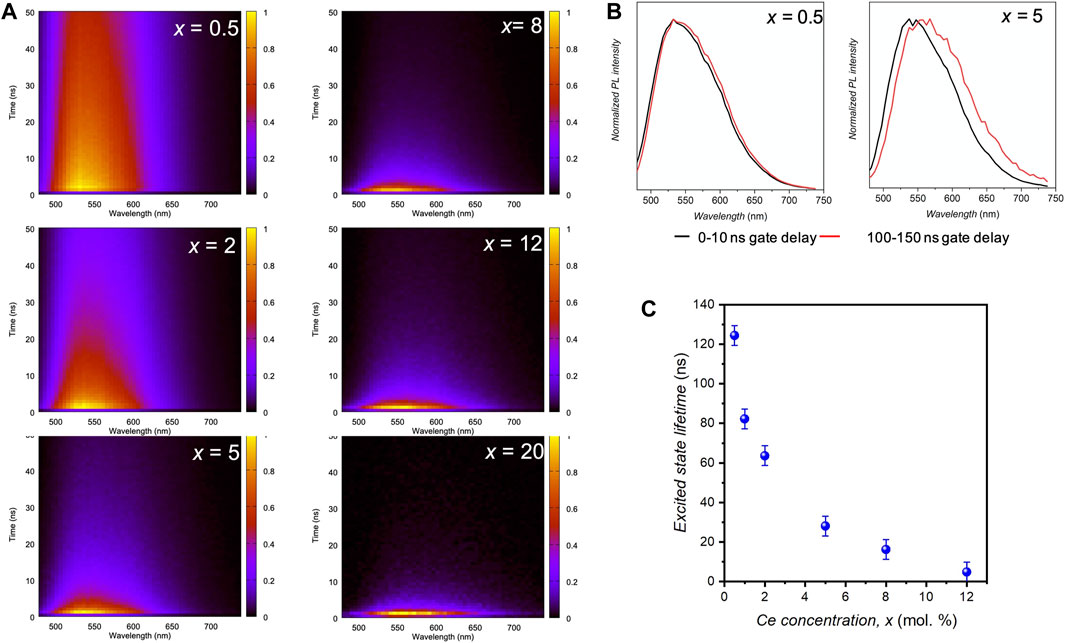
FIGURE 5. (A) 2D maps showing the PL decay over time. (B) Time-resolved PL spectra for two delay gates (0–10 ns and 100–150 ns) for x = 0.5 mol.% and 5 mol.%. (C) Excited state lifetime at 550 nm (exc. 457 nm) as a function of the cerium doping concentration, x.
The PL iQY has been measured for all samples (Figure 6A). At low Ce concentration, it is around 40 ± 5%, in agreement with previously reported values for individual YAG:Ce nanocrystals (Kasuya et al., 2005; Dantelle et al., 2018) iQY values decrease with the increased Ce concentration, as reported by Aboulaich et al. (2012). This evolution follows the decrease in PL intensity obtained by integrating the PL decay (black stars, Figure 6A) and is explained by the concentration quenching mechanism.
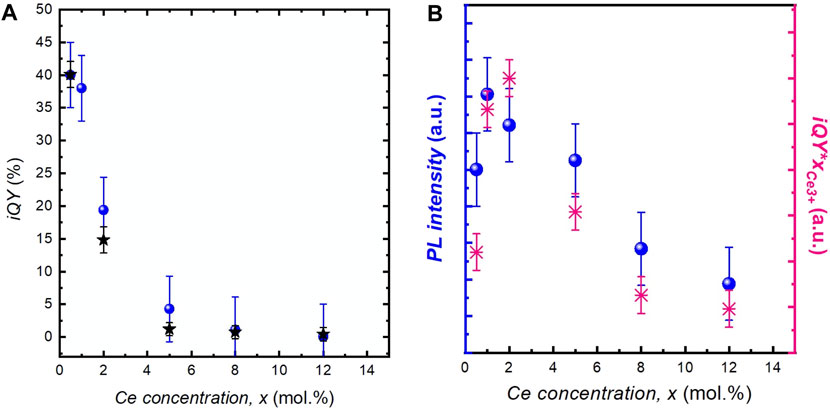
FIGURE 6. (A) Evolution of iQY as a function of the cerium concentration, x, in YAG:Ce nanocrystals (blue dots). The black stars correspond to the integrated PL decay at 540 nm. (B) Brightness of YAG:Ce nanocrystals obtained by the direct measurement of the PL intensity (in blue) and by multiplying iQY by xCe3+(in pink).
For the development of micro-LEDs or nanostructured LEDs, the optimization of nanophosphor quantity is essential, requiring the optimization of nanocrystal PL brightness. It is complicated to get quantitative measurements on powder samples and great care should be taken to avoid any bias induced by light scattering. In our study, PL brightness was assessed by direct PL measurement of diluted colloidal solutions of YAG:Ce nanocrystals dispersed in ethanol. In these solutions containing a small amount of nanocrystals (0.1 mg ml−1), the scattering and potential self-absorption are significantly reduced. Hence, as the nanocrystal size does not vary among the different samples, the residual scattering can be considered as similar for the different solutions. The evolution of the PL is shown by the blue dots in Figure 6A. Maximal brightness is obtained for a cerium concentration of 2 mol.%.
Moreover, this brightness was also evaluated from the product of iQY and the number of absorbing species (i.e., Ce3+ ions), NCe3+. To do so, although the cerium concentration is known in all samples, the Ce3+/Ce4+ proportion should be determined as a function of x. For that purpose, XANES spectra of different YAG:Ce nanocrystals were recorded (Figure 7A). For all samples, the experimental spectra were fitted by a linear combination of reference spectra of CeO2 nanocrystals for Ce4+ ions and YAG:Ce single crystal (with x = 1 mol.% Ce) for Ce3+ ions. Thus, we accurately determined the Ce3+/Ce4+ ratio (Figure 7B), (Dantelle et al., 2018) and subsequently the Ce3+ concentration, directly proportional to NCe3+ (Table 1). The product iQY * xCe3+ is plotted in Figure 6B. Its evolution with x matches well with the evolution of PL intensity, allowing to confirm that the maximal brightness is obtained for a cerium concentration of about 2 mol.%.
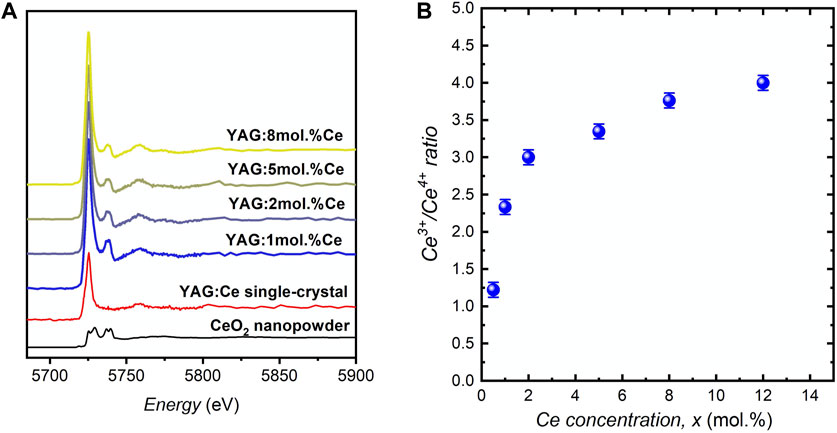
FIGURE 7. (A) XANES spectra of YAG:xCe nanocrystals for different cerium concentrations and (B) Ce3+:Ce4+ ratio calculated from the linear combination of reference spectra of CeO2 nanocrystals and YAG:Ce single crystal doped with 1 mol.% Ce.

TABLE 1. Summary of the PL iQY and Ce3+:Ce4+ proportion, allowing the calculation of effective Ce3+ concentration and subsequent brightness obtained by multiplying the iQY by the effective Ce3+ concentration, xCe3+.
4 Discussion
High Incorporation Ratio of Ce3+ in YAG Nanocrystals Obtained by Solvothermal Process
Lanthanide-doped YAG materials have been extensively studied for various applications (lasers, phosphors, scintillators, etc). The substitution of yttrium (Y3+) in a dodecahedral site by trivalent lanthanide ions has proved to be efficient for all Ln3+ ions. However, the maximum insertion concentration of Ln3+ in YAG structure varies according to their ionic size. Indeed small Ln3+ ions (Ln = Lu3+, Yb3+, Er3+, Tb3+) can completely substitute Y3+, leading to continuous solid solutions [Y3(1-x)Ln3xAl5O12] and pure Ln3Al5O12 garnet phase. On the other hand, larger Ln3+ ions can form partial solid solution, leading for high Ln concentrations to the appearance of additional phases, with mixed LnAlO3:Al2O3 or LnAlO3:Ln2O3:2Al2O3 compounds (Dubnikova et al., 2010). In particular, Ce3+ (rCe3+ = 1.143 Å vs. rY3+ = 1.019 Å, in a 8-fold coordinated environment) presents a solid solution, Y3(1-x)Ce3xAl5O12, limited to a few mol.% with respect to Y3+, above which Al2O3 and CeO2 phases are formed (Dubnikova et al., 2010).
This limit of solid solution varies according to synthesis conditions (temperature, atmosphere) and crystal shaping. Indeed, oxidizing conditions can favor the formation of Ce4+, which is even less prone to remain in the YAG lattice, compared to Ce3+, due to the charge and size (rCe4+ = 0.97 Å) differences with Y3+. On the other hand, YAG crystal size (cm-sized crystals, ceramics, micron-sized powders or nanocrystals) has a strong effect on the maximal Ce incorporation (Table 2). Cm-sized YAG:Ce crystals grown by the Czochralski technique (Arjoca et al., 2015) and the temperature gradient technique (TGT) under Ar atmosphere (Zhao et al., 2003) incorporate less than 0.2 mol.% Ce3+. Micron-sized crystals, obtained by solid-state synthesis from CeO2, Al2O3 and Y2O3 powders annealed at 1500°C for 5 h, under Ar/H2 atmosphere, can incorporate homogeneously up to 3 mol.% Ce3+ (George et al., 2013; Lin et al., 2020). Agglomerated sub-micron YAG:Ce crystals produced by coprecipitation, Pechini and sol-gel methods, involving rather similar annealing temperatures, allowed to incorporate Ce concentrations of a few percent, between 3 and 5 mol.% Ce, (Bachmann et al., 2009; He et al., 2016) thus comparable to the above the solid-state route. Moreover, the effect of the annealing temperature on the incorporation limit of cerium was evidenced by Kareiva (2011). When a sol-gel powder is annealed at 1300°C, a temperature comparable to that used in the solid-state route, the cerium incorporation rate is 4 mol.%. For lower annealing temperature (1000°C), the cerium incorporation rate is much higher (10 mol.%).
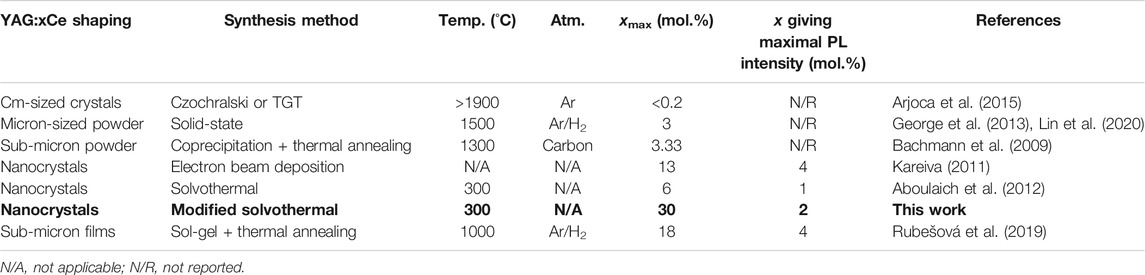
TABLE 2. Summary of maximal Ce concentration, xmax, in YAG according to the crystal size and synthesis method and of Ce concentration giving the highest PL intensity for each method.
As far as nanocrystals are concerned, they can be produced by a low-energy cluster beam deposition technique as reported by B. Masenelli et al. The resulting YAG:Ce particles are very small (10 nm) and able to incorporate nearly 13 mol.% of cerium, mainly Ce3+ as measured by X-ray photoelectron spectroscopy (XPS) and Rutherford backscattering (RBS) spectrometry techniques (Masenelli et al., 2013). When produced by a solvothermal method, A. Aboulaich et al. report a nominal doping of at least 6 mol.% Ce in 30-nm sized YAG nanocrystals (Aboulaich et al., 2012). Finally, a recent paper reports a cerium incorporation of 18 mol.% (nominal) in YAG sol-gel thin films (Rubešová et al., 2019). It is believed that this 2D geometry with a sub-micronic thickness and with the limited annealing step (1 h at 1000°C) under reducing atmosphere enables such high doping concentration. Interestingly, all the above syntheses—including ours—which produce YAG nanocrystals with a size below 100 nm, through synthesis routes far from thermodynamic equilibrium, lead to much higher Ce3+ concentrations than in the cm- and micron-sized YAG crystals (Table 2).
These observations can be correlated to the capacity of nanocrystals to better accommodate local structural strains and distortions, and thus to incorporate more easily large Ce3+ cations in their YAG lattice. This is illustrated by a segregation coefficient, keff, very close to 1, that we determined for YAG:Ce nanocrystals (Supplementary Figure S1) on the opposite to the very low segregation coefficient measured in the case of large single crystals grown by the Czochralski (keff. = 0.067) (Arjoca et al., 2015) or by the temperature gradient technique (keff. = 0.082) (Zhao et al., 2003). To confirm the presence of local distortions, internal strains, ε, were assessed from the Le Bail fits of the powder X-ray diffraction patterns for our different YAG:Ce samples (Table 3). While as-synthesized YAG:Ce nanocrystals exhibit internal strains of the order of 10‰, the annealing treatment at 1400°C in air drastically reduces them (ε ∼ 1‰). Indeed, thermal treatment at 1400°C allows efficient atomic mobility and helps relaxing internal strains. It leads to the expulsion of cerium ions from the YAG lattice, which cannot accommodate such large Ce3+ cations. This Ce expulsion is all the more significant that the annealing is performed in air, inducing the formation of Ce4+ cations by oxidation and the formation of CeO2 phase, seen by X-ray diffraction for samples with x > 2 mol.%, (Supplementary Figure S3). Thus, the cerium insertion limit meets that of micron-sized crystals (∼3 mol.%, Figure 1B), prepared by solid-state reaction (George et al., 2013). In addition, note that this significant release of internal strains during annealing is associated to an important increase in the coherence length, Lc, in good agreement with the increase in the size of the single crystal domains as also observed by TEM (Supplementary Figure S4).
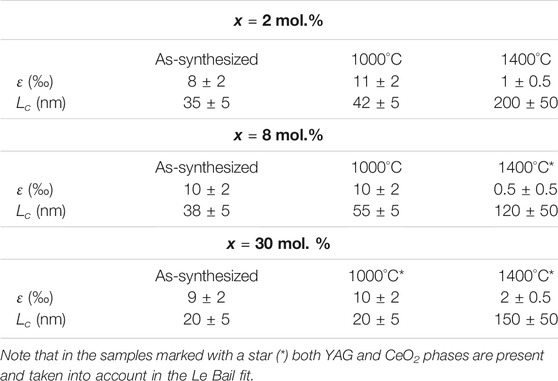
TABLE 3. Coherence length, Lc, and internal strains, ε, of YAG:Ce samples with different x.
This explanation of high Ce incorporation in YAG nanocrystals through structural strains and Y site distortions can be directly related to the observations made on Ce-doped garnet ceramics. Indeed, in these ceramics, heterogeneities in the spatial distribution of cerium are observed, with much higher cerium concentration at the grain boundaries than within the grains as a result of the ceramization process (Zhao et al., 2011; Ramirez et al., 2008). For instance, in 0.5% Ce-doped (Gd,Y)3Al5O12, Ce3+ concentration is 5 times higher at the grain boundaries, (Zhao et al., 2010) which corresponds to zones of high strains and structural distortions, than in the core of grains. It shows that Ce3+ does not fit well in the dodecahedral site of YAG and tends to get out of the rigid YAG lattice, in agreement with the very low segregation coefficients measured in the case of cm-sized single crystals (Zhao et al., 2003; Arjoca et al., 2015).
Finally, it is worth noting that, with our modified solvothermal process, the quantity of incorporated cerium (30 mol.%) is much higher than ever reported before. This could be due to the use of an external pressure in our modified solvothermal method that increases the solubility and chemical reactivity of the precursors in solution, facilitating the accommodation of a higher concentration of cerium in the YAG lattice (Demazeau, 2010).
Optimization of YAG:Ce Brigthness
The brightness corresponds to the number of emitted photons upon a given excitation. It should take into account the material internal quantum yield (iQY) and also its capacity to absorb photons. When micron-sized crystals are used, the absorption rate is not a problem as a low absorption coefficient can be easily compensated by the rise in matter (Waetzig et al., 2014). However, if one wants to limit the quantity of these phosphors which contain critical elements such as (Gaffuri et al., 2021) or to develop thin phosphor layer for the elaboration of nanostructured LEDs, it is essential to take into account the absorption capacity of these phosphors. Similar considerations have been done on YAG:Ce ceramics, (Yuan et al., 2018) where the absorption is adjusted by increasing the ceramic thickness.
Here, the maximal PL intensity, i.e., maximal nanocrystal brightness, has been determined using diluted suspension of YAG:Ce nanocrystals to be in the low absorption regime. Highest brightness is obtained for x = 2 mol.% (Figure 6B). Indeed, even if the maximal iQY is obtained for low cerium concentration (0.5 mol.%, Figure 6A), YAG nanocrystals containing 2 mol.% cerium have a better absorption capacity which is not significantly hindered by the decrease in the iQY. This value is consistent with other measurements reported in the literature (Table 2).
The brightness of these YAG:Ce nanocrystals cannot be directly compared to the one of commercial YAG:Ce phosphors due to the difference of excited and emitted light scattering between micron-sized and nanometer-sized particles. It is true that the iQY of these YAG:Ce nanocrystals (40%) is much lower than the iQY of commercial ones (>85%), but their size is a real asset for the future developments of miniaturized micro-LED devices (Berends et al., 2020).
Conclusion
Thanks to a modified solvothermal process at 300°C, involving a high pressure (200 bar), we achieved a very high cerium insertion rate in YAG nanocrystals (30 mol.%) without the appearance of any parasitic phase. In this study, we highlight the drastic discrepancy in terms of cerium insertion between cm- and micron-sized YAG crystals (0.2 and 3 mol.% resp.) and our YAG nanocrystals (30 mol.%). This phenomenon is explained by the nanometer size of the particles, along with the presence of local strains, and by the use of a soft synthesis route at low temperature (300°C), far from the thermodynamic equilibrium. Indeed, crystal growths from the melt or solid-state reactions, carried out under conditions (≥1300°C for several hours) much closer to thermodynamic equilibrium than our method, lead to YAG crystals of very high quality, with a minimum of defects, and consequently with a limited integration rate of cerium. Thus, the elaboration of nanocrystals with solvothermal methods allows the insertion of high cerium contents even in the case of a rigid lattice like YAG. For less rigid crystal lattices, such as Gd3Sc2Al5O12, known to incorporate up to 18 mol.% cerium for micron-sized crystal prepared by solid-state reaction, (Devys et al., 2017) we can expect for nanocrystals synthesized by solvothermal method much higher maximal doping rates than in the case of YAG. This opens the door to the synthesis of multifunctional highly-doped nanocrystals with applications in biophotonics, including magnetic resonance imaging (when doped with Gd3+ ions).
Concerning the photoluminescence emissions, highly doped YAG:Ce nanocrystals exhibit a large red-shift (max. PL at 580 nm) with respect to YAG nanocrystals containing a low cerium concentration (max. PL at 541 nm). Considering the absorption capacity of the nanocrystals, along with their internal quantum efficiency and the presence of Ce4+, the maximal brightness is obtained for a cerium doping of about 2 mol.%. Such doping concentration should be considered for applications where the quantity of phosphors is limited, such as micro-LEDs or nanostructured lighting devices.
Data Availability Statement
The original contributions presented in the study are included in the article/Supplementary Material, further inquiries can be directed to the corresponding author.
Author Contributions
Conceptualization and Methodology, AC, AI, and GD; Experimental investigations: AC, DT, EH, HO, AP, CD, AI, and GD. Writing-Original Draft Preparation, GD; Writing-Review and Editing, DT, AP, CD, AI, and CD. Funding Acquisition, AI and GD.
Funding
This work has been funded by French National Research Agency for funding (project NanophosforLED, ANR-17-CE09-0035-01).
Conflict of Interest
The authors declare that the research was conducted in the absence of any commercial or financial relationships that could be construed as a potential conflict of interest.
Publisher’s Note
All claims expressed in this article are solely those of the authors and do not necessarily represent those of their affiliated organizations, or those of the publisher, the editors and the reviewers. Any product that may be evaluated in this article, or claim that may be made by its manufacturer, is not guaranteed or endorsed by the publisher.
Acknowledgments
GD thanks the CNRS network “Microscopie Electronique et Sonde Atomique” (METSA, FR CNRS 3507) for financial support.
Supplementary Material
The Supplementary Material for this article can be found online at: https://www.frontiersin.org/articles/10.3389/fmats.2021.768087/full#supplementary-material
Footnotes
1https://cree-led.com/media/documents/Remote-Phosphor.pdf
2https://bruceravel.github.io/demeter/
References
Aboulaich, A., Deschamps, J., Deloncle, R., Potdevin, A., Devouard, B., Chadeyron, G., et al. (2012). Rapid Synthesis of Ce3+-Doped YAG Nanoparticles by a Solvothermal Method Using Metal Carbonates as Precursors. New J. Chem. 36, 2493–2500. doi:10.1039/c2nj40429j
Arjoca, S., Víllora, E. G., Inomata, D., Aoki, K., Sugahara, Y., and Shimamura, K. (2015). Temperature Dependence of Ce:YAG Single-crystal Phosphors for High-Brightness white LEDs/LDs. Mater. Res. Express 2, 055503. doi:10.1088/2053-1591/2/5/055503
Aubret, A., Pillonnet, A., Houel, J., Dujardin, C., and Kulzer, F. (2016). CdSe/ZnS Quantum Dots as Sensors for the Local Refractive index. Nanoscale 8, 2317–2325. doi:10.1039/C5NR06998J
Bachmann, V., Ronda, C., and Meijerink, A. (2009). Temperature Quenching of Yellow Ce3+ Luminescence in YAG:Ce. Chem. Mater. 21, 2077. doi:10.1021/cm8030768
Berends, A. C., van de Haar, M. A., and Krames, M. R. (2020). YAG:Ce3+ Phosphor: From Micron-Sized Workhorse for General Lighting to a Bright Future on the Nanoscale. Chem. Rev. 120, 13461–13479. doi:10.1021/acs.chemrev.0c00618
Blasse, G., and Grabmaier, B. C. (1994). Luminescent Materials. Berlin-Heidelberg, Germany: Springer-Verlag.
Cantarano, A., Ibanez, A., and Dantelle, G. (2020). Garnet-type Nanophosphors for white LED Lighting. Front. Mater. 7, 210. doi:10.3389/fmats.2020.00210
Cantarano, A., Testemale, D., Sousa Nobre, S., Potdevin, A., Bruyère, R., Barbara, A., et al. (2020). Twofold Advantage of Gas Bubbling for the Advanced Solvothermal Preparation of Efficient YAG:Ce Nanophosphors. J. Mat. Chem. C 8, 9382–9390. doi:10.1039/d0tc02347g
Cantore, M., Pfaff, N., Farrell, R. M., Speck, J. S., Nakamura, S., and DenBaars, S. P. (2016). High Luminous Flux from Single crystal Phosphor-Converted Laser-Based white Lighting System. Opt. Express 24, A215–A221. doi:10.1364/OE.24.00A215
Chen, B., and Wang, F. (2020). Combating Concentration Quenching in Upconversion Nanoparticles. Acc. Chem. Res. 53, 358–367. doi:10.1021/acs.accounts.9b00453
Dantelle, G., Testemale, D., Homeyer, E., Cantarano, A., Kodjikian, S., Dujardin, C., et al. (2018). A New Solvothermal Method for the Synthesis of Size-Controlled YAG:Ce Single-Nanocrystals. RSC Adv. 8, 26857–26870. doi:10.1039/c8ra05914d
Demazeau, G. (2010). Impact of High Pressures in Solvothermal Processes. J. Phys. Conf. Ser. 215, 012124. doi:10.1088/1742-6596/215/1/012124
Deng, Z., Wang, M., Zhu, C., Li, C., Liu, J., Tu, M., et al. (2019). Study on Light Aging of Anhydride-Cured Epoxy Resin Used for RGB LED Packaging Material. Polym. Test. 80, 106131. doi:10.1016/j.polymertesting.2019.106131
Deshpande, A., Arunab, S. T., and Madras, G. (2011). CO Oxidation by CeO2–Al2O3–CeAlO3 Hybrid Oxides. Catal. Sci. Technol. 1, 1683–1691. doi:10.1039/C1CY00265A
Devys, L., Dantelle, G., Laurita, G., Homeyer, E., Gautier-Luneau, I., Dujardin, C., et al. (2017). A Strategy to Increase Phosphor Brightness: Application with Ce3+-Doped Gd3Sc2Al3O12. J. Lumin. 190, 62–68. doi:10.1016/j.jlumin.2017.05.035
Dubnikova, N., Garskaite, E., Pinkas, J., Bezdicka, P., Beganskiene, A., and Kareiva, A. (2010). Sol–gel Preparation of Selected Lanthanide Aluminum Garnets. J. Sol-gel Sci. Technol. 55, 213–219. doi:10.5755/j01.ms.17.4.782
Gaffuri, P., Stolyarova, E., Llerena, D., Appert, E., Consonni, M., Robin, S., et al. (2021). Potential Substitutes for Critical Materials in white LEDs: Technological Challenges and Market Opportunities. Renew. Sust. Energ. Rev. 143, 110869. doi:10.1016/j.rser.2021.110869
Gaiser, H. F., Kuzmanoski, A., and Feldmann, C. (2019). Y3Al5O12:Ce Nanoparticles Made by Ionic-Liquid- Assisted Particle Formation and LiCl-Matrix-Treated Crystallization. RSC Adv. 9, 10195. doi:10.1039/c9ra01537j
George, N., Pell, A. J., Dantelle, G., Page, K., Llobet, A., Balasubramanian, M., et al. (2013). The Local Environment of the Activator Ions in the Solid-State Lighting Y3-xCexAl5O12. Chem. Mater. 25 (20), 3979–3995. doi:10.1021/cm401598n
Haranath, D., Chander, H., Sharma, P., and Singh, S. (2006). Enhanced Luminescence of Y3Al5O12:Ce3+ Nanophosphor for white Light-Emitting Diodes. Appl. Phys. Lett. 89, 173118. doi:10.1063/1.2367657
He, X., Liu, X., Li, R., Yang, B., Yu, K., Zeng, M., et al. (2016). Effects of Local Structure of Ce3+ Ions on Luminescent Properties of Y3Al5O12:Ce Nanoparticles. Sc. Rep. 6, 22238. doi:10.1038/srep22238
Hussain, T., Zhong, L., Danesh, M., Ye, H., Liang, Z., Xiao, D., et al. (2015). Enable Low-Amount YAG:Ce3+ to Convert into White Light with Plasmonic Au Nanoparticles. Nanoscale 7 (23), 10350–10356. doi:10.1039/C5NR01038A
Jiao, H., Ma, Q., He, L., Liu, Z., and Wu, Q. (20102010). Low Temperature Synthesis of YAG:Ce Phosphors by LiF Assisted Sol–Gel Combustion Method. Powder Tech. 198, 229–232. doi:10.1016/j.powtec.2009.11.011
Kareiva, A. (2011). Aqueous Sol-Gel Synthesis Methods for the Preparation of Garnet Crystal Structure Compounds. Mater. Sci. 17 (4), 428–437. doi:10.5755/j01.ms.17.4.782
Kasuya, R., Isobe, T., Kuma, H., and Katano, J. (2005). Photoluminescence Enhancement of PEG-Modified YAG:Ce Nanocrystal Phosphor Prepared by Glycothermal Method. J. Phys. Chem. B 109, 22126–22130. doi:10.1021/jp052753j
LeBihan, V., Pillonnet, A., Amans, D., Ledoux, G., Marty, O., and Dujardin, C. (2008). Critical Dimension where the Macroscopic Definition of Refractive index Can Be Applied at a Nanometric Scale. Phys. Rev. B. 78, 113405. doi:10.1103/PhysRevB.78.113405
Li, C., Zhang, Y., Gong, H., Zhang, J., and Nie, L. (2009). Preparation, Microstructure and Properties of Yttrium Aluminum Garnet Fibers Prepared by Sol-Gel Method. Mater. Chem. Phys. 113, 31–35. doi:10.1016/j.matchemphys.2008.07.025
Lin, Y. C., Bettinelli, M., Sharma, S. K., Redlich, B., Speghini, A., and Karlsso, M. (2020). Unraveling the Impact of Different thermal Quenching Routes on the Luminescence Efficiency of the Y3Al5O12:Ce3+ Phosphor for white Light Emitting Diodes. J. Mater. Chem. C 8, 1401. doi:10.1039/D0TC03821K
Lin, Y. C., Erhart, P., Bettinelli, M., George, N. C., Parker, S. F., and Karlsson, M. (2018). Understanding the Interactions between Vibrational Modes and Excited State Relaxation in Y3−xCexAl5O12: Design Principles for Phosphors Based on 5d−4f Transitions. Chem. Mater. 30, 1865–1877. doi:10.1021/acs.chemmater.7b04348
Lin, Y. C., Erhart, P., and Karlsson, M. (2019). Vibrationally Induced Color Shift Tuning of Photoluminescence in Ce3+-Doped Garnet Phosphors. J. Mater. Chem. C 7, 12926–12934. doi:10.1039/c9tc01244c
Masenelli, B., Mollet, O., Boisron, O., Canut, B., Ledoux, G., Bluet, J. M., et al. (2013). YAG:Ce Nanoparticle Lightsources. Nanotechnology 24, 165703.
Nishiura, S., Tanabe, S., Fujiok, K., and Fujimoto, Y. (2011). Properties of Transparent Ce:YAG Ceramic Phosphors for white LED. Opt. Mater. 33, 688–691. doi:10.1016/j.optmat.2010.06.005
Proux, O., Lahera, E., Del Net, W., Kieffer, I., Rovezzi, M., Testemale, D., et al. (2017). High-Energy Resolution Fluorescence Detected X-Ray Absorption Spectroscopy: A Powerful New Structural Tool in Environmental Biogeochemistry Sciences. J. Environ. Qual. 46, 1146–1157. doi:10.2134/jeq2017.01.0023
Ramanujam, P., Vaidhyanathan, B., Binner, J. G. P., Ghanizadeh, S., and Spacie, C. (2016). Solvothermal nanoYAG Synthesis: Mechanism and Particle Growth Kinetics. J. Supercrit. Fluids 107, 433–440. doi:10.1016/j.supflu.2015.09.031
Ramirez, M. O., Wisdom, J., Li, H., Aung, Y. L., Stitt, J., Messing, G. L., et al. (2008). Three-dimensional Grain Boundary Spectroscopy in Transparent High Power Ceramic Laser Materials. Opt. Express 9, 5965. doi:10.1364/OE.16.005965
Rubešová, K., Havlíček, J., Jakeš, V., Nádherný, L., Cajzl, J., Pánek, D., et al. (2019). Heavily Ce3+-Doped Y3Al5O12 Thin Films Deposited by a Polymer Sol–Gel Method for Fast Scintillation Detectors. Cryst. Eng. Comm. 21, 5115. doi:10.1039/C9CE00842J
Ryu, H.-Y., and Kim, D.-H. (2010). High-brightness Phosphor-Conversion white Light Source Using InGaN Blue Laser Diode. J. Opt. Soc. Korea 14 (4), 415–419. doi:10.3807/JOSK.2010.14.4.415
Sarkar, D., Ganguli, S., Samanta, T., and Mahalingam, V ( (2019). Design of Lanthanide-Doped Colloidal Nanocrystals: Applications as Phosphors, Sensors, and Photocatalysts. Langmuir 35, 6211–6230. doi:10.1021/acs.langmuir.8b01593
Schimpke, T., Mandl, M., Stoll, I., Pohl-Klein, B., Bichler, D., Zwaschka, F., et al. (2016). M. Phosphor-Converted white Light from Blue-Emitting InGaN Microrod LEDs. Phys. Status Solidi A. 213, 1577–1584. doi:10.1002/pssa.201532904
Sun, C. C., Chang, Y. Y., Yang, T. H., Chung, T. Y., Chen, C. C., Lee, T. X., et al. (2014). Packaging Efficiency in Phosphor-Converted white LEDs and its Impact to the Limit of Luminous Efficacy. J. Sol. St. Light. 1, 19. doi:10.1186/s40539-014-0019-0
Taki, T., and Strassburg, M. (2020). Review—Visible LEDs: More Than Efficient Light. ECS J. Solid State. Sci. Tech. 9, 015017. doi:10.1149/2.0402001JSS
Ueda, J., and Tanabe, S. (2019). Review of Luminescent Properties of Ce3+-Doped Garnet Phosphors: New Insight into the Effect of crystal and Electronic Structure. Opt. Mater. 1, 100018. doi:10.1016/j.omx.2019.100018
Waetzig, K., Kunzer, M., and Kinski, I. (2014). Influence of Sample Thickness and Concentration of Ce Dopant on the Optical Properties of YAG:Ce Ceramic Phosphors for white LEDs. J. Mater. Res. 29, 2318–2324. doi:10.1557/jmr.2014.229
Wen, S., Zhou, J., Zheng, K., Bednarkiewicz, A., Liu, X., and Jin, D. (2018). Advances in Highly Doped Upconversion Nanoparticles. Nat. Commun. 9, 2415. doi:10.1038/s41467-018-04813-5
Wu, J. L., Gundiah, G., and Cheetham, A. K. (2007). Structure–property Correlations in Ce-Doped Garnet Phosphors for Use in Solid State Lighting. Chem. Phys. Lett. 441, 250–254. doi:10.1016/j.cplett.2007.05.023
Xia, Z., and Meijerink, A. (2017). Ce3+-Doped Garnet Phosphors: Composition Modification, Luminescence Properties and Applications. Chem. Soc. Rev. 46, 275. doi:10.1039/c6cs00551a
Ye, H., Koh, S., Yuan, A., and Zhang, G. Q. (2012). Thermal Analysis of Phosphor in High Brightness LED,” in International Conference on Electronic Packaging Technology & High Density Packaging. (Accessed August 2012). doi:10.1109/ICEPT-HDP.2012.6474899
Yuan, Y., Wang, D., Zhou, B., Feng, S., Sun, M., Zhang, S., et al. (2018). High Luminous Fluorescence Generation Using Ce:YAG Transparent Ceramic Excited by Blue Laser Diode. Opt. Mater. Express. 8, 2760–2767. doi:10.1364/OME.8.002760
Zhao, G., Zeng, X., Xu, J., Xu, Y., and Zhou, Y. (2003). Characteristics of Large-Sized Ce:YAG Scintillation crystal Grown by Temperature Gradient Technique. J. Cryst. Growth 253, 290–296. doi:10.1016/S0022-0248(03)01017-0
Zhao, W., Anghel, S., Mancini, C., Amans, D., Boulon, G., Epicier, T., et al. (2011). Ce3+ Dopant Segregation in Y3Al5O12 Optical Ceramics. Opt. Mater. 33, 684–687. doi:10.1016/j.optmat.2010.10.007
Keywords: YAG, cerium, nanocrystals, solvothermal, photoluminescence, brightness
Citation: Cantarano A, Testemale D, Homeyer E, Okuno H, Potdevin A, Dujardin C, Ibanez A and Dantelle G (2021) Drastic Ce3+ Insertion Enhancement in YAG Garnet Nanocrystals Through a Solvothermal Route. Front. Mater. 8:768087. doi: 10.3389/fmats.2021.768087
Received: 31 August 2021; Accepted: 24 September 2021;
Published: 23 November 2021.
Edited by:
Zhicheng Su, Australian National University, AustraliaReviewed by:
Rodrigo Moreno, Instituto de Cerámica y Vidrio (ICV), SpainSanjiv Moharil, Rashtrasant Tukadoji Maharaj Nagpur University, India
Copyright © 2021 Cantarano, Testemale, Homeyer, Okuno, Potdevin, Dujardin, Ibanez and Dantelle. This is an open-access article distributed under the terms of the Creative Commons Attribution License (CC BY). The use, distribution or reproduction in other forums is permitted, provided the original author(s) and the copyright owner(s) are credited and that the original publication in this journal is cited, in accordance with accepted academic practice. No use, distribution or reproduction is permitted which does not comply with these terms.
*Correspondence: Geraldine Dantelle, Z2VyYWxkaW5lLmRhbnRlbGxlQG5lZWwuY25ycy5mcg==