 Cem Örnek1*
 Timo Müller2
 Bilgehan M. Şeşen1Ulf Kivisäkk3
 Fan Zhang4Marie Långberg4Ulrich Lienert2Arno Jeromin5
 Thomas F. Keller5,6Edvin Lundgren7
 Jinshan Pan4*
- 1Department of Metallurgical and Materials Engineering, Istanbul Technical University, Istanbul, Turkey
- 2Deutsches Elektronen-Synchrotron (DESY), Photon Science, Hamburg, Germany
- 3AB Sandvik Materials Technology, Sandviken, Sweden
- 4Department of Chemistry, KTH Royal Institute of Technology, Stockholm, Sweden
- 5Centre for X-ray and Nano Science (CXNS), Deutsches Elektronen-Synchrotron DESY, Hamburg, Germany
- 6Department of Physics, University of Hamburg, Hamburg, Germany
- 7NanoLund Center for Nanoscience, Lund University, Lund, Sweden
The local lattice strain evolution during electrochemical hydrogen charging and mechanical loading in 25Cr-7Ni super duplex stainless steel were measured in-situ using synchrotron high-energy x-ray diffraction. Post-mortem electron backscattered diffraction analysis showed that the austenite phase underwent plastic deformation in the near-surface due to hydrogen-enhanced localized plasticity, where the ferrite phase experienced hardening. In bulk regions, the ferrite was the softer phase, and the austenite remained stiff. Digital image correlation of micrographs recorded, in-situ, during mechanical tensile testing revealed intensified plastic strain localization in the austenite phase, which eventually led to crack initiation. The absorption of hydrogen caused strain localization to occur primarily in austenite grains.
1 Introduction
Hydrogen embrittlement (HE) of steels is one of the most studied but most minor understood phenomena of material degradation (Lynch et al., 2011; Bhadeshia, 2016; Barrera et al., 2018). The interaction of hydrogen with the microstructure is complex and multifarious and typically operates in various length and time scales (Zucchi et al., 2006; Agüero et al., 2009; Lynch et al., 2011; Mente and Boellinghaus, 2014; Leyson et al., 2016; Barrera et al., 2018; Örnek et al., 2018; Maria et al., 2019). Studying HE is challenging as the processes that lead to embrittlement have a dynamic character (Mente and Boellinghaus, 2014; Bak et al., 2016; Leyson et al., 2016; Koyama et al., 2017; Gu and El-Awady, 2018); hydrogen atoms interact with the local microstructure and lead to the generation and annihilation of defects (Bhadeshia, 2016; Leyson et al., 2016; Barrera et al., 2018; Gu and El-Awady, 2018), change their position or occupy other regions in the microstructure, and produce or annihilate elastic strain fields and cause plasticity (Agüero et al., 2009; Bhadeshia, 2016; Leyson et al., 2016; Tehranchi et al., 2017; Barrera et al., 2018; Gu and El-Awady, 2018). The defects can distort grain boundaries and lead to strain and stress localization in the microstructure, facilitating crack formation, which is embrittlement (Andreikiv et al., 1978; Lynch et al., 2011; Lynch, 2012). The evolution of HE is time-dependent (Wang et al., 2013) as cracks require time to evolve, which can be rapid for high-strength steels during continuous exposure to hydrogen uptake and mechanical strain (Venezuela et al., 2016; Hariramabadran Anantha et al., 2019), or very slow for super duplex stainless steel (SDSS) (Zucchi et al., 2006; Chai et al., 2009; Kivisäkk, 2010). Compared to other types of stainless steels, little is known about HE of SDSSs. The interaction of absorbed hydrogen with the austenite and ferrite phases in duplex microstructures is intricate and challenging to measure. The austenite and ferrite phases have different hydrogen absorption, permeation, and interaction behaviour (Mente and Boellinghaus, 2014; Bhadeshia, 2016; Koyama et al., 2017; Barrera et al., 2018).
Hydrogen-induced microstructural degradation occurs locally on particular sites usually associated with the localization of strains and stresses (Laureys et al., 2015; Pu et al., 2019). It is the strain that finally causes a crack and develops a degradation path through the entire microstructure. So, HE has both a stochastic and deterministic character. All the mentioned characteristic aspects explain why HE remained poorly understood. Understanding these HE characters requires a continuous, time-resolved, and non-destructive measurement of the evolution of strains and stresses in the microstructure under ideally operando conditions. The high brilliance of third-generation synchrotrons facilitates measurements of such local microscopic properties under operando conditions.
Our previous works have shown that the infusion of hydrogen into SDSS microstructure under static mechanical load results in preferential strain formation in the austenite phase that showed up to an order of magnitude higher strains than the ferrite phase (Örnek et al., 2020a; Örnek et al., 2020b; Örnek et al., 2020c; Örnek et al., 2021). The strains perpendicular to the surface of a tensile specimen were up to 4–5 times higher than along the loading direction, indicating a path for hydrogen-induced microstructure degradation (Örnek et al., 2020a). During electrochemical hydrogen charging, compressive forces generated in the ferrite phase along the loading axis (Örnek et al., 2020b). The study also showed that entering hydrogen atoms can exert higher local strains in the microstructure than the externally applied macroscopic loading. It has become clear that the austenite phase absorbs most hydrogen in the duplex microstructure and supports the ferrite against HE (Örnek et al., 2020a; Örnek et al., 2020b).
Moreover, the lattice interactions of the austenite and ferrite phases with infusing hydrogen are different. For instance, the splitting of the diffraction peaks of the austenite phase was observed during the infusion of hydrogen into the lattice (Örnek et al., 2020c). The developed new peaks disappeared when the hydrogen charging was terminated, which suggested the evolution of metastable quasi-hydrides (Örnek et al., 2020c). In contrast, no phase transformation was observed in the ferrite phase, which indicates that the susceptibility to embrittlement of the ferrite phase is significantly retarded by the austenite phase that is the far more hydrogen-bearing phase in duplex microstructures (Örnek et al., 2020c). However, the root cause of HE and the reasons for the high resistance to HE of SDSS have remained not fully understood. There are still questions concerning the spatial distribution of local strain development and consequent plastic deformation in the duplex microstructure, which may lead to the initiation of cracks.
To design new SDSS materials with superior resistance against HE, it is of utmost importance to understand the interaction of hydrogen with austenite and ferrite grains. The surface is vital as it is the first contact with and continuously exposed to nascent hydrogen. The hydrogen enters the surface first and then diffuses to the subsurface, so the (near) surface region is where most degradation occurs. Therefore, it is critical to measure the temporal evolution of the strain patterns during hydrogen uptake. It is also essential to know the acting stress vectors concerning the specimen geometry and whether discrete, favoured paths of strain localization might transition to cracks. Such information would be invaluable for lifetime predictions of SDSS components in demanding applications. Thus, there must be a series of processes that precedes crack evolution. The work reported in this paper continues our studies on HE of SDSS (Örnek et al., 2018; Örnek et al., 2019; Örnek et al., 2020a; Örnek et al., 2020b; Örnek et al., 2020c). Here, we provide a comprehensive full-strain analysis in the entire microstructure of 25Cr-7Ni SDSS subjected to electrochemical hydrogen charging and static tensile loading to show the most critical paths and positions of degradation using HEXRD. We augmented our experiments with electron backscattering diffraction (EBSD) to map the plastic deformation and digital image correlation (DIC) analysis to reveal local strain development in the microstructure.
2 Experimental
The experimental details for the operando HEXRD measurements have been reported previously (Örnek et al., 2020a). Herein, we only provide a concise summary of the experimental setup, shown in Figure 1. Figure 2 defines the orientation of the sample geometry and the direction of diffracted tensors in 3D space. The SDSS investigated was UNS S32750, provided by Sandvik Materials Technology. The chemical composition (in wt.-%) was 24.9Cr, 6.9Ni, 3.87Mo, 0.77Mn, 0.6Si, 0.27N, 0.26Cu, 0.022P, 0.017C, and 0.001S. The microstructure in two cross-sections is shown in Figure 3. The average austenite spacing of the studied microstructure was ∼20 μm. The phase fraction of the ferrite (δ) and austenite (γ) phases was nearly 50:50. Tensile specimens with a gauge length of 25 mm, a gauge width of 3 mm, and a thickness of 1.5 mm were fabricated and subjected to constant tensile load using a tensile frame (Figures 1, 2). Disc springs were used to create axial flexibility to achieve a sustained level of load that was applied to the specimen. The specimen was loaded to 1.05% of mechanical tensile loading and held constant. Then, the interplanar lattice distances (d-spacings) were measured across the entire specimen thickness in 20 µm increments (steps perpendicular to the sample’s largest surface) during electrochemical charging of hydrogen (−38 mA/cm2 at room temperature). First, the sample was scanned without hydrogen charging, and then the potentiostat was switched on to charge the specimen continuously with hydrogen while XRD measurements ran simultaneously. Hence, the change in peak position (d at time >0) versus the uncharged position (d at time = 0) was calculated and denoted as lattice strain (
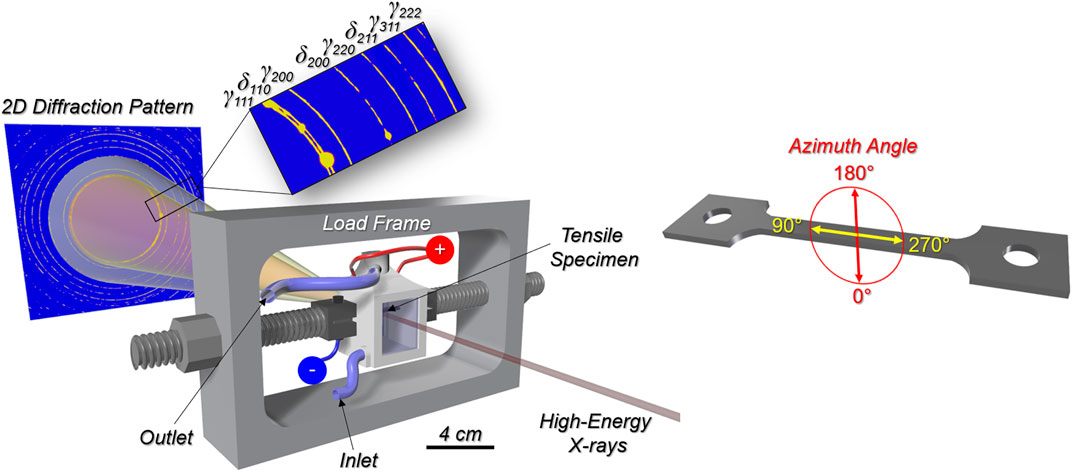
FIGURE 1. Schematic showing the experimental setup for in-situ time- and space-resolved lattice strain measurements using synchrotron high-energy x-ray diffraction. The angles on the tensile specimen indicate the azimuth directions for the strain information.
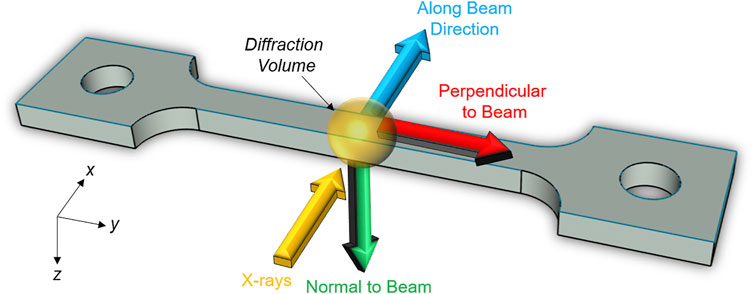
FIGURE 2. Schematic illustration showing the direction of the x-rays and the diffraction tensors along the beam direction (x), perpendicular to the beam (y), and normal to the beam (z). These definitions apply to diffraction and DIC analyses.

FIGURE 3. Images showing the microstructure along the transverse and longitudinal cross-sections. The ferrite phase (δ) is the matrix, whereas the austenite phase (γ) is embedded as islands in the ferrite matrix. The rolling direction is along the horizontal axis in the bottom two micrographs (longitudinal).
Further laboratory tensile strain measurements with the same sample geometry were conducted under a HIROX digital microscope for local strain analysis (Figures 4, 5). First, specimens were polished down to 1 µm using a diamond slurry finish and then etched in 10 wt.-% oxalic acid (5 V) for 15 s and then 40 wt.-% KOH (5 V) for a few seconds to stain the ferrite phase. The gentle etching treatment was done to obtain micrographs that the DIC software can evaluate. Next, the tensile specimens were elongated using the DEBEN micro-tensile tester with a constant displacement rate of 0.05 mm/min (strain rate = 3.33 10−5 s−1). The force and elongation values were recorded with two points per second. The force reading was ± 1 N accurate, while the strain readout of the extensometer was 1–2% accurate. At the same time, micrographs from the surface were taken with 20 s time intervals with the HIROX RH-2000 digital microscope (Figure 5), which enables image recording with a long focal range to sustain all-in-focus of the entire surface during the elongation experiment. The images were taken with 200x magnification corresponding to a field of view of 1795 µm. The pixel resolution was 1,920 × 1,200, corresponding to 0.93 µm/pixel. Topography changes along the surface plane (x-y) and the vertical (z) direction were recorded with full-focus control. The tensile specimens were pre-charged with hydrogen for 10 h, and the surface was imaged in 20 s time interval until rupture of the samples. The electrochemical hydrogen charging was done in a beaker of 200 ml of 0.01 M NaCl solution at room temperature for 10 h, using a platinum-mesh counter electrode and a constant current density of −38 mA/cm2. Outside of the gauge length area of the specimens were masked with an epoxy-beeswax resin (all four faces of the sample) to limit the hydrogen uptake to the gauge area. The elongation experiment began within 30 min upon the termination of the hydrogen charging.
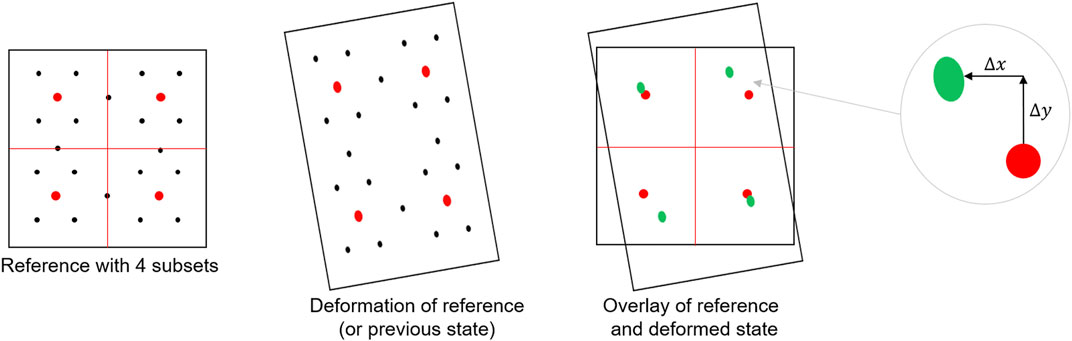
FIGURE 4. Schematic illustration of the principles of Digital Image Correlation. A reference pattern (microstructure) is divided into subsets (here four for the sake of clarity) and defined as the undeformed state. Then, the reference deforms and becomes the deformed state. The subsets also exist in the deformed state (not shown). Each pattern (any feature) has x and y coordinates and an intensity. The two states are correlated, and the difference of all patterns is calculated.
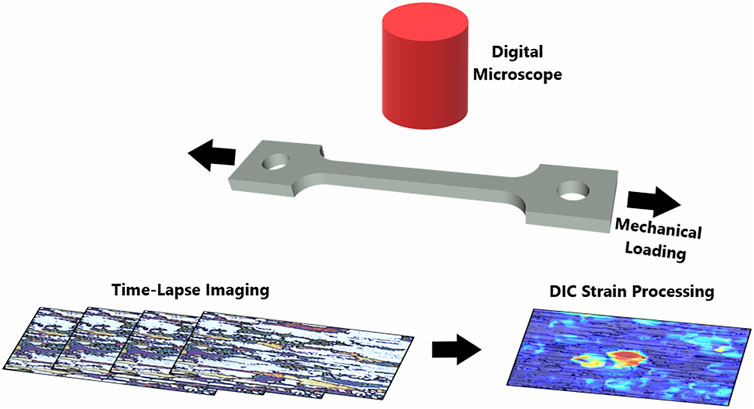
FIGURE 5. Schematic illustrating the experimental setup for in-situ imaging of the microstructure in time-lapse during mechanical loading of the tensile specimen. Then, the images are transferred to digital image correlation software for the computation of local strain development. Using a digital microscope with an extended focus range enables imaging with constant all-in-focus over the entire elongation experiment.
The recorded micrographs were transferred to the LaVision StrainMaster DIC software V1.6.0 for image processing. The recorded micrographs were used as a virtual strain gauge, and the natural strains were calculated. The result of DIC computation is a displacement field from which a deformation gradient can be calculated. The basic concept of Digital Image Correlation will be later explained. The processing details were optimized using various subset sizes (interrogation windows), as reported previously (Örnek and Engelberg, 2016b). We performed the analysis with a subset size of 17 × 17 pixels with a step size of 5 pixels. Sum of differential was chosen as the correlation mode with default settings. The threshold for a correlation value was 0.5. This approach was deemed optimum to achieve high spatial resolution and low background noise. A post-processing filter of level 7 was applied in the software to smooth out strain uncertainties. All calculations run successfully with no errors. The background noise strain varied between 0.1–0.5% defining the uncertainty of reported (micro-)strain values, with an average noise strain of 0.3%. The uncertainty depended on the local pattern quality. The background noise is not cumulative; hence, these can be neglected if the actual strain values are high. The von Mises strains were calculated with the engineering strain tensor mode.
The Basic Concept of Digital Image Correlation—Figure 4 shall be considered. A reference pattern with distinctive features (the microstructure) is subdivided into subsets (here four) used to calculate the local deformation when the reference state changes shape. Each element has unique x, y, and intensity information to correlate the two deformation states. Any change in the subset coordinates indicates translations between the two states. The deformation can be expressed by changes along with the x and y directions if the deformation is small and perpendicular to the optical axis of the camera (Muniandy, 2019):
where
The strains are calculated by obtaining the partial derivates (differentiating) of the displacement gradients
3 Results and Discussion
3.1 In-situ High-Energy X-Ray Diffraction
Figure 6 summarizes the lattice strain evolution in the austenite (Figure 6A) and ferrite (Figure 6B) phases. The 3D polar strain plots show the strain formation as a function of the azimuth angles, position in the specimen (depth), and time of hydrogen charging. Considerable strain development occurred in the near-surface region, with the strains being highest perpendicular to the loading direction. The austenite phase showed higher strain evolution than the ferrite phase, in line with our previous reports (Örnek et al., 2020a; Örnek et al., 2020b). However, the bulk ferritic grains in the subsurface were more deformed than austenite grains. The bulk grains of both phases underwent high tensile and compressive deformation depending on the position in the specimen. The data suggests that some grains underwent expansion while others shrank, resulting from grain-grain interactions depending on grain geometry, size, and orientation. It seems that the strain variation within bulk ferritic grains was more significant than bulk austenitic grains. Hence, the interaction of hydrogen with the microstructure is not restricted to the surface, and the bulk may also suffer from hydrogen-induced degradation.
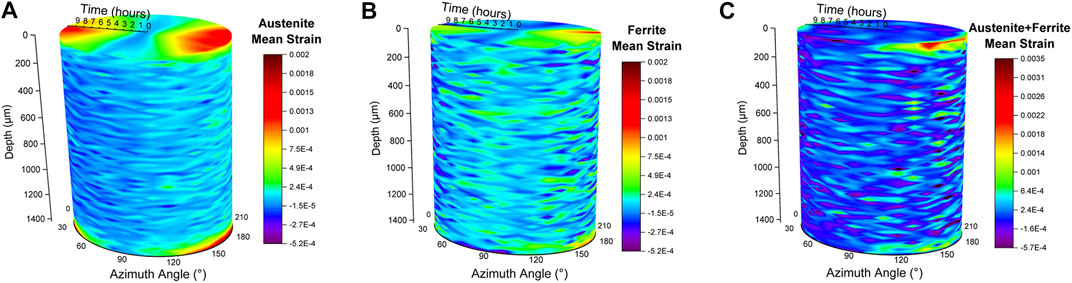
FIGURE 6. 3-D polar strain plot showing the lattice strain development as a function of time (the centre is t = 0) of hydrogen charging at different depth (the top is the surface, depth = 0) regions along with the azimuth angles in (A) the austenite phase, (B) the ferrite phase, and (C) the sum of the strains in the ferrite and austenite phases.
HE is usually understood as a surface problem as the hydrogen first enters and can produce cracks in the surface. However, HE cracks within steels without surface cracks have also been reported (Popov et al., 2018). Hydrogen can penetrate the microstructure more rapidly through grain boundaries when it acts as a surfactant, creating microcracks within the steel due to surface energy decrease at the grain boundaries (Popov et al., 2018). The hydrogen atoms can conglomerate and recombine, becoming hydrogen molecules, reasoning internal cracking. It has, however, remained unclear whether the hydrogen atoms can behave as surfactants in duplex stainless steel (DSS). Grain boundaries in DSS may not be susceptible sites to crack formation since grain boundaries, particularly interphase boundaries, may act as strong trap sites for hydrogen, reducing the resistance to HE. Therefore, finely-grained microstructures typically outperform coarse ones, explained by trapping and elongated diffusion path due to a larger tortuosity (Woollin and Gregori, 2004; Chai et al., 2009; Bahrami and Woollin, 2010; Kivisäkk, 2010; Kivisäkk and Ciurea, 2011; Sofia Hazarabedian et al., 2019). Plastic deformation typically preludes crack formation, and therefore intensified deformation in the microstructure can be understood as the most incipient degradation stage in DSS.
The strain evolution in the near-surface region in the austenite phase was more extensive than ferrite. The ferrite also developed tensile strains with lower magnitudes when the austenite underwent tensile deformation. The strain evolution 300 µm below the surface showed an erratic changing of the nature of deformation (tensile to compressive and vice versa). When the ferrite was tensile, compressive strains formed in the austenite, suggesting that the strain evolution was of compensating nature. This observation is made more evident in the 3-D strain plot depicted in Figure 6C, which shows strain development in the austenite and ferrite phases together (sum of the strains in both phases). The compensating nature of the strain evolution may explain the superior resistance to HE of the SDSS. The tensile strain evolution in a phase is retarded by compressive forces developing in the other neighbouring phase. In such a way, the duplex microstructure can withstand large strains.
The strain localization in the microstructure cannot be reasoned with the local accumulation of hydrogen only. The surface has the most hydrogen, and the austenite phase dissolves most of the hydrogen compared to the ferrite phase; therefore, undergoing severe deformation. The evolution of strains in the near-surface region produces stresses which must be compensated in adjacent areas, i.e., the subsurface. The compensated strains or stresses must be of opposite sign; when the grains in the surface become under tension, those in the subsurface should experience compression. However, the studied duplex microstructure is not trivial. There are grains with different crystallographic structures, orientation, size, and morphology, influencing strain formation. Since the austenite deforms more than the ferrite in near-surface regions, the ferrite grains partly compensate for the formed strains. The remaining uncompensated deformations are balanced by all grains in the subsurface. The strain compensation may not be of the same tensor direction; i.e., strains formed along a specific azimuthal angle may not be parallel to the compensated in another site. The HEXRD analysis revealed a complicated strain evolution pattern changing with position, azimuthal angle, and phase in the steel.
The measured data are shown in some selected polar strain plots to perceive better the discussed points (Figures 7, 8). These figures show the strain evolution (a,b,c) in the near-surface region (denoted as 0 µm) and in the regions below the surface at depths of (d,e,f) 20 µm, (g,h,i) 300 µm, and (j,k,l) 700 µm for the austenite and ferrite phases, respectively. The strain evolution was, in general, anisotropic in both phases. There is an anisotropic strain pattern, and it was more pronounced in the austenite grains (Figure 7). It should be noted that the diffraction patterns were non-symmetric along with the azimuth angles (0/180°), which may be reasoned by the different beam-interaction volume at the surface as compared to the subsurfaces. The diffracted beam at the bottom half of the detector had to pass more material than the beam at the top, leading to differences in absorption and thus the asymmetry. The near-surface region showed the highest magnitude of strain formation. The strains in the near-surface were predominantly tensile and were 4–5 times higher in the austenite phase than in the ferrite phase. Most tensile deformation developed perpendicular to the surface (i.e., 0° and 180°), showing the more susceptible path of hydrogen-induced material degradation, extending to approximately 80 µm beneath the surface after 9 h of hydrogen charging. The surface is the first place of contact with hydrogen. The austenite phase absorbs far more hydrogen than the ferrite phase and undergoes, therefore, more deformation. We measured the strain evolution along two principal directions, i.e., in loading direction and perpendicular. The strain tensor and the beam axis are missing, i.e., perpendicular to the loading axis but parallel to the surface. Some compensating strains may also develop there.
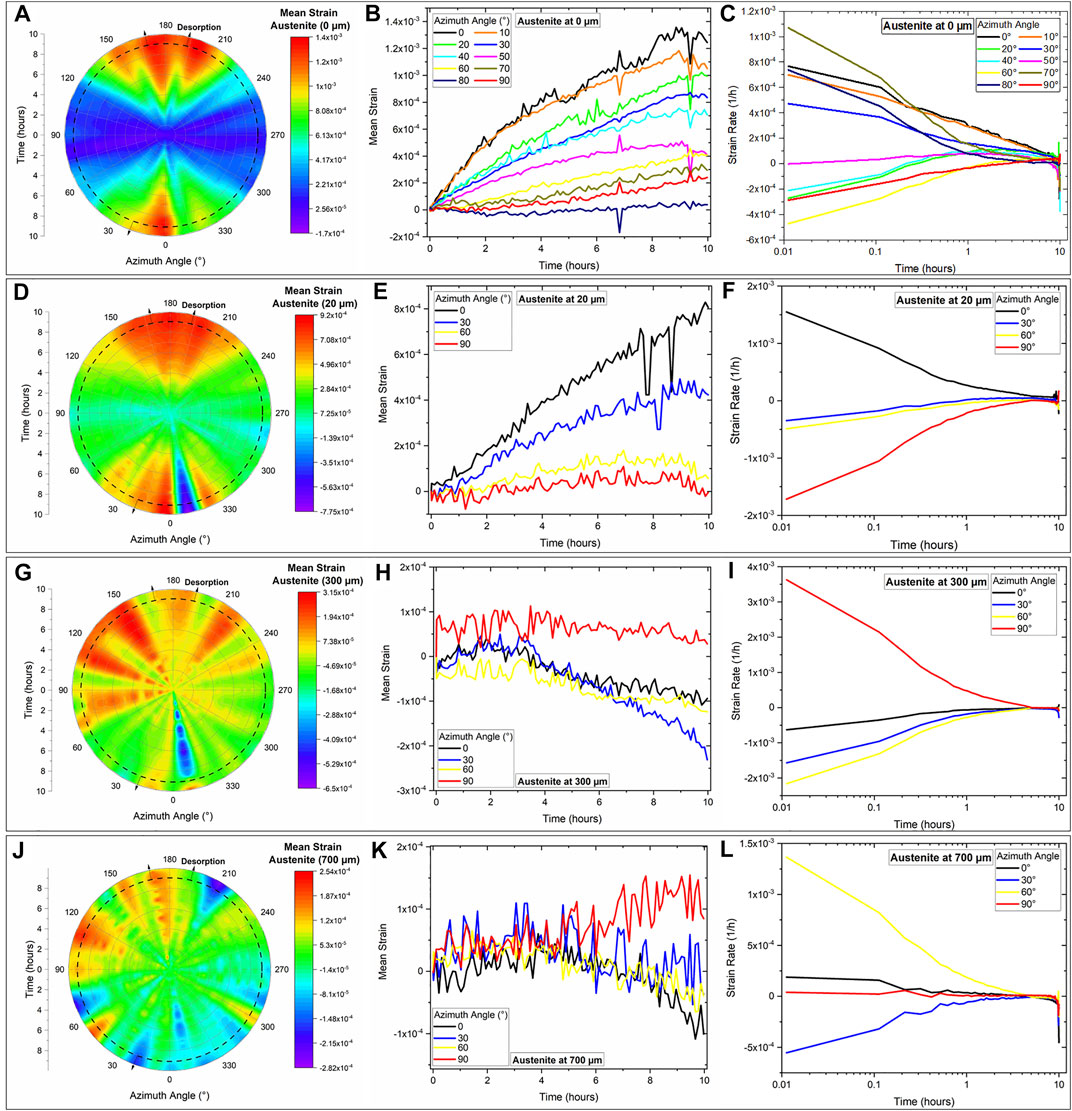
FIGURE 7. 3-D polar strain plots (A,D,G,J) with extracted strain vs. time (B,E,H,K) and temporal derivative of strain (strain rate) vs. time (C,F,I,L) plots of the austenite phase, showing the lattice strain development as a function of time of hydrogen charging at different depth regions: (A–C) at the surface, (D–F) at 20 µm, (G–I) 300 µm, and (J–L) 700 µm below the surface. The radial axis shows the time (the centre is t = 0), and the angular axis is the azimuth angle. The profiles in (B,E,H,K) show the strain evolution over selected azimuth angles. Note that the data along 350° is less reliable due to the beam-stop mount, which was masked out for data integration but might affect the data.
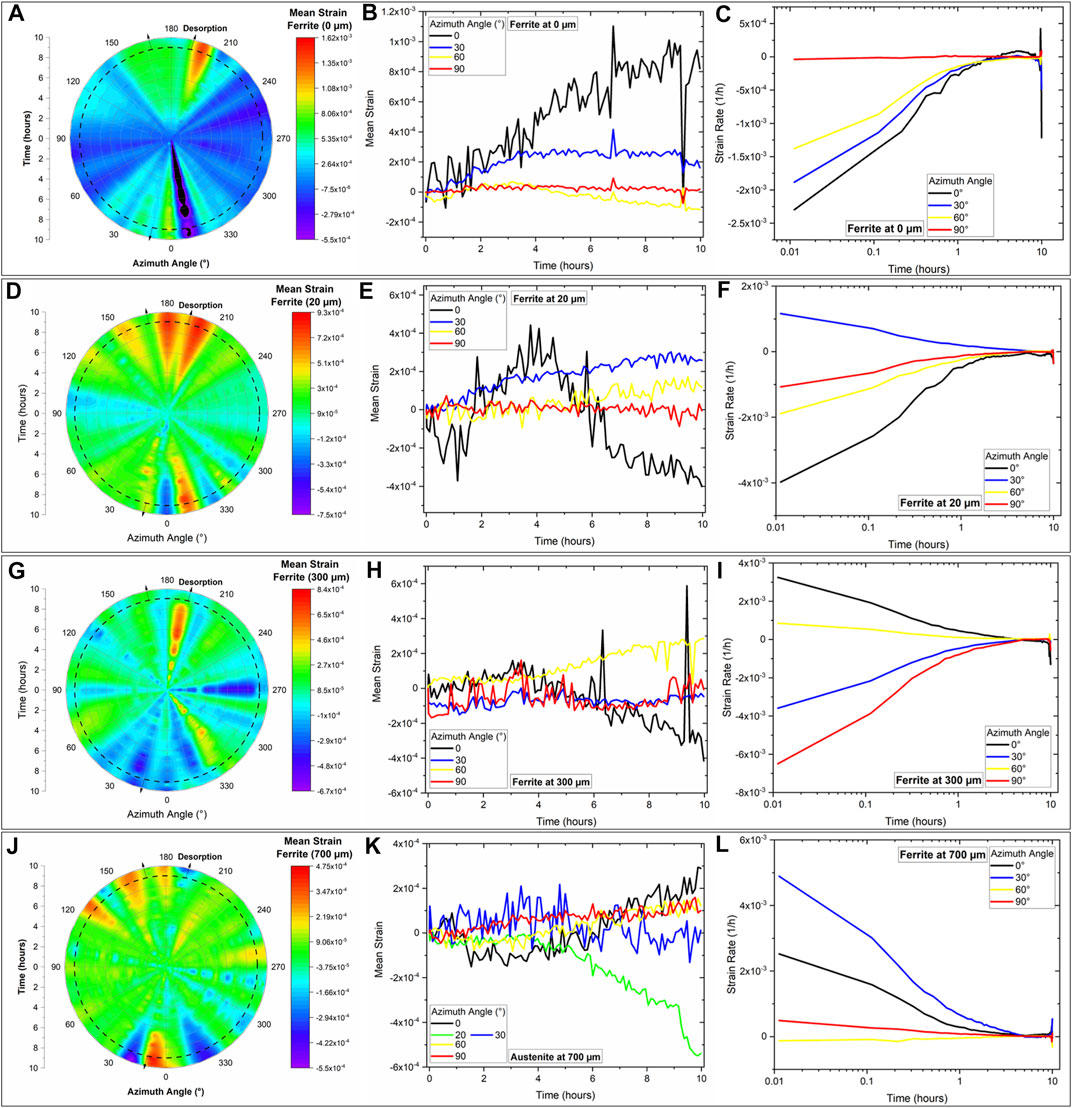
FIGURE 8. 3-D polar strain plots of the ferrite phase showing the lattice strain development as a function of time of hydrogen charging at different depth regions: (A–C) at the surface, (D–F) at 20 µm, (G–I) 300 µm, and (J–L) 700 µm below the surface. The radial axis shows the time (the centre is t = 0), and the angular axis is the azimuth angle. The profiles in (B,E,H,K) show the strain evolution over selected azimuth angles. Note that the data along 350° is less reliable due to the beam-stop mount, which was masked for data integration but might affect the data.
Another critical observation is the temporal strain evolution derived by the temporal derivative from the measured strain data, plotted against the logarithm of charging time (Figures 7, 8). It was seen that the hydrogen-induced strain rate was dependent on the position in the sample and the phase of the microstructure. The selected strain-time profiles shown in Figure 7 (austenite) and Figure 8 (ferrite) show an uneven strain development with time. The strain rates in both phases also depended on the azimuth angle and position in the microstructure. Interestingly, some sub-surface regions deformed faster than near-surface sites. The strain rate evolution was highly complex, indicating that grain geometries influence the strain evolution at macroscopic and microscopic scales. Hydrogen diffuses by 4–5 orders of magnitude faster in the ferrite than in the austenite. So, the hydrogen atoms can quickly diffuse to deeper ferritic sites in the microstructure. The sub-surface austenite grains showed an order of magnitude lower strain rates than those obtained for the near-surface grains, suggesting that the hydrogen concentration gradient in the austenite phase in the near-surface region was higher than in the ferrite phase. Our results showed that the interaction kinetics of hydrogen with the lattice of the ferrite and austenite phases occur with different rates depending on the position in the sample, which can result in negative or positive strain rates. Hence, the strain rate dependency must be related to the (local) hydrogen concentration that is one order of magnitude higher in the austenite phase than in the ferrite phase. The temporal strain development requires further analysis, which is beyond the scope of the work reported herein.
The HEXRD results indicate that the austenite phase accommodates most of the absorbed hydrogen and hydrogen-induced strains. The results also demonstrate the superior loading capacity of the austenite phase to the ferrite phase, which is beneficial for the resistance to HE. Furthermore, the austenite phase remained far more ductile than the ferrite, supporting the ferrite against hydrogen-induced deformation. So, the performance of the austenite phase in SDSS is essential and probably lifetime-determining. Insufficient hydrogen absorption capacity or failure of the austenite phase would ultimately result in an excessive mechanical burden on the ferrite phase. The cracking of either phase in the duplex microstructure –not observed in this work– would imply the degradation of the other phase because the latter phase would have been insufficient in providing support against cracking. Typically, cracks initiate in ferrite grains in coarse duplex microstructures (>30 µm austenite spacing) (Byrne et al., 2016; Sofia Hazarabedian et al., 2019). The ferrite is thus considered as the more susceptible phase (Byrne et al., 2016; Sofia Hazarabedian et al., 2019). Ferritic lattices become rapidly brittle during hydrogen uptake (Chai et al., 2009; Bak et al., 2016; Venezuela et al., 2016; Örnek et al., 2018). However, the failure of the ferritic phase also depends on the second (austenitic) phase and the microstructure, for example, the austenite spacing (mean distance between austenite grains), phase fractions, and grain elongation, etc.
We estimated the amount of hydrogen in the microstructure by considering that 1% of the applied current led to effective hydrogen absorption. Hydrogen in near-neutral solutions is formed by reducing water to atomic hydrogen and hydroxide molecule anions (Grozovski et al., 2017; Örnek et al., 2019). This reaction has one stoichiometry, so a single electron is needed to liberate one hydrogen atom (Grozovski et al., 2017). Most of the produced hydrogen recombines and leaves the surface in the form of gas. With −38 mA/cm2 of charging current density over 9 days and charging efficiency of 1%, about 140 C of charge was approximately associated with hydrogen absorbed by the microstructure. The reciprocal of the elementary unit of charge gives the number of elementary charges related to 1 C, which results in approximately 1021 elementary charges. The quotient of the elementary charge and the Avogadro’s number gives the concentration of uptaken hydrogen, which is ∼10−2 M (100 ppm). This is the total amount of entered hydrogen into the lattices of both ferrite and austenite phases. It should be noted that super duplex stainless steel does not effectively trap hydrogen at room temperature, and therefore all absorbed hydrogen can be considered as diffusible hydrogen. We understand trapping as those absorbed hydrogen atoms that are immobilised at a given environmental condition (temperature, pressure, stress, etc.). In earlier work, we have shown by operando and time-resolved grazing-incidence x-ray diffraction measurements that hydrogen absorption in studied super duplex stainless steel is a reversible process (Örnek et al., 2020b). Entering hydrogen atoms into the microstructure effuses once the charging process is terminated (Örnek et al., 2020b). So, the absorbed hydrogen atoms are diffusible, and it is the time of desorption that matters to allow the hydrogen atoms to effuse from the microstructure. Since the diffusion kinetics are orders of magnitude slower in the austenite phase than in the ferrite phase, the effusion rates are likewise far slower in the austenite phase. So, it may take weeks or even months for the absorbed hydrogen atoms to desorb from the austenite phase, whereas the desorption process in the ferrite phase may only take some days. The strains in the near-surface were far more anisotropic than those formed in sub-surface regions. This is because the lattice in the near-surface area is more straightforward to relax than the bulk lattice, and hydrogen accumulation is more in the surface region than in bulk. There is probably a time- and strain-rate effect in the deformation of the phases that may explain the extent and difference of strain anisotropy of the austenite and ferrite phases. The surface deforms first and most; hence, the anisotropy is most pronounced on near-surface grains. Furthermore, the surface grains have fewer mechanical constraints as bulk grains are always surrounded in all directions by other grains and depend on neighbouring grains’ deformation behaviour. On the other hand, the austenite grains deep in bulk require more time as the hydrogen has to permeate through the ferrite from which it can be transmitted to the austenite.
In contrast, the absorption of hydrogen atoms into the lattice of ferrite and austenite grains and their interactions with the microstructure is rapid (seconds) on the outermost surface (Örnek et al., 2020b). The deformation in the sub-surface must occur first in the ferrite as the hydrogen atoms can enter the austenite grains only when the ferrite grains allow inter-diffusion of hydrogen. The ferrite is the matrix and is the only phase that provides a continuous permeation path for the hydrogen atoms. The infusion of hydrogen in the bulk microstructure is determined by the diffusion of hydrogen atoms transmitted from the ferrite phase. So, while the deformation occurs first on austenite grains in the near-surface, bulk austenitic grains deform after ferritic grains. Hence, the nature of lattice deformation is complex, which possibly explains the alternating deformation behaviour throughout the thickness and the azimuth angles.
3.2 Post-Mortem EBSD Characterization
Post-mortem EBSD characterization of the cross-sectioned microstructure revealed numerous sites of strain localization (local misorientation) of austenitic grains near the surface, indicating that plastic deformation occurred (Figure 9).
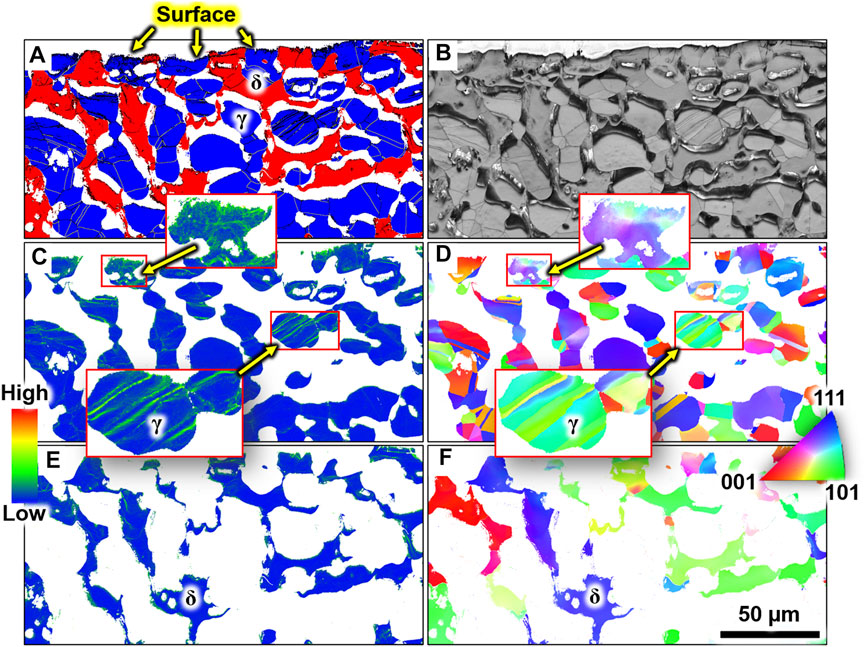
FIGURE 9. Post-mortem EBSD microstructure analysis after exposure to cathodic hydrogen charging, showing the maps of (A) phase, (B) band contrast, (C) local misorientation of the austenite, (D) inverse pole figure in the normal direction of the austenite (perpendicular to the rolling direction and tensile loading axis), (E) local misorientation of the ferrite, and (F) the inverse pole figure in the normal direction of the ferrite. The ESBD map was acquired from the edge of the tensile specimen (i.e., the exposed surface to hydrogen uptake) that was cut along the transverse direction of the sample. Hydrogen infusion occurred from the top periphery of the maps showing high strain localization, particularly for the austenite. The austenite grains were highly deformed up to 80 µm below the surface. The scale bar in (F) applies to all maps. The tensile loading axis was along the horizontal axis. The white background in (A) shows non-indexed regions while black lines show low- and high-angle grain boundaries.
The sub-grain boundaries (lines inside grains, Figure 9A) were the positions with the most strain formation, indicating the most susceptible sites of hydrogen uptake and interaction. The ferrite, in contrast, showed no apparent signs of plastic deformation in the near-surface region. However, ferrite grains deep in the bulk microstructure (sub-surface) showed signs of plastic deformation, as evident from the localized strain sites shown in Figure 10. Interestingly, the strain localization was not related to sub-grain boundaries. The austenite in sub-surface areas showed no signs of plastic deformation. The EBSD data show only irreversible deformation remaining after the termination of the hydrogen charging and destruction of the material. Earlier work shows that most hydrogen-induced strain evolution is elastic and reversible (Örnek et al., 2020b; Örnek et al., 2020c). Diffraction measurements only reveal distortion of the crystal lattice, meaning some plastic deformation may have remained undetected. The combined HEXRD and EBSD results provide comprehensive information on reversible and irreversible lattice deformation and microstructure degradation during and after the hydrogen charging. The residual strain evolution induced by hydrogen infusion seemingly causes minor microstructure deformation. However, it may be detrimental since HE (loss of toughness) does not necessarily need large deformation.
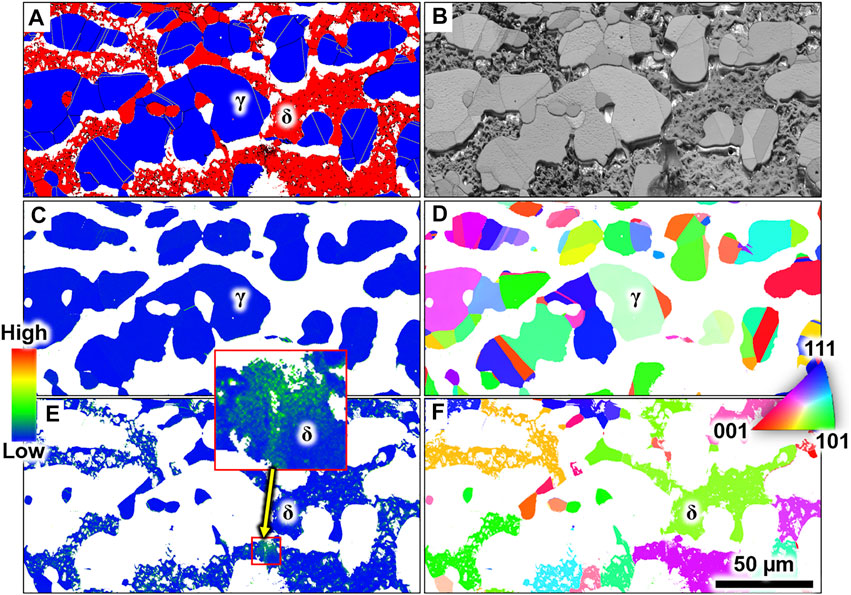
FIGURE 10. Post-mortem EBSD microstructure analysis after exposure to cathodic hydrogen charging, showing the maps of (A) phase, (B) band contrast, (C) local misorientation of the austenite, (D) inverse pole figure in the normal direction of the austenite (perpendicular to the rolling direction and tensile loading axis), (E) local misorientation of the ferrite, and (F) the inverse pole figure in the normal direction of the ferrite. The ESBD map was acquired from the centre of the specimen (approximately 700–800 µm away from the surface) that was cut along the transverse direction of the tensile specimen. Hydrogen infusion occurred from all sides of the maps showing some strain localization for the ferrite only. The scale bar in (F) applies to all maps. The tensile loading axis was along the horizontal axis. The white background in (A) shows non-indexed regions while black lines show low- and high-angle grain boundaries.
The hydrogen concentration is maximum at near-surface grains; therefore, the nascent hydrogen-microstructure interactions occur at near-surface regions. Dissolved hydrogen reduces the energies for generating dislocations and kinks, resulting in plastic deformation, apparent from the high local misorientation in the EBSD maps (Kirchheim, 2010). Hydrogen-induced deformation at the surface occurred more pronounced in the austenite phase, as confirmed in our in-situ HEXRD results shown above. Thus, the austenite phase is more prone to hydrogen-microstructure interactions in near-surface regions than the ferrite phase. Deep in bulk, dissolved hydrogen caused far fewer microstructural alterations than near-surface areas. The ferrite showed more plastic strain evolution, while the austenite deep in bulk sites probably did not undergo detectable plastic deformation. The hydrogen is more rapidly uptaken by the ferrite than the austenite, explaining the strain heterogeneity, and the above-explained stress compensation may further reason it. Further studies are needed to elucidate the site-specific strain evolution in SDSS.
Interestingly, only large ferrite grains showed high local misorientation. This is because the ferrite phase in bulk regions saturates before the austenite phase. Furthermore, the ferrite phase is the source of hydrogen for the austenite phase. Most of the hydrogen is delivered by the ferrite, and the phase tortuosity of the ferrite in the microstructure reduces the effective diffusivity of the hydrogen (longer path). Therefore, hydrogen accumulates at the interphase boundaries, and hydrogen uptake by the austenite phase proceeds as the rate-determining step. Large ferrite grains have fewer boundaries with neighbouring austenite grains for hydrogen transfer. Hence, more hydrogen will be piled up at interphase boundaries with large ferrite grains. So, increased hydrogen concentration can cause local deformation, which may explain our EBSD findings.
3.3 Stress-Strain Behaviour
The stress-strain curves obtained from the tensile testing of the specimens without and with pre-hydrogen charging for 10 h are displayed in Figure 11.
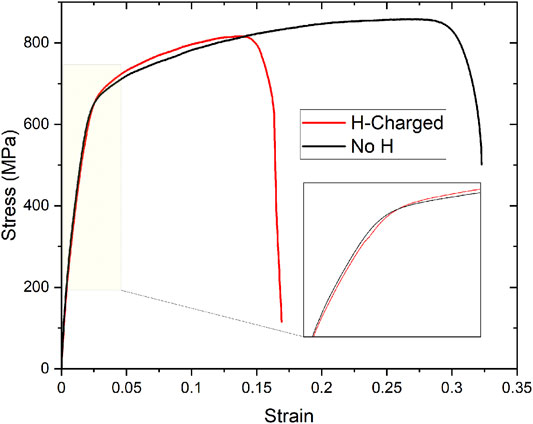
FIGURE 11. Stress-strain behaviour of the tested super duplex stainless steel without and with pre-hydrogen charging for 10 h with −38 mA/cm2.
The hydrogen charging caused a significant reduction of ductility and toughness, hence HE. Furthermore, the hydrogen charging caused a hardening of the entire microstructure apparent from the higher yield point. Seemingly, dissolved hydrogen in the microstructure caused some microyielding, as evident from higher strains at the same stresses before the onset of macroscopic yielding (transition from elastic to plastic deformation).
3.4 Microstructural Change Associated With Hydrogen Charging and Tensile Deformation
The microstructures with pre-hydrogen charging before and after mechanical elongation are shown in Figure 12.

FIGURE 12. Optical micrographs showing the surface of the tensile specimen that was charged with hydrogen for 10 h with −38 mA/cm2 (left) and then strained until catastrophic failure (right). Note that blister cracks (indicated by the arrows) developed in the ferrite phase (left) after 10 h of hydrogen charging before the elongation experiment. In addition, numerous secondary cracks developed primarily in the ferrite phase after mechanical elongation (right).
The hydrogen charging for 10 h resulted in hydrogen-induced surface blister cracks in the ferrite phase. Due to excessive hydrogen uptake, blister cracks are typical for the ferrite phase (Örnek et al., 2018). The hydrogen is supersaturated in the near-surface during continuous hydrogen absorption. Vacancies and voids are formed, which favour gas evolution, and when the partial pressure of hydrogen exceeds the local yield strength, surface blister cracks evolve. Hydrogen-induced blister cracks are technologically irrelevant as these occur under extreme conditions which cathodically protected materials usually do not encounter. This experiment aims to understand and measure the hydrogen-induced damage on the microstructure on a reasonable laboratory time scale since DSS’s are highly resistant materials. Therefore, the damage incurred on the ferrite and austenite phases is meaningful in this context.
The surface after the elongation experiment showed numerous secondary cracks next to the ruptured area, with micro-cracks initiated along the sample edges, indicating HE (Figure 12). It seems that hydrogen embrittlement occurs only when the microstructure is (nearly) saturated with hydrogen. This information is crucial as the lifetime of a service component depends on how much and how fast the material absorbs hydrogen. It is a matter of the load capacity of a material to resist embrittlement. When the microstructure cannot bear strain energy anymore, it will fail. Absorbing hydrogen weakens the microstructure and reduces the strain bearing capacity. The ferrite phase fails if the austenite phase can no longer support the ferrite phase against hydrogen uptake. Most of the cracks were formed in the ferrite phase propagating through austenitic grains. Some cracks were arrested or deviated when they encountered austenitic grains.
3.5 Digital Image Correlation Analysis
The recorded optical images were processed using DIC software, and von Mises, Eyy (perpendicular to the loading axis), Exx (along with the loading axis) strain maps were produced. Figure 13 shows the strain evolution in the microstructure without hydrogen charging, with Supplementary Video S1 summarizing all von Mises strain formation. The von Mises strain is a value used to determine if a given material will yield and is always positive (von Mises, 1913). The von Mises yield criterion, also known as the maximum distortion criterion, states that yielding a ductile material begins when the second invariant of deviatoric stress reaches a critical value (von Mises, 1913). Hence, the von Mises strains show plastic strain formation in the microstructure. Figure 13 contrasts the strains formed at 36 MPa (on the left-hand side) and 753 MPa (on the right-hand side), indicating elastic and elastic-plastic deformation. The results show that most strain evolution occurs in the austenite phase in line with the HEXRD results shown above.
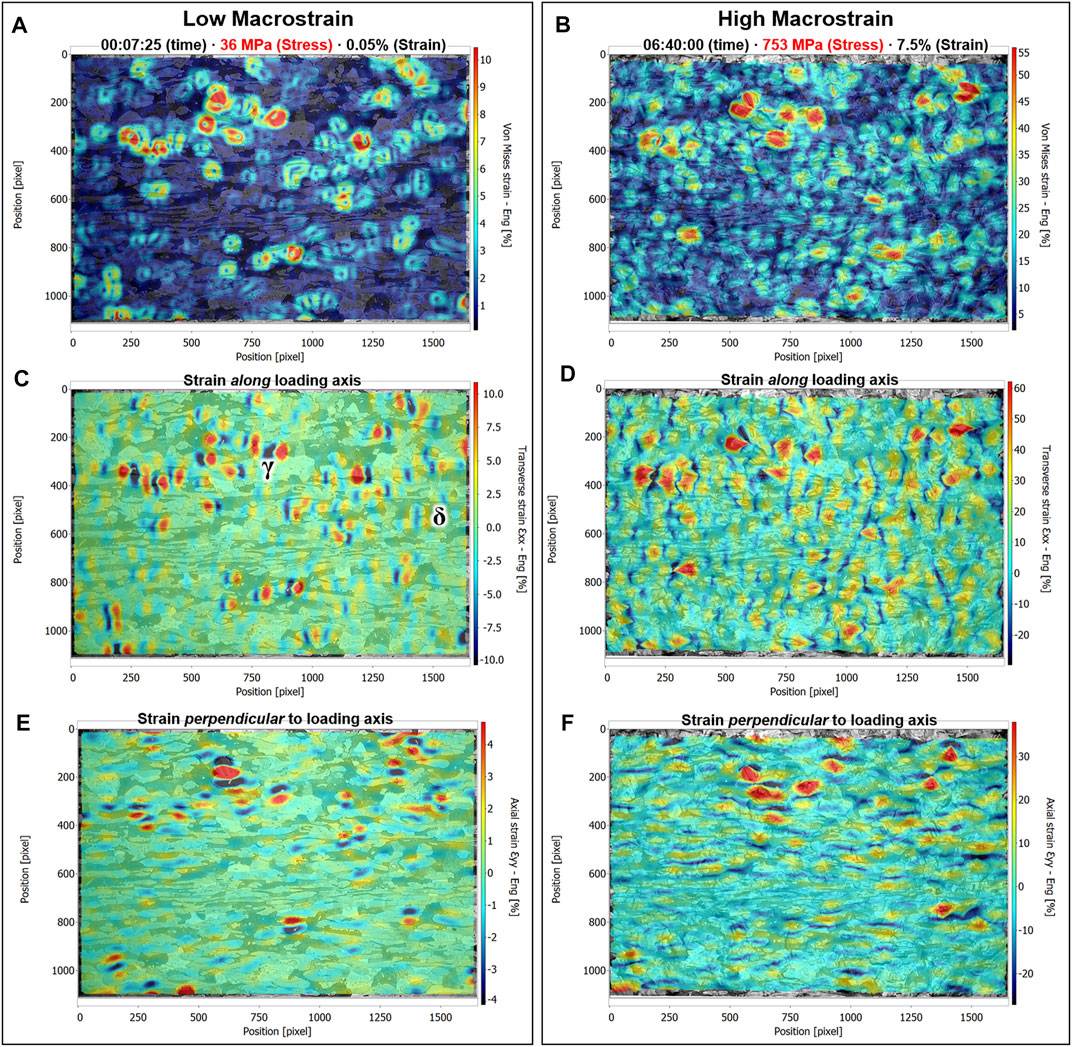
FIGURE 13. DIC analysis results showing (A,B) the von Mises microstrain evolution, (C,D) the strain evolution along the loading axis, (E,F) the strain evolution perpendicular to the loading axis during mechanical elongation of the microstructure without hydrogen charging. The maps in (A,C,E) show strain evolution for applied low stress (36 MPa), and those in (B,D,F) show the progressed deformation after plastic deformation (753 MPa). Note the microstructure behind the strain maps showing austenite and ferrite grains in contrast. The loading axis is directed to the horizontal of the images. The time format above each figure shows the elapsed time during the mechanical elongation experiment in hours:minutes:seconds for all figures below. The stress given in MPa indicates the applied stress with the tester. The strain value on top of the figures shows the macroscopic strain measured by the tester’s extensometer.
Tensile and compressive strains developed primarily in austenitic grains. The hydrogen uptake led to the discretization of the local strain evolution in the microstructure. The DIC analysis supports the synchrotron diffraction data confirming that most strain evolution occurs in the austenite phase in the surface region. Hence, the austenite phase undergoes softening while the ferrite phase hardens as fewer strains develop in the ferrite phase. Despite the higher hydrogen uptake in the lattice, the austenite phase softens, in line with the tensile test results shown in Figure 11. Tehranchi et al. explained the softening mechanism via theoretical calculations by reducing the misfit strains in the lattice (Tehranchi et al., 2017). Vacancies can bind hydrogen, and thereby the lattice misfit strains can reach nearly zero values, which increases the dislocation activities; hence, plastic deformation becomes favoured.
The Exx strains (along the loading axis) were double than the Eyy strains (perpendicular to the loading axis). The strain formation is highly discretized in the microstructure, primarily concentrated on austenitic grains. There is a regular pattern of tensile and compressive strains next to each formed along the x and y directions. The compressive strains were usually lower than the tensile ones—the compressive and tensile forces developed in both phases showed no clear correlation with any phase. The strains developed in the microstructure with pre-charged hydrogen is summarized in Supplementary Video S2, with Figure 14 showing two excerpts at 36 and 753 MPa, respectively. Absorbed hydrogen hardened the microstructure as shown in Figure 11, and the strains became more localized than the microstructure without absorbed hydrogen. The microstructure became more resistant to deformation at the same magnitude of applied stress. Hence, hydrogen improved the resistance against deformations strains with the expense of toughness loss due to hydrogen-induced hardening (Figure 15). The strain hotspots developed more readily on austenite grains and around them, indicating softening.
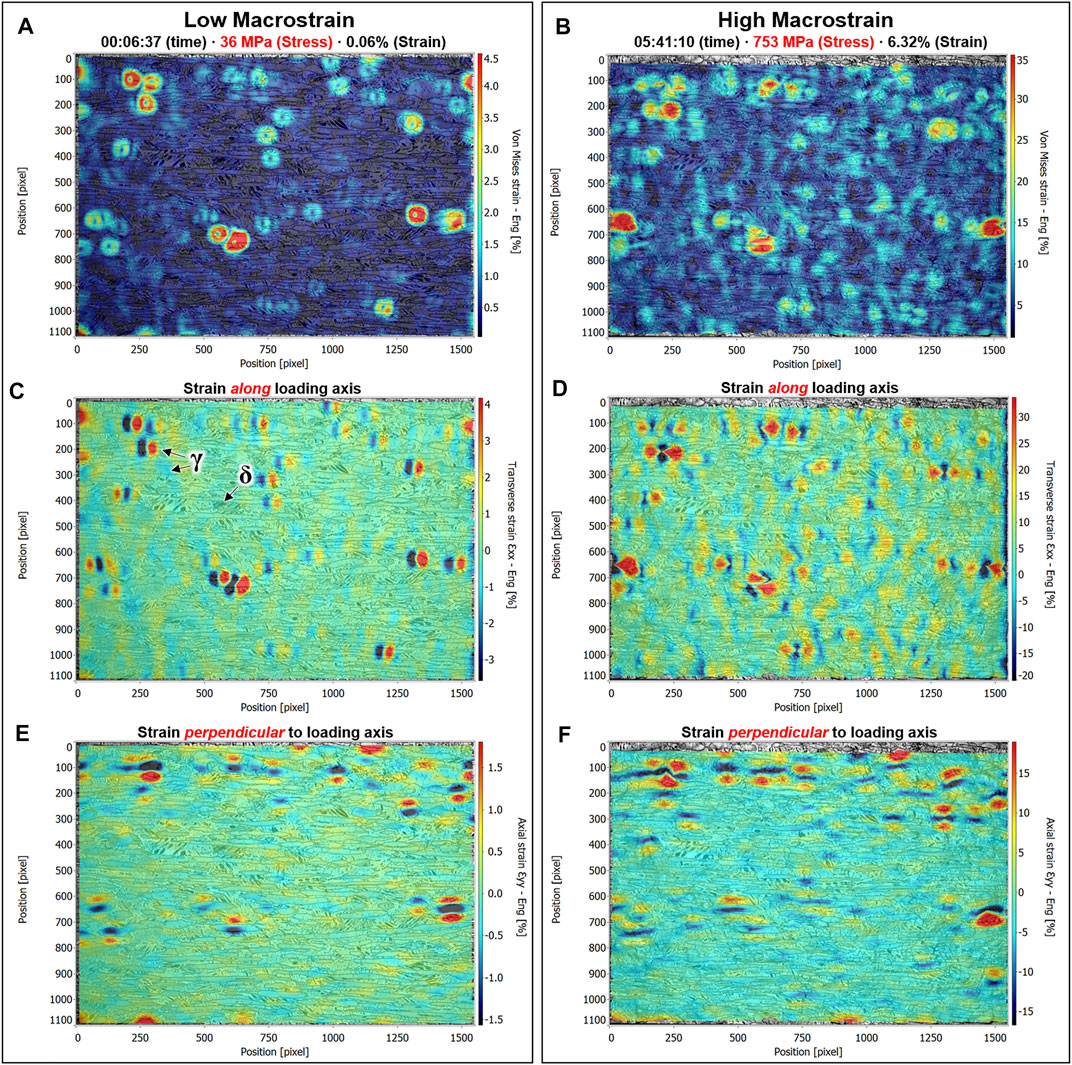
FIGURE 14. DIC analysis results showing (A,B) the von Mises microstrain evolution, (C,D) the strain evolution along the loading axis, (E,F) the strain evolution perpendicular to the loading axis during mechanical elongation of the microstructure with hydrogen charging. The maps in (A,C,E) show strain evolution for applied low stress (36 MPa), and those in (B,D,F) show the progressed deformation after plastic deformation (753 MPa). Note the microstructure behind the strain maps showing austenite and ferrite grains in contrast. The loading axis is directed to the horizontal of the images. The time format above each figure shows the elapsed time during the mechanical elongation experiment in hours:minutes:seconds for all figures below. The stress given in MPa indicates the applied stress with the tester. The strain value on top of the figures shows the macroscopic strain measured by the tester’s extensometer.
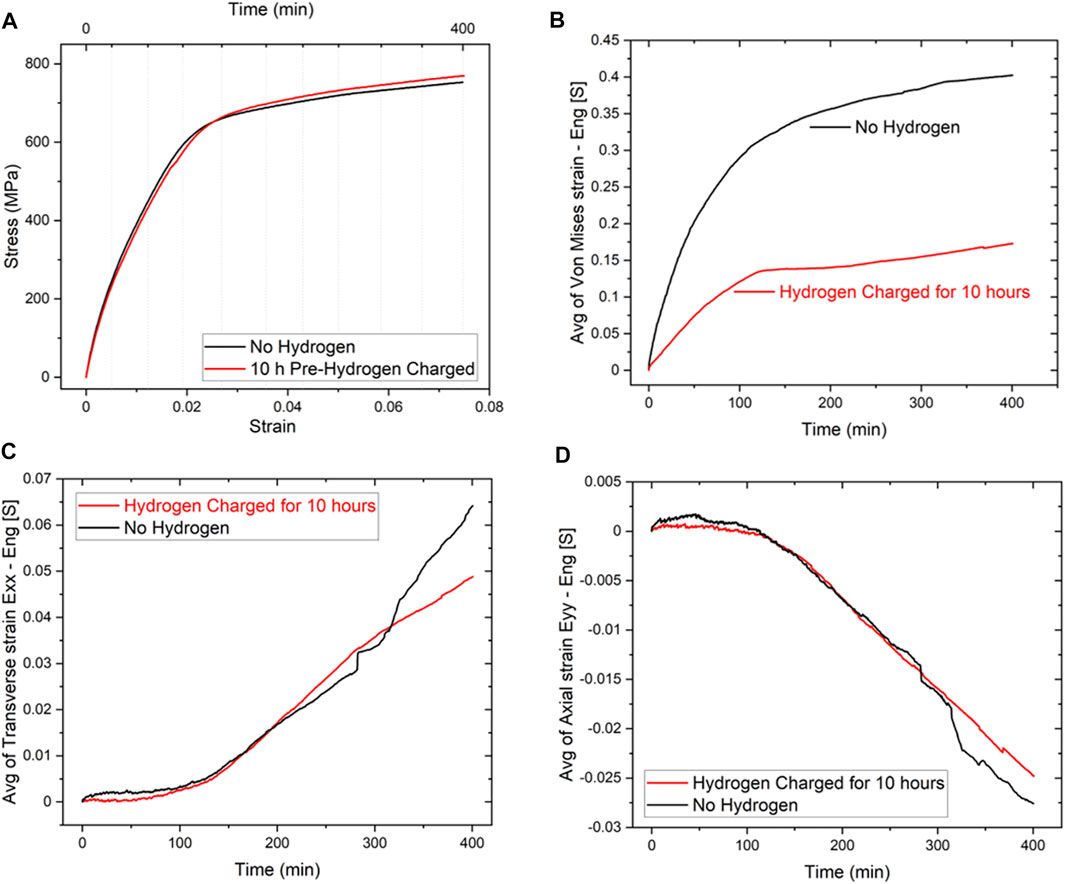
FIGURE 15. (A) Stress-strain curves of the tested microstructures until 7.5% macroscopic strain (measured by the tester’s extensometer), (B) computed average von Mises strain of the entire imaged microstructure, (C) average Exx strain, and (D) average Eyy strain.
Hardening and softening require some explanation. The microstructure is hard when it has resistance to deformation, which may also be called stiff. It further is hard or hardens when it deforms due to dislocation production, also known as dislocation hardening. The microstructure is soft when compliant with the applied stress resulting in (plastic) deformation. Hydrogen in the microstructure, hence, caused softening, and hardening simultaneously. It is softened because the austenite became more compliant to the stress resulting in deformation (hydrogen enhanced localized plasticity), with the ferrite stiffening. The hydrogen-induced deformation causes hardening, and with the stiffened ferrite, the microstructure hardened, which is seen in the stress-strain curve in Figure 11. We conducted nano- and micro-hardness tests on the microstructure before and after hydrogen charging and concluded dislocation hardening occurring in both phases in line with other works (Barnoush et al., 2010; Kheradmand et al., 2016).
The developed strains in the hydrogen-charged microstructure became more heterogeneous along the loading axis and perpendicular. The role of hydrogen became clearer perpendicular to the loading axis, where compressive forces developed preferentially in austenite grains. There, the ferrite phase underwent tension strains. The strain intensities in both phases increased during plastic deformation of the microstructure. Regions of high tensile strains in the ferrite phase formed, and high compressive strains in the austenite phase formed in neighbouring sites starting critical areas for crack evolution. We did not succeed in seeing those sites create cracks during further elongation but assume those sites were primarily responsible for loss of toughness. There is a mismatched strain among the phases in duplex stainless steel (Nilsson and Chai, 2007; Chai et al., 2009; Chai et al., 2014) which hydrogen increases. However, in specimens with more prolonged hydrogen charging (19 days), the shear strains at interphase regions became more localized and excessive (not shown in this paper).
The mismatch strains favour shear, which must become more critical in embrittlement. Shear strain considers no changes in the elemental length of a deforming object but is defined as an angular or sliding deformation of two parallel surfaces of an object. To better understand the deformation behaviour and the role of hydrogen during tensile testing, the average shear strains were plotted against deformation time (Figure 16). The average shear deformation for the microstructure without hydrogen charging was negative, which became positive in the presence of absorbed hydrogen. We explained above that the austenite is the softer phase and that it undergoes preferential deformation during plastic deformation, in line with our previous studies (Örnek and Engelberg, 2016b; Örnek et al., 2018; Örnek et al., 2020a; Örnek et al., 2020b). When hydrogen enters the microstructure, the austenite softens and enables more plastic deformation, resulting in more excessive dislocation hardening. Then, the mismatch shear strains at the austenite/ferrite interphase regions changes due to proportionally more hardening occurring on the austenite than the ferrite. This explains the inversion of the shear deformation sign from negative to positive, as schematically illustrated in Figure 17. Further DIC analyses were performed and the vorticity strains extracted. Likewise, the vorticity strains inverted upon hydrogen charging of the duplex microstructure, corroborating this statement (not shown here).

FIGURE 16. Extracted average shear strains from the DIC strain analysis.
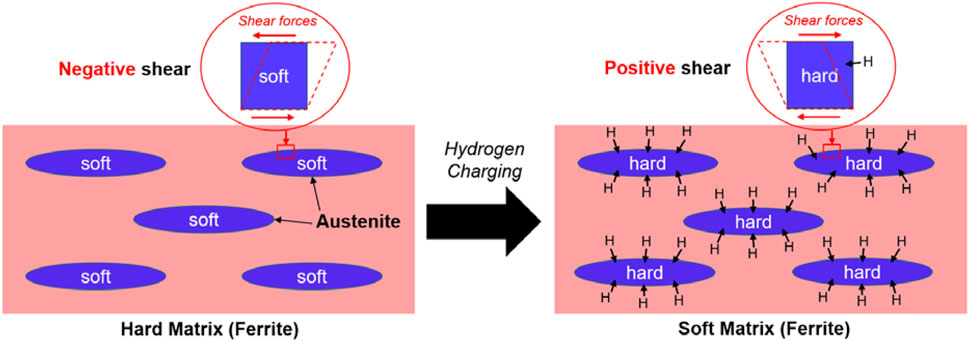
FIGURE 17. Schematic model explaining the change of the shear deformation behaviour from negative to positive due to absorbed hydrogen in the microstructure. The austenite phase absorbs most hydrogen and therefore hardens more than the ferrite phase. Soft means it is more compliant to dislocation activities than hard.
4 Conclusion
1) Hydrogen-induced lattice deformation occurs with both negative and positive strain rates depending on the azimuth direction and position in the specimen and the phase in the microstructure, indicating that grain geometries influence the strain evolution at both macroscopic and microscopic scales.
2) The most hydrogen-induced strain evolution is reversible, i.e., elastic, which relaxes upon the termination of hydrogen charging. Irreversible deformation occurs mainly in near-surface regions in austenitic grains and bulk ferritic grains.
3) Hydrogen induces softening of the austenite phase favouring plastic deformation in near-surface regions while the ferrite hardens, causing increased stiffness, which influences the crack initiation.
4) The interaction of hydrogen shows a time-dependent character; the strain rates of the austenite are higher than those of the ferrite in near-surface regions, indicating dependence on the hydrogen concentration.
5) The deformation characteristics change upon hydrogen charging during mechanical elongation: (i) hydrogen leads to enhanced strain localization occurring more readily in the austenite phase than in the ferrite phase, (ii) the strains in the austenite normal to the sample surface become tensile, (iii) the strains perpendicular to the loading axis become compressive in the austenite with the ferrite being under tension, and (iv) the strains along the loading axis become alternately tensile and compressive in both phases.
Data Availability Statement
The raw data supporting the conclusion of this article will be made available by the authors, without undue reservation.
Author Contributions
CÖ: Conceptualization, Methodology, Software, Formal Analysis, Investigation, Visualization, Data Curation, Writing Original Draft, Writing Review and Editing, Project Administration, and Funding Acquisition; TM: Methodology, Software, Formal Analysis, Investigation, Data Curation, Writing Review and Editing, and Visualization; BŞ: Software, Investigation, Visualization, and Writing Review and Editing; UK: Conceptualization, Methodology, Investigation, Resources, and Writing Review and Editing; FZ: Investigation, Software, and Writing Review and Editing; ML: Investigation, Writing Review and Editing; UL: Methodology, Software, Investigation, Resources, and Writing Review and Editing; AJ: Methodology, Formal Analysis, Investigation, Data Curation, and Writing Review and Editing; TK: Methodology, Writing Review and Editing; EL: Methodology, Writing Review and Editing, Supervision, and Funding Acquisition; JP: Conceptualization, Methodology, Formal Analysis, Investigation, Visualization, Data Curation, Writing Review and Editing, Project Administration, Funding Acquisition, Resources, and Supervision.
Funding
This work was supported by the Swedish Innovation Agency (Vinnova, grant number 2018-03267); the Swedish Research Council (VR, Grant number 2015-06092); and the Scientific and Technological Research Council of Turkey (Grant number 118C227).
Conflict of Interest
Author UK was employed by the company AB Sandvik Materials Technology.
The remaining authors declare that the research was conducted in the absence of any commercial or financial relationships that could be construed as a potential conflict of interest.
Publisher’s Note
All claims expressed in this article are solely those of the authors and do not necessarily represent those of their affiliated organizations, or those of the publisher, the editors and the reviewers. Any product that may be evaluated in this article, or claim that may be made by its manufacturer, is not guaranteed or endorsed by the publisher.
Acknowledgments
We acknowledge DESY (Hamburg, Germany), a member of the Helmholtz Association HGF, to provide experimental facilities. The synchrotron measurement was carried out at beamline P21.2 at PETRA III. In addition, the authors are thankful for DESY NanoLab for providing access to their lab facilities. We are also grateful to Boehler, Austria, for providing the super duplex stainless steel for manufacturing the tensile rig.
Supplementary Material
The Supplementary Material for this article can be found online at: https://www.frontiersin.org/articles/10.3389/fmats.2021.793120/full#supplementary-material
Supplementary Video 1 | DIC micro-strain analysis results showing the von Mises strain evolution in the duplex microstructure without hydrogen charging. The colours indicate the von Mises strains in per cent. Note the transparent background shows the microstructure, with the ferrite phase contrasted as dark and the austenite phase shown as bright islands. The frame rate is 50 frames/s. The specimen was tensile-tested with a strain rate of 0.005 mm/min. Images were captured every ∼10 s using an all-in-focus controllable digital optical microscope. The pixel resolution is 0.93 pixels/µm. The subset size for calculation was 17 pixels with a step size of 5.
Supplementary Video 2 | DIC micro-strain analysis results show the von Mises strain evolution in the duplex microstructure galvanostatically charged with hydrogen for 10 h with −38 mA/cm2 before elongation. The colours indicate the von Mises strains in per cent. The transparent background shows the microstructure, with the ferrite phase being contrasted as dark and the austenite phase shown as bright islands. The frame rate is 50 frames/s. The specimen was tensile-tested with a strain rate of 0.005 mm/min. Images were captured every ∼10 s using an all-in-focus controllable digital optical microscope. The pixel resolution is 0.93 pixels/µm. The subset size for calculation was 17 pixels with a step size of 5.
References
Agüero, J. M. A. A., Hierro, M. P., Phillibert, J., and Pérez Trujillo, F. J. (2009). Hydrogen Embrittlement of High Strength Steels. Defect and Diffusion Forum 289-292, 203–209.
Andreikiv, A. E., Panasyuk, V. V., and Kharin, V. S. (1978). Theoretical Aspects of the Kinetics of Hydrogen Embrittlement of Metals. Mater. Sci. 14, 227–244. doi:10.1007/bf00754757
Bahrami, A., and Woollin, P. (2010). “Hydrogen Induced Stress Cracking of Duplex Stainless Steel Subsea Components,” in “ 29th International Conference on Offshore Mechanics and Arctic Engineering” (Shanghai, China: OMAE 2010). doi:10.1115/omae2010-20088
Bak, S., Abro, M., and Lee, D. (2016). Effect of Hydrogen and Strain-Induced Martensite on Mechanical Properties of AISI 304 Stainless Steel. Metals 6, 169. doi:10.3390/met6070169
Barnoush, A., Zamanzade, M., and Vehoff, H. (2010). Direct Observation of Hydrogen-Enhanced Plasticity in Super Duplex Stainless Steel by Means of In Situ Electrochemical Methods. Scripta Materialia 62, 242–245. doi:10.1016/j.scriptamat.2009.11.007
Barrera, O., Bombac, D., Chen, Y., Daff, T. D., Galindo-Nava, E., Gong, P., et al. (2018). Understanding and Mitigating Hydrogen Embrittlement of Steels: a Review of Experimental, Modelling and Design Progress from Atomistic to Continuum. J. Mater. Sci. 53, 6251–6290. doi:10.1007/s10853-017-1978-5
Bhadeshia, H. K. D. H. (2016). Prevention of Hydrogen Embrittlement in Steels. ISIJ Int. 56, 24–36. doi:10.2355/isijinternational.isijint-2015-430
Byrne, G., Francis, R., and Warburton, G. (2016). “Hydrogen Induced Stress Cracking (HISC) Resistance and Improvement Methods for Super Duplex Stainless Steels - Paper No. 6981,” in Corrosion 2016, NACE International, Vancouver, British Columbia, Canada.
Chai, G., Peng, R. L., and Johansson, S. (2014). Fatigue Behaviors in Duplex Stainless Steel Studied Using In-Situ SEM/EBSD Method. Proced. Mater. Sci. 3, 1748–1753. doi:10.1016/j.mspro.2014.06.282
Chai, G., Ronneteg, S., Kivisäkk, U., Peng, R. L., and Johansson, S. (2009). Mechanisms of Hydrogen Induced Stress Crack Initiation and Propagation in Super Duplex Stainless Steels. steel Res. Int. 80, 482–487. doi:10.2374/SRI09SP042
Fukuoka, C., Morishima, K., Yoshizawa, H., and Mino, K. (2002). Misorientation Development in Grains of Tensile Strained and Crept 2.25%Cr–1%Mo Steel. Scripta Materialia 46, 61–66. doi:10.1016/s1359-6462(01)01197-6
Grozovski, V., Vesztergom, S., Láng, G. G., and Broekmann, P. (2017). Electrochemical Hydrogen Evolution: H+or H2O Reduction? A Rotating Disk Electrode Study. J. Electrochem. Soc. 164, E3171–E3178. doi:10.1149/2.0191711jes
Gu, Y., and El-Awady, J. A. (2018). Quantifying the Effect of Hydrogen on Dislocation Dynamics: A Three-Dimensional Discrete Dislocation Dynamics Framework. J. Mech. Phys. Sol. 112, 491–507. doi:10.1016/j.jmps.2018.01.006
Hariramabadran Anantha, K., Örnek, C., Ejnermark, S., Thuvander, A., Medvedeva, A., Sjöström, J., et al. (2019). Experimental and Modelling Study of the Effect of Tempering on the Susceptibility to Environment-Assisted Cracking of AISI 420 Martensitic Stainless Steel. Corrosion Sci. 148, 83–93. doi:10.1016/j.corsci.2018.12.010
Kheradmand, N., Johnsen, R., Olsen, J. S., and Barnoush, A. (2016). Effect of Hydrogen on the Hardness of Different Phases in Super Duplex Stainless Steel. Int. J. Hydrogen Energ. 41, 704–712. doi:10.1016/j.ijhydene.2015.10.106
Kirchheim, R. (2010). Revisiting Hydrogen Embrittlement Models and Hydrogen-Induced Homogeneous Nucleation of Dislocations. Scripta Materialia 62, 67–70. doi:10.1016/j.scriptamat.2009.09.037
Kivisäkk, U., and Ciurea, S. (2011). Influence of the Inhomogeneous Deformation on the Mechanism for HISC of Duplex Stainless Steels. in 18th International Corrosion Congress 2011. Perth, Australia.
Kivisäkk, U. (2010). Relation of Room Temperature Creep and Microhardness to Microstructure and HISC. Mater. Sci. Eng. A 527, 7684–7688. doi:10.1016/j.msea.2010.08.035
Koyama, M., Rohwerder, M., Tasan, C. C., Bashir, A., Akiyama, E., Takai, K., et al. (2017). Recent Progress in Microstructural Hydrogen Mapping in Steels: Quantification, Kinetic Analysis, and Multi-Scale Characterisation. Mater. Sci. Tech. 33, 1481–1496. doi:10.1080/02670836.2017.1299276
Laureys, A., Depover, T., Petrov, R., and Verbeken, K. (2015). Characterization of Hydrogen Induced Cracking in TRIP-Assisted Steels. Int. J. Hydrogen Energ. 40, 16901–16912. doi:10.1016/j.ijhydene.2015.06.017
Leyson, G. P. M., Grabowski, B., and Neugebauer, J. (2016). Multiscale Modeling of Hydrogen Enhanced Homogeneous Dislocation Nucleation. Acta Materialia 107, 144–151. doi:10.1016/j.actamat.2016.01.036
Lynch, S. (2012). Hydrogen Embrittlement Phenomena and Mechanisms. Corrosion Rev. 30, 105–123. doi:10.1515/corrrev-2012-0502
Lynch, S. P. (2011). “Hydrogen Embrittlement (HE) Phenomena and Mechanisms,” in Stress Corrosion Cracking. Editors V. S. Raja, and T. Shoji (Woodhead Publishing), 90–130. doi:10.1533/9780857093769.1.90 Available at: https://www.sciencedirect.com/science/article/pii/B978184569673350002X
Maria, G. G. B., Claeys, L., Depover, T., Santos, D. B., and Verbeken, K. (2019). The Hydrogen Induced Mechanical Degradation of Duplex Stainless Steel. Steel Research Int. 90, 1800451. doi:10.1002/srin.201800451
Mente, T., and Boellinghaus, T. (2014). Mesoscale Modeling of Hydrogen-Assisted Cracking in Duplex Stainless Steels. Weld World 58, 205–216. doi:10.1007/s40194-013-0106-7
von Mises, R. (1913). Mechanik der festen Körper im plastisch-deformablenZustand, Nachrichten von der Gesellschaft der Wissenschaften zu Göttingen. in Mathematisch-Physikalische Klasse.
Muniandy, K. (2019). Digital Image Correlation for Strain Measurement in Plastic Film Blowing Process. Mater. Sci. Tech. 35, 1016–1027. doi:10.1080/02670836.2019.1612595
Nilsson, J.-O., and Chai, G. (2007). “The Physical Metallurgy of Duplex Stainless Steels,” in International Conference & Expo Duplex 2007, Associazone Italiana di Metallurgia (AIM), Grado, Italy.
Örnek, C., and Engelberg, D. L. (2016). An Experimental Investigation into Strain and Stress Partitioning of Duplex Stainless Steel Using Digital Image Correlation, X-ray Diffraction and Scanning Kelvin Probe Force Microscopy. J. Strain Anal. Eng. Des. 51, 207–219. doi:10.1177/0309324716631669
Örnek, C., and Engelberg, D. L. (2015). SKPFM Measured Volta Potential Correlated with Strain Localisation in Microstructure to Understand Corrosion Susceptibility of Cold-Rolled Grade 2205 Duplex Stainless Steel. Corrosion Sci. 99, 164–171. doi:10.1016/j.corsci.2015.06.035
Örnek, C., and Engelberg, D. L. (2016). Towards Understanding the Effect of Deformation Mode on Stress Corrosion Cracking Susceptibility of Grade 2205 Duplex Stainless Steel. Mater. Sci. Eng. A 666, 269–279. doi:10.1016/j.msea.2016.04.062
Örnek, C., Larsson, A., Harlow, G. S., Zhang, F., Kroll, R., Carlà, F., et al. (2020). Metastable Precursor Structures in Hydrogen-Infused Super Duplex Stainless Steel Microstructure - an Operando Diffraction experiment. Corrosion Sci. 176, 109021. doi:10.1016/j.corsci.2020.109021
Örnek, C., Larsson, A., Harlow, G. S., Zhang, F., Kroll, R., Carlà, F., et al. (2020). Time-resolved Grazing-Incidence X-ray Diffraction Measurement to Understand the Effect of Hydrogen on Surface Strain Development in Super Duplex Stainless Steel. Scripta Materialia 187, 63–67. doi:10.1016/j.scriptamat.2020.05.061
Örnek, C., Leygraf, C., and Pan, J. (2019). Passive Film Characterisation of Duplex Stainless Steel Using Scanning Kelvin Probe Force Microscopy in Combination with Electrochemical Measurements. Npj Mater. Degrad. 3, 8. doi:10.1038/s41529-019-0071-8
Örnek, C., Müller, T., Kivisäkk, U., Zhang, F., Långberg, M., Lienert, U., et al. (2020). Operando Time- and Space-Resolved High-Energy X-ray Diffraction Measurement to Understand Hydrogen-Microstructure Interactions in Duplex Stainless Steel. Corrosion Sci. 175, 108899. doi:10.1016/j.corsci.2020.108899
Örnek, C., Reccagni, P., Kivisäkk, U., Bettini, E., Engelberg, D. L., and Pan, J. (2018). Hydrogen Embrittlement of Super Duplex Stainless Steel - towards Understanding the Effects of Microstructure and Strain. Int. J. Hydrogen Energ. 43, 12543–12555. doi:10.1016/j.ijhydene.2018.05.028
Örnek, C., Şeşen, B. M., and Ürgen, M. K. (2021). Understanding Hydrogen-Induced Strain Localization in Super Duplex Stainless Steel Using Digital Image Correlation Technique. Met. Mater. Int.. doi:10.1007/s12540-021-01123-2
Popov, B. N., Lee, J.-W., and Djukic, M. B. (2018). “Hydrogen Permeation and Hydrogen-Induced Cracking,” in Handbook of Environmental Degradation of Materials. Editor M. Kutz. Third Edition (William Andrew Publishing), 133–162. doi:10.1016/b978-0-323-52472-8.00007-1 Available at: https://www.sciencedirect.com/science/article/pii/B9780323524728000071?via%3Dihub
Pu, S. D., Turk, A., Lenka, S., and Ooi, S. W. (2019). Hydrogen Desorption Change after Deformation of a Bainitic Steel with Unstable Retained Austenite. Scripta Materialia 170, 38–42. doi:10.1016/j.scriptamat.2019.05.026
Sofia Hazarabedian, M., Viereckl, A., Quadir, Z., Leadbeater, G., Golovanevskiy, V., Erdal, S., et al. (2019). Hydrogen-induced Stress Cracking of Swaged Super Duplex Stainless Steel Subsea Components. Corrosion 75, 824–838. doi:10.5006/3192
Tehranchi, A., Yin, B., and Curtin, W. A. (2017). Softening and Hardening of Yield Stress by Hydrogen-Solute Interactions. Phil. Mag. 97, 400–418. doi:10.1080/14786435.2016.1263402
Venezuela, J., Liu, Q., Zhang, M., Zhou, Q., and Atrens, A. (2016). A Review of Hydrogen Embrittlement of Martensitic Advanced High-Strength Steels. Corrosion Rev. 34, 153–186. doi:10.1515/corrrev-2016-0006
Wang, G., Yan, Y., Yang, X., Li, J., and Qiao, L. (2013). Investigation of Hydrogen Evolution and Enrichment by Scanning Kelvin Probe Force Microscopy. Electrochemistry Commun. 35, 100–103. doi:10.1016/j.elecom.2013.08.006
Woollin, P., and Gregori, A. (2004). “Avoiding Hydrogen Embrittlement Stress Cracking of Ferritic Austenitic Stainless Steels under Cathodic Protection,” in OMAE 2004: 23rd International Conference on Offshore Mechanics and Arctic Engineering Vancouver, Canada. doi:10.1115/omae2004-51203
Keywords: super duplex stainless steel, hydrogen embrittlement, high-energy x-ray diffraction, lattice strain, digital image correlation, synchrotron radiation, strain localization, correlative microstructure characterization
Citation: Örnek C, Müller T, Şeşen BM, Kivisäkk U, Zhang F, Långberg M, Lienert U, Jeromin A, Keller TF, Lundgren E and Pan J (2022) Hydrogen-Induced Micro-Strain Evolution in Super Duplex Stainless Steel—Correlative High-Energy X-Ray Diffraction, Electron Backscattered Diffraction, and Digital Image Correlation. Front. Mater. 8:793120. doi: 10.3389/fmats.2021.793120
Received: 11 October 2021; Accepted: 09 December 2021;
Published: 05 January 2022.
Edited by:
Sebastien Dryepondt, Oak Ridge National Laboratory (DOE), United StatesReviewed by:
Pavlo Maruschak, Ternopil Ivan Pului National Technical University, UkraineBurak Bal, Abdullah Gül University, Turkey
Copyright © 2022 Örnek, Müller, Şeşen, Kivisäkk, Zhang, Långberg, Lienert, Jeromin, Keller, Lundgren and Pan. This is an open-access article distributed under the terms of the Creative Commons Attribution License (CC BY). The use, distribution or reproduction in other forums is permitted, provided the original author(s) and the copyright owner(s) are credited and that the original publication in this journal is cited, in accordance with accepted academic practice. No use, distribution or reproduction is permitted which does not comply with these terms.
*Correspondence: Cem Örnek, Y29ybmVrQGl0dS5lZHUudHI=; Jinshan Pan, amluc2hhbnBAa3RoLnNl