 Taihao Han
 Sai Akshay Ponduru1
 Gaurav Sant
 Aditya Kumar
- 1Materials Science and Engineering, Missouri University of Science and Technology, Rolla, MO, United States
- 2Electrical and Computer Engineering, Missouri University of Science and Technology, Rolla, MO, United States
- 3Civil and Environmental Engineering, University of California, Los Angeles, Los Angeles, CA, United States
To reduce the energy-intensity and carbon footprint of Portland cement (PC), the prevailing practice embraced by concrete technologists is to partially replace the PC in concrete with supplementary cementitious materials [SCMs: geological materials (e.g., limestone); industrial by-products (e.g., fly ash); and processed materials (e.g., calcined clay)]. Chemistry and content of the SCM profoundly affect PC hydration kinetics; which, in turn, dictates the evolutions of microstructure and properties of the [PC + SCM] binder. Owing to the substantial diversity in SCMs’ compositions–plus the massive combinatorial spaces, and the highly nonlinear and mutually-interacting processes that arise from SCM-PC interactions–state-of-the-art computational models are unable to produce a priori predictions of hydration kinetics or properties of [PC + SCM] binders. In the past 2 decades, the combination of Big data and machine learning (ML)—commonly referred to as the fourth paradigm of science–has emerged as a promising approach to learn composition-property correlations in materials (e.g., concrete), and capitalize on such learnings to produce a priori predictions of properties of materials with new compositions. Notwithstanding these merits, widespread use of ML models is hindered because they: 1) Require Big data to learn composition-property correlations, and, in general, large databases for concrete are not publicly available; and 2) Function as black-boxes, thus providing little-to-no insights into the materials laws like theory-based analytical models do. This study presents a deep learning (DL) model capable of producing a priori, high-fidelity predictions of composition- and time-dependent hydration kinetics and phase assemblage development in [PC + SCM] pastes. The DL is coupled with: 1) A fast Fourier transformation algorithm that reduces the dimensionality of training datasets (e.g., kinetic datasets), thus allowing the model to learn intrinsic composition-property correlations from a small database; and 2) A thermodynamic model that constrains the model, thus ensuring that predictions do not violate fundamental materials laws. The training and outcomes of the DL are ultimately leveraged to develop a simple, easy-to-use, closed-form analytical model capable of predicting hydration kinetics and phase assemblage development in [PC + SCM] pastes, using their initial composition and mixture design as inputs.
Introduction
Concrete–a mixture of Portland cement (PC); water; sand; and stone–is the principal material used in the construction of all forms of physical infrastructure; and, more generally, the built environment. At the current global level of production—∼4.5 gigatonnes (Gt) every year (Lange and Clare, 2013; Gartner and Hirao, 2015; Biernacki et al., 2017; Scrivener et al., 2018)—PC requires 11•1018J of thermal energy; (Gartner and Hirao, 2015; Ludwig and Zhang, 2015; Schneider, 2015; Biernacki et al., 2017; He et al., 2019); which is equivalent to the energy generated from the combustion of ∼1.3 billion barrels of crude oil. (Schneider et al., 2011; Schneider, 2015; Cadavid-Giraldo et al., 2020; Ighalo and Adeniyi, 2020). When we account for emission of greenhouse gases, especially CO2, the statistics exacerbate alarmingly: (Gartner and Hirao, 2015; Ludwig and Zhang, 2015; Schneider, 2015): PC’s production-and-use accounts for ∼9% of all anthropogenic CO2 emissions. (Miller, 2013; Schorcht, 2013; Dowling et al., 2015). As the global population rises to 10 billion by 2050, (United Nations, 2019), the demand for PC concrete infrastructure–and, thus, the concomitant energy demand and CO2 emissions–are expected to continually increase in the future.
To alleviate the energy-intensity and carbon footprint of PC’s production-and-use, the construction community has emphasized partial substitution of PC (up to 60%mass) with supplementary cementitious materials (SCMs: limestone; quartz; metakaolin; fly ash; slag; etc. (Mehta and Monteiro, 1976; Johari et al., 2011; Juenger et al., 2012; Juenger and Siddique, 2015; Biernacki et al., 2017; Juenger et al., 2019)). However, much research is still required to comprehensively understand and describe the underlying composition-reaction-microstructure-property correlations in low-PC or [PC + SCM] binders (i.e., pastes; mortars; and concretes). Such understanding–when distilled down to theories, and subsequently, as closed-form mathematical equations–would offer the ability to produce a priori predictions of binders’ properties, just using their compositions (plus a few other easy-to-measure attributes, e.g., mixture proportion and fineness of precursor materials) as inputs. This would be greatly beneficial, as it would substantially reduce the time and cost of conducting experiments to determine the binders’ properties; and would allow end-users to manipulate (e.g., enhance) the binders’ properties by simply finetuning their composition.
While the needs and benefits of a priori predictions of cementitious binders’ properties (from their compositions) are clear, developing theory-based models that are actually capable of producing accurate predictions is not straightforward. This is largely because, in all PC-based binders (e.g., plain paste [PC + SCM] paste; etc.), the development of properties (e.g., strength) is dictated by the hydration of PC, a complex process involving the reaction of PC with water. (Taylor, 1997). The aforesaid complexity–which has, in effect, stymied the development of accurate, predictive models–arises from the presence of numerous anhydrous (i.e., unreacted) and hydrated phases (i.e., hydration products) within the binder at any given age (Mehta and Monteiro, 1976; Thomas et al., 2011; Cook et al., 2021a). A typical, commercial PC comprises C3S, C2S, C3A, and C4AF (plus C$H2)—where: C = CaO; S = SiO2; A = Al2O3; $ = SO3; F = Fe2O3; and H = H2O–and all of these phases concurrently undergo hydration at distinct rates upon contact with water, and produce distinct sets of hydrates. (Bullard et al., 2011; Cook et al., 2019a). Many past studies (Breval, 1976; Vovk, 2000; Chen and Juenger, 2011; Kumar et al., 2012; Quennoz and Scrivener, 2012; Lapeyre et al., 2020; Cook et al., 2021a) have attempted to describe PC hydration by investigating simpler variants of PC pastes; for example, pure C3S and C3S-C3A-gypsum pastes. While these studies have provided foundational understanding of intrinsic composition-reaction-microstructure-property correlations in simpler systems, this understanding falls short of explaining hydration (and the ensuing development of microstructure and properties) in low-PC binders. For instance, in [PC + SCM] binders, chemical interactions of the SCM with anhydrous cementitious phases (e.g., C3S; and C3A) and hydrates–that occur alongside the hydration of the anhydrous phases–can be difficult to explain or predict based on our knowledge gained from simpler systems. Complexities resulting from metakaolin–for example–are well-documented in both binary (Lapeyre and Kumar, 2018; Lapeyre et al., 2019) and ternary pastes; (Cook et al., 2021b); as it can act as both a pozzolan and a filler, (Lapeyre and Kumar, 2018; Lapeyre et al., 2019), as well as contribute to carboaluminate hydrate formation. (De Weerdt et al., 2011; Antoni et al., 2012; Vance et al., 2013a; Ramezanianpour and Hooton, 2014).
To predict the properties of a given (PC + SCM) binder (e.g., paste) at a specific age, it is critical to know the binder’s phase assemblage [i.e., volume fractions of anhydrous PC; anhydrous SCMs; hydrates; and capillary pores]; which, in turn, depends on the rate and extent of hydration of PC in the binder. Isothermal calorimetry has emerged as the dominant technique among cement chemists to measure the rate and extent (degree) of hydration of PC in cementitious binders. This technique measures time-resolved exothermic heat release from the hydration of PC (and other endothermic and exothermic reactions, if any). This heat–generally speaking–is much larger in magnitude compared to minor amounts of thermal energy associated with interactions of SCMs with other components of the binder (Cook et al., 2021b). The heat evolution (or calorimetry) profiles thus obtained can be processed to determine the degree of reaction (or hydration) of PC in the binder as a function of time. (Bullard et al., 2011; Cook et al., 2021b). Figure 1 shows representative isothermal calorimetry profiles (i.e., time-resolved heat flow rate; and cumulative heat release) of a type I/II PC paste. These heat evolution profiles can be coupled with thermodynamic simulations to describe the evolution of a binder’s phase assemblage (i.e., volume fractions of anhydrous PC and SCMs; hydrates; and capillary pores) with respect to time or the degree of hydration of PC. Gibbs Energy Minimization Software (GEMS)—designed for geochemical modeling (Wagner et al., 2012; Kulik et al., 2013)—has become a popular tool for such thermodynamic simulations. (Lothenbach and Winnefeld, 2006; Lothenbach et al., 2008; De Weerdt et al., 2011). More specifically: isothermal calorimetry results and GEMS simulations–when combined–can describe, with reasonable accuracy, the phase assemblage of a PC-based binder with respect to time; which can be further analyzed to qualitatively or quantitively predict the properties of the binder. With that said, the combination of isothermal calorimetry and GEMS still cannot produce a priori predictions of time-resolved phase assemblage of a new binder. This is because experimental measurement of the new binder’s heat evolution profiles, or PC’s hydration kinetics, would still be required. And, to reiterate the point made earlier, due to our lack of understanding of underlying composition-reaction correlations, state-of-the-art kinetic models (e.g., phase boundary nucleation and growth models with constant, (Thomas, 2007), or variable growth rate (Oey et al., 2016; Ley-Hernandez et al., 2018; Lapeyre et al., 2019)) are unable to produce reliable predictions of heat evolution profiles of PC-based systems. Furthermore, although these kinetic models can reproduce heat evolution profiles, experiments are required to determine key parameters (e.g., constant or time-dependent growth rate of CSH) for the models. Consequently, these models are unable to produce a priori predictions of calorimetry profiles of cementitious systems.
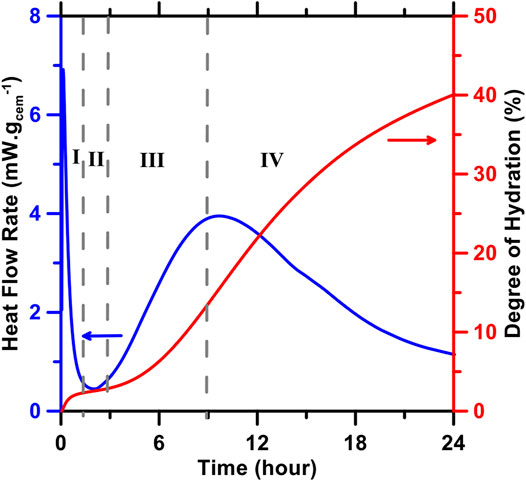
FIGURE 1. Heat flow rate profile (blue), depicting the kinetics of PC hydration during four stages that manifest within the first 24 h after mixing (I) initial period (II) induction period (III) acceleration period; and (IV) deceleration period (Bullard et al., 2011; Cook, 2020; Cook et al., 2021b). The initial period corresponds to wetting of PC particulates (upon contact with water) and their rapid dissolution. The induction period corresponds to a period of slow dissolution of PC particulates, and precipitation of small amounts of hydrates (Bullard et al., 2011; Scrivener et al., 2015). The acceleration and deceleration periods are associated with a short burst of nucleation and subsequent growth of hydrates (Bullard, 2008; Bazzoni, 2014; Bazzoni et al., 2014; Bullard et al., 2015; Scrivener et al., 2015). The heat flow rate profile can be used to estimate the time-dependent extent/degree of reaction of PC (red).
Recent studies (Cook et al., 2021b; Lapeyre et al., 2021) have shown that machine learning (ML) models–once trained from a sufficiently large calorimetry database–can produce a priori predictions of heat evolution profiles (i.e., time-dependent heat flow rate and cumulative heat release) of PC-based binders, including binary and ternary [PC + SCM] pastes. Despite the successes of these studies, there are still few challenges that need to be addressed. 1) In both studies, (Cook et al., 2021b; Lapeyre et al., 2021), relatively homogenous databases were used to train and test the prediction performance of the ML model. To better explain the aforesaid homogeneous nature of the databases: in one study, (Lapeyre et al., 2021), a database comprised of calorimetry profiles of (synthetic PC + SCM) pastes was used; whereas, in the other, (Cook et al., 2021c), a database comprised of calorimetry profiles of (commercial PC + SCM) pastes was used. It is unclear if the prediction performance of the ML models would decline if the two databases were to be combined to produce a singular, highly heterogeneous–yet a moderately low-volume–database. The authors hypothesize that for such a highly heterogeneous database, it is important to reduce the dimensionality (complexity) of the database; to make it easier for the ML models to learn the intrinsic input-output correlations during their training. Fourier transformation–which has historically been used for signal processing, and processing of 2D and 3D images obtained from various techniques (e.g., spectroscopy; (Fromherz and Guenther, 2005); microstructures generated from micro- and nano-indentation apparatuses; (Passoja and Psioda, 1981; Hao et al., 1993); electron microscopy; (Buseck et al., 1988; Zeng et al., 2016) etc.;)—is a promising tool for dimensionality-reduction of numerical databases. This is because of Fourier transformation’s innate ability to maintain most of the information–except for the redundant ones–contained within the database of interest, but in a much simpler, near loss-less format (Duhamel and Vetterli, 1990). Preservation of pertinent information in the database–while reducing the redundancies–not only simplifies the initial transformation, but also the reverse transformation (i.e., from the reduced to the original dimensional form) (Duhamel and Vetterli, 1990). Although Fourier transformation has never been used to treat or process calorimetry databases, the authors hypothesize that its use could substantially enhance the prediction performance of ML models, especially when working with complex, highly heterogeneous database with a relatively small volume. This hypothesis will be tested in this study. 2) The ML models used in the two studies (Cook et al., 2021b; Lapeyre et al., 2021) cited above–while good at producing a priori predictions of heat evolution profiles of [PC + SCM] pastes–were not constrained in any way. The authors hypothesize that if these ML models are constrained–e.g., using thermodynamic rules as constraints–their prediction performance would improve. Importantly, it would be less likely for the models’ predictions to violate basic thermodynamic rules. Testing this hypothesis is another focus of this study. 3) The studies (Cook et al., 2021b; Lapeyre et al., 2021) cited above used ML models that function–more or less–as black-boxes; providing little-to-no insights into the materials laws like closed-form analytical models do. This is a problem, because end-users–who do not have access to ML models–would not gain any benefits from such ML models. It is, thus, important to capitalize on the training of the ML models–and the cause-effect correlations established by them–to develop simple, closed-form analytical models that are accessible to all end-users, irrespective of their knowledge of, or access to, ML models.
In this study, a deep learning (DL) model–trained from a heterogenous, low-volume database of heat evolution profiles of [PC + SCM] pastes–is implemented to produce a priori, high-fidelity predictions of composition- and time-dependent hydration kinetics, and phase assemblage development in (PC + SCM) pastes. The SCMs used in this study include permutations-and-combinations of limestone; quartz; silica fume; and metakaolin. To enhance the prediction performance, the DL model is coupled with: 1) A fast Fourier transformation (FFT) algorithm that reduces the dimensionality of database; and 2) A thermodynamic constraint (obtained from thermodynamic simulations of phase assemblages) that ensures that the predictions do not violate fundamental materials laws. The DL model is used to quantify the influence of each input variable (e.g., contents of SCMs and C3S in the binder) on the resultant properties of the binder; thereby allowing the distinction between consequential and inconsequential variables (in terms of their influence on hydration kinetics). On the premise of this understanding, an easy-to-use, closed-form analytical model is developed; and it is shown that this model–despite its simplicity and fewer input requirements–can produce reliable, a priori predictions of hydration kinetics and phase assemblage development in (PC + SCM) pastes.
Modeling Methods
An original Fourier transform-deep learning (FT-DL) model was developed in this study. The model was trained: first, using a synthetic database for benchmarking and validation (described in section 3.1); and second, using database of isothermal calorimetry profiles of (PC + SCM) pastes (described in section 3.2). The trained model was subsequently employed to produce predictions of outputs in blank data-domains of the synthetic database, and hydration kinetics of new (PC + SCM) pastes. Prediction performance of the model was rigorously appraised by comparing its predictions against actual values. Figure 2 shows the architecture of the FT-DL model. As can be seen, this model unites the fast Fourier transformation (FFT) algorithm with the deep learning (DL) model. Details of the DL model–which is premised on the random forests model that has been in our previous studies (Cook et al., 2021b; Lapeyre et al., 2021; Xu et al., 2021)—can be found in Supplementary Section S1 of Supplementary Information S1
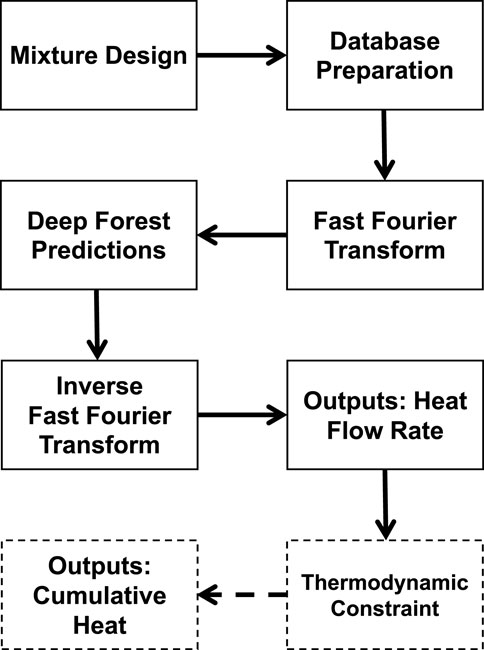
FIGURE 2. Schematic of the original FT-DL model, developed in this study, to predict hydration kinetics (i.e., heat flow rate and cumulative heat release) of (PC + SCM) pastes. For prediction of cumulative heat release, thermodynamic constraint–obtained from simulations of phase assemblages in the pastes–is used to provide guidance to the model, and constrain its outputs.
The calorimetry database used for training and validation of FT-DL model is composed of: 1) Input variables: physicochemical properties of (PC + SCM) pastes (e.g., mixture design; and physical attributes such as specific surface areas (SSAs) of the PC and SCM measured using static light scattering); and 2) Output: time-resolved heat flow rate profiles, obtained from isothermal calorimetry. First, the model is trained using a large fraction of the database. Prior to the training, dimensionality of the heat flow rate profiles (in the training database) is reduced using the FFT algorithm. Next, during the training, the model finds the underlying correlations between input variables and the FFT-transformed heat flow rate profiles. The trained FT-DL model is then validated against a testing database (the remaining minor fraction of the database that is kept hidden from the model during its training). The model leverages its training to predict the FFT-transformed heat flow rate profiles in relation to physicochemical properties of pastes in the testing database. Finally, the model’s predictions are reverse-transformed, back to time-dependent heat flow rate profiles–akin to those obtained from isothermal calorimetry–using the inverse FFT algorithm. In select cases (e.g., to predict the cumulative heat release of pastes at 24 h; see section 3.3), thermodynamic simulations of phase assemblages in the pastes are used to provide theoretical guidance to the FT-DL model, and to constrain its outputs. These predictions are then compared against experiments. To evaluate the accuracy of predictions produced by the FT-DL model, five statistical parameters–mean absolute error (MAE); mean absolute percentage error (MAPE); root mean squared error (RMSE); Person correlation coefficient (R); and coefficient of determination (R2)—are used. Relevant equations that describe these parameters–the measures of errors in the model’s predictions–can be found in our previous studies. (Cook et al., 2019b; Cai et al., 2020).
Fourier transform (FT) is a signal-processing technique that is used to convert a complex waveform from its original domain (e.g., time) to a representation in the frequency domain, and vice versa. (Cochran et al., 1967; Bergland, 1969; Higgins, 1976). Time-to-frequency domain conversion, when done for a dataset comprising a finite number of data-records spanning a finite range (as opposed to functions, e.g., sin (x), that are continuous over an infinite domain) (Duhamel and Vetterli, 1990), is called discrete-time Fourier transform (DFT; shown in )
where Ar is the rth coefficient of the DFT; Xk represents the kth sample of the time series which consists of N samples;
In this study, FFT algorithm–a simple and efficient algorithm, designed to obtain discrete-time Fourier transformations of complex datasets–is used to reduce the dimensionality (or complexity) of heat flow rate profiles of [PC + SCM] pastes. (Cooley and Tukey, 1965). Compared to competing algorithms (e.g., conventional DFT), FFT is computationally more efficient. This is because the number of required operations is reduced from N2 to N log2N. In general, the FFT algorithm splits the N-point transformation into 2 N/2-point transformations in each step. Then, in an iterative manner, each subset is bifurcated, until the final subset only has a 1-point transformation. Overall, each point requires log2N splits, resulting in Nlog2N operations for generating N-point transformations. The FFT algorithm is described in Eq. (2). Figure 3 shows representative examples of FFT transformation of heat flow rate profiles of pastes. As can be seen, the transformed profiles are much simpler than their original counterparts. Information contained within the transformed profiles (Figure 3B) can be expressed using far fewer number of datapoints than the corresponding original versions (Figure 3A). This is important because such reduction in number of datapoints substantially reduces the time and computational resources (e.g., memory) needed for the FT-DL model’s training. Furthermore, as the number of inflection (i.e., non-differentiable) points in the transformed profiles are significantly lower than in the original ones, it is much easier for the FT-DL model to establish input-output correlations from the transformed profiles as compared to the original ones.
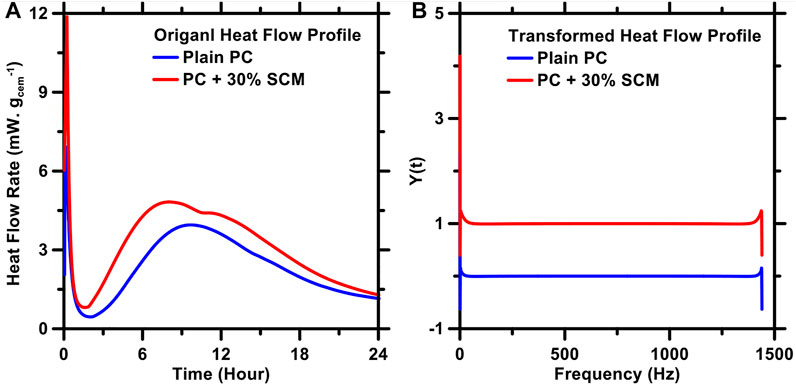
FIGURE 3. (A) Original and (B) FFT-transformed heat flow rate profiles of representative plain and (PC + SCM) pastes. As can be seen, FFT transformation significantly reduces the dimensionality (complexity) of the profile; thereby making is easier and more (computationally) efficient for the FT-DL model to statistically analyze the datasets–and learn input-output correlations–during its training.
Results and Discussion
Validation of the FT-DL Model
The FT-DL model described in section 2.0 differs from the ML models used in our previous studies (Cook et al., 2021b; Lapeyre et al., 2021; Xu et al., 2021) (i.e., DL model based on random forests) in one key respect: In the FT-DL model, the database is FFT-transformed, prior to the model’s training, so as to reduce the database’s dimensionality; whereas in the DL model, the database is used in its pristine form. In section 2.0, it was argued that the FFT-transformation of the database ensures better training of FT-DL model; thereby, resulting in improvement of its prediction performance. To justify this argument, the prediction performance of the FT-DL model was compared against that of the DL model; using a synthetic database featuring a highly nonlinear, and non-monotonous relationship between the input (X) and the output (Y). Within the database, the complex input-output relationships are represented by a composite mathematical function (Eq. (3)). This function consists of three separate functions: exponential; trigonometric; and hyperbolic. Here, X is the input; Y is the output; and A, B, and C are coefficients ranging from 0-to-2. The synthetic database was populated with ∼20,000 data-series (i.e., Y as a function of X), created by randomly assigning an independent set of coefficients (i.e., randomly chosen values of A, B, and C within the pre-selected range of 0-to-2); while varying X from 0.2 to 4.0 with a step-size of 0.2.75% of data-series were randomly selected from the database, and used to train the FT-DL and DL models. The remaining 25% were used to probe and compare the prediction performances of the two models.
Figure 4 shows representative predictions (of data-series included in the testing database) produced by the DL and FT-DL models; the actual data-series, calculated directly from Eq. (3), are also shown. As can be seen, the prediction performance of the FT-DL model is clearly superior to that of the DL model. This result is in agreement with our previous studies, (Cook et al., 2019b; Han et al., 2020a; Han et al., 2020b), wherein we have shown that standalone ML models–including the random forests-based DL model–generally exhibit moderate-to-poor prediction performance over datasets that feature highly nonlinear and non-monotonous input-output correlations. The FT-DL model–in which the database is FFT-transformed prior to the model’s training–produces accurate predictions; because the FFT transformation substantially reduces the nonlinearity and non-monotonicity of the database, by transforming it from the original domain to the frequency domain (see Figure 3). Put in another way: the FFT algorithm converts each data-series to a simple, broadly monotonic Y-X relationship; thereby, making it easier for the FT-DL model to establish the underlying mathematical relationship between the output and input. The DL model–on the other hand–must employ brute-force statistical methods to establish Y-X relationship from the highly complex data-series; and, consequently, is susceptible to missing key inflection points (peaks and troughs) and other vicissitudes (e.g., sharp changes in Y occurring over small ranges of X) in the data-series.
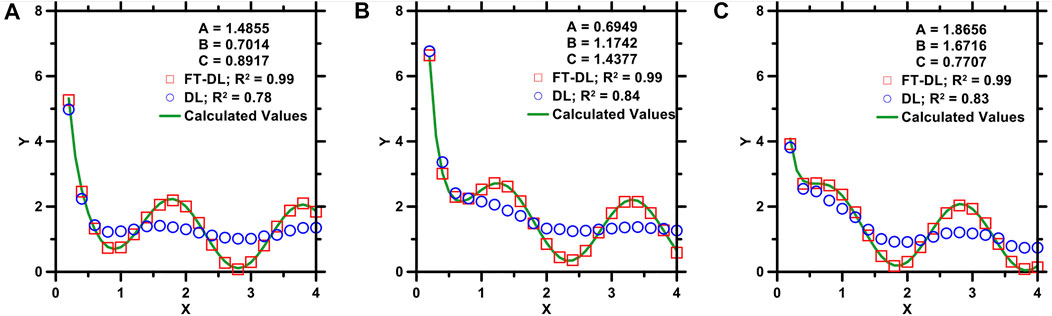
FIGURE 4. Representative predictions of Y of mathematical functions produced by the DL and FT-DL models plotted against calculated Y values. The input, X, ranges from 0.2 to 2.0. The coefficients (A–C) used in the functions, and the models’ prediction accuracies (R2), are shown in the legends.
Prediction of Heat Flow Rate Profiles of Pastes
Results in section 3.1 demonstrate that the FT-DL model can produce accurate predictions; even in data-domains featuring complex input-output correlations. Since Y-X relationships shown in Figure 4 are similar in nature to heat flow rate profiles of (PC + SCM) pastes, it is reasonable to posit that the FT-DL model would produce more accurate predictions of PC hydration kinetics compared to those produced by the DL model. To test this hypothesis, a calorimetry database–comprising heat flow rate profiles of (PC + SCM) pastes–was consolidated from our two prior studies. (Cook et al., 2021b; Lapeyre et al., 2021). The combined database consists of eight types of PCs: one commercial cement (CC; type I/II PC); and seven synthetic cements (SCs). Phase compositions of the 8 PCs are shown in Table 1. The SCMs comprise permutations-and-combinations of quartz (QZ); limestone (LS); metakaolin (MK); and silica fume (SF). Other details of this database are described in Supplementary Section S2.0. The parent database was split into training and testing databases. The training database consisted of 13,416 data-records from 559 (PC + SCM) pastes; and the testing database consisted of 960 data-records from 40 (PC + SCM) pastes. The training database was used for training the FT-DL model (and the DL model for comparison), and optimizing the models’ hyperparameters. The testing database was used to evaluate the prediction performance of the trained models against experimental measurements. Both databases include physicochemical attributes of the pastes as inputs: C3S content (%mass); C2S content (%mass); C3A content (%mass); C4AF content (%mass); C$H2 content (%mass); types (integers) and contents (%mass) of SCMs; specific surface area (SSA) of PC and SCMs (cm (Biernacki et al., 2017). g−1); and time (hour). The output is time-dependent heat flow rate (mW. gCem−1) from 0-to-24 h, with a 1-h time-interval between successive steps. Pertinent statistical variations in the inputs and outputs of the training and testing databases are shown in Supplemetary Table S1 and Supplemetary Table S2.
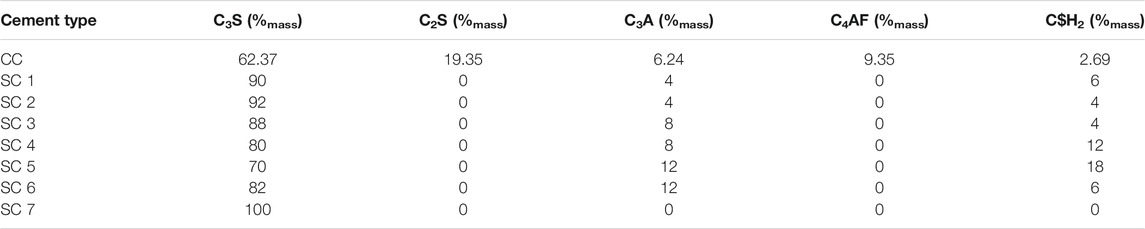
TABLE 1. Compositions of commercial cement (CC) and synthetic cements (SCs) 1–7.
Figure 5 shows representative predictions of heat flow rate profiles produced by the DL and FT-DL models compared against experimental (isothermal calorimetry) measurements. Prediction errors are summarized in Table 2; and depicted graphically in Supplementary Figure S1. As shown in Figure 5 and Table 2, both DL and FT-DL models produce accurate predictions of heat flow rate profiles of (PC + SCM) pastes; with R2 ranging from 0.79 to 0.89, and MAE ranging from 0.32 to 0.58 mW gCem−1. The FT-DL model–across the board–produces more accurate predictions compared to the DL model; validating the hypothesis made earlier in this section. Importantly, the FT-DL model is able to produce accurate a priori predictions of heat flow rates of new (PC + SCM) pastes (i.e., new to the model); even during early ages (i.e., between 1 h and ±2 h of the main hydration peak) when the heat flow rates change rapidly from very high values (during stage I) to very low values (during stage II), and then again to high values (during stage III). Each SCM–depending on its content; physical properties (mainly fineness); and composition–casts unique influence on the heat flow rate profile. For example, fine limestone and fine quartz cause leftward shift of the heat flow rate profile; (Cook et al., 2019a); resulting in steeper rise to, and earlier occurrence of, the main hydration peak. In contrast, fine metakaolin, when used to replace ≽20%mass of PC, causes deceleration of PC’s hydration kinetics; (Lapeyre and Kumar, 2018; Cook et al., 2019a; Lapeyre et al., 2019); which manifests as delayed occurrence of the main hydration peak (although the peak’s intensity is comparable to, and sometimes greater than, that of its plain paste counterpart). Coarse metakaolin also causes deceleration of PC’s hydration rates; but–owing to metakaolin’s slow dissolution kinetics–the deceleration is minor, sometimes imperceptible (Lapeyre et al., 2019). Notwithstanding these disparate influences of SCMs, Figure 5 and Table 2 demonstrate that the FT-DL model can capture the effects of SCM type and physicochemical attributes during its training; and capitalize on this knowledge to produce reliable predictions of hydration behavior of new [PC + SCM] pastes. The DL model–on the other hand–fails to capture the critical inflection points of the heat flow rate profiles. As can be seen in Figure 5, for each of the three (PC + SCM) pastes, DL model’s predictions of the time of occurrence and intensity of the main hydration peak are not accurate. The main hydration peak is a critical juncture of the hydration process; as it is indicative of the period that generally occurs a few hours after the paste sets, and begins to gain strength at a rapid rate due to massive precipitation of hydrates. (Mehta and Monteiro, 1976; Taylor, 1997; Bullard et al., 2011; Mehdipour et al., 2017). Because of the significance of the main hydration peak, in many prior studies, (Kumar et al., 2012; Scherer et al., 2012; Oey et al., 2013; Masoero et al., 2014; Ley-Hernandez et al., 2018), the accuracies of kinetic models (and the underlying mechanisms that were implemented within the models) have been adjudicated–almost exclusively–on the basis of whether or not they were able to capture the experimentally-observed main hydration peak. Since the DL model was unable to capture the main hydration peak–whereas the FT-DL model was–it is justified to say that the FT-DL model is the more reliable tool to produce a priori predictions of heat evolution profiles of cementitious binders.
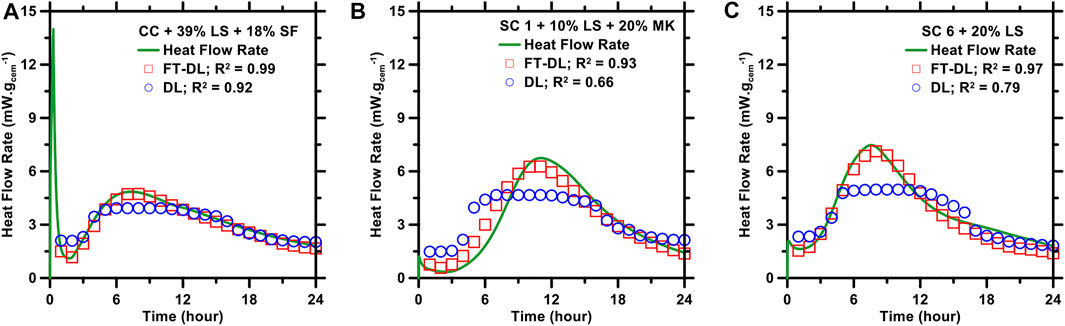
FIGURE 5. The FT-DL and DL models’ predictions of heat flow rate profiles of: (A) (commercial cement (CC) + limestone (LS) + silica fume (SF)])paste; (B) [synthetic cement 1 (SC 1) + limestone (LS) + metakaolin (MK)] paste; and (C) [synthetic cement 6 (SC 6) + limestone (LS)] paste compared against experimental measurements. Coefficient of determination (R2) of each prediction is shown in the legends.
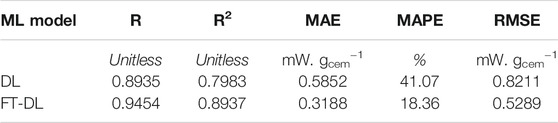
TABLE 2. Statistical parameters describing the mean prediction errors (i.e., averaged over a period of 24 h) of DL and FT-DL models. Errors were estimated by comparing predicted heat flow rate profiles of (PC + SCM) pastes against experimentally-measured ones. Time-solved prediction errors are descried in Supplemetary Information.
As stated earlier in section 3.1, the disparity in the prediction performance of the DL model vis-à-vis the FT-DL model arises, mainly, from the FFT algorithm; which is integrated in the latter model, but not in the former. In the FT-DL model, the FFT algorithm–which is used to preprocess the training database prior to the model’s training–substantially reduces the nonlinearity and non-monotonicity of heat flow rate profiles; thereby, reducing their complexity (see Figure 3). This reduction in complexity becomes particularly important when the volume of the training database is low (e.g., the database used in this study, which comprises heat flow rate profiles of only ∼600 pastes). If a large database were used, most ML models–including the DL model–would be able to statistically (i.e., by brute-force) process input-output maps–with both inputs and outputs spanning a wide range of magnitudes–and establish a sufficiently-accurate mathematical correlation between them. But, in a small but complex database, establishing such correlation is not easy. Furthermore, the FFT-transformed heat flow rate profiles contain fewer data-records compared to the original ones; this ensures that the computational resources (e.g., number of processing threads; memory; etc.) required to train the FT-DL model are substantially less than the DL model.
Prediction of Cumulative Heat Release
Results in section 3.2 show that the FT-DL model is a reliable tool for a priori predictions of time-dependent heat flow rate profiles–or hydration kinetics–of (PC + SCM) pastes. These predicted heat flow rate profiles can simply be processed (i.e., integrated with respect to time) to obtain time-dependent cumulative heat release profiles. Cumulative heat release profiles are important for a practical standpoint; as several past studies have shown that the cumulative heat released from PC’s hydration in a binder is directly correlated with the binder’s rheological properties, (Mehdipour et al., 2017; Meng et al., 2019; Ferraz et al., 2020), setting time, (Vance et al., 2013b; Lootens and Bentz, 2016), and compressive strength. (Bentz et al., 2012; Kumar et al., 2013a; Kumar et al., 2013b; Mehdipour et al., 2017). Put in another way: cumulative heat release profiles can be used to roughly estimate important compliance-relevant properties of binders; thus, eliminating the need for costly, cumbersome, and time-consuming experiments. For instance, if the 24-h cumulative heat releases of [PC + SCM] pastes are known, this information can be used to rank and order the pastes on the basis of their 24-h compressive strengths. (Bentz et al., 2012; Mehdipour et al., 2017).
In this study, the predicted heat flow rate profiles of all (PC + SCM) pastes (in the testing database) were processed to obtain cumulative heat release profiles; which were then compared against experiments. It was found–expectedly, as discussed in section 3.1—that the FT-DL model’s predictions were more accurate than those produced by the DL model. However, the prediction errors–as evaluated using the five statistical parameters discussed in section 2.0—were, in general, greater than those associated with predictions of heat flow rate profiles. This is because the prediction errors of heat flow rate profiles accrue as they are integrated to obtain the cumulative heat release profiles. Therefore, to obtain reliable predictions of cumulative heat release–especially at critical ages (e.g., at 24 h, at which the paste’s strength is used as a qualification criterion for use in construction of infrastructure (Taylor et al., 2015))—it is important to further finetune the FT-DL model. Towards this end, thermodynamic simulations of phase assemblages in the pastes (summarized below; and in Supplementary Section S3.0 of Supplementary Information S1) were used to provide theoretical guidance to the FT-DL model, and to constrain its outputs.
GEMS (Lothenbach et al., 2019; Kulik et al., 2012) was used to produce thermodynamic simulations of phase assemblage evolution in (PC + SCM) pastes in relation to their mixture design (i.e., composition and mixture proportions of precursors used to formulate the binders). Phase assemblages obtained from the simulations (see Figures 6A,B) reveal the volumes of all reactants (i.e., PC; and SCMs) and products (i.e., hydration products such as C-S-H and ettringite) at increasing degrees of reaction of the main reactant (PC or SCM). (Lothenbach and Winnefeld, 2006; Lothenbach et al., 2008). To obtain accurate phase assemblages, it is important to specify the degree of reaction of PC and of the SCM (if it is reactive). PC’s degree of reaction at any given age–for example, at 24 h–can be estimated directly from the cumulative heat release at that age. More specifically: PC’s degree of reaction in each paste at 24 h is equivalent to the ratio of cumulative heat release at 24 h to the enthalpy of hydration of PC. The enthalpy of hydration of each PC (i.e., either the commercial PC, or one of the seven synthetic ones) is calculated as the sum of enthalpies of hydration of each of its constituent phases [C3S ≈ 500 J g−1; C2S ≈ 260 J g−1; C3A (reacting with C$H2) ≈ 1160 J g−1; and C4AF ≈ 725 J g−1 (Taylor, 1997; Kurdowski, 2014).] multiplied to its respective mass fraction. In this study, four different types of SCMs were used: quartz; limestone; silica fume; and metakaolin. Quartz and limestone dissolve at very slow rates; as, as such, in the thermodynamic simulations, they were assumed to be inert (i.e., degree of reaction at 24 h = 0.0) (Cook et al., 2019a; Oey et al., 2013; Kumar et al., 2017; Berodier and Scrivener, 2014). Silica fume and metakaolin–on the other hand–dissolve (albeit slowly), and can partake in chemical interactions with anhydrous cementitious phases (e.g., metakaolin can react with C3A and C$H2) and hydrates (e.g., metakaolin and silica fume can undergo pozzolanic reaction with portlandite, a hydrate present in the paste). (Cook et al., 2019a; Lapeyre et al., 2019; Lapeyre and Kumar, 2018; Meng et al., 2019). Therefore, to obtain accurate phase assemblages of metakaolin- and silica fume-containing pastes, it is important to determine their degrees of reaction. In a series of prior studies, (Cook et al., 2019a; Lapeyre et al., 2019; Lapeyre and Kumar, 2018; Meng et al., 2019), it has been shown that the degrees of reaction of silica fume and metakaolin range between 5-and-15% within the first 24 h. To determine the precise degrees of reaction at 24 h, GEMS simulations of all [PC + SCM] pastes were employed by varying silica fume’s and metakaolin’s degree of reaction from 5-to15%; while using PC’s degree of reaction at 24 h as calculated from cumulative heat release profiles, and assuming that limestone and quartz are inert. Based on the simulation results (Figure 6B), it was found that across all (PC + silica fume) and (PC + metakaolin) pastes, a degree of reaction of 12% for silica fume and degree of reaction of 6% for metakaolin resulted in a near linear relationship between the cumulative heat release and the volume fraction of hydrates (Figure 6C). We chose specifically to evaluate this relationship to estimate the pozzolanic SCMs’ degrees of reaction, because cumulative heat release of any (PC + SCM) paste is correlated with the extents of reaction of the reactants (i.e., PC and SCM); which, in turn, dictates the amounts (or volume fractions) of the hydrates. In Figure 6C, it should be noted that results pertaining to plain pastes [PC + quartz] pastes, and (PC + limestone) pastes are also included; which justify our assumption that limestone and quartz are inert in the first 24 h. An important aspect of Figure 6C is the generic mathematical equation that describes the relationship between cumulative heat release and volume fraction of hydrates in ∼600 (PC + SCM) pastes. It should be noted that both the cumulative heat and volume fraction of hydrates account for not just the hydration of cement but also cement-SCM interactions. This relationship–in and of itself–is an important outcome; since, it allows researchers to promptly estimate the volume fraction of hydrates in any given (PC + SCM) paste using its 24 h cumulative heat release as the sole input. The volume fraction of hydrates–which is a crude measure of the solid-to-solid connectivity within the paste (Zalzale and McDonald, 2012; Zalzale et al., 2013; Lootens and Bentz, 2016; Banala and Kumar, 2017)—can be used to roughly estimate the compressive strength and porosity of the paste. The authors would like to clarify that the volume fractions of hydrates in (PC + SCM) pastes–shown in Figure 6C–can be predicted directly from the FT-DL model; as opposed to deriving them from GEMS simulations. For this, the FT-DL model needs to be trained using a new database; comprising the same input variables as those described in section 3.2, and the volume fraction of hydrates (estimated from GEMs simulations) as the output. Once trained, the FT-DL model can predict the volume fraction of hydrates in a new (PC + SCM) paste using its mixture proportion and physiochemical attributes as inputs. Therefore, it can be said that the FT-DL model can not only produce reliable, a priori predictions of hydration kinetics but also of phase assemblages of (PC + SCM) pastes.
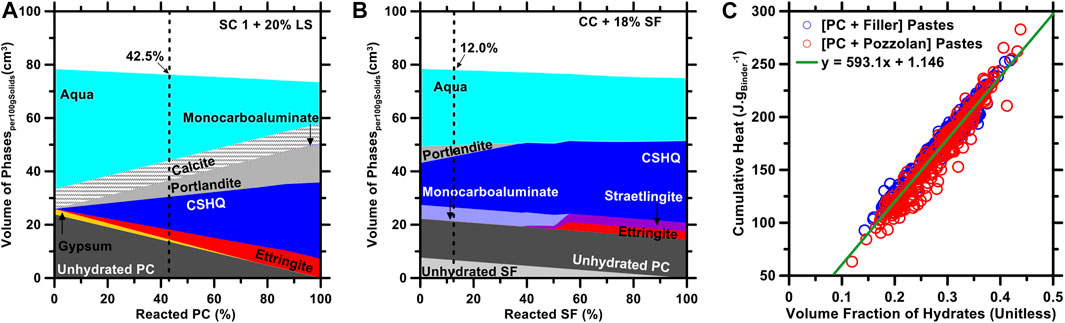
FIGURE 6. (A) Equilibrium phase assemblage, estimated using GEMS, of a representative (synthetic cement 1 + limestone (LS) paste at 24 h. The vertical dashed line indicates the phase assemblage at 24 h based on the degree of hydration of PC as estimated from the cumulative heat release. (B) Equilibrium phase assemblage of a representative [commercial cement + silica fume (SF)] paste at the age of 24 h. Here, the degree of hydration of PC at 24 h is estimated from isothermal calorimetry. The vertical dashed line represents the degree of reaction of silica fume. (C) A linear correlation between volume fraction of hydrates and cumulative heat release at 24 h of ∼600 [PC + SCM] pastes used in this study (PC + pozzolan) pastes are silica fume- and metakaolin-containing pastes; and (PC + filler) pastes are either plain pastes, or pastes that contain limestone or quartz.
Outcomes of thermodynamic simulations–shown in Figure 6C–allow us to correlate the cumulative heat release (at 24 h) with the volume fraction of hydrates in (PC + SCM) pastes. In this study, this correlation was used as a thermodynamic constraint to guide and regulate the predictions of 24 h cumulative heat release of (PC + SCM) pastes. More specifically, for any given (PC + SCM) paste, the heat flow rate profile–and then the cumulative heat release at 24 h–was predicted using the FT-DL model described in sections 3.1 and 3.2. Next, the predicted value of the 24 h cumulative heat release was compared with the cumulative heat release derived from Figure 6C (using the paste’s phase assemblage (i.e., volume fraction of hydrates at 24 h), calculated from thermodynamic simulations (GEMS), as input]. If the deviation between the two predictions was found to be smaller than 10 J. gcem−1, the prediction from the FT-DL model was selected as the final output. Otherwise, the cumulative heat release from the thermodynamic simulations was selected as final output. Figure 7 compares the predictions of 24-h cumulative release of (PC + SCM) pastes obtained using the unconstrained FT-DL model and the thermodynamically-constrained FT-DL model. The corresponding prediction errors are summarized in Table 3. As can be seen, predictions of 24 h cumulative heat release from the thermodynamically-constrained FT-DL model are significantly more accurate than the unconstrained FT-DL model. This result clarifies that guidance from thermodynamic simulations significantly boosts the ability of the FT-DL model to predict the hydration kinetics of (PC + SCM) pastes. It must be noted that, in Figure 7, the 24 h cumulative heat release of the pastes is used merely as a representative example. The thermodynamically-constrained FT-DL model can be used–in similar fashion–to produce a priori predictions of the cumulative heat release at other ages (0 ≤ age ≤24 h) as well.
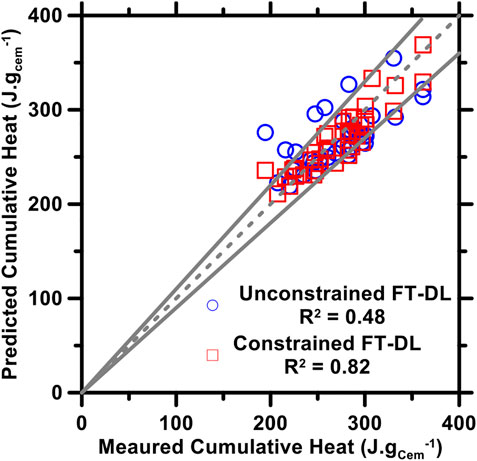
FIGURE 7. Predictions of cumulative heat at 24 h produced by the FT-DL model–with and without thermodynamic constraint–compared against experimental measurements. The coefficients of determination (R2) of the predictions are shown in the legends. The dashed and solid lines represent the line of ideality and ±10% error bounds, respectively.
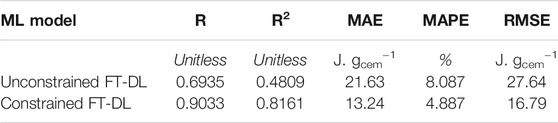
TABLE 3. Statistical parameters describing the errors in predictions of 24 h cumulative heat release, as produced by the unconstrained and thermodynamically-constrained FT-DL models.
Discussion
Development of a Closed-form Analytical Model
Results in section 3.0 show that the FT-DL model–especially when integrated with thermodynamic guidance and constraints–can produce reliable, a priori predictions of hydration kinetics and phase assemblages (e.g., volume fraction of hydrates at a given age) of (PC + SCM) pastes. It must, however, be acknowledged that the FT-DL model–while powerful–is not accessible to end-users; especially those who have limited background in computer programming. Hence, it is important that the learnings of the FT-DL model be distilled down to simple, closed-form analytical models that can be used by end-users of all expertise and disciplines. Such distillation of the FT-DL model into an analytical model also improves the interpretability of the outcomes; as in an analytical model the correlation between each input (e.g., physicochemical properties of binders’ precursors) and the output (i.e., cumulative heat release at 24 h) is clearly outlined in the form of a mathematical equation.
To develop a reliable analytical model, it is crucial to select input variables that cast significant influence on the output, while disregarding those which are largely inconsequential. The “DL” part of the FT-DL model is important in this context; because, it can statistically evaluate–in the form of Gini scores (Xu et al., 2021; Han et al., 2020a; Han et al., 2020b; Breiman, 2001; Menze et al., 2009)—the influence of each variable on the output. Results from this analysis are shown in Figure 8. Here, the contents of C$H2, C3S, C3A, and SCM cast the strongest influence on the 24 h cumulative release. C3S–being the major phase in PC (Taylor, 1997)—is expectedly an influential factor. C3A and C$H2 are also influential because these two phases react with each other (and water) vigorously within minutes of mixing; thereby releasing heat at a rapid rate for few hours, followed by relatively slow, near-constant rate of heat release. (Taylor, 1997; Bullard et al., 2011; Kurdowski, 2014). SCM content and specific surface area (SSA) are also influential; as these variables dictate the ability of the SCM to influence the overall hydration kinetics through the filler effect, and/or pozzolanic effect, and/or chemical interactions with other paste components. (Juenger and Siddique, 2015; Lapeyre and Kumar, 2018; Cook et al., 2019a; Lapeyre et al., 2019). C2S and C4AF react very slowly with water in the first 24 h; thus, their effects on the overall hydration kinetics are not significant. (Bullard et al., 2011; Cook et al., 2021a). SSA of PC is known to profoundly affect its hydration kinetics (Bullard et al., 2011). However, owing to limited variability in SSA of PC in the database used in this study, it is evaluated as the less influential. SCM type is appraised to be the least important variable. This–once again–is because only two types of SCMs (fillers and pozzolans) were used in this study.
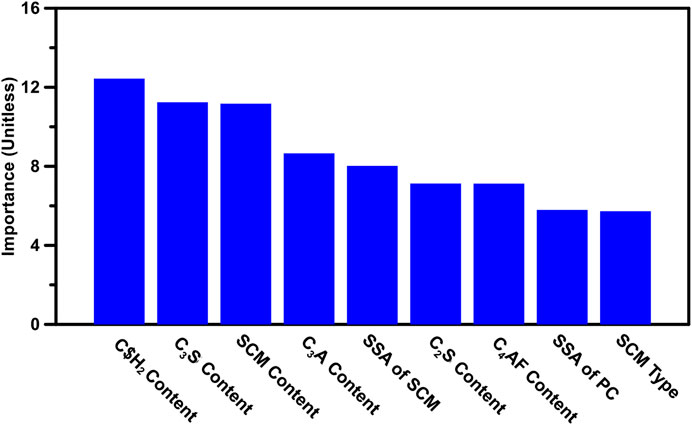
FIGURE 8. Ranking of input variables (descending order of variable importance), based on their abilities to influence the 24-h cumulative release of (PC + SCM) pastes at 24 h.
Variable importance, shown in Figure 8, was used to guide the mathematical form of the closed-form analytical model. SCM type, C2S content, and C4AF content were excluded due to their low variable importance; but the other influential input variables were included. C$H2 content and C3S content were assigned greater weight; by raising them to the second power. The general form of the analytical model, thus developed, is shown in Eq. (3). Here, CH is the cumulative heat release at 24 h (J.gcem−1); Ci is the coefficient for each input variable; Mi is mass percentage of component i (%mass); and Aj is SSA of component j (cm (Biernacki et al., 2017).g−1).
In the analytical model, six coefficients and one constant need to be optimized. Those coefficients were optimized for two scenarios: 1) (PC + pozzolan) pastes; and 2) (PC + filler) pastes; wherein silica fume and metakaolin are treated as pozzolans, and limestone and quartz are treated as fillers (as discussed in section 3.3). A nonlinear, gradient-descent scheme (Han et al., 2020a; Han et al., 2020b; Lapeyre et al., 2021)—based on the Nelder-Mead multi-dimensional simplex algorithm (Nelder and Mead, 1965; McKinnon, 1998)—was used to optimize the coefficients of the analytical model. The optimal coefficients for (PC + pozzolan) pastes and (PC + filler) pastes are shown in Table 4. Final predictions of the 24 h cumulative heat release of both types of pastes are shown in Figure 9.
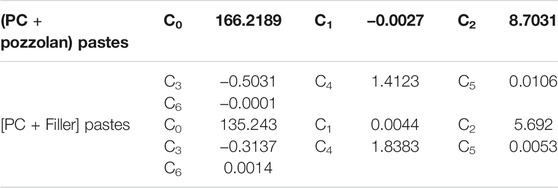
TABLE 4. Optimum values of coefficients and the constant for the analytical model shown in Eq. 3. The model can be used to estimate the 24 h cumulative heat release of (PC + pozzolan) pastes and (PC + filler) pastes.
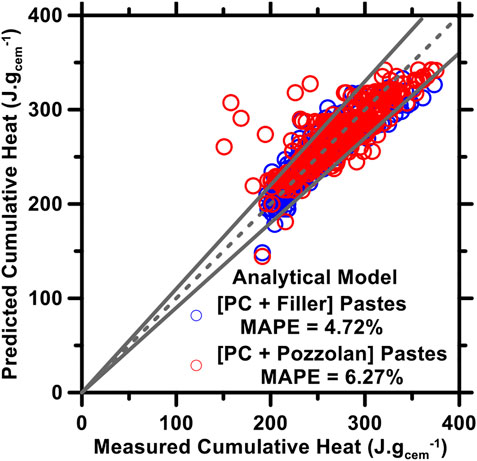
FIGURE 9. Predictions of 24-h cumulative heat of (PC + pozzolan) pastes and (PC + filler) pastes compared against experimental measurements. Mean absolute percentage errors (MAPE) of the predictions are shown in the legends. The dashed and solid lines represent the line of ideality and ±10% error bounds, respectively.
As can be seen in Figure 9, the analytical model–despite being much simpler and easier-to-use than its parent model (FT-DL model)—produces accurate predictions (i.e., margin of error within ±6.3%) of 24 h cumulative heat release of (PC + pozzolan) and (PC + filler) pastes. The values of R are 0.81 and 0.90 for (PC + pozzolan) pastes and (PC + filler) pastes, respectively; which are commensurable to that of the FT-DL model (R ≈ 0.90). Importantly, the analytical model has a simple polynomial form; which can be coded into any spreadsheet software by end-users of all disciplines and expertise to produce a priori predictions of heat evolution behavior of (PC + SCM) pastes; using just a few mixture design parameters as inputs. It is worth pointing out that in Figure 9, the 24 h cumulative heat release is used as a representative example. Using the method described in this section, cumulative heat release at other critical ages can also be predicted. Furthermore, the cumulative heat release predictions produced by the analytical model can be plugged into the equation shown in Figure 6C to directly estimate the volume fraction of hydrates in the (PC + SCM) pastes. Therefore, as a standalone prediction tool, the analytical model–although not as sophisticated or accurate as the FT-DL model–can be used for a priori predictions of important aspects of both hydration kinetics and phase assemblage development in PC-based binders.
Conclusion
Supplementary cementitious materials (SCMs: e.g., limestone; calcined clays; etc.) are typically used to partially replace Portland cement (PC) in concrete to reduce its energy-intensity and carbon footprint. SCMs–depending on their composition; physical properties (e.g., fineness); and content–cast significant influence on PC’s hydration behavior; thus, affecting nearly all fresh- and mature-state properties of concrete. For decades, researchers have attempted to develop analytical models–premised on theories and mechanisms learned from classical materials science approaches–that would be able to produce a priori predictions of (PC + SCM) binders. While the pursuit of theory-based models is essential for the advancement of our understanding of underlying composition-reaction-microstructure-property correlations in (PC + SCM) binders, our current piecemeal understanding of these correlations has thus far stymied the development of such models.
In recent years, machine learning (ML)—coupled with a large database (i.e., Big data); comprised of experimental measurements, and/or experimentally-validated simulations–has emerged as a promising approach to learn the intrinsic cause-effect correlations in materials, including (PC + SCM) binders (e.g., pastes); and, then, to capitalize on such learnings to predict the properties of new materials by simply using their easy-to-measure physicochemical characteristics as inputs. While promising, widespread use of ML models is hindered because they: 1) Require “Big” data for their training (which is difficult to produce, or mine from literature); and 2) Provide little-to-no insights into the origins of the materials’ behavior/properties (and, thus, are perceived as black boxes).
In this study, an original deep learning (DL) model was developed, with the objective of predicting hydration kinetics (i.e., time-dependent heat flow rate, and cumulative heat release), and phase assemblage development (e.g., volume fraction of hydrates at a specific age) in (PC + SCM) pastes. A fast Fourier transformation (FFT) algorithm was integrated into the model: to reduce the dimensionality of the database used to train the DL model; and to make it easier, and computationally efficient, for the model to learn the input-output correlations from a relatively small database (comprised of reaction behavior of only ∼600 distinct [PC + SCM] pastes). Results obtained from extramural thermodynamic simulations (conducted using GEMS: a free-to-use, and publicly accessible, thermodynamic modeling software) were also integrated into the model: to provide theoretical guidance to the model; and to constrain its outputs, to ensure that they do not violate basic thermodynamic rules. It was shown that the model–i.e., thermodynamically-constrained FT-DL model–produced accurate a priori predictions of hydration behavior and phase assemblage development of (PC + SCM) pastes. The training and outcomes of the FT-DL model were then used to develop a closed-form analytical model. The analytical model–albeit not as sophisticated or accurate as the FT-DL model–was shown to be a simple, easy-to-use prediction tool to produce reliable a priori predictions of important aspects of both hydration kinetics and phase assemblage development in (PC + SCM) binders.
The FT-DL model–and its simpler derivative, the closed-form analytical model–that are presented in this study demonstrate that, even with small data (rather than Big data), reliable predictions of reaction behavior and microstructural evolution (phase assemblage) of cementitious systems are possible. As with any ML model, it is expected that the FT-DL model’s accuracy would improve if/when it is trained with a larger, more diverse Big Data. Such a Big Data/FT-DL platform–if created and disseminated–would give researchers and end-users unprecedented access to data (information); and empower them with reliable prediction (and optimization) tools to tune locally-available–but often overlooked and/or underutilized–materials (e.g., volcanic, and off-specification ash; waste-to-energy residue produced from incineration of municipal waste) to function as CO2-efficient SCMs.
Data Availability Statement
The database, machine learning model, thermodynamic model, and code used in this study are available from the corresponding author (AK; a3VtYXJhZEBtc3QuZWR1) by request.
Author Contributions
SP and RC: Database development and manuscript development TH and JH: Development and validation of ML models; and development of manuscript AK and GS: Manuscript development and review.
Funding
Financial support for this research was provided by: the Leonard Wood Institute (LWI: W911NF-07-2-0062); the National Science Foundation (NSF-CMMI: 1661609; NSF-CMMI: 1932690; and NSF-DMR: 2034856); and the Federal Highway Administration (Award no: 693JJ31950021).
Conflict of Interest
The authors declare that the research was conducted in the absence of any commercial or financial relationships that could be construed as a potential conflict of interest.
Publisher’s Note
All claims expressed in this article are solely those of the authors and do not necessarily represent those of their affiliated organizations, or those of the publisher, the editors and the reviewers. Any product that may be evaluated in this article, or claim that may be made by its manufacturer, is not guaranteed or endorsed by the publisher.
Supplementary Material
The Supplementary Material for this article can be found online at: https://www.frontiersin.org/articles/10.3389/fmats.2021.796476/full#supplementary-material
References
Antoni, M., Rossen, J., Martirena, F., and Scrivener, K. (2012). Cement Substitution by a Combination of Metakaolin and limestone. Cement Concrete Res. 42, 1579–1589. doi:10.1016/j.cemconres.2012.09.006
Banala, A., and Kumar, A. (2017). Numerical Simulations of Permeability of plain and Blended Cement Pastes. Int. J. Adv. Eng. Sci. Appl. Math. 9, 67–86. doi:10.1007/s12572-017-0184-7
Bazzoni, A., Ma, S., Wang, Q., Shen, X., Cantoni, M., and Scrivener, K. L. (2014). The Effect of Magnesium and Zinc Ions on the Hydration Kinetics of C3 S. J. Am. Ceram. Soc. 97, 3684–3693. doi:10.1111/jace.13156
Bazzoni, A. (2014). Study of Early Hydration Mechanisms of Cement by Means of Electron Microscopy. Lausanne: EPFL.
Bentz, D. P., Barrett, T., De la Varga, I., and Weiss, W. J. (2012). Relating Compressive Strength to Heat Release in Mortars. Adv. Civ. Eng. Matls. 1, 20120002. doi:10.1520/acem20120002
Bergland, G. D. (1969). A Guided Tour of the Fast Fourier Transform. IEEE Spectr. 6, 41–52. doi:10.1109/mspec.1969.5213896
Berodier, E., and Scrivener, K. (2014). Understanding the Filler Effect on the Nucleation and Growth of C-S-H. J. Am. Ceram. Soc. 97, 3764–3773. doi:10.1111/jace.13177
Biernacki, J. J., Bullard, J. W., Sant, G., Brown, K., Glasser, F. P., Jones, S., et al. (2017). Cements in the 21 St century: Challenges, Perspectives, and Opportunities. J. Am. Ceram. Soc. 100, 2746–2773. doi:10.1111/jace.14948
Bullard, J. W. (2008). A Determination of Hydration Mechanisms for Tricalcium Silicate Using a Kinetic Cellular Automaton Model. J. Am. Ceram. Soc. 91, 2088–2097. doi:10.1111/j.1551-2916.2008.02419.x
Bullard, J. W., Jennings, H. M., Livingston, R. A., Nonat, A., Scherer, G. W., Schweitzer, J. S., et al. (2011). Mechanisms of Cement Hydration. Cement Concrete Res. 41, 1208–1223. doi:10.1016/j.cemconres.2010.09.011
Bullard, J. W., Scherer, G. W., and Thomas, J. J. (2015). Time Dependent Driving Forces and the Kinetics of Tricalcium Silicate Hydration. Cement Concrete Res. 74, 26–34. doi:10.1016/j.cemconres.2015.03.016
Buseck, P. R., Epelboin, Y., and Rimsky, A. (1988). Signal Processing of High-Resolution Transmission Electron Microscope Images Using Fourier Transforms. Acta Cryst. Sect A. 44, 975–986. doi:10.1107/s0108767388007500
Cadavid-Giraldo, N., Velez-Gallego, M. C., and Restrepo-Boland, A. (2020). Carbon Emissions Reduction and Financial Effects of a Cap and Tax System on an Operating Supply Chain in the Cement Sector. J. Clean. Prod. 275, 122583. doi:10.1016/j.jclepro.2020.122583
Cai, R., Han, T., Liao, W., Huang, J., Li, D., Kumar, A., et al. (2020). Prediction of Surface Chloride Concentration of marine concrete Using Ensemble Machine Learning. Cement Concrete Res. 136, 106164. doi:10.1016/j.cemconres.2020.106164
Chen, I. A., and Juenger, M. C. G. (2011). Synthesis and Hydration of Calcium Sulfoaluminate-Belite Cements with Varied Phase Compositions. J. Mater. Sci. 46, 2568–2577. doi:10.1007/s10853-010-5109-9
Cochran, W. T., Cooley, J. W., Favin, D. L., Helms, H. D., Kaenel, R. A., Lang, W. W., et al. (1967). What Is the Fast Fourier Transform? Proc. IEEE 55, 1664–1674. doi:10.1109/proc.1967.5957
Cook, R., Han, T., Childers, A., Ryckman, C., Khayat, K., Ma, H., et al. (2021). Machine Learning for High-Fidelity Prediction of Cement Hydration Kinetics in Blended Systems. Mater. Des. 208, 109920. doi:10.1016/j.matdes.2021.109920
Cook, R., Han, T., Childers, A., Ryckman, C., Khayat, K., Ma, H., et al. (2021). Machine Learning for High-Fidelity Prediction of Cement Hydration Kinetics in Blended Systems. Mater. Des. 208, 109920. doi:10.1016/j.matdes.2021.109920
Cook, R., Lapeyre, J., Ma, H., and Kumar, A. (2019). Prediction of Compressive Strength of Concrete: Critical Comparison of Performance of a Hybrid Machine Learning Model with Standalone Models. J. Mater. Civ. Eng. 31, 04019255. doi:10.1061/(asce)mt.1943-5533.0002902
Cook, R., Ma, H., and Kumar, A. (2019). Influence of Size‐classified and Slightly Soluble mineral Additives on Hydration of Tricalcium Silicate. J. Am. Ceram. Soc. 103, 2764–2779. doi:10.1111/jace.16936
Cook, R., Ma, H., Okoronkwo, M., Sant, G., and Kumar, A. (2021). Influence of Water Activity on Belite (β‐C 2 S) Hydration. J. Am. Ceram. Soc. 104, 1831–1840. doi:10.1111/jace.17608
Cook, R. (2020). Studying the Effects of Various Process Parameters on Early Age Hydration of Single- and Multi-phase Cementitious Systems. Rolla, MO, USA: Missouri University of Science and Technology.
Cooley, J. W., and Tukey, J. W. (1965). An Algorithm for the Machine Calculation of Complex Fourier Series. Math. Comp. 19, 297–301. doi:10.1090/s0025-5718-1965-0178586-1
De Weerdt, K., Haha, M. B., Le Saout, G., Kjellsen, K. O., Justnes, H., and Lothenbach, B. (2011). Hydration Mechanisms of Ternary Portland Cements Containing limestone Powder and Fly Ash. Cement Concrete Res. 41, 279–291. doi:10.1016/j.cemconres.2010.11.014
Dowling, A., O'Dwyer, J., and Adley, C. C. (2015). Lime in the Limelight. J. Clean. Prod. 92, 13–22. doi:10.1016/j.jclepro.2014.12.047
Duhamel, P., and Vetterli, M. (1990). Fast Fourier Transforms: A Tutorial Review and a State of the Art. Signal. Process. 19, 259–299. doi:10.1016/0165-1684(90)90158-u
Ferraz, D. F., Martho, A. C. R., Burns, E. G., Romano, R. C. O., and Pileggi, R. G. (2020). “Effect of Mixing Procedure on the Rheological Properties and Hydration Kinetics of Portland Cement Paste,” in Rheology and Processing of Construction Materials. Editors V. Mechtcherine, K. Khayat, and E. Secrieru (Manhattan, New York City: Springer International Publishing), 311–319. doi:10.1007/978-3-030-22566-7_36
Fromherz, T. (2005). “SPECTROSCOPY-fourier Transform Spectroscopy,” in Encyclopedia of Modern Optics. Editor R. D. Guenther (Amsterdam, Netherlands: Elsevier).
Gartner, E., and Hirao, H. (2015). A Review of Alternative Approaches to the Reduction of CO2 Emissions Associated with the Manufacture of the Binder Phase in concrete. Cement Concrete Res. 78 (Part A), 126–142. doi:10.1016/j.cemconres.2015.04.012
Han, T., Siddique, A., Khayat, K., Huang, J., and Kumar, A. (2020). An Ensemble Machine Learning Approach for Prediction and Optimization of Modulus of Elasticity of Recycled Aggregate concrete. Construction Building Mater. 244, 118271. doi:10.1016/j.conbuildmat.2020.118271
Han, T., Stone-Weiss, N., Huang, J., Goel, A., and Kumar, A. (2020). Machine Learning as a Tool to Design Glasses with Controlled Dissolution for Healthcare Applications. Acta Biomater. 107, 286–298. doi:10.1016/j.actbio.2020.02.037
Hao, Y., Wang, Z. G., and Tian, J. F. (1993). A Quantitative Investigation of Fatigue Fracture Surfaces by Using the Fourier Transform Method. Mater. Sci. Eng. A 161, 195–200. doi:10.1016/0921-5093(93)90513-e
He, Z., Zhu, X., Wang, J., Mu, M., and Wang, Y. (2019). Comparison of CO2 Emissions from OPC and Recycled Cement Production. Construction Building Mater. 211, 965–973. doi:10.1016/j.conbuildmat.2019.03.289
Higgins, R. J. (1976). Fast Fourier Transform: An Introduction with Some Minicomputer Experiments. Am. J. Phys. 44, 766–773. doi:10.1119/1.10128
Ighalo, J. O., and Adeniyi, A. G. (2020). A Perspective on Environmental Sustainability in the Cement Industry. Waste Disposal Sustain. Energ. 2, 161–164. doi:10.1007/s42768-020-00043-y
Johari, M. A. M., Brooks, J. J., Kabir, S., and Rivard, P. (2011). Influence of Supplementary Cementitious Materials on Engineering Properties of High Strength concrete. Construction Building Mater. 25, 2639–2648. doi:10.1016/j.conbuildmat.2010.12.013
Juenger, M. C. G., and Siddique, R. (2015). Recent Advances in Understanding the Role of Supplementary Cementitious Materials in concrete. Cement Concrete Res. 78 (Part A), 71–80. doi:10.1016/j.cemconres.2015.03.018
Juenger, M. C. G., Snellings, R., and Bernal, S. A. (2019). Supplementary Cementitious Materials: New Sources, Characterization, and Performance Insights. Cement Concrete Res. 122, 257–273. doi:10.1016/j.cemconres.2019.05.008
Juenger, M., Provis, J. L., Elsen, J., Metthes, W., Hooton, R. D., Duchesne, J., et al. (2012). Supplementary Cementitious Materials for concrete: Characterization Needs. Mater. Res. Soc. symposia Proc. Mater. Res. Soc. 1488, imrc12. Cambridge Univ Press. doi:10.1557/opl.2012.1536
Kulik, D. A., Wagner, T., Dmytrieva, S. V., Kosakowski, G., Hingerl, F. F., Chudnenko, K. V., et al. (2012). GEM-selektor Geochemical Modeling Package: Revised Algorithm and GEMS3K Numerical Kernel for Coupled Simulation Codes. Comput. Geosci. 17, 1–24. doi:10.1007/s10596-012-9310-6
Kulik, D. A., Wagner, T., Dmytrieva, S. V., Kosakowski, G., Hingerl, F. F., Chudnenko, K. V., et al. (2013). GEM-selektor Geochemical Modeling Package: Revised Algorithm and GEMS3K Numerical Kernel for Coupled Simulation Codes. Comput. Geosciences 17, 1–24. doi:10.1007/s10596-012-9310-6
Kumar, A., Bishnoi, S., and Scrivener, K. L. (2012). Modelling Early Age Hydration Kinetics of Alite. Cement Concrete Res. 42, 903–918. doi:10.1016/j.cemconres.2012.03.003
Kumar, A., Oey, T., Falla, G. P., Henkensiefken, R., Neithalath, N., and Sant, G. (2013). A Comparison of Intergrinding and Blending limestone on Reaction and Strength Evolution in Cementitious Materials. Construction Building Mater. 43, 428–435. doi:10.1016/j.conbuildmat.2013.02.032
Kumar, A., Oey, T., Falzone, G., Huang, J., Bauchy, M., Balonis, M., et al. (2017). The Filler Effect: The Influence of Filler Content and Type on the Hydration Rate of C3S and OPC. J. Am. Chem. Soc. 100, 3316–3328. doi:10.1111/jace.14859
Kumar, A., Oey, T., Kim, S., Thomas, D., Badran, S., Li, J., et al. (2013). Simple Methods to Estimate the Influence of limestone Fillers on Reaction and Property Evolution in Cementitious Materials. Cement and Concrete Composites 42, 20–29. doi:10.1016/j.cemconcomp.2013.05.002
Lange, T., and Clare, S. (2013). “Advancements in concrete Material Sustainability: Supplementary Cementitious Material Development and Pollutant Interaction,”. UT Electronic Theses and Dissertations (Austin, USA: The University of Texas at Austin).
Lapeyre, J., Han, T., Wiles, B., Ma, H., Huang, J., Sant, G., et al. (2021). Machine Learning Enables Prompt Prediction of Hydration Kinetics of Multicomponent Cementitious Systems. Sci. Rep. 11, 3922. doi:10.1038/s41598-021-83582-6
Lapeyre, J., and Kumar, A. (2018). Influence of Pozzolanic Additives on Hydration Mechanisms of Tricalcium Silicate. J. Am. Ceram. Soc. 101, 3557–3574. doi:10.1111/jace.15518
Lapeyre, J., Ma, H., and Kumar, A. (2019). Effect of Particle Size Distribution of Metakaolin on Hydration Kinetics of Tricalcium Silicate. J. Am. Ceram. Soc. 102, 5976–5988. doi:10.1111/jace.16467
Lapeyre, J., Ma, H., Okoronkwo, M., Sant, G., and Kumar, A. (2020). Influence of Water Activity on Hydration of Tricalcium Aluminate‐calcium Sulfate Systems. J. Am. Ceram. Soc. 103, 3851–3870. doi:10.1111/jace.17046
Ley-Hernandez, A. M., Lapeyre, J., Cook, R., Kumar, A., and Feys, D. (2018). Elucidating the Effect of Water-To-Cement Ratio on the Hydration Mechanisms of Cement. ACS Omega 3, 5092–5105. doi:10.1021/acsomega.8b00097
Lootens, D., and Bentz, D. P. (2016). On the Relation of Setting and Early-Age Strength Development to Porosity and Hydration in Cement-Based Materials. Cement and Concrete Composites 68, 9–14. doi:10.1016/j.cemconcomp.2016.02.010
Lothenbach, B., Kulik, D. A., Matschei, T., Balonis, M., Baquerizo, L., Dilnesa, B., et al. (2019). Cemdata18: A Chemical Thermodynamic Database for Hydrated Portland Cements and Alkali-Activated Materials. Cement Concrete Res. 115, 472–506. doi:10.1016/j.cemconres.2018.04.018
Lothenbach, B., Matschei, T., Möschner, G., and Glasser, F. P. (2008). Thermodynamic Modelling of the Effect of Temperature on the Hydration and Porosity of Portland Cement. Cement Concrete Res. 38, 1–18. doi:10.1016/j.cemconres.2007.08.017
Lothenbach, B., and Winnefeld, F. (2006). Thermodynamic Modelling of the Hydration of Portland Cement. Cement Concrete Res. 36, 209–226. doi:10.1016/j.cemconres.2005.03.001
Ludwig, H.-M., and Zhang, W. (2015). Research Review of Cement Clinker Chemistry. Cement Concrete Res. 78 (Part A), 24–37. doi:10.1016/j.cemconres.2015.05.018
Masoero, E., Thomas, J. J., and Jennings, H. M. (2014). A Reaction Zone Hypothesis for the Effects of Particle Size and Water-To-Cement Ratio on the Early Hydration Kinetics of C3 S. J. Am. Ceram. Soc. 97, 967–975. doi:10.1111/jace.12713
McKinnon, K. I. M. (1998). Convergence of the Nelder--Mead Simplex Method to a Nonstationary Point. SIAM J. Optim. 9, 148–158. doi:10.1137/s1052623496303482
Mehdipour, I., Kumar, A., and Khayat, K. H. (2017). Rheology, Hydration, and Strength Evolution of Interground limestone Cement Containing PCE Dispersant and High Volume Supplementary Cementitious Materials. Mater. Des. 127, 54–66. doi:10.1016/j.matdes.2017.04.061
Mehta, P. K., and Monteiro, P. J. (1976). Concrete-microstructure, Properties and Materials. 2006. Utilization of palm Oil Fuel Ash in concrete: A Review. Ney York, USA: McGraw Hill Professional.
Meng, W., Kumar, A., and Khayat, K. H. (2019). Effect of Silica Fume and Slump-Retaining Polycarboxylate-Based Dispersant on the Development of Properties of portland Cement Paste. Cement and Concrete Composites 99, 181–190. doi:10.1016/j.cemconcomp.2019.03.021
Menze, B. H., Kelm, B. M., Masuch, R., Himmelreich, U., Bachert, P., Petrich, W., et al. (2009). A Comparison of Random forest and its Gini Importance with Standard Chemometric Methods for the Feature Selection and Classification of Spectral Data. BMC Bioinformatics 10, 213. doi:10.1186/1471-2105-10-213
Miller, M. M. (2013). Lime, United States Geological Survey, 2012 minerals Yearbook. Reston, VA: USGS.
Nelder, J. A., and Mead, R. (1965). A Simplex Method for Function Minimization. Comput. J. 7, 308–313. doi:10.1093/comjnl/7.4.308
Oey, T., Kumar, A., Bullard, J. W., Neithalath, N., and Sant, G. (2013). The Filler Effect: The Influence of Filler Content and Surface Area on Cementitious Reaction Rates. J. Am. Ceram. Soc. 96, 1978–1990. doi:10.1111/jace.12264
Oey, T., Kumar, A., Falzone, G., Huang, J., Kennison, S., Bauchy, M., et al. (2016). The Influence of Water Activity on the Hydration Rate of Tricalcium Silicate. J. Am. Ceram. Soc. 99, 2481–2492. doi:10.1111/jace.14181
Passoja, D., and Psioda, A. (1981). Fourier Transform Techniques- Fracture and Fatigue. ASTM STP 733, 355.
Quennoz, A., and Scrivener, K. L. (2012). Hydration of C3A-gypsum Systems. Cement Concrete Res. 42, 1032–1041. doi:10.1016/j.cemconres.2012.04.005
Ramezanianpour, A. M., and Hooton, R. D. (2014). A Study on Hydration, Compressive Strength, and Porosity of Portland-limestone Cement Mixes Containing SCMs. Cement and Concrete Composites 51, 1–13. doi:10.1016/j.cemconcomp.2014.03.006
Scherer, G. W., Zhang, J., and Thomas, J. J. (2012). Nucleation and Growth Models for Hydration of Cement. Cement Concrete Res. 42, 982–993. doi:10.1016/j.cemconres.2012.03.019
Schneider, M. (2015). Process Technology for Efficient and Sustainable Cement Production. Cement Concrete Res. 78 (Part A), 14–23. doi:10.1016/j.cemconres.2015.05.014
Schneider, M., Romer, M., Tschudin, M., and Bolio, H. (2011). Sustainable Cement Production-Present and Future. Cement Concrete Res. 41, 642–650. doi:10.1016/j.cemconres.2011.03.019
Schorcht, F. (2013). Best Available Techniques (BAT) Reference Document for the Production of Cement, Lime and Magnesium Oxide: Industrial Emissions Directive 2010/75/EU: Integrated Pollution Prevention and Control. Ispra, Italy: EU Science Hub - European Commission. Available at: https://ec.europa.eu/jrc/en/publication/reference-reports/best-available-techniques-bat-reference-document-production-cement-lime-and-magnesium-oxide.
Scrivener, K. L., Juilland, P., and Monteiro, P. J. M. (2015). Advances in Understanding Hydration of Portland Cement. Cement Concrete Res. 78, 38–56. doi:10.1016/j.cemconres.2015.05.025
Scrivener, K., Martirena, F., Bishnoi, S., and Maity, S. (2018). Calcined clay limestone Cements (LC3). Cement Concrete Res. 114, 49–56. doi:10.1016/j.cemconres.2017.08.017
Taylor, A., Hamilton, T., and Nanni, A. (2015). The Reinforced concrete Design Handbook: A Companion to ACI. volume 1. Michigan, United States: ACI, 318–414.
Thomas, J. J. (2007). A New Approach to Modeling the Nucleation and Growth Kinetics of Tricalcium Silicate Hydration. J. Am. Ceram. Soc. 90, 3282–3288. doi:10.1111/j.1551-2916.2007.01858.x
Thomas, J. J., Biernacki, J. J., Bullard, J. W., Bishnoi, S., Dolado, J. S., Scherer, G. W., et al. (2011). Modeling and Simulation of Cement Hydration Kinetics and Microstructure Development. Cement Concrete Res. 41, 1257–1278. doi:10.1016/j.cemconres.2010.10.004
United Nations (2019). Growing at a Slower Pace, World Population Is Expected to Reach 9.7 Billion in 2050 and Could Peak at Nearly 11 Billion Around 2100 | UN DESA | United Nations Department of Economic and Social Affairs. Available at: https://www.un.org/development/desa/en/news/population/world-population-prospects-2019.html.
Vance, K., Aguayo, M., Oey, T., Sant, G., and Neithalath, N. (2013). Hydration and Strength Development in Ternary portland Cement Blends Containing limestone and Fly Ash or Metakaolin. Cement and Concrete Composites 39, 93–103. doi:10.1016/j.cemconcomp.2013.03.028
Vance, K., Kumar, A., Sant, G., and Neithalath, N. (2013). The Rheological Properties of Ternary Binders Containing Portland Cement, limestone, and Metakaolin or Fly Ash. Cement Concrete Res. 52, 196–207. doi:10.1016/j.cemconres.2013.07.007
Vovk, A. I. (2000). Hydration of Tricalcium Aluminate C3A and C3A-gypsum Mixtures in the Presence of Surfacants: Adsorption or Surface Phase Formation? Colloid J. 62, 24–31.
Wagner, T., Kulik, D. A., Hingerl, F. F., and Dmytrieva, S. V. (2012). GEM-selektor Geochemical Modeling Package: TSolMod Library and Data Interface for Multicomponent Phase Models. Can. Mineral. 50, 1173–1195. doi:10.3749/canmin.50.5.1173
Xu, X., Han, T., Huang, J., Kruger, A. A., Kumar, A., and Goel, A. (2021). Machine Learning Enabled Models to Predict Sulfur Solubility in Nuclear Waste Glasses. ACS Appl. Mater. Inter. 13, 53375–53387. doi:10.1021/acsami.1c10359
Zalzale, M., and McDonald, P. J. (2012). Lattice Boltzmann Simulations of the Permeability and Capillary Adsorption of Cement Model Microstructures. Cement Concrete Res. 42, 1601–1610. doi:10.1016/j.cemconres.2012.09.003
Zalzale, M., McDonald, P. J., and Scrivener, K. L. (2013). A 3D Lattice Boltzmann Effective media Study: Understanding the Role of C-S-H and Water Saturation on the Permeability of Cement Paste. Model. Simul. Mater. Sci. Eng. 21, 085016. doi:10.1088/0965-0393/21/8/085016
Keywords: deep learning, sustaianability, hydration kinetic, prediction, thermodynamics
Citation: Han T, Ponduru SA, Cook R, Huang J, Sant G and Kumar A (2022) A Deep Learning Approach to Design and Discover Sustainable Cementitious Binders: Strategies to Learn From Small Databases and Develop Closed-form Analytical Models. Front. Mater. 8:796476. doi: 10.3389/fmats.2021.796476
Received: 16 October 2021; Accepted: 02 December 2021;
Published: 04 January 2022.
Edited by:
John L. Provis, The University of Sheffield, United KingdomReviewed by:
Neven Ukrainczyk, Darmstadt University of Technology, GermanyQiu Li, Wuhan University of Technology, China
Copyright © 2022 Han, Ponduru, Cook, Huang, Sant and Kumar. This is an open-access article distributed under the terms of the Creative Commons Attribution License (CC BY). The use, distribution or reproduction in other forums is permitted, provided the original author(s) and the copyright owner(s) are credited and that the original publication in this journal is cited, in accordance with accepted academic practice. No use, distribution or reproduction is permitted which does not comply with these terms.
*Correspondence: Aditya Kumar, a3VtYXJhZEBtc3QuZWR1; Gaurav Sant, Z3NhbnRAdWNsYS5lZHU=