 Haichang Yang
 Fanfan Zhang1,2
- 1Chinese National Engineering Research Center of Coal Preparation and Purification, China University of Mining and Technology, Xuzhou, China
- 2School of Chemical Engineering and Technology, China University of Mining and Technology, Xuzhou, China
- 3Henan Province Industrial Technology Research Institution of Resources and Materials, Zhengzhou University, Zhengzhou, China
Gaseous domains formed on solid–liquid interface have attracted scientists’ attentions in recent 2 decades, and the existence of interfacial nanobubble (INB) has been basically confirmed. However, an overall understanding on INB is still lacking. This research studied the influence of surface chemical heterogeneity on the morphology of INB by molecular dynamics simulations technique. The results showed that the gaseous domains could not nucleate on the hydrophilic substrate, while only dense gas layer (DGL) could be observed from the time-averaged density map for homogeneously hydrophobic substrate due to the random moving of INB. If there was a hydrophobic patch on the hydrophilic surface, INB could form on the hydrophobic patch with contact line being pinned at the boundary of the patch. In this case, the contact angle (gas-side) increased with the gas oversaturation degree and decreased with surface hydrophobicity of the patch. For the case that there existed a more hydrophobic patch/site on the hydrophobic surface, the INB could have moved randomly along the hydrophobic surface, but its receding contact line was pinned by the more hydrophobic patch/site. Hence, the INB could only move in the vicinity of this pinning patch/site, so that an INB profile instead of a DGL formed due to the pinning effect, and the apparent contact angle of the INB is significantly lower than the actual one. Throughout this study, the apparent INB we observed from experiments may be different from its instantaneous state and is significantly affected by surface heterogeneity.
Introduction
Interfacial nanobubble (INB) was first proposed by Parker et al. (1994) in 1994 due to the steps and the long-range attractive force in the force curve between two approaching hydrophobic surfaces. Until 2000, the first image of solid-water interfacial nanobubble was independently obtained through tapping mode of the atomic force microscopy by Lou et al. (2000) and Ishida et al. (2000). Since then, research on INBs have been extensively focused on due to their potential applications in many fields including froth flotation, protein adsorption, drag reduction, catalysis, and electrolysis (Lohse and Zhang, 2015).
INBs are usually referred to as gas aggregates that are confined in a spherical cap with height less than 100 nm and contact line diameter less than 1 μm (Alheshibri et al., 2016). According to Young–Laplace equation, the internal pressure of INB could be described as
where P is the internal pressure of INB,
Molecular dynamics (MD) simulation, as a state-of-the-art technology to simulate the nanoscale phenomenon, is an ideal method to research the nucleation and dynamics of INBs from the molecular-level insights (Pu et al., 2020). By using MD simulation, many discoveries that are hardly acquired from experimental techniques were made. Dammer and Lohse (2006) discovered the gas enrichment phenomenon at liquid–solid interface. Xiao et al. (2017) found that the MD method could simulate the process of solvent exchange that have been widely used to produce INBs in experiments. Weijs et al. (2012) researched the formation of INBs on the homogeneous surface and found that the INB could form under a low gas solubility. Maheshwari et al. (2016), Maheshwari et al. (2018), Maheshwari et al. (2020) studied the stability of INBs and found that the INBs could be pinned by the more hydrophobic part, and the INB nucleation process is affected by the surface morphology. Recently, Yen et al. (2021) demonstrated that the gas molecules might migrate from gas enrichment layer to the inside of INB through the study in potential of mean force. Wang et al. (2022) researched the interfacial phenomenon in cement fluidity and found the interfacial structure of water is influenced by the shearing fluid, which is significant in many interfacial systems such as boundary slip. However, seldom researches have been conducted to study the formation and morphology of INBs on different types of substrates.
In this study, we employed MD simulations to study how INBs are influenced by the surface heterogeneity through the formation of INB on various types of substrates including homogeneous surface with different hydrophobicity, hydrophilic surface patterned with hydrophobic patch, and medium hydrophobic surface patterned with more hydrophobic patch/site. The current work facilitates understanding the interfacial phenomenon of surface nanobubble or nanodroplet and how it affects the morphology we observed by analytical instruments.
Simulation Methodology
MD simulations were performed with the open source code GROMACS 2019.6 package (Abraham et al., 2015) and were visualized by VMD software (Humphrey et al., 1996). Like many previous studies (Lu, 2019; Maheshwari et al., 2016; Maheshwari et al., 2020), this work employed Lennard–Jones beads to represent the liquid (L), solid (S), and gas (G) particles. Solid particles were fixed in a fcc lattice, while liquid and gas particles could move freely. The expression of LJ potential used to describe the interaction between different particles is shown as follows:
where
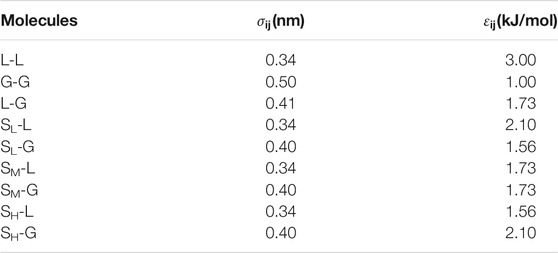
TABLE 1. LJ parameters used in simulations.
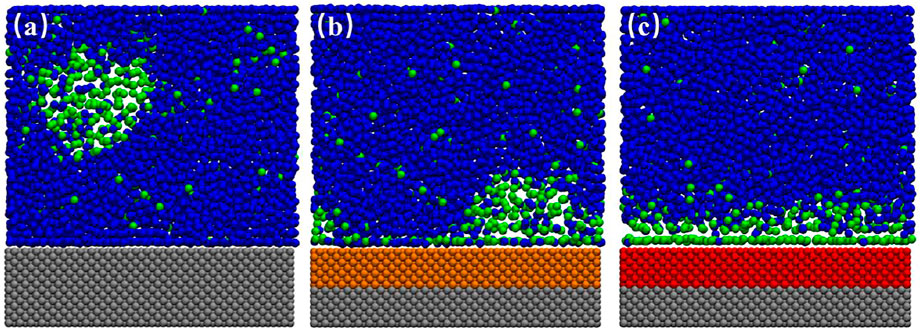
FIGURE 1. Typical snapshots of the equilibrated box for various substrates. (A) SL, (B) SM, (C) SH. In this case, 300 gas particles and 4,000 liquid particles were randomly filled into the simulation box with a typical size of 10.20 × 2.75 × 11.00 nm3 in x-, y-, and z-direction. The blue and green beads represent the liquid and gas particles, respectively, and the silver, orange, and red beads represent the fixed solid particles of SL, SM and SH.
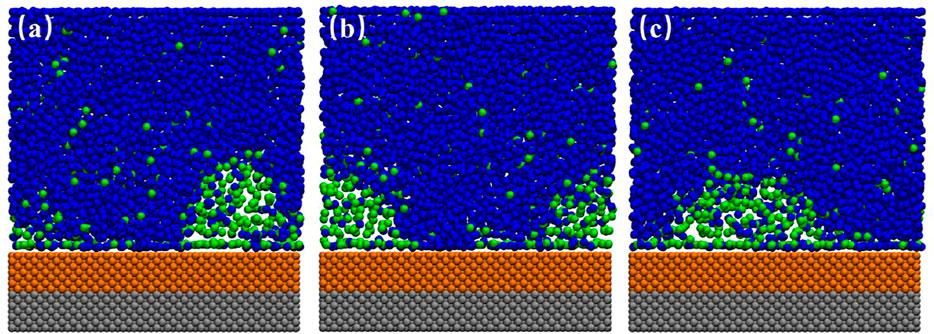
FIGURE 2. Snapshots of simulation for SM surface. (A) 20.1 ns, (B) 21.0 ns, (C) 24.5 ns. In this case, 300 gas particles and 4,000 liquid particles were randomly filled into the simulation box with a typical size of 10.20 × 2.75 × 11.00 nm3 in x-, y-, and z-direction. The blue and green beads represent the liquid and gas particles, respectively, and the silver and orange beads represent the fixed solid particles of SL and SM. A movie for the process is available as Supplementary Video S1.
After the simulation, both the average densities of gas particles and of liquid particles in each bin of 0.1 × 2.75 × 0.1 nm3 within a certain simulation time range were calculated. The obtained density distribution of gas particles was presented as a color map such as Figure 3. The density distribution of liquid particles was analyzed to calculate the contact angle. The Z coordinate of mass center of the top layer of solid plus

FIGURE 3. Time-averaged gas density distribution color maps (20–120 ns). (A) SM surface, (B) SH surface. The DGL profile were seen on both SM and SH substrates.
Results and Discussion
Gaseous Domains on Homogeneous Surfaces
Figure 1 shows the simulation snapshots of SL, SM, and SH. We could see an ordered layer of liquid particles formed adjacent to the SL surface. Bulk nanobubble is nucleated due to the gas oversaturation, but they could not adhere to the substrate because the hydrated layer on the hydrophilic surface is difficult to rupture. For SH surface, a dense gas layer (DGL) rather than an INB forms at the solid–liquid interface, which could also be seen from the averaged density map of gas molecules shown in Figure 3B. Only on a medium hydrophobic surface (SM substrate) could INB be formed.
When we inspected the trajectory of simulation for SM surface, we found that the INB moved along the solid–liquid interface randomly all the time. Figures 2A–C show the snapshots of INB formed on SM surface at three different simulation moments. The movie for the process is also available as Supplementary Video S1. The INB located at different positions at different moments. A similar phenomenon was also reported by Wu et al. (2017) who proposed that this random movement of INB was caused by the thermal fluctuation, and the movement frequency increased with the surface hydrophobicity. We believe Brownian movement might be also responsible for this phenomenon. When we averaged the density distribution of gas molecules over a time range of 100 ns, as shown in Figure 3A, we can see only a DGL profile instead of an INB on SM surface due to the rapid movement of INB, which is a visual effect from time-average rather than the instantaneous situation shown in Figure 2. Considering that the movement of INB is much faster than the temporal resolution of experimental instruments as that the former is at nanosecond magnitude while the latter is usually larger than millisecond for imaging INBs, this movement of INB is expected to influence the morphology and the calculated contact angle of the INB in experiments.
Gaseous Domains on Heterogeneous Surfaces
Hydrophilic Substrate Patterned by Hydrophobic Patch
The ideal homogeneous surface without pinning site rarely exists, and almost all the substrates coexist with heterogeneous pinning sites more or less. For hydrophilic substrate, it is usually hard to totally avoid the existence of hydrophobic patches on the surface. Figures 4, 5 show the gas density distribution maps for the hydrophilic substrates patterned by medium hydrophobic and strong hydrophobic patches, respectively, under different degrees of gas oversaturation. These results indicate that INBs could form on the hydrophobic patches patterned on the hydrophilic substrates. As shown in Figures 4, 5, the height and contact angle of INB increase with increasing gas particle number, while the width is unchanged due to contact line pinning, indicating that the height and contact angle of INBs are positively correlated with the degrees of gas oversaturation for INBs formed on the hydrophobic patches patterned on the hydrophilic substrate. However, if the degree of gas oversaturation is not high enough, such as 150 gas particles in Figure 4A or 200 gas particles in Figure 5A, a DGL instead of an INB would form, which is due to the rapid movement of small gas domain along hydrophobic patch just like what Figure 2 shows. In addition, the minimal gas particle numbers required to form an INB for SH patch is higher than that for SM patch, indicating that the minimal degree of gas oversaturation required to form INBs increases with the increase of hydrophobicity of the surface below INB.
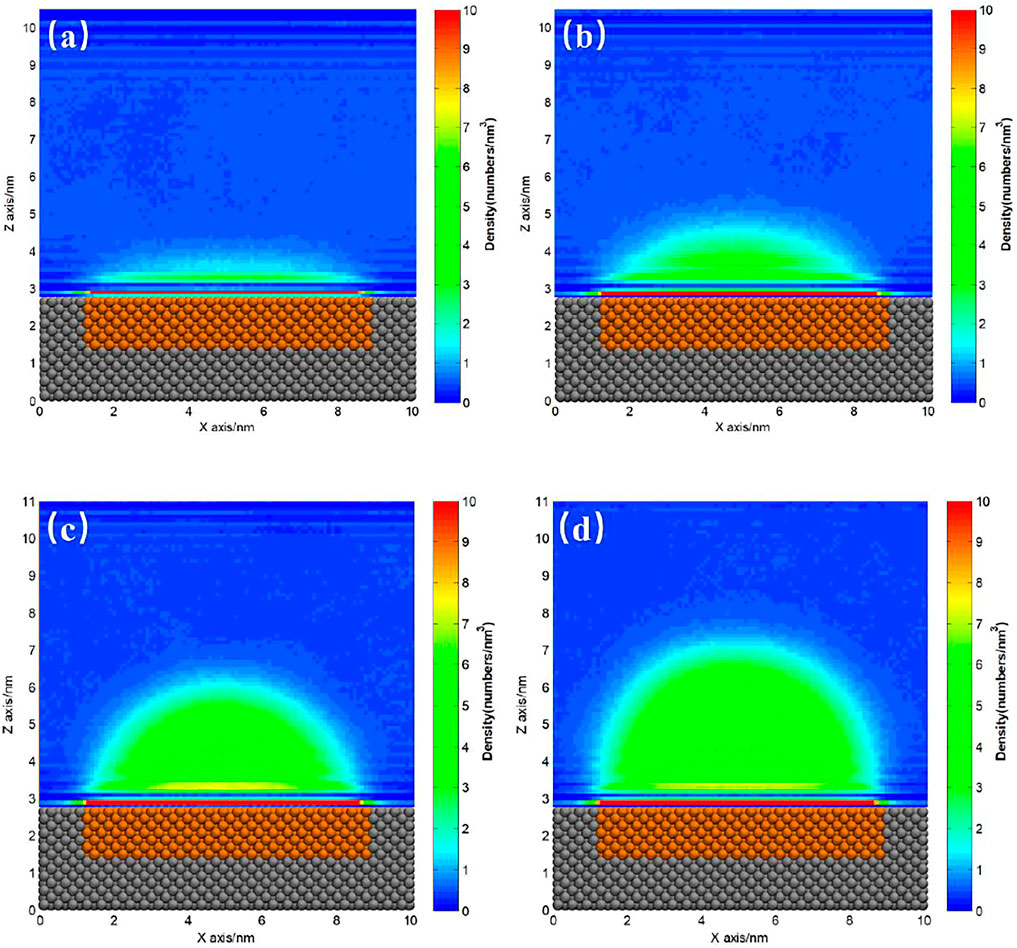
FIGURE 4. Gas density distribution map averaged from 20 to 120 ns for SM patterned hydrophilic substrate. (A) 150, (B) 200, (C) 300, (D) 400 gas molecules.
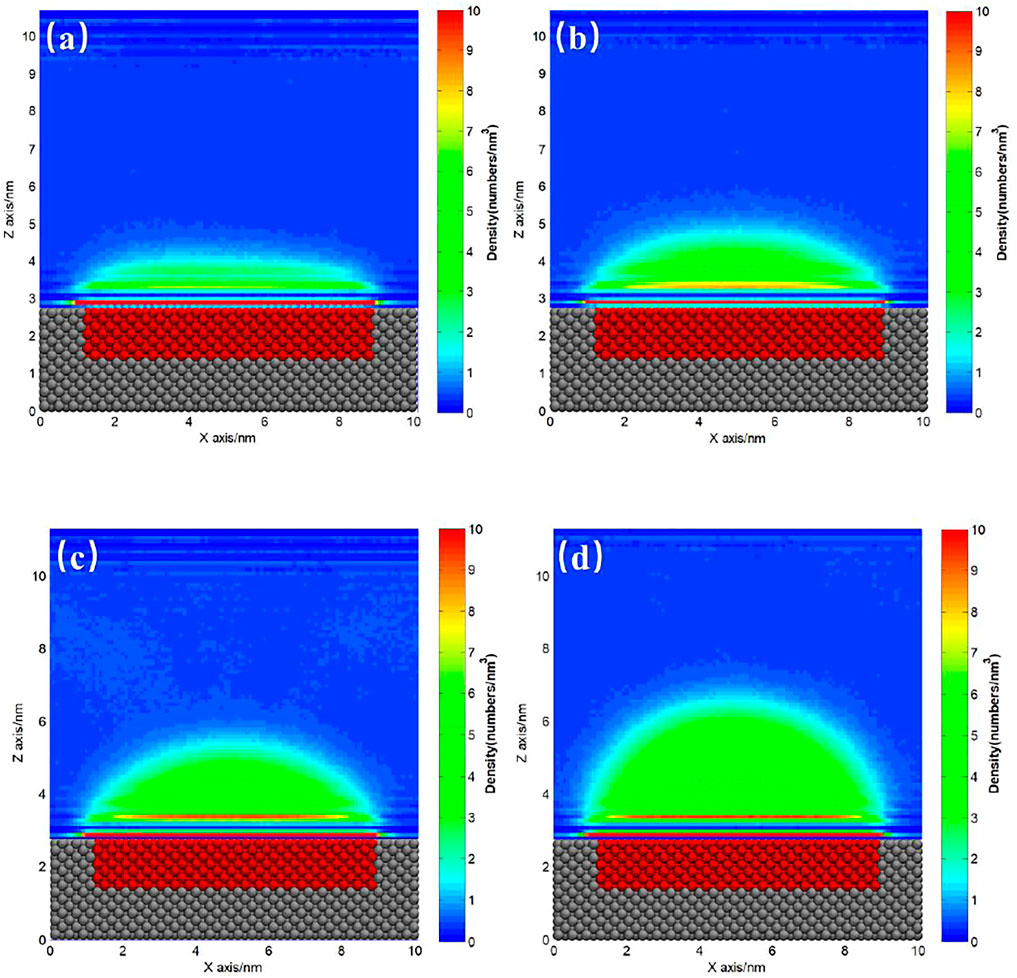
FIGURE 5. Gas density distribution map averaged from 20 to 120 ns for SH patterned hydrophilic substrate. (A) 200, (B) 250, (C) 300, (D) 400 gas molecules.
Figures 6A,B show the density distribution curves along the central axis of the INBs. For medium hydrophobic patch as shown in Figure 6A, the intensities of the peaks in these curves increase with increasing gas particle number, while the peak intensities are almost unchanged with the increase of gas number for high hydrophobic pattern as shown in Figure 6B. It indicates that the gas density distribution next to the surface is affected by the degree of gas oversaturation for medium hydrophobic surface, but it is not affected by the gas oversaturation for strong hydrophobic surface. Figure 6C shows the contact angles of INBs formed on SM and SH patches when using different gas number. We can see that the contact angle increases with the increase of gas number, and the contact angles for SH are lower than those for SM, indicating that the contact angle of INBs increases with the gas oversaturation degree for a given surface hydrophobicity and decreases with the surface hydrophobicity for a given gas oversaturation. Figure 6D shows the number density of gas particles in the bulk increases with the increase of INB curvature, which might be due to the higher Laplace pressure for INB with a larger curvature.
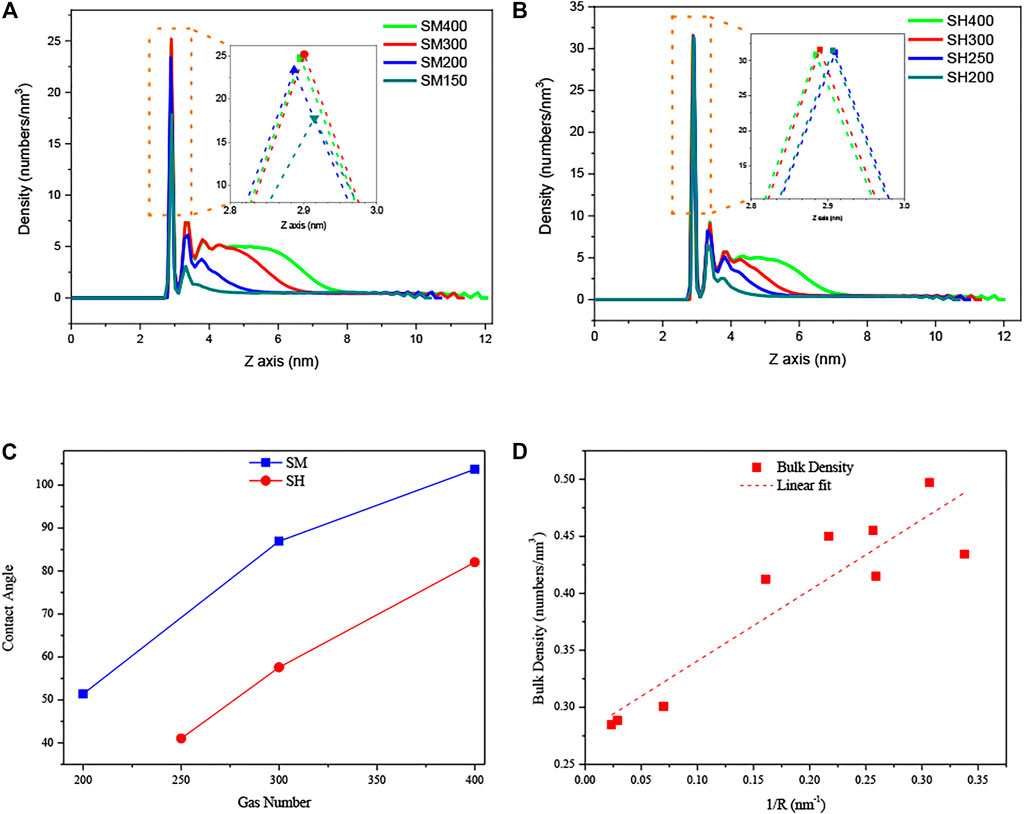
FIGURE 6. Density distribution curves of gas particles along Z-axis and contact angles of INBs for hydrophilic substrates patterned by hydrophobic patch: (A) SM patch, (B) SH patch, (C) contact angles of INBs for SM and SH patches, (D) gas densities in bulk as a function of curvature of INBs. Note: the number of 400, 300, 250, 200, and 150 represent the number of gas molecules used in the simulations, where the liquid molecule number was 4,000 for all of these cases; the density distribution curves were obtained from the gas density of the center axis of INBs (averaged from 4.5 to 5.5 nm of X-axis).
Hydrophobic Substrate Patterned by Stronger Hydrophobic Patch
For a hydrophobic substrate, there might exist some patches with stronger hydrophobicity. Figure 7 shows the INBs formed on SM substrate patterned by SH patch. We could see that a cap-shaped INB forms on SH patterned SM surface, but the contact line stands on the SM surface rather than being pinned at boundary between SH and SM, which is not like the case of Figure 5. Although the contact line locates on the same surface (SM), contact angle is found increasing with the increase of gas oversaturation rather than keeping constant. The contact angles of Figures 7B–D are respectively 39.02°, 55.98°, and 66.76°, and their heights are 2.02, 2.93, and, 4.12 nm, respectively, namely the contact angle of INB increases with the increase of height, which is consistent with previous experiments (Zhang et al., 2012). The gas domain of Figure 7A is more like a DGL, which is because that the gas oversaturation degree is too low to form an INB. The gas enrichment layer is also found existing outside of the INB, which is also reported by previous researches (Yen, 2020) and is considered to account for the stability of INB (Tortora et al., 2020).
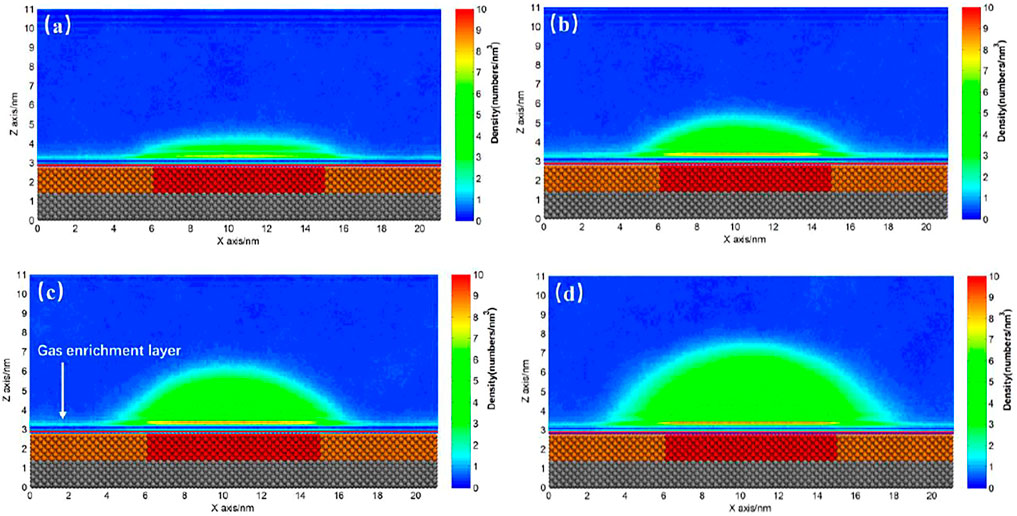
FIGURE 7. Time-averaged gas density distribution map for SH patterned SM substrate. (A) 400, (B) 500, (C) 600, (D) 800 gas molecules. There are 9,000 liquid molecules in these simulations, and the initial box size is 21.19 × 2.75 × 13.00 nm3. The yellow beads represent SM particles, the red beads represent SH particles, and the silver beads represent SL particles.
When we examined the simulation trajectory, we found that the advancing contact line of INB was not pinned by SH patch, but the receding contact line was always pinned. Hence, the INB could only move around the SH pattern, producing an apparent INB with contact line on SM surface and center on SH pattern. This phenomenon is more obvious when the SH pattern is diminished to a site, just as shown in Figure 8 where an INB forms on the SM surface patterned by SH site. It is apparent that the receding contact line of INB was always pinned by SH site, but the advancing contact line could not be pinned, so that the INB moved in a round area centered on SH site. These moving trails formed an apparent INB shown in Figure 9A. In this case, the apparent INB we observed is just a shadow rather than the actual nanobubble, and the time-averaged contact angle is also not the actual contact angle. Figure 9B shows a sketch for the influence of pinning site on contact angle of the INB. In this case, the white spherical cap represents the actual INB, while the red solid line represents the apparent INB. Obviously, the apparent contact angle we could see
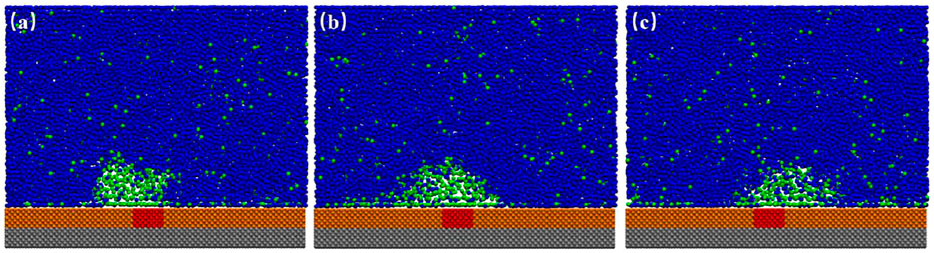
FIGURE 8. Snapshots of INBs formed on SH patterned SM substrate. (A) Snapshot of 20.1 ns represents the receding contact line was pinned when INB was moving toward the left; (B) 22.6 ns. (C) Snapshot of 24.8 ns represents the receding contact line was pinned when INB was moving toward the right. In this case, 600 gas particles and 15,000 liquid particles were added in the simulation boxes with the typical size of 21.19 × 2.75 × 17.00 nm3. A movie for the process is available as Supplementary Video S2.
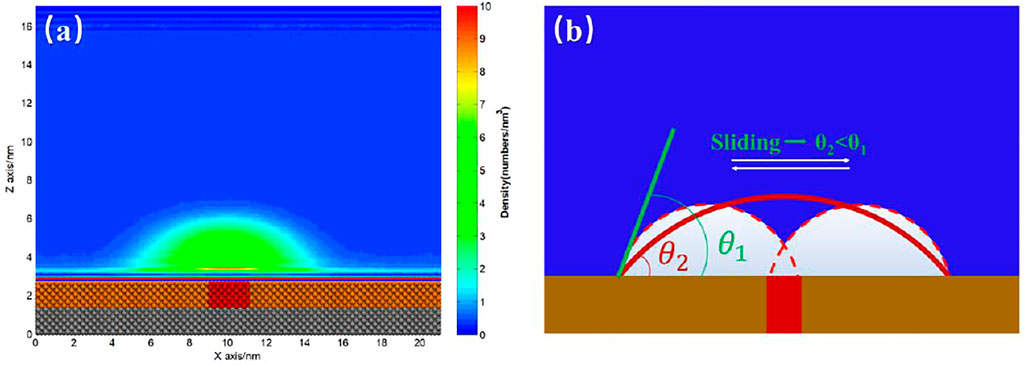
FIGURE 9. (A) Time-averaged density distribution map of gas particles. (B) Sketch of INB pinned by the more hydrophobic site on the hydrophobic substrate. The yellow substrate represents the hydrophobic solid, and the red site represents the more hydrophobic solid. The white spherical cap represents the actual INB, and the red solid line represents the apparent INB we usually used to calculate contact angle.
For the case with several patches, there is similar phenomenon. Figures 10A,B show the INB formed on the SM substrate with two SH patches where gas particle number are 600 and 1,000, respectively. For the case of 600 gas particles, the INB was not large enough to occupy two patches. Hence, two INBs were formed on the two patches, respectively (Figure 10A). When the gas particle number increased to 1,000, a large INB crossing two patches was formed (Figure 10B). This INB kept moving randomly around the two patches, with receding contact line always being pinned by the patch (Supplementary Video S3). In this case, the role of the two small patches is similar to a large patch just like what Figure 7 shows, and the influence of the two patches on morphology of the INB is also like what Figure 9B illustrates.
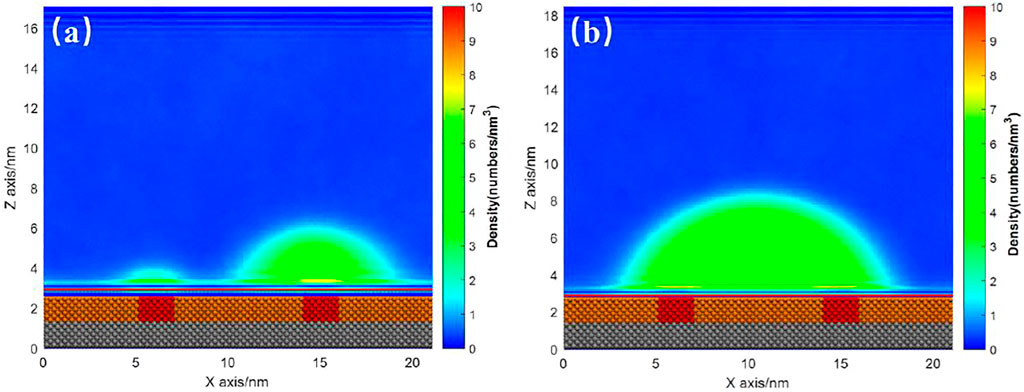
FIGURE 10. Time-averaged gas density distribution map for substrate with two patches under gas density number of (A) 600 and (B) 1,000. Both the liquid particle number is 15,000. A movie for the process of (B) is available as Supplementary Video S3.
Conclusion
In this study, the influence of surface heterogeneity on interfacial nanobubble (INB) was studied by using MD method. The following conclusions were obtained:
(1) For smoothly homogeneous ideal-surface, the gaseous domain could not nucleate on the hydrophilic surface, and only dense gas layer (DGL) forms on strong hydrophobic surface. For medium hydrophobic surface, although INB could nucleate on the substrate, it moves freely along the solid–liquid interface, so that the time-averaged density distribution map of gas particles exhibits a DGL shape.
(2) For hydrophilic substrate patterned by hydrophobic patch, the INB could form on the patch with the contact line being pinned at the boundary. The contact angle of INB increases with gas oversaturation degree, and decreases with the surface hydrophobicity of the patch. In addition, the minimal gas oversaturation degree required to form an INB increases with the surface hydrophobicity of the patch. If the degree of gas oversaturation is lower than this required minimal value, a DGL instead of an INB would form.
(3) For hydrophobic substrate patterned by stronger hydrophobic patch/site, the INB could also form. We found that the receding contact line rather than advancing contact line was always pinned by the boundary of the patch, so that the INB randomly moved around the patch. Hence, a cap-shaped INB centered on the patch was seen from the averaged gas density map. For this case, the width of the apparent INB was much larger than that of instantaneous state, and thus the contact angle of the apparent INB was lower than the actual one. If the INB is large enough to occupy several patches, these patches behave like a whole large patch.
Data Availability Statement
The raw data supporting the conclusion of this article will be made available by the authors, without undue reservation.
Author Contributions
HY conceived and preformed experiments, analyzed the data, and wrote the article. FZ analyzed the data. YX conceived the experiments. XG and YC wrote and edited the article.
Funding
This work was supported by the National Nature Science Foundation of China (Grant no. 51920105007), the Jiangsu Natural Science Fund–Youth Fund (BK20190639), and National Key R&D Program of China (2020YFC1908803).
Conflict of Interest
The authors declare that the research was conducted in the absence of any commercial or financial relationships that could be construed as a potential conflict of interest.
Publisher’s Note
All claims expressed in this article are solely those of the authors and do not necessarily represent those of their affiliated organizations, or those of the publisher, the editors, and the reviewers. Any product that may be evaluated in this article, or claim that may be made by its manufacturer, is not guaranteed or endorsed by the publisher.
Supplementary Material
The Supplementary Material for this article can be found online at: https://www.frontiersin.org/articles/10.3389/fmats.2021.824125/full#supplementary-material
References
Abraham, M. J., Murtola, T., Schulz, R., Páll, S., Smith, J. C., Hess, B., et al. (2: High Performance Molecular Simulations through Multi-Level Parallelism from Laptops to Supercomputers. Softwarex 1-2 (C), 19–25. doi:10.1016/j.softx.2015.06.001
Alheshibri, M., Qian, J., Jehannin, M., and Craig, V. S. J. (2016). A History of Nanobubbles. Langmuir 32 (43), 11086–11100. doi:10.1021/acs.langmuir.6b02489
Cavicchi, R. E., and Avedisian, C. T. (2007). Bubble Nucleation and Growth Anomaly for a Hydrophilic Microheater Attributed to Metastable Nanobubbles. Phys. Rev. Lett. 98 (12), 124501. doi:10.1103/PhysRevLett.98.124501
Chan, C. U., and Ohl, C.-D. (2012). Total-internal-reflection-fluorescence Microscopy for the Study of Nanobubble Dynamics. Phys. Rev. Lett. 109 (17), 174501. doi:10.1103/PhysRevLett.109.174501
Dammer, S. M., and Lohse, D. (2006). Gas Enrichment at Liquid-Wall Interfaces. Phys. Rev. Lett. 96 (20), 206101. doi:10.1103/PhysRevLett.96.206101
Epstein, P. S., and Plesset, M. S. (1950). On the Stability of Gas Bubbles in Liquid‐Gas Solutions. J. Chem. Phys. 18, 1505–1509. doi:10.1063/1.174818210.1063/1.1747520
Fang, C.-K., Ko, H.-C., Yang, C.-W., Lu, Y.-H., and Hwang, I.-S. (2016). Nucleation Processes of Nanobubbles at a Solid/water Interface. Sci. Rep. 6, 24651. doi:10.1038/srep24651
Holmberg, M., Kühle, A., Jørgen Garnæs, J., Mørch, K. A., and Boisen, A. (2003). Nanobubble Trouble on Gold Surfaces. Langmuir 19 (25), 10510–10513. doi:10.1021/la0352669
Humphrey, W., Dalke, A., and Schulten, K. (1996). VMD: Visual Molecular Dynamics. J. Mol. Graphics 14 (1), 33–38. doi:10.1016/0263-7855(96)00018-5
Ishida, N., Inoue, T., Miyahara, M., and Higashitani, K. (2000). Nano Bubbles on a Hydrophobic Surface in Water Observed by Tapping-Mode Atomic Force Microscopy. Langmuir 16 (16), 6377–6380. doi:10.1021/la000219r
Li, D., Jing, D., Pan, Y., Bhushan, B., and Zhao, X. (2016). Study of the Relationship between Boundary Slip and Nanobubbles on a Smooth Hydrophobic Surface. Langmuir 32 (43), 11287–11294. doi:10.1021/acs.langmuir.6b02877
Ljunggren, S., and Eriksson, J. C. (1997). The Lifetime of a Colloid-Sized Gas Bubble in Water and the Cause of the Hydrophobic Attraction. Colloids Surf. A: Physicochemical Eng. Aspects 129-130 (30), 151–155. doi:10.1016/S0927-7757(97)00033-2
Lohse, D., and Zhang, X. (2015). Surface Nanobubbles and Nanodroplets. Rev. Mod. Phys. 87 (3), 981–1035. doi:10.1103/RevModPhys.87.981
Lou, S.-T., Ouyang, Z.-Q., Zhang, Y., Li, X.-J., Hu, J., Li, M.-Q., et al. (2000). Nanobubbles on Solid Surface Imaged by Atomic Force Microscopy. J. Vac. Sci. Technol. B 18 (5), 2573–2575. doi:10.1116/1.1289925
Lu, Y.-H., Yang, C.-W., Fang, C.-K., Ko, H.-C., and Hwang, I.-S. (2014). Interface-induced Ordering of Gas Molecules Confined in a Small Space. Sci. Rep. 4, 7189. doi:10.1038/srep07189
Lu, Y. (2019). Drag Reduction by Nanobubble Clusters as Affected by Surface Wettability and Flow Velocity: Molecular Dynamics Simulation. Tribology Int. 137, 267–273. doi:10.1016/j.triboint.2019.05.010
Maheshwari, S., van der Hoef, M., Rodrı́guez Rodrı́guez, J., and Lohse, D. (2018). Leakiness of Pinned Neighboring Surface Nanobubbles Induced by Strong Gas-Surface Interaction. ACS Nano 12 (3), 2603–2609. doi:10.1021/acsnano.7b08614
Maheshwari, S., van der Hoef, M., Zhang, X., and Lohse, D. (2016). Stability of Surface Nanobubbles: A Molecular Dynamics Study. Langmuir 32 (43), 11116–11122. doi:10.1021/acs.langmuir.6b00963
Maheshwari, S., van Kruijsdijk, C., Sanyal, S., and Harvey, A. D. (2020). Nucleation and Growth of a Nanobubble on Rough Surfaces. Langmuir 36 (15), 4108–4115. doi:10.1021/acs.langmuir.0c00635
Mao, M., Zhang, J., Yoon, R.-H., and Ducker, W. A. (2004). Is There a Thin Film of Air at the Interface between Water and Smooth Hydrophobic Solids? Langmuir 20 (10), 4310. doi:10.1021/la040053k
Martinez, J., and Stroeve, P. (2007). Transient Behavior of the Hydrophobic Surface/Water Interface: From Nanobubbles to Organic Layer. J. Phys. Chem. B 111 (51), 14069–14072. doi:10.1021/jp077110d
McKee, C. T., and Ducker, W. A. (2005). Refractive Index of Thin, Aqueous Films between Hydrophobic Surfaces Studied Using Evanescent Wave Atomic Force Microscopy. Langmuir 21 (26), 12153–12159. doi:10.1021/la051008v
Parker, J. L., Claesson, P. M., and Attard, P. (1994). Bubbles, Cavities, and the Long-Ranged Attraction between Hydrophobic Surfaces. J. Phys. Chem. 98 (34), 8468–8480. doi:10.1021/j100085a029
Pu, J. H., Sun, J., Wang, W., and Wang, H. S. (2020). Generation and Evolution of Nanobubbles on Heated Nanoparticles: A Molecular Dynamics Study. Langmuir 36 (9), 2375–2382. doi:10.1021/acs.langmuir.9b03715
Seo, H., Yoo, M., and Jeon, S. (2007). Influence of Nanobubbles on the Adsorption of Nanoparticles. Langmuir 23 (4), 1623–1625. doi:10.1021/la062763r
Steitz, R., Gutberlet, T., Hauss, T., Klösgen, B., Krastev, R., Schemmel, S., et al. (2003). Nanobubbles and Their Precursor Layer at the Interface of Water against a Hydrophobic Substrate. Langmuir 19 (6), 2409–2418. doi:10.1021/la026731p
Takata, Y., Cho, J.-H. J., Law, B. M., and Aratono, M. (2006). Ellipsometric Search for Vapor Layers at Liquid-Hydrophobic Solid Surfaces. Langmuir 22 (4), 1715–1721. doi:10.1021/la052599s
Tan, B. H., An, H., and Ohl, C.-D. (2017). Resolving the Pinning Force of Nanobubbles with Optical Microscopy. Phys. Rev. Lett. 118 (5), 054501. doi:10.1103/PhysRevLett.118.054501
Tortora, M., Meloni, S., Tan, B. H., Giacomello, A., Ohl, C.-D., and Casciola, C. M. (2020). The Interplay Among Gas, Liquid and Solid Interactions Determines the Stability of Surface Nanobubbles. Nanoscale 12, 22698–22709. doi:10.1039/d0nr05859a
Wang, M., Zhang, K., Ji, X., Wang, P., Ma, H., Zhang, J., et al. (2022). Molecular Insight into the Fluidity of Cement Pastes: Nano-Boundary Lubrication of Cementitious Materials. Construction Building Mater. 316, 125800. doi:10.1016/j.conbuildmat.2021.125800
Wang, Y., Luo, X., Qin, W., and Jiao, F. (2019). New Insights into the Contact Angle and Formation Process of Nanobubbles Based on Line Tension and Pinning. Appl. Surf. Sci. 481, 1585–1594. doi:10.1016/j.apsusc.2019.01.292
Weijs, J. H., Snoeijer, J. H., and Lohse, D. (2012). Formation of Surface Nanobubbles and the Universality of Their Contact Angles: a Molecular Dynamics Approach. Phys. Rev. Lett. 108 (10), 104501. doi:10.1103/PhysRevLett.108.104501
Wu, C.-J., Chu, K.-C., Sheng, Y.-J., and Tsao, H.-K. (2017). Sliding Dynamic Behavior of a Nanobubble on a Surface. J. Phys. Chem. C 121 (33), 17932–17940. doi:10.1021/acs.jpcc.7b04924
Xiao, Q., Liu, Y., Guo, Z., Liu, Z., Lohse, D., and Zhang, X. (2017). Solvent Exchange Leading to Nanobubble Nucleation: A Molecular Dynamics Study. Langmuir 33 (32), 8090–8096. doi:10.1021/acs.langmuir.7b01231
Yen, T.-H. (2020). Influence of Gas Aggregation on Water-Solid Interface: Molecular Simulation. Mol. Simulation 46 (17), 1373–1382. doi:10.1080/08927022.2020.1828881
Yen, T.-H., Lin, C.-H., and Chen, Y.-L. (2021). Effects of Gas Adsorption and Surface Conditions on Interfacial Nanobubbles. Langmuir 37 (8), 2759–2770. doi:10.1021/acs.langmuir.0c03511
Zhang, X. H., Maeda, N., and Craig, V. S. J. (2006). Physical Properties of Nanobubbles on Hydrophobic Surfaces in Water and Aqueous Solutions. Langmuir 22 (11), 5025–5035. doi:10.1021/la0601814
Zhang, X. H. (2008). Quartz crystal Microbalance Study of the Interfacial Nanobubbles. Phys. Chem. Chem. Phys. 10 (45), 6842–6848. doi:10.1039/b810587a
Zhang, X. H., Quinn, A., and Ducker, W. A. (2008). Nanobubbles at the Interface between Water and a Hydrophobic Solid. Langmuir 24 (9), 4756–4764. doi:10.1021/la703475q
Keywords: interfacial nanobubble, pinning, molecular dynamics, contact angle, surface heterogeneity
Citation: Yang H, Zhang F, Xing Y, Gui X and Cao Y (2022) Influence of Surface Heterogeneity on Morphology of Interfacial Nanobubble. Front. Mater. 8:824125. doi: 10.3389/fmats.2021.824125
Received: 29 November 2021; Accepted: 28 December 2021;
Published: 01 March 2022.
Edited by:
Lijuan Zhang, Shanghai Advanced Research Institute (CAS), ChinaReviewed by:
Youguo Yan, China University of Petroleum, Huadong, ChinaMuhan Wang, Qingdao University of Technology, China
Copyright © 2022 Yang, Zhang, Xing, Gui and Cao. This is an open-access article distributed under the terms of the Creative Commons Attribution License (CC BY). The use, distribution or reproduction in other forums is permitted, provided the original author(s) and the copyright owner(s) are credited and that the original publication in this journal is cited, in accordance with accepted academic practice. No use, distribution or reproduction is permitted which does not comply with these terms.
*Correspondence: Yaowen Xing, Y3VtdHh5d0AxMjYuY29t; Yijun Cao, eWlqdW5jYW9AMTI2LmNvbQ==