 Mohammed Ameen Mohammed
 Zheng Han
 Yange Li1,3
 Zaid Al-Huda
- 1School of Civil Engineering, Central South University, Changsha, Hunan, China
- 2Hunan Provincial Key Laboratory for Disaster Prevention and Mitigation of Rail Transit Engineering Structures, Changsha, Hunan, China
- 3The Key Laboratory of Engineering Structures of Heavy Haul Railway, Ministry of Education, Changsha, Hunan, China
- 4School of Computing and Artificial Intelligence, Southwest Jiaotong University, Chengdu, Sichuan, China
Surface crack detection is essential for evaluating the safety and performance of civil infrastructures, and automated inspections are beneficial in providing objective results. Deep neural network-based segmentation methods have demonstrated promising potential in this purpose. However, the majority of these methods are fully supervised, requiring extensive manual labeling at pixel level, which is a vital but time-consuming and expensive task. In this paper, we propose a novel semi-supervised learning model for crack detection. The proposed model employs a modified U-Net, which has half the parameters of the original U-Net network to detect surface cracks. Comparison using 20 epochs shows that the modified U-Net network requires only 15% training time of the traditional U-net, but improves the accuracy by 20% upwards. On this basis, the proposed model (modified U-Net) is trained based on an updated strategy. At each stage, the trained model predicts and segments the unlabeled data images. The new strategy for updating the training datasets allows the model to be trained with limited labeled image data. To evaluate the performance of the proposed method, comprehensive image datasets consisting of the DeepCrack, Crack500 datasets those open to public, and an expanded dataset containing 2068 images of concrete bridge surface crack with our independent manual labels, are used to train and test the proposed method. Results show that the proposed semi-supervised learning method achieved quite approaching accuracies to the established fully supervised models using multiple accuracy indexes, however, the requirement for the labeled data reduces to 40%.
1 Introduction
Existence of surface cracks has a significant impact on the safety and endurance of infrastructure such as roads and bridges Biondini and Frangopol. (2016) Rafiei and Adeli (2017). Cracking is an inevitable phenomenon indicating the degradation of infrastructure performance. It is getting common when infrastructure approaches their life expectancy. With an aging population and rising labor costs, the ability to inspect the structure continuously and automatically with a reduced workforce has become a critical research path Maeda et al. (2018) and Liu et al. (2019b). Manual visual inspection is a well-known technique for inspecting and evaluating the health of the civil infrastructure. This kind of solution is low efficiency, highly reliant on experts and time-consuming Nguyen et al. (2021). The accuracy of damage diagnosis is largely dependent on the inspectors’ skill level and experience. As a result, automatic crack detection is critical for achieving the objectivity and efficiency required for damage assessment Adhikari et al. (2014).
Numerous automatic or semi-automatic systems have been proposed, using advanced sensors for assessment, such as line scanning cameras Gavilán et al. (2011), accelerometers Radopoulou and Brilakis (2017), RGB-D sensors Tsang and Lo (2006), black-box cameras Kim and Ryu (2014), and 3D laser scanners Bursanescu et al. (2001) and Zhang et al. (2018b). The equipment with these sensors, as well as the relevant systems are usually costly. For instance, between the year of 2012 and 2013, the Ohio Department of Transportation (ODOT) was offered five choices for pavement inspections at the cost of $1.12 million, including a collection system, web hosting, workstations, and training. In general, the average cost for pavement inspections and monitoring is estimated as $48.75/km in Netherlands Seraj et al. (2017). It is comparable in United Kingdom, that the average cost is reported ranging from $27.89/km to $55.77/km in the previous studies Radopoulou and Brilakis (2017), Hadjidemetriou and Christodoulou (2019). Due to the high cost of vehicles equipped with sensors for road inspections, the relevant agencies and government departments cannot afford to spend a high price to inspect the entire road as much as possible Woo and Yeo (2016).
With the advances of computing power and the advent of artificial intelligence, image processing, and computer vision-based approaches became increasingly effective at analyzing and detecting surface cracks of infrastructures Cao et al. (2020). Many automated or semiautomated computer-aided crack detection methods have been proposed, including threshold segmentation Zhu et al. (2007) and Li et al. (2022), histogram transforms Patricio et al. (2005), region growing Zhou et al. (2016) and Li et al. (2011), edge detection Ayenu-Prah and Attoh-Okine (2008). Although these algorithms laid a solid foundation and inspired the automated crack detection, they require extensive manual feature engineering, while the detection results are likely to influenced by noise because of the crack images complexity. These limitations are debated up to date.
Recently, deep learning (DL)-based computer vision methods have achieved state-of-the-art performance in various computer vision-based tasks Krizhevsky et al. (2012), Ren et al. (2015), Long et al. (2015), Peng et al. (2020), and Han et al. (2021b). Various methods those based on convolutional neural network (CNN) have been applied to identify the crack detection of structures, including image classification Gopalakrishnan et al. (2017) and Mohammed et al. (2021), object detection Cheng and Wang (2018) and Xu et al. (2019), and semantic segmentation Tong et al. (2019), Zhou et al. (2019), and Al-Huda et al. (2021). Generally, these previous DL-based methods can be categorized into three major kinds, i.e., the binary classifier that distinguishes between crack and non-crack images for the input images Nhat-Duc et al. (2018), anchor boxes used to highlight cracks in images by the object detector Huyan et al. (2019), and pixel-level semantic segmentation that able to specific segment pixels of the crack from background pixels in images Huyan et al. (2020). Among these methods, pixel-level crack segmentation delineates the geometric features of the cracks, therefore, should be considered as a more effective solution in engineering practice, where the geometric features of the cracks are required to determine the type, length, width, and severity of the crack Dong et al. (2020).
However, comparing to the binary classifier and anchor boxes methods, the pixel-level semantic segmentation of CNNs often suffers from loss of information and an imbalance in the quantity of cracked and non-cracked pixels in their early versions. Downsampling methods (e.g., max-pooling) lose information from the feature map and obstruct the pursuit of pixel-perfect accuracy. Zhang et al. (2017) developed a method for segmenting cracks at the pixel level based on CNN called CrackNet. CrackNet does not contain pooling layers, and the feature map size is constant in all layers to prevent information loss. They also made progressive strengthening that the improved versions of CrackNet II and CrackNet V Zhang et al. (2018a) and Fei et al. (2018) were released, which are more accurate and faster. Cheng et al. (2018) and Jenkins et al. (2018) demonstrated high-precision segmentation of cracks at the pixel level using U-Net. A skip connection between the encoder and decoder can recover the information loss in the U-Net upsampling method for pixel-level image segmentation Ronneberger et al. (2015), Tang et al. (2021), and Karimpouli and Kadyrov (2022) proposed a Double-Unet to overcome inability to reconstruct HR features in the decoder part of the U-net. Results show that SRDUN performs more realistic than conventional networks. Liu et al. (2020) proposed a detection and segmentation method for road cracks, and the YOLOv3 model was used to determine the kind and crack position of the input image, which was then used as an input to the U-Net segmentation. Zhu et al. (2022) used an unmanned aerial vehicle (UAV) to collect pavement images and then used deep learning to detect six types of distress, including four crack types (e.g., fatigue crack). Han et al. (2021a) proposed a sampling block with a convolutional neural network implementation called CrackW-Net, thereby developing a novel pixel-level semantic segmentation network for pavement crack segmentation.
As can be seen from the abovementioned studies, the semantic segmentation methods have been extensively used in crack detection and can be used as the basis for crack morphological feature measurement. However, the majority of the current crack detection semantic segmentation methods are fully supervised learning-based Liu et al. (2019b) and Xu et al. (2019), which require supervising the model’s training process using amount of the labeled image data. In these labeled image data, the cracks of the infrastructure surface are commonly manual delineated and separated from the non-crack area. The quality of these manual labeled image data significantly influences the detection accuracy of the model. In this sense, the application of DL-based semantic segmentation methods to crack detection is limited owing to that the labeling work is time-consuming. For instance, pixel-wise labeling spends about 15 times longer to complete than bounding anchor box labeling, and even 60 times longer than image-level classification Dong et al. (2020). To this end, different kinds of weak annotations were used in many methods, such as bounding box Dai et al. (2015), and scribble Lin et al. (2016) to annotation at pixel-wise. Despite the fact that there is no difficulty because a massive dataset is not required, but the cracks can have complex topological structures and can span the entire image. As a result, scribble or bounding box annotation is an ineffective technique for crack detection Al-Huda and Li (2022). With image-wise label, annotation time and workload can be significantly reduced, allowing this task to be applied more effectively to pavement crack segmentation task.
To overcome the issue of insufficient data, the semi-supervised learning method is an alternative solution, which fully utilize unlabeled data, reducing labeling workload while maintaining accuracy. Some current studies, Li et al. (2020) and Shim et al. (2020) have begun to use this kind of method, and proposed an adversarial learning-based semi-supervised crack segmentation method. The model consists of a segmentation network and a discrimination network. Given an input crack image, the segmentation network generates a prediction map, and the discriminator network separates the prediction map from the ground truth label map. Wang and Su (2021) proposed a semi-supervised semantic segmentation network for crack detection. The proposed method consists of a student model and a teacher model. The two models use the EfficientUNet to extract multi-scale crack feature information, which reduces image information loss. However, most of the previous semi-supervised learning-based studies for crack segmentation majorly use adversarial learning or similar networks, therefore, it is difficult to achieve good training results unless the training process ensures synchronization and balance between the two adversarial networks Wang et al. (2017) and Goodfellow et al.(2016).
In order to address these issues, in this paper we propose a novel semi-supervised method for crack image segmentation. The modified U-Net is applied in the proposed method. Then, to minimize the requirement for the labeled image data, a novel dataset update strategy that updates the given training dataset are proposed. The modified U-Net-based convolutional neural network was used to avoid the difficulties associated with manually extracting features. A open-source, however, unlabeled GitHub dataset for bridge crack images Li et al. (2019) is used. The images in this dataset are independently labeled. To evaluate the performance of the proposed method, the labeled bridge crack dataset, and two other open-source dataset, i.e., DeepCrack and Crack500, are used to train and test the proposed method. The proposed method was compared to the fully supervised methods by conducting experiments on two public datasets. The following are main contributions:
• A novel semi-supervised learning-based semantic segmentation framework for crack images, which significantly reduces the workload associated with data annotation, is proposed.
• The improved U-Net-based convolutional neural network was used to avoid the difficulties associated with manually extracting features.
• The new bridge crack image dataset was carefully labeled and used to train and test the model based on unlabeled GitHub bridge crack open-source dataset Li et al. (2019). This manual labeled dataset will be available and released to public along with this paper.
• The proposed method was compared to the fully supervised methods by conducting experiments on two public datasets. The results demonstrate that the proposed method achieves comparable results to fully supervised methods while reducing human labeling efforts.
The remaining of this paper is organized as follows. Section 2 presents the research methodology; Section 3 presents the datasets and evaluation metrics; Section 4 presents the experimental results; Section 5 presents discussions and comparative study to verify the segmentation performance; finally, the study’s conclusions are presented in Section 6.
2 Methodologies
2.1 Overview of the proposed method
The fully supervised deep learning methods depends on the quality and amount of the labeled crack images dataset, which is commonly manual labeled, time-consuming, and costly. The main goal of this method is to use a limited number of labeled crack images to achieve satisfactory results. For this purpose, a new method for crack image segmentation based on semi-supervised learning is proposed to address this issue.
This section details our semi-supervised framework for crack segmentation using image-level labels as semi supervision annotations. It aims to bridge the gap between the fully and the weakly supervised semantic segmentation methods for pavement crack segmentation, while reducing human labeling efforts. The proposed framework has four main steps: 1) Contrast Limited Adaptive Histogram Equalization (CLAHE) Reza (2004) is adapted to mitigate the detrimental effects of uneven illumination on input images via contrast limited adaptation; 2) the Supervised model is trained on labeled data images; 3) an initial pixel-level annotation is obtained by using the trained model (supervised) to predict and segment unlabeled data images; 3) the semi-supervised model is trained on labeled data and high-confidence predictions; 4) update the training dataset by combining labeled data and high confident predictions to train the semi-supervised model. 5) steps 3,4 are repeated until all images in the data set required to train the model are used, and 6) use the final model to predict the label of the test set and evaluate.
As shown in Figure 1, the input image is enhanced by CLAHE, as a preprocessing step. Then, trained the modified U-Net deep neural network on a small amount of labeled crack data and then predict and segment the unlabeled data image. Next, the previously used dataset is updated and combined with the highly confident predictions to train the semi-supervised model. The specifics of the proposed methodology are discussed in more detail in the following Section 2.3.
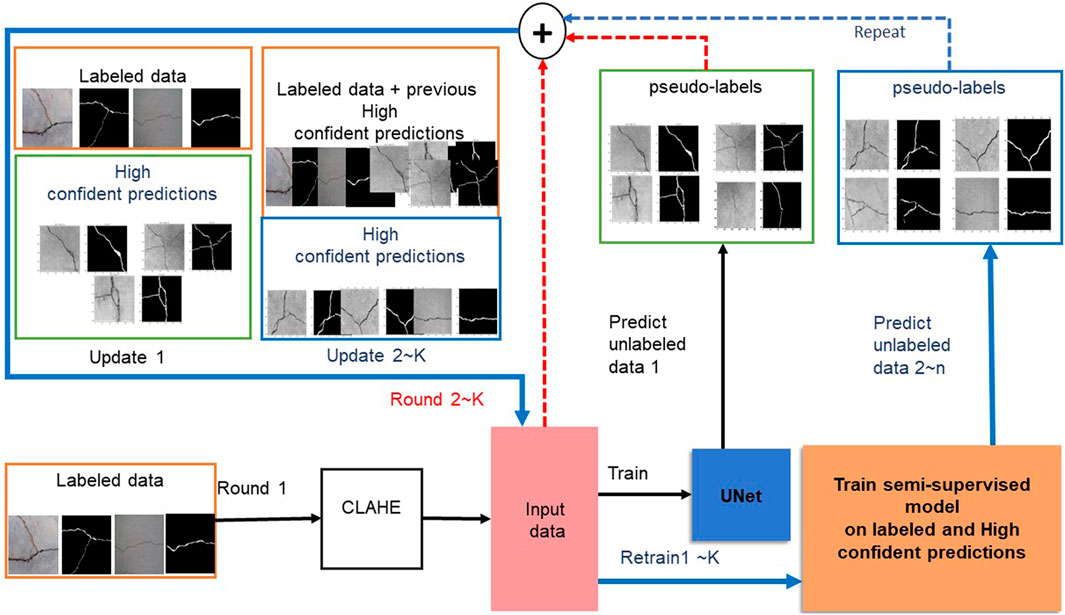
FIGURE 1. The schematic representation of the proposed semi-supervised method. 1) The Supervised model is trained on labeled data images, then 2) uses the trained model (supervised) to predict and segment unlabeled data images. Then 3) the semi-supervised model is trained on labeled data and high-confidence predictions. 4) This semi-supervised trained model re-labeling unlabeled images. The above steps (3, 4) are repeated until all images in the data set required to train the model are used.
2.2 The modified U-Net model
In order to implement an automated crack image analysis system, it is necessary first to segment the cracks. Complex feature engineering and selecting the most suitable classifier are essential to achieve satisfactory segmentation results, and this task is time-consuming and labor-intensive. A modified U-Net-based Convolutional Neural Network is used to avoid difficulties with manually extracting features.
U-Net Ronneberger et al. (2015) is a fully convolutional neural network-based model for solving the issue of biomedical image semantic segmentation. The model consists of a contraction path and an expansion path, and the input image is compressed into a multichannel feature map passing through the feature extraction path. The encoder uses max-pooling (strides = 2) and convolutional layers with an increasing number of filters to continuously reduce image size, followed by activation (ReLU). The number of filters in the convolutional layers decreases during decoding, followed by gradual upsampling in the subsequent layers to the top. The contracting and expansive paths in a traditional UNet network are nearly symmetrical. However, due to downsampling methods (e.g., maximum pooling), information from the feature map is lost, and the pursuit of pixel-perfect accuracy is hampered. In addition, traditional UNet networks contain many parameters that hinder network speed.
In this paper, in order to address the above issues, a modified U-Net-based crack segmentation method is proposed in this study. Figure 2 shows the modified UNet network. The basic of the U-Net method has been illustrated in detail in previous studies Ronneberger et al. (2015) and Tang et al. (2021). The modified U-Net focuses on the following aspects.
To reduce the number of network parameters and increase the speed of network training, the modified U-Net network has half the parameters of the original UNet network, which is capable of accurately and automatically detecting cracks with a high level of spatial precision. Additionally, Same padding was added in the modified UNet network to achieve the size of the output feature map is similar to the input feature map size. Table 1 shows the comparison of network architecture performance results, the DeepCrack dataset was used for the experiment, and it seems clear that Modified U-Net has the best performance across all metrics and requires the least amount of training time.
The ith input crack image is represented by x (i). The standard binary cross-entropy loss is the loss function used to train the U-Net. The formula is as in Eq. 1.
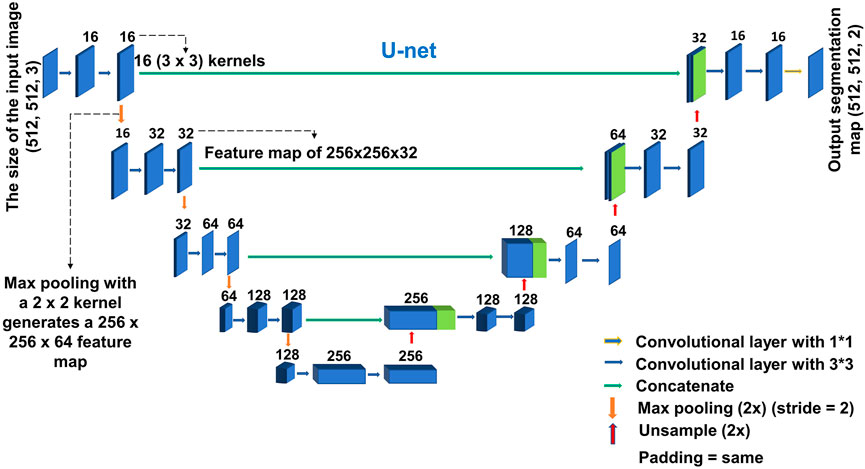
FIGURE 2. The architecture of the modified U-Net model.

TABLE 1. Comparison of network architecture performance results on DeepCrack dataset for 20 epochs.
where yi represents the ground-truth and
This optimization problem was solved using the Adaptive Moment Estimation (Adam) algorithm Kingma and Ba (2014).
2.3 Dataset updating method
The proposed semi-supervised method aims to obtain satisfactory crack segmentation with a limited amount of labeled data. In practice, obtaining a large number of unlabeled crack images is relatively easy. The dataset updating strategy used to utilize these images, as shown in Figure 3. The goal of the dataset update strategy is to label unlabeled images automatically, therefore, increasing the total amount of the labeled images data, which helps to estimate the network parameters. The following is a detailed description of the implementation procedure.
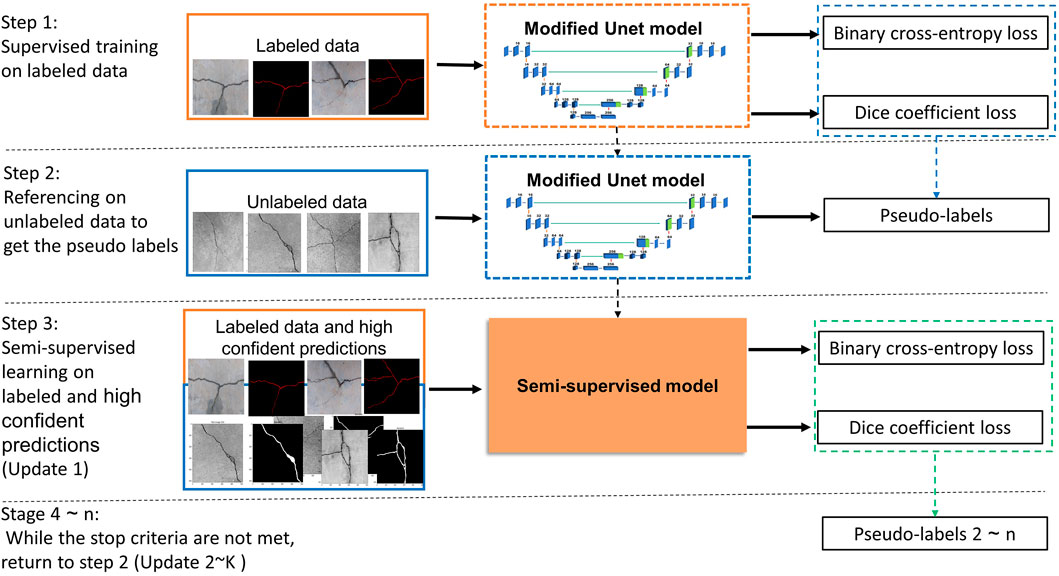
FIGURE 3. The main framework of the proposed dataset updating strategy.
Assume that the training dataset is
The training dataset Sn can then be updated as follows:
The parameters θ of the U-Net model will be recalculated with the updated dataset S* as input, during training and validation of the semi-supervised model, the loss is primarily used to assess the discrepancy between the predicted and actual values, the dice coefficient is selected as monitoring criteria to guide hyper-parameter learning. The whole process of the proposed semi-supervised learning method for the crack image segmentation is shown in Algorithm 1.
Algorithm 1. Semi-supervised learning method for the crack images segmentation.
Input: Training dataset
Output: Label predicted
STEP 1: Initialization
• Learning method: learning rate, batch size, epoch
• Choose labeled data S for training the modified U-Net model
STEP 2:
• Update the modified U-Net model parameters θ by solving Eq. 2
• Calculate Binary cross-entropy loss for the labeled data S
• Calculate Dice coefficient loss for the labeled data S
STEP 3:
• Predict the pseudo-label
STEP 4:
• Using pseudo-label probability that have greater than a threshold value
- Update the training dataset S* by combining labeled data and pseudo-labels using Eq. 4
• Training the modified U-Net model on the updated training dataset S*
• Calculate Binary cross-entropy loss for the labeled data S*
• Calculate Dice coefficient loss for the labeled data S*
STEP 5:
• while the stop criteria are not met, do
- Return to STEP 3
• end while
STEP 6: Use the final model to predict the label of the test set and evaluate
3 Evaluation
3.1 Datasets
The performance evaluation was done by performing experiments using two publicly available crack datasets, i.e., DeepCrack and Crack500 dataset, with the embedded ground truth labels.
1) DeepCrack dataset Liu et al. (2019a). There are 537 images with a resolution of 544 × 384 pixels. Ground truth images at the pixel level are available. This dataset was used to evaluate the proposed method. Figure 4 shows some images of the DeepCrack dataset.
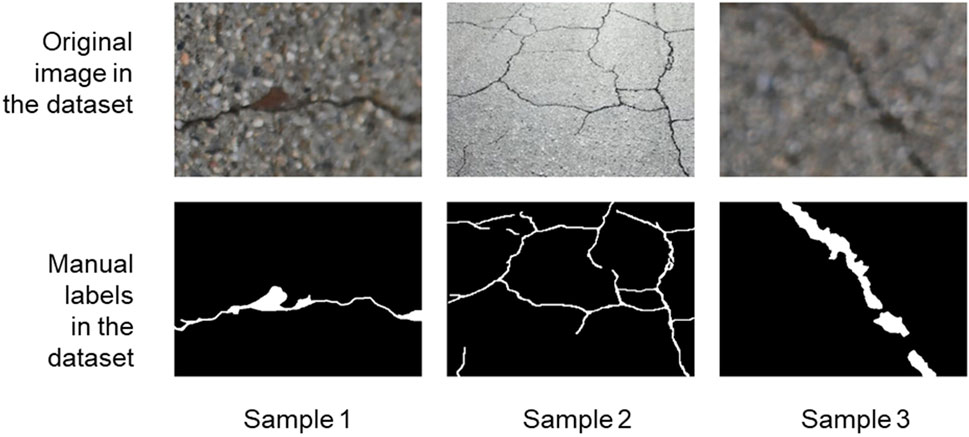
FIGURE 4. Samples of source images and crack labels in DeepCrack dataset Liu et al. (2019a).
2) Crack500 dataset Yang et al. (2019). There are 3,792 training images, 696 validation images, and 2,246 test images, all with a fixed size of 640 × 360 pixels and a variety of crack types. This dataset presents a challenge due to the complex inference factors such as uneven lighting conditions and shadows. Some samples are shown in Figure 5.
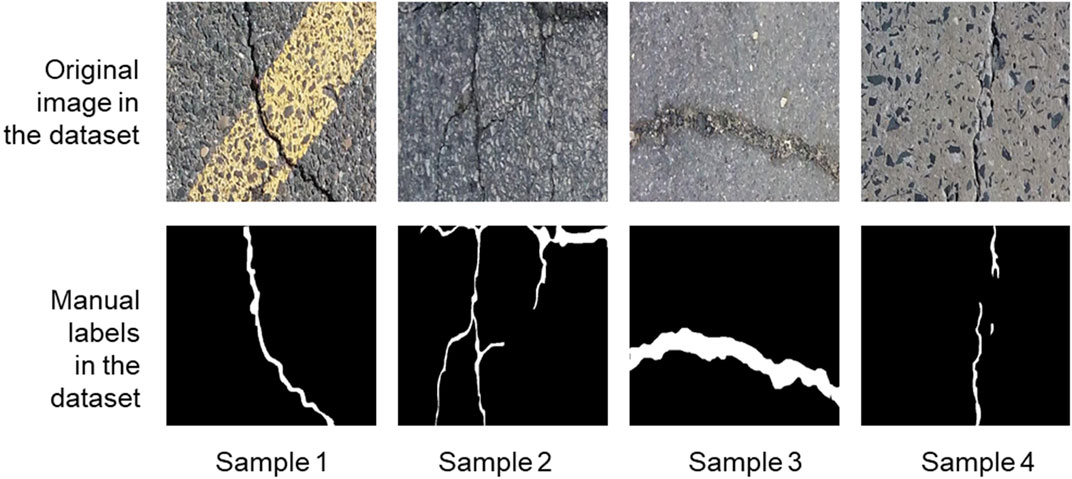
FIGURE 5. Samples of source images and crack labels in Crack500 dataset Yang et al. (2019).
To guarantee the robustness of the proposed method, we also expand the dataset upon on DeepCrack and Crack500 dataset. Li et al. (2019) released a bridge crack image data in 2019. However, this dataset does not contain ground truth labels, therefore, cannot be directly used for training. We independently made manual pixel-level labels for the contained bridge crack images, generating a new expanded dataset for crack semantic segmentation.
3) Bridge cracks dataset with independent manual labels. The images are from a realistic crack dataset available to the public. This dataset includes 2068 crack images with a resolution of 1,024 × 1,042. These images were taken on a real bridge using the CMOS camera built into the DJI Phantom4 Pro drone. Pixel-level ground truth for this dataset was carefully manually created using the Labelme tool to train and test the proposed model. Some samples are shown in Figure 6. This manual labeled dataset will be available and released to public along with this paper.
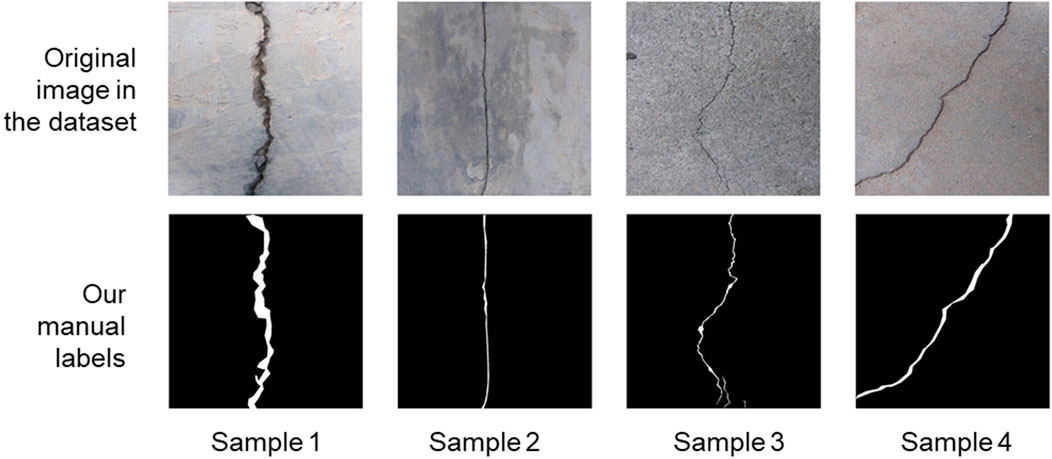
FIGURE 6. Samples of source images in Li et al. (2019), and our manual crack labels in Bridge cracks dataset.
3.2 Evaluation metrics
This study used six metrics to evaluate fully supervised and semi-supervised models. The relationship between the ground truth and the predicted result for each pixel can be divided into True Positive (TP), False Positive (FP), False Negative (FN), and True Negative (TN) for the binary pixel-level classification task. For crack detection, TP denotes the number of pixels correctly predicted as cracks which the ground truth is also a crack; FP denotes the number of pixels illogically predicted as cracks but are non-cracks in the ground truth; FN denotes the number of pixels predicted as non-cracks, but are the ground truth is a crack, and TN denotes the number of pixels predicted as non-cracks for which the ground truth is also a non-crack. To evaluate the performance of a model, many indexes describing the result accuracy have been proposed, including precision, recall, F1-score, and IoU. Precision represents the fraction of relevant instances among the retrieved ones. Recall is the fraction of all relevant instances that are actually retrieved, the F-score, which can balance precision and recall effects and provide a more comprehensive assessment of the performance of a classifier and Intersection of union (IoU) is the overlap area of the predicted segmentation and the ground truth divided by the union area of the predicted segmentation and the ground truth. Equations 5–8 presents precision, recall, F1-score, and Intersection of union (IoU). The precision, recall, and F-score metrics did not consider TN. In contrast, the area under the ROC curve (AUC) metric considers the TN and provides a more comprehensive evaluation of the method performance. In addition, the ROC curves can be plotted by thresholding the anomaly scores, and the Area Under the ROC Curve (AUC) can be calculated to quantify anomaly detection performance. AUC is also used to evaluate performance compared to unsupervised anomaly detection methods. Furthermore, pixel accuracy is the most basic metric for indicating the proportion of correctly predicted pixels.
4 Results
4.1 Training implementation
The models were trained with a fixed learning rate of 0.001 for 100 epochs. The loss and optimization functions were binary cross-entropy and Adam, respectively. Batch sizes of 24 were used to train the models. When the validation loss function is reduced, the models’ weights are preserved to reduce overfitting. The models were trained using the Keras, Tensorflow and Python libraries on the Google Colaboratory virtual environment. During training and validation, the loss is primarily used to assess the discrepancy between the predicted and actual values, the dice coefficient is selected as monitoring criteria to guide hyper-parameter learning. Figure 7 shows the loss curve and the dice curve during validation. It observes that network performance differs across datasets, which is not surprising given the fact that different datasets have cracks of varying shapes and sizes, complex backgrounds, and varied surface conditions. In DeepCrack images, background intensity and crack intensity are with high contrast. Therefore, most cracks can be accurately extracted from pavement images. While Crack500 makes crack segmentation challenging due to its diverse widths and shapes. The background textures of most crack images are complex. The same problem exists in the Bridge cracks dataset. It also observes that the loss value of the 80% Crack500 dataset is higher than that of the other dataset because the proposed method added pseudo labels to the previous dataset to update it and train the proposed model (80% pseudo labels added to 80% labeled data). The more pseudo labels there are, the greater the loss because the accuracy of those labels is insufficient due to the variety of widths and shapes and the fact that the background textures of most crack images in the Ckack500 dataset are complex.
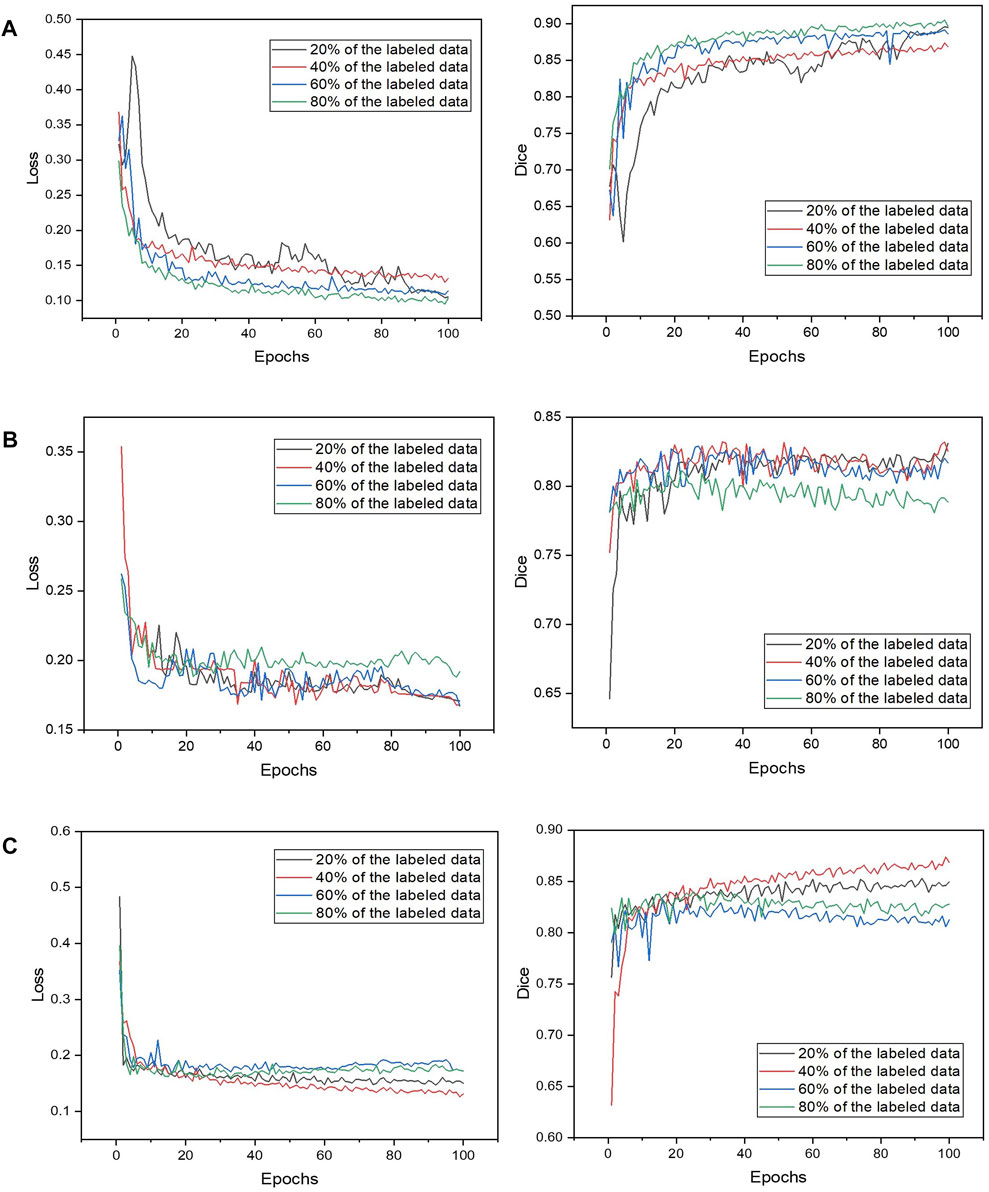
FIGURE 7. The loss curve and the dice curve during validation. (A) DeepCrack dataset; (B) Crack500 dataset; (C) The bridge crack dataset.
4.2 Experiment configuration
The proposed semi-supervised method was trained on the bridge crack dataset (Our labeled dataset). 20%, 40%, 60%, and 80% of the labeled data were used to train and test the semi-supervised crack segmentation method. When trained with 20% of the labeled data, the semi-supervised model automatically generates labels for 80% of unlabeled data by dataset updating strategy. When trained with 40%, 60%, and 80% of the labeled data, the semi-supervised model automatically generates labels twice or three times as much as the number of the training labeled data. Data augmentation was used to generate sufficient training data to ensure the generalization ability of the semi-supervised model. The quantitative results of the semi-supervised method on the bridge crack dataset are shown in Table 2. The results of the semi-supervised method were better in terms of recall, F1-Score, AUC, and IOU when only 60% of the labeled data was used. In addition, the model automatically generated labels for the unlabeled data that were twice as large as the labeled quantity. It is demonstrated that the semi-supervised method achieved good crack segmentation results. The results of the semi-supervised method on the test sets for bridge crack segmentation are shown in Figure 8. Dashed red dashed rectangle denote FP error. The DeepCrack and Crack500 datasets were used to train and test the proposed model in order to comprehensively evaluate its performance. As in previous experiments, the training was performed on 20%, 40%, 60%, and 80% of the labeled data, respectively. The experimental results of the two datasets show that semi-supervised learning-based crack segmentation is effective. The quantitative results of the semi-supervised method are shown in Tables 3, 4. When only 60% of DeepCrack’s labeled data is used, the semi-supervised model outperforms the others in terms of F1-Score, AUC, and IOU. Additionally, the model automatically generated labels twice as large as the labeled quantity for the unlabeled data. While outperformed the others in terms of recall, AUC, and IOU when trained on the Crack500 dataset with 80% labeled data. The semi-supervised learning strategy employs both unlabeled and labeled data to obtain rich data and optimize the segmentation model’s performance. Figures 9, 10 show samples of segmentation results of the semi-supervised model on the test set of the DeepCrack and Crack500 datasets, respectively. Although the semi-supervised method achieves good crack segmentation results, some FN and FP errors cannot be completely avoided. Dashed red rectangles indicate FP errors. The experimental results of the two datasets show that semi-supervised learning-based crack segmentation is effective.
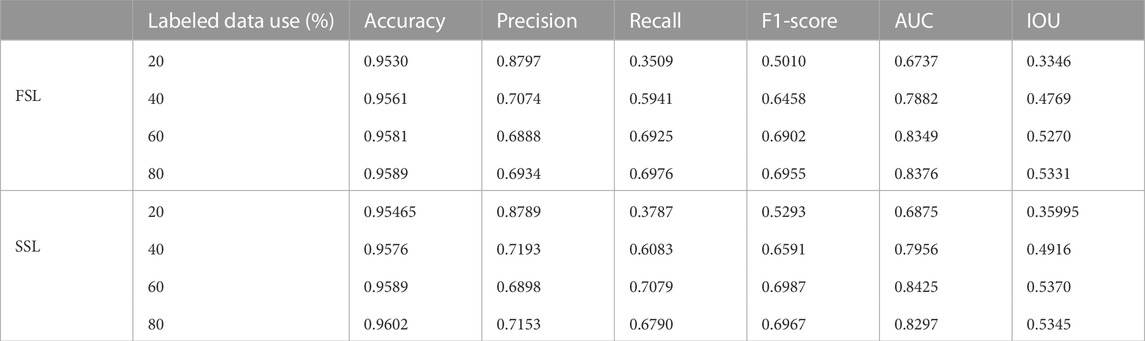
TABLE 2. The bridge crack dataset: Comparison of crack segmentation performance between fully supervised learning (FSL) and semi-supervised learning (SSL).
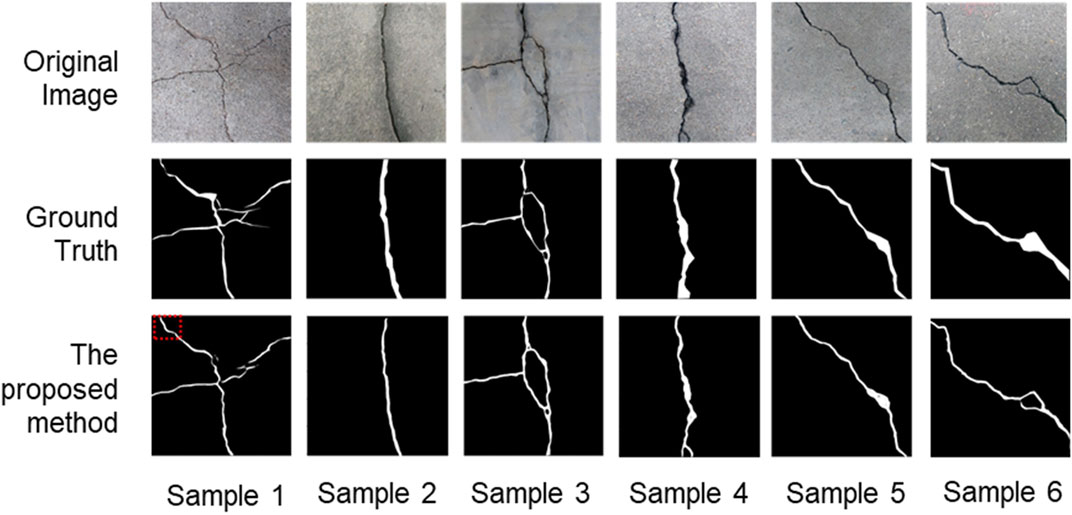
FIGURE 8. The bridge crack: Semi-supervised pixel-level segmentation results on the test set. Areas denoted by dashed red rectangles indicate FP errors.
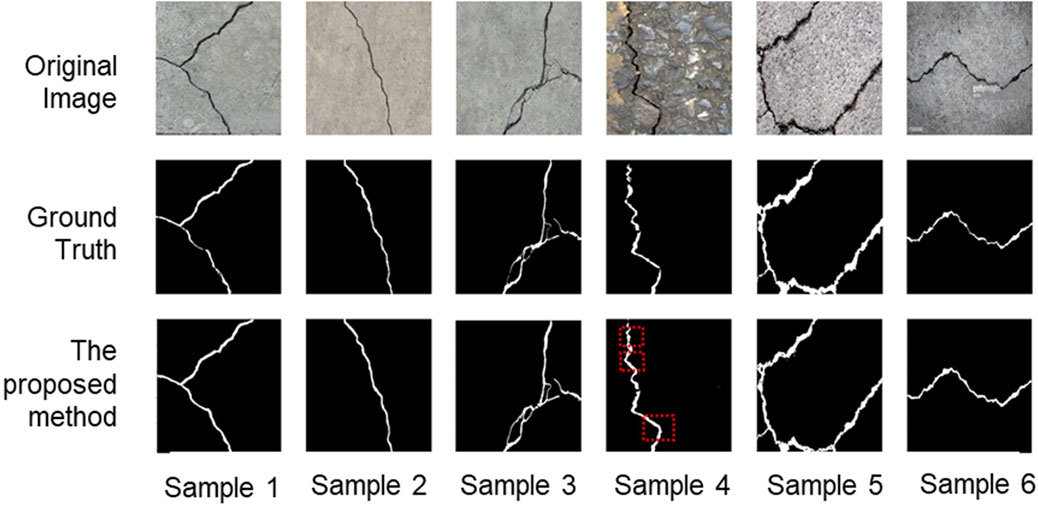
FIGURE 9. The DeepCrack: Semi-supervised pixel-level segmentation results on the test set. Areas denoted by dashed red rectangles indicate FP errors.
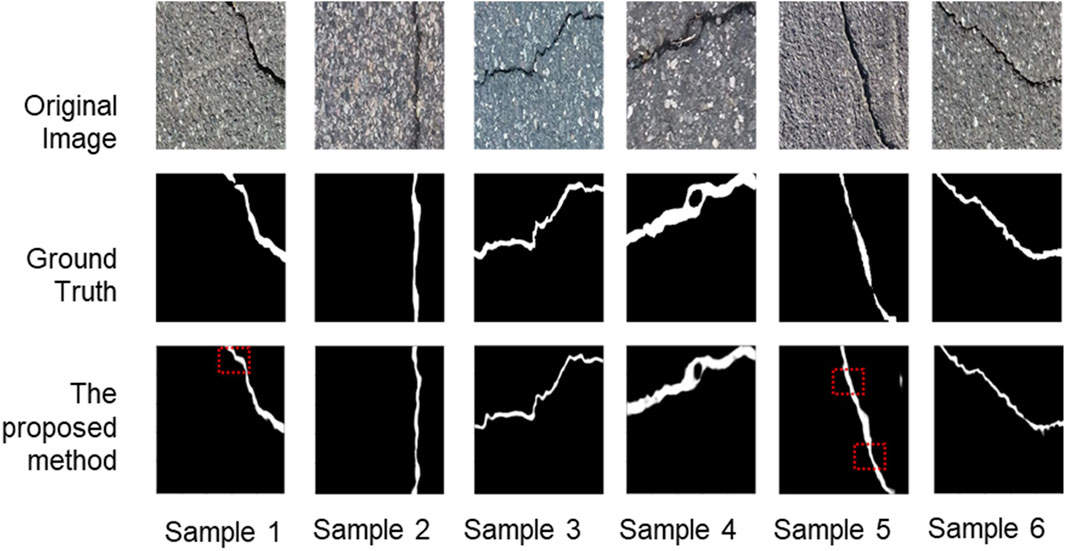
FIGURE 10. The Crack500: Semi-supervised pixel-level segmentation results on the test set. Areas denoted by dashed red rectangles indicate FP errors.
5 Discussion
5.1 Comparison with fully supervised learning
The proposed semi-supervised segmentation method and the fully supervised segmentation method are trained with the same training parameters to achieve convergence.
First, the performance of the fully supervised method and semi-supervised method were compared on the bridge crack dataset (Our labeled dataset). 20%, 40%, 60%, and 80% of the labeled data were used to train and test the semi-supervised crack segmentation method. The quantitative comparison results between the fully supervised and semi-supervised methods are shown in Table 2. Comparing the semi and fully supervised methods and training on a bridge crack dataset with 20% labeled data, the proposed semi-supervised produced the same or improved performance metrics of accuracy, recall, F1 score, AUC, and IOU results. A similar trend of improvement of accuracy, precision, recall, F1-score, AUC, and IOU was observed when training on bridge crack dataset with 40%, 60%, and 80% labeled data. When 20% and 80% of the labeled data were used for training, the results were still acceptable compared to the fully supervised approach. Although there was a 0.08% difference in precision and a 0.79% difference in AUC, it significantly reduced the workload of data labeling.
Furthermore, the semi-supervised segmentation approach produces better results than the fully supervised approach in most metrics, proving the proposed model’s efficacy.
Secondly, compared the performance of the fully supervised method and semi-supervised method was on the DeepCrack and Crack500 datasets in order to comprehensively evaluate its performance. As in previous experiments, the training was performed on 20%, 40%, 60%, and 80% of the labeled data, respectively. From the results shown in Tables 3, 4. It is obvious that the proposed model has clear advantages. The semi-supervised approach provided better results than the fully supervised approach in most metrics. As shown in the tables, the segmentation results of the fully supervised and semi-supervised methods also improve as the number of labeled data increases; this is in line with the fact that increasing the number of labeled images in a deep neural network model improves parameter estimation accuracy.
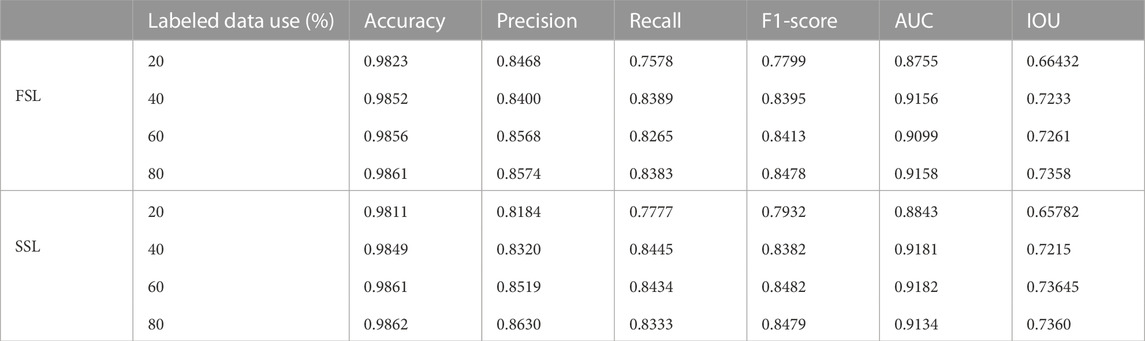
TABLE 3. The DeepCrack dataset: Comparison of crack segmentation performance between supervised learning (FSL) and semi-supervised learning (SSL).
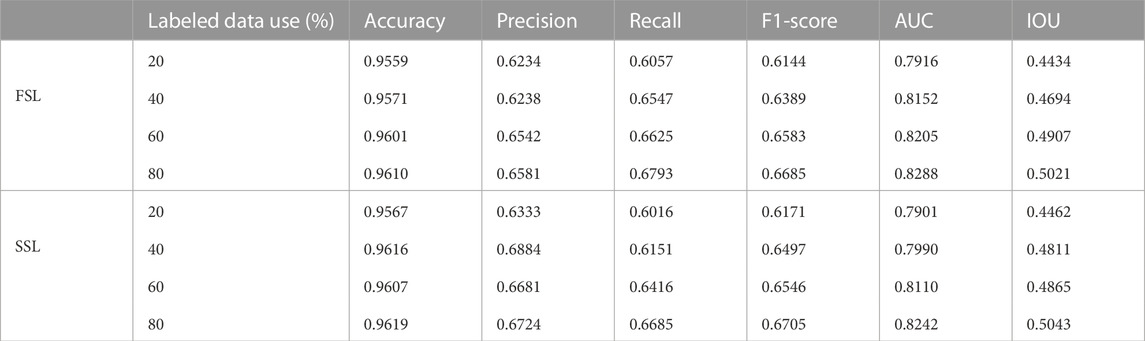
TABLE 4. The Crack500 dataset: Comparison of crack segmentation performance between fully supervised learning (FSL) and semi-supervised learning (SSL).
The semi-supervised method is superior to the fully supervised method for crack segmentation because the workload associated with labeled data is significantly reduced while ensuring accuracy. The experimental results of the two datasets show that semi-supervised learning-based crack segmentation is effective.
5.2 Comparison with Pix2Pix cGAN method
The Pix2Pix method Isola et al. (2017) and Kyslytsyna et al. (2021) is a well-known strategy for image-to-image translation. It is based on a conditional generative adversarial network, in which a target image is generated and conditioned on an input image. The generator of the Pix2Pix model uses a U-Net based architecture Ronneberger et al. (2015) and the discriminator of the model uses a convolutional “PatchGAN” classifier that only penalizes the structure at the scale of image patches. In order to verify the effectiveness of the proposed method, the results were compared with Pix2Pix method on the bridge crack, DeepCrack and Crack500 datasets. Three metrics were considered for performance comparison which include precision, recall, and F1-Score. The quantitative comparison results between Pix2Pix cGAN and semi-supervised methods are shown in Tables 5–Tables 7. The proposed method outperforms Pix2Pix cGAN in all metrics when 40% of the labeled data is used on a bridge crack dataset, but for Pix2Pix cGAN using 20%, 40%, and 60% of the labeled data. The proposed method outperforms Pix2Pix cGAN in all metrics when 20% of the labeled data is used on a DeepCrack dataset, but for Pix2Pix cGAN using 20%, 40%, and 60% of the labeled data. The proposed method outperforms Pix2Pix cGAN in terms of recall and F1-Score when 40% of labeled data is used on the Crack500 dataset, but for the Pix2Pix cGAN method 20%, 40% and 60% of labeled data are used.
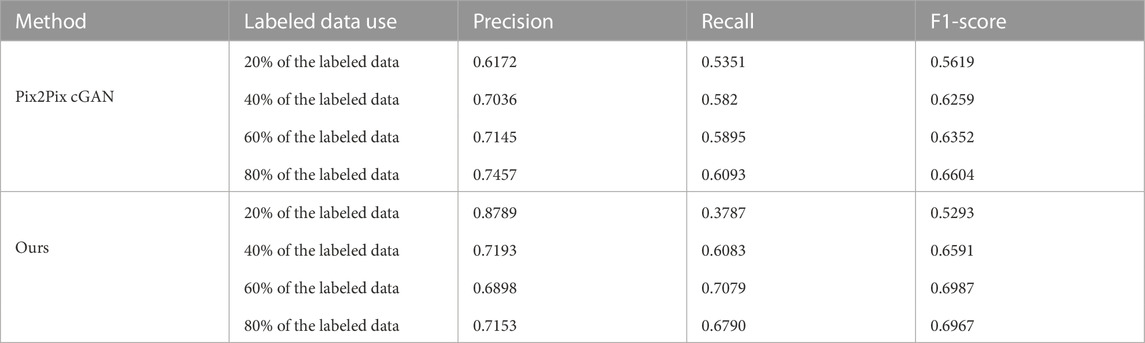
TABLE 5. The bridge crack dataset: Comparison of crack segmentation performance between Pix2Pix cGAN method and ours method.
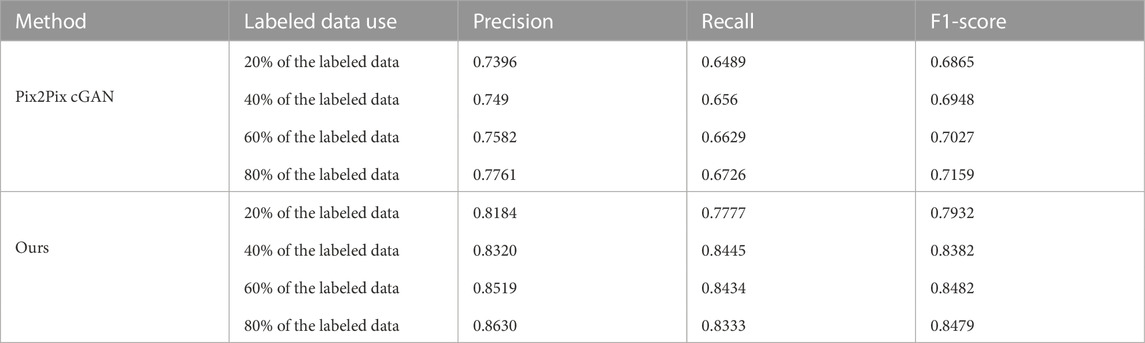
TABLE 6. The DeepCrack dataset: Comparison of crack segmentation performance between Pix2Pix cGAN method and ours method.
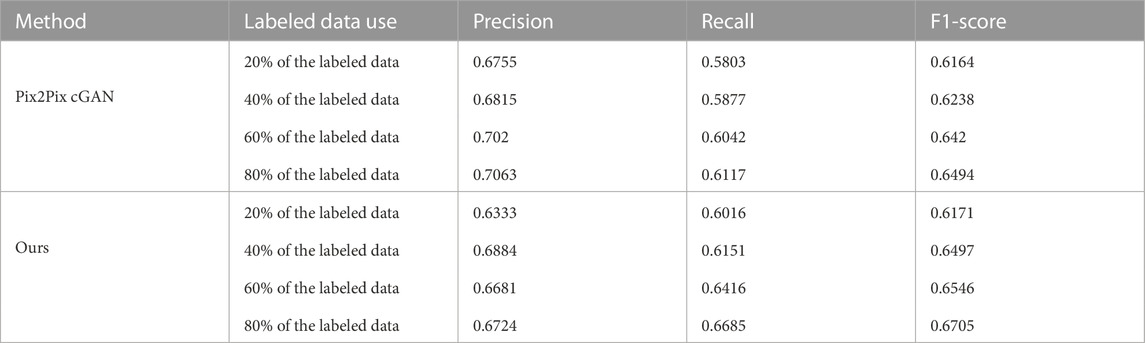
TABLE 7. The Crack500 dataset: Comparison of crack segmentation performance between Pix2Pix cGAN method and ours method.
5.3 Comparison with the existing fully supervised methods
In order to verify the effectiveness of the proposed method, the results were compared with current state-of-the-art methods on DeepCrack and Crack500 datasets. Four metrics were considered for performance comparison which include accuracy, precision, recall, and F1-Score.
5.3.1 Comparison on DeepCrack dataset
Table 8 shows the comparison of crack segmentation performance results on DeepCrack dataset. The deeply supervised network outperforms the others in terms of accuracy, recall, and F1-Score. When the semi-supervised method was compared to the deeply supervised network, the proposed method results were still acceptable despite 0.2%, 0.4%, 1.7%, and 1% gaps in accuracy, precision, recall, and F1-Score respectively. In addition, method significantly reduced the workload associated with data labeling. Furthermore, when 40% of the labeled data was only used, the proposed method was second best by outperforming HED, SegNet, RCE, DeepCrack Liu et al. (2019a), and Crackseg in all metrics. Figure 11A shows a comparison between precision, recall and F1-Score of all fully supervised and the proposed semi-supervised methods on DeepCrack dataset.
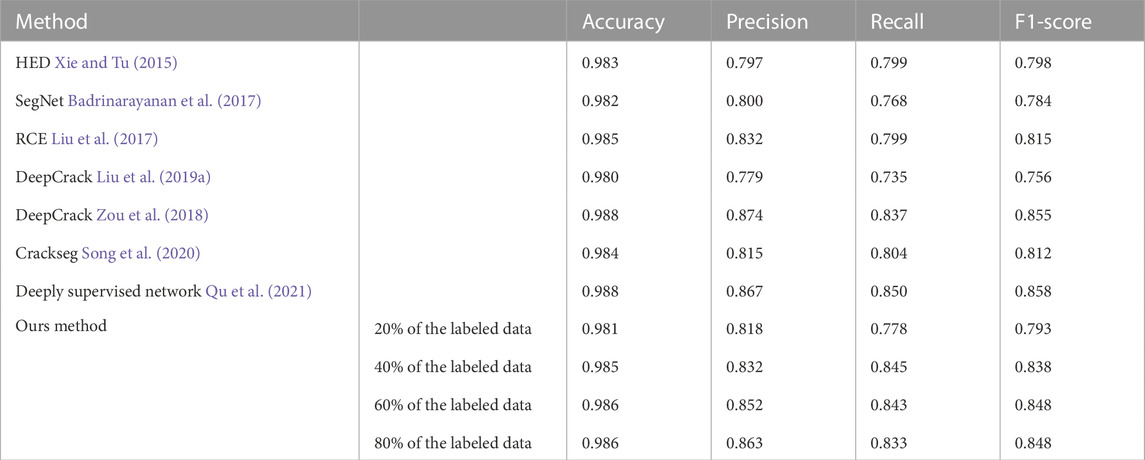
TABLE 8. Comparison of crack segmentation performance results on DeepCrack.
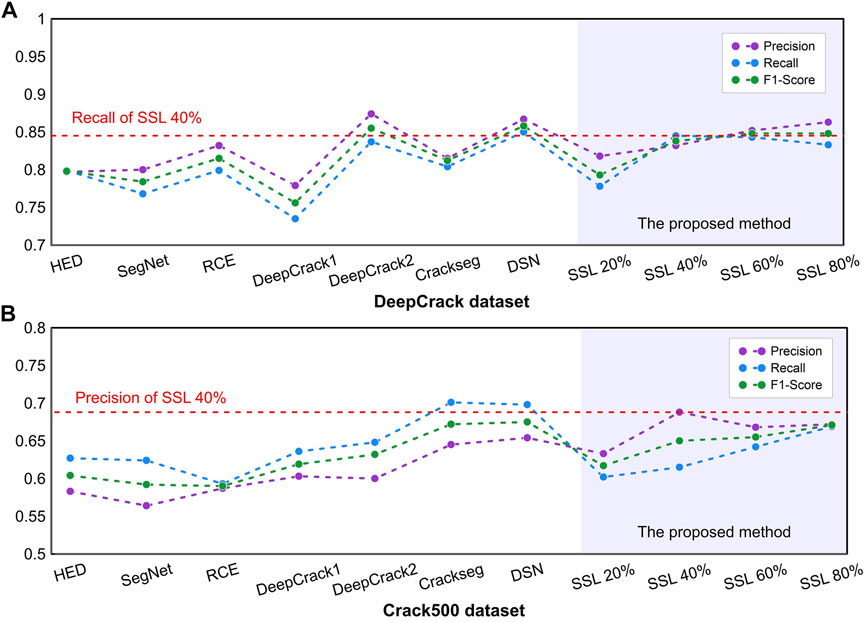
FIGURE 11. Comparison between precision, recall and F1-Score of all fully supervised and the proposed semi-supervised methods on DeepCrack and Crack500 datasets.
5.3.2 Comparison on Crack500 dataset
As shown in Table 9, the proposed method outperformed competitive methods in terms of precision, and the deeply supervised network outperformed the others in terms of accuracy and F1-Score. At the same time, the Crackseg outperformed the other methods in terms of recall. When 20% of the labeled data was only used, the proposed method outperformed HED, SegNet, and RCE in all metrics. Furthermore, when 80% of the labeled data was used, the proposed method outperformed HED, SegNet, RCE, DeepCrack Liu et al. (2019a), and DeepCrack in all metrics. Figure 11B shows a comparison between precision, recall and F1-Score of all fully supervised and the proposed semi-supervised methods on Crack500 dataset.
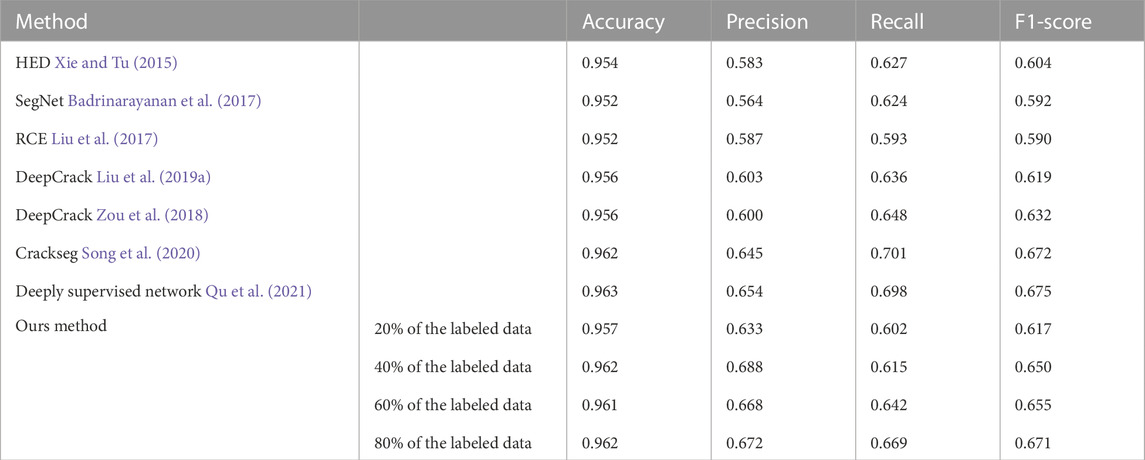
TABLE 9. Comparison of crack segmentation performance results on DeepCrack.
The experimental results of the Deepcrack and Crack500 datasets demonstrate that the proposed method is effective. Compared to the fully supervised segmentation method, the semi-supervised method significantly reduced the workload associated with the data labeling while ensuring accuracy. In addition, recent studies have shown that the semi-supervised method for crack detection is effective Wang and Su (2021) Li et al. (2020) and Shim et al. (2020).
5.4 Limitations
Although the semi-supervised approach outperforms the fully supervised methods, and the results show that the proposed method is capable of avoiding the issue of insufficient manual labeling while ensuring accuracy, the proposed method has some limitations worth discussing. A major limitation is with the network type used. The network type is critical in achieving a satisfactory result for image segmentation. We used a modified U-Net deep learning network in this paper; we will experiment with another network using the same semi-supervised approach in the future. In addition, no research has been conducted on quantifying geometric features such as crack depth, width, and length to assess civil structures’ health.
6 Conclusion
This paper proposes a novel semi-supervised learning method for crack segmentation based on deep learning. The proposed approach combines deep neural networks and a semi-supervised learning strategy to address the issue of labeling cracked images, which is expensive in terms of both finance and human resources. The semi-supervised learning approach combines labeled and unlabeled data to obtain and optimize the performance of the segmentation model. The experimental results of the DeepCrack and Crack500 datasets demonstrate that the proposed method is effective. Compared to the fully supervised segmentation method, the semi-supervised method significantly reduced the workload associated with the data labeling while ensuring accuracy. Moreover, results show that the proposed semi-supervised learning method achieved quite approaching accuracies to the established fully supervised models using multiple accuracy indexes, however, the requirement for the labeled data reduces to 40%.In future research, the results of crack image segmentation will be used to calculate the quantification of geometric features such as crack depth, width, and length to assess civil structures’ health. Crack segmentation research will also be applied in engineering.
Data availability statement
The original contributions presented in the study are included in the article/Supplementary Material, further inquiries can be directed to the corresponding author.
Author contributions
MM, YL, and ZA-H designed the algorithm. MM, CL, and wrote the manuscript. ZA-H and WW collected the data and edited the manuscript.
Funding
This study was financially supported by the National Key Research and Development Program of China (Grant No. 2018YFD1100401); the National Natural Science Foundation of China (Grant No. 52078493); the Natural Science Foundation for Excellent Young Scholars of Hunan (Grant No. 2021JJ20057); the Natural Science Foundation of Hunan Province (Grant No. 2022JJ30700); the Innovation Provincial Program of Hunan Province (Grant No. 2020RC3002), and the Science and Technology Plan Project of Changsha (No. kq2206014). These financial supports are gratefully acknowledged.
Acknowledgments
The authors also extend gratitude to editor-in-chief and two reviewers for their insightful comments.
Conflict of interest
The authors declare that the research was conducted in the absence of any commercial or financial relationships that could be construed as a potential conflict of interest.
Publisher’s note
All claims expressed in this article are solely those of the authors and do not necessarily represent those of their affiliated organizations, or those of the publisher, the editors and the reviewers. Any product that may be evaluated in this article, or claim that may be made by its manufacturer, is not guaranteed or endorsed by the publisher.
References
Adhikari, R., Moselhi, O., and Bagchi, A. (2014). Image-based retrieval of concrete crack properties for bridge inspection. Automation Constr. 39, 180–194. doi:10.1016/j.autcon.2013.06.011
Al-Huda, Z., Peng, B., Li, T., and Alfasly, S. (2022). Weakly supervised pavement crack semantic segmentation based on multi-scale object localization and incremental annotation refinement. Appl. Intell. (Dordr). 52. doi:10.1007/s10489-022-04212-w
Al-Huda, Z., Peng, B., Yang, Y., Algburi, R. N. A., Ahmad, M., Khurshid, F., et al. (2021). Weakly supervised semantic segmentation by iteratively refining optimal segmentation with deep cues guidance. Neural comput. Appl. 33, 9035–9060. doi:10.1007/s00521-020-05669-x
Ayenu-Prah, A., and Attoh-Okine, N. (2008). Evaluating pavement cracks with bidimensional empirical mode decomposition. EURASIP J. Adv. Signal Process. 2008, 861701–861707. doi:10.1155/2008/861701
Badrinarayanan, V., Kendall, A., and Cipolla, R. (2017). Segnet: A deep convolutional encoder-decoder architecture for image segmentation. IEEE Trans. Pattern Anal. Mach. Intell. 39, 2481–2495. doi:10.1109/tpami.2016.2644615
Biondini, F., Frangopol, D. M., et al. (2016). Life-cycle performance of deteriorating structural systems under uncertainty: Review. J. Struct. Eng. (N. Y. N. Y). 142, F4016001. doi:10.1061/(asce)st.1943-541x.0001544
Bursanescu, L., Bursanescu, M., Hamdi, M., Lardigue, A., and Paiement, D. (2001). “Three-dimensional infrared laser vision system for road surface features analysis,” in Romopto 2000: Sixth conference on optics (SPIE), 4430, 801–808.
Cao, W., Liu, Q., and He, Z. (2020). Review of pavement defect detection methods. Ieee Access 8, 14531–14544. doi:10.1109/access.2020.2966881
Cheng, J. C., and Wang, M. (2018). Automated detection of sewer pipe defects in closed-circuit television images using deep learning techniques. Automation Constr. 95, 155–171. doi:10.1016/j.autcon.2018.08.006
Cheng, J., Xiong, W., Chen, W., Gu, Y., and Li, Y. (2018). “Pixel-level crack detection using u-net,” in TENCON 2018-2018 IEEE region 10 conference (IEEE), 0462–0466.
Dai, J., He, K., and Sun, J. (2015). “Boxsup: Exploiting bounding boxes to supervise convolutional networks for semantic segmentation,” in Proceedings of the IEEE international conference on computer vision, 1635–1643.
Dong, Z., Wang, J., Cui, B., Wang, D., and Wang, X. (2020). Patch-based weakly supervised semantic segmentation network for crack detection. Constr. Build. Mater. 258, 120291. doi:10.1016/j.conbuildmat.2020.120291
Fei, X., Branke, J., and Gülpınar, N. (2018). New sampling strategies when searching for robust solutions. IEEE Trans. Evol. Comput. 23, 273–287. doi:10.1109/tevc.2018.2849331
Gavilán, M., Balcones, D., Marcos, O., Llorca, D. F., Sotelo, M. A., Parra, I., et al. (2011). Adaptive road crack detection system by pavement classification. Sensors 11, 9628–9657. doi:10.3390/s111009628
Goodfellow, I., Pouget-abadie, J., Mirza, M., Xu, B., and Warde-farley, D. (2016). Generative modeling generative modeling. Annu. Plant Rev.
Gopalakrishnan, K., Khaitan, S. K., Choudhary, A., and Agrawal, A. (2017). Deep convolutional neural networks with transfer learning for computer vision-based data-driven pavement distress detection. Constr. Build. Mater. 157, 322–330. doi:10.1016/j.conbuildmat.2017.09.110
Hadjidemetriou, G. M., and Christodoulou, S. E. (2019). Vision-and entropy-based detection of distressed areas for integrated pavement condition assessment. J. Comput. Civ. Eng. 33, 04019020. doi:10.1061/(asce)cp.1943-5487.0000836
Han, C., Ma, T., Huyan, J., Huang, X., and Zhang, Y. (2021a). Crackw-net: A novel pavement crack image segmentation convolutional neural network. IEEE Trans. Intell. Transp. Syst. 23, 22135–22144. doi:10.1109/tits.2021.3095507
Han, Z., Chen, H., Liu, Y., Li, Y., Du, Y., and Zhang, H. (2021b). Vision-based crack detection of asphalt pavement using deep convolutional neural network. Iran. J. Sci. Technol. Trans. Civ. Eng. 45, 2047–2055. doi:10.1007/s40996-021-00668-x
Huyan, J., Li, W., Tighe, S., Xu, Z., and Zhai, J. (2020). Cracku-net: A novel deep convolutional neural network for pixelwise pavement crack detection. Struct. Control Health Monit. 27, e2551. doi:10.1002/stc.2551
Huyan, J., Li, W., Tighe, S., Zhai, J., Xu, Z., and Chen, Y. (2019). Detection of sealed and unsealed cracks with complex backgrounds using deep convolutional neural network. Automation Constr. 107, 102946. doi:10.1016/j.autcon.2019.102946
Isola, P., Zhu, J.-Y., Zhou, T., and Efros, A. A. (2017). “Image-to-image translation with conditional adversarial networks,” in Proceedings of the IEEE conference on computer vision and pattern recognition, 1125–1134.
Jenkins, M. D., Carr, T. A., Iglesias, M. I., Buggy, T., and Morison, G. (2018). “A deep convolutional neural network for semantic pixel-wise segmentation of road and pavement surface cracks,” in 2018 26th European signal processing conference (EUSIPCO) (IEEE), 2120–2124.
Karimpouli, S., and Kadyrov, R. (2022). Multistep super resolution double-u-net (srdun) for enhancing the resolution of berea sandstone images. J. Petroleum Sci. Eng. 216, 110833. doi:10.1016/j.petrol.2022.110833
Kim, T., and Ryu, S. (2014). Pothole db based on 2d images and video data. J. Emerg. Trends Comput. Inf. Sci. 5, 527–531.
Kingma, D. P., and Ba, J. (2014). Adam: A method for stochastic optimization. arXiv preprint arXiv:1412.6980.
Krizhevsky, A., Sutskever, I., and Hinton, G. E. (2012). Imagenet classification with deep convolutional neural networks. Adv. neural Inf. Process. Syst. 25.
Kyslytsyna, A., Xia, K., Kislitsyn, A., Abd El Kader, I., and Wu, Y. (2021). Road surface crack detection method based on conditional generative adversarial networks. Sensors 21, 7405. doi:10.3390/s21217405
Li, C., Li, Y., Han, Z., Du, Y., Mohammed, M. A., Wang, W., et al. (2022). A novel multiphase segmentation method for interpreting the 3d mesoscopic structure of asphalt mixture using ct images. Constr. Build. Mater. 327, 127010. doi:10.1016/j.conbuildmat.2022.127010
Li, G., Wan, J., He, S., Liu, Q., and Ma, B. (2020). Semi-supervised semantic segmentation using adversarial learning for pavement crack detection. IEEE Access 8, 51446–51459. doi:10.1109/access.2020.2980086
Li, L.-F., Ma, W.-F., Li, L., and Lu, C. (2019). Research on detection algorithm for bridge cracks based on deep learning. Acta Autom. Sin. 45, 1727–1742.
Li, Q., Zou, Q., Zhang, D., and Mao, Q. (2011). Fosa: F* seed-growing approach for crack-line detection from pavement images. Image Vis. Comput. 29, 861–872. doi:10.1016/j.imavis.2011.10.003
Lin, D., Dai, J., Jia, J., He, K., and Sun, J. (2016). “Scribblesup: Scribble-supervised convolutional networks for semantic segmentation,” in Proceedings of the IEEE conference on computer vision and pattern recognition, 3159–3167.
Liu, J., Yang, X., Lau, S., Wang, X., Luo, S., Lee, V. C.-S., et al. (2020). Automated pavement crack detection and segmentation based on two-step convolutional neural network. Computer-Aided. Civ. Infrastructure Eng. 35, 1291–1305. doi:10.1111/mice.12622
Liu, Y., Cheng, M.-M., Hu, X., Wang, K., and Bai, X. (2017). “Richer convolutional features for edge detection,” in Proceedings of the IEEE conference on computer vision and pattern recognition, 3000–3009.
Liu, Y., Yao, J., Lu, X., Xie, R., and Li, L. (2019a). Deepcrack: A deep hierarchical feature learning architecture for crack segmentation. Neurocomputing 338, 139–153. doi:10.1016/j.neucom.2019.01.036
Liu, Z., Cao, Y., Wang, Y., and Wang, W. (2019b). Computer vision-based concrete crack detection using u-net fully convolutional networks. Automation Constr. 104, 129–139. doi:10.1016/j.autcon.2019.04.005
Long, J., Shelhamer, E., and Darrell, T. (2015). “Fully convolutional networks for semantic segmentation,” in Proceedings of the IEEE conference on computer vision and pattern recognition, 3431–3440.
Maeda, H., Sekimoto, Y., Seto, T., Kashiyama, T., and Omata, H. (2018). Road damage detection and classification using deep neural networks with smartphone images. Computer-Aided Civ. Infrastructure Eng. 33, 1127–1141. doi:10.1111/mice.12387
Mohammed, M. A., Han, Z., and Li, Y. (2021). Exploring the detection accuracy of concrete cracks using various cnn models. Adv. Mater. Sci. Eng. 2021, 1–11. doi:10.1155/2021/9923704
Nguyen, N. H. T., Perry, S., Bone, D., Le, H. T., and Nguyen, T. T. (2021). Two-stage convolutional neural network for road crack detection and segmentation. Expert Syst. Appl. 186, 115718. doi:10.1016/j.eswa.2021.115718
Nhat-Duc, H., Nguyen, Q.-L., and Tran, V.-D. (2018). Automatic recognition of asphalt pavement cracks using metaheuristic optimized edge detection algorithms and convolution neural network. Automation Constr. 94, 203–213. doi:10.1016/j.autcon.2018.07.008
Patricio, M., Maravall, D., Usero, L., and Rejón, J. (2005). “Crack detection in wooden pallets using the wavelet transform of the histogram of connected elements,” in International work-conference on artificial neural networks (Springer), 1206–1213.
Peng, B., Al-Huda, Z., Xie, Z., and Wu, X. (2020). Multi-scale region composition of hierarchical image segmentation. Multimed. Tools Appl. 79, 32833–32855. doi:10.1007/s11042-020-09346-y
Qu, Z., Cao, C., Liu, L., and Zhou, D.-Y. (2021). A deeply supervised convolutional neural network for pavement crack detection with multiscale feature fusion. IEEE Trans. Neural Netw. Learn. Syst. 33, 4890–4899. doi:10.1109/tnnls.2021.3062070
Rafiei, M. H., and Adeli, H. (2017). A novel machine learning-based algorithm to detect damage in high-rise building structures. Struct. Des. Tall Spec. Build. 26, e1400. doi:10.1002/tal.1400
Ren, S., He, K., Girshick, R., and Sun, J. (2015). Faster r-cnn: Towards real-time object detection with region proposal networks. Adv. neural Inf. Process. Syst. 28.
Reza, A. M. (2004). Realization of the contrast limited adaptive histogram equalization (clahe) for real-time image enhancement. J. VLSI Signal Processing-Systems Signal Image Video Technol. 38, 35–44. doi:10.1023/b:vlsi.0000028532.53893.82
Ronneberger, O., Fischer, P., and Brox, T. (2015). “U-net: Convolutional networks for biomedical image segmentation,” in International Conference on Medical image computing and computer-assisted intervention (Springer), 234–241.
Seraj, F., Meratnia, N., and Havinga, P. J. (2017). “Rovi: Continuous transport infrastructure monitoring framework for preventive maintenance,” in 2017 IEEE international conference on pervasive computing and communications (PerComIEEE), 217–226.
Shim, S., Kim, J., Cho, G.-C., and Lee, S.-W. (2020). Multiscale and adversarial learning-based semi-supervised semantic segmentation approach for crack detection in concrete structures. IEEE Access 8, 170939–170950. doi:10.1109/access.2020.3022786
Song, W., Jia, G., Zhu, H., Jia, D., and Gao, L. (2020). Automated pavement crack damage detection using deep multiscale convolutional features. J. Adv. Transp. 2020, 1–11. doi:10.1155/2020/6412562
Tang, Y., Zhang, A. A., Luo, L., Wang, G., and Yang, E. (2021). Pixel-level pavement crack segmentation with encoder-decoder network. Measurement 184, 109914. doi:10.1016/j.measurement.2021.109914
Tong, Z., Gao, J., Wang, Z., Wei, Y., and Dou, H. (2019). A new method for cf morphology distribution evaluation and cfrc property prediction using cascade deep learning. Constr. Build. Mater. 222, 829–838. doi:10.1016/j.conbuildmat.2019.06.160
Tsang, D. C., and Lo, I. M. (2006). Influence of pore-water velocity on transport behavior of cadmium: Equilibrium versus nonequilibrium. Pract. Period. Hazard. Toxic. Radioact. Waste Manage. 10, 162–170. doi:10.1061/(asce)1090-025x(2006)10:3(162)
Wang, K., Gou, C., Duan, Y., Lin, Y., Zheng, X., and Wang, F.-Y. (2017). Generative adversarial networks: Introduction and outlook. IEEE/CAA J. Autom. Sin. 4, 588–598. doi:10.1109/jas.2017.7510583
Wang, W., and Su, C. (2021). Semi-supervised semantic segmentation network for surface crack detection. Automation Constr. 128, 103786. doi:10.1016/j.autcon.2021.103786
Woo, S., and Yeo, H. (2016). Optimization of pavement inspection schedule with traffic demand prediction. Procedia - Soc. Behav. Sci. 218, 95–103. doi:10.1016/j.sbspro.2016.04.013
Xie, S., and Tu, Z. (2015). “Holistically-nested edge detection,” in Proceedings of the IEEE international conference on computer vision, 1395–1403.
Xu, Y., Wei, S., Bao, Y., and Li, H. (2019). Automatic seismic damage identification of reinforced concrete columns from images by a region-based deep convolutional neural network. Struct. Control Health Monit. 26, e2313. doi:10.1002/stc.2313
Yang, F., Zhang, L., Yu, S., Prokhorov, D., Mei, X., and Ling, H. (2019). Feature pyramid and hierarchical boosting network for pavement crack detection. IEEE Trans. Intell. Transp. Syst. 21, 1525–1535. doi:10.1109/tits.2019.2910595
Zhang, A., Wang, K. C., Fei, Y., Liu, Y., Tao, S., Chen, C., et al. (2018a). Deep learning–based fully automated pavement crack detection on 3d asphalt surfaces with an improved cracknet. J. Comput. Civ. Eng. 32, 04018041. doi:10.1061/(asce)cp.1943-5487.0000775
Zhang, A., Wang, K. C., Li, B., Yang, E., Dai, X., Peng, Y., et al. (2017). Automated pixel-level pavement crack detection on 3d asphalt surfaces using a deep-learning network. Computer-Aided Civ. Infrastructure Eng. 32, 805–819. doi:10.1111/mice.12297
Zhang, D., Zou, Q., Lin, H., Xu, X., He, L., Gui, R., et al. (2018b). Automatic pavement defect detection using 3d laser profiling technology. Automation Constr. 96, 350–365. doi:10.1016/j.autcon.2018.09.019
Zhou, S., Sheng, W., Wang, Z., Yao, W., Huang, H., Wei, Y., et al. (2019). Quick image analysis of concrete pore structure based on deep learning. Constr. Build. Mater. 208, 144–157. doi:10.1016/j.conbuildmat.2019.03.006
Zhou, Y., Wang, F., Meghanathan, N., and Huang, Y. (2016). Seed-based approach for automated crack detection from pavement images. Transp. Res. Rec. 2589, 162–171. doi:10.3141/2589-18
Zhu, J., Zhong, J., Ma, T., Huang, X., Zhang, W., and Zhou, Y. (2022). Pavement distress detection using convolutional neural networks with images captured via uav. Automation Constr. 133, 103991. doi:10.1016/j.autcon.2021.103991
Zhu, S., Xia, X., Zhang, Q., and Belloulata, K. (2007). “An image segmentation algorithm in image processing based on threshold segmentation,” in 2007 third international IEEE conference on signal-image technologies and internet-based system (IEEE), 673–678.
Keywords: deep learning, crack detection, semi-supervisded, image segementation, infrastructure
Citation: Mohammed MA, Han Z, Li Y, Al-Huda Z, Li C and Wang W (2022) End-to-end semi-supervised deep learning model for surface crack detection of infrastructures. Front. Mater. 9:1058407. doi: 10.3389/fmats.2022.1058407
Received: 30 September 2022; Accepted: 06 December 2022;
Published: 21 December 2022.
Edited by:
Zhigang Zhang, Chongqing University, ChinaCopyright © 2022 Mohammed, Han, Li, Al-Huda, Li and Wang. This is an open-access article distributed under the terms of the Creative Commons Attribution License (CC BY). The use, distribution or reproduction in other forums is permitted, provided the original author(s) and the copyright owner(s) are credited and that the original publication in this journal is cited, in accordance with accepted academic practice. No use, distribution or reproduction is permitted which does not comply with these terms.
*Correspondence: Zheng Han, emhlbmdfaGFuQGNzdS5lZHUuY24mI3gwMjAwYTs=