 Zhizhong Yan*
 Xiaotong Yang
- MIIT Key Laboratory of Mathematical Theory and Computation in Information Security, School of Mathematics and Statistics, Beijing Institute of Technology, Beijing, China
This study is devoted to the analysis of the band structures of the anti-plane transverse wave (SH wave) in nanoscale layered metamaterial structures. Attention is restricted to normal incidence of waves. The localization factor is introduced to characterize the band structures. The general transfer matrix method based on the nonlocal elastic continuum theory is employed to calculate the localization factor. Based on the analysis of band structures, the influences of random disorder of the internal characteristic length and the external thickness of each sub-layer, the aperiodic arrangements, the location of different material components, the ratio of mass density, the ratio of the transverse wave velocity, the ratio of the internal characteristic length or the external thickness of each sub-layer on the band structures, the cut-off frequency, the peak points and the dense band zones are investigated and discussed in detail, which can provide some new thoughts for the designs and applications of the nanoscale wave devices.
1 Introduction
The metamaterials, phononic crystals (PCs) (Kushwaha et al., 1993), have been studied intensely over the past 2 decades due to their potential capability of controlling and tuning the propagation of acoustic/elastic waves. These metamaterials have band gap characteristics, that is, waves in the band gap frequency range are prohibited from passing through these structures. The unusual effect of PCs with band gaps has a wide range of potential important applications such as sound detectors, transducers, filters, waveguides, sensors, etc. Compared with two-dimensional (2D) and three-dimensional (3D) PCs, one dimensional (1D) layered PCs have simpler structure and can fully show the characteristics of wave propagation, thus, many experimental and theoretical researches on the band structures of 1D macroscale layered PCs are witnessed over the past decades (Nougaoui and Rouhani, 1987; Economou and Sigalas, 1994; Sigalas and Soukoulis, 1995; Luntiaov and Rogerson, 2010; Golub et al., 2012; Yu et al., 2012; Nguyen et al., 2016). The PCs are generally periodic. However, the random disorder (Chen and Wang, 2007; Yan et al., 2009; Yan et al., 2010) and quasi-periodic arrangement (Fernández-Alvarez and Velasco, 1998; Zárate et al., 1999; Barco and Ortuno, 2012; Chen et al., 2012; Yan and Zhang, 2012), may exhibit unique characteristics of a mixture of acoustic/elastic wave propagation and localization, which are of significant interest in both basic and applied sciences (Anderson, 1958). Although the macroscale quasi-periodic or aperiodic phononic crystals (APNCs) have been extensively investigated and reported in literature (Fernández-Alvarez and Velasco, 1998; Zárate et al., 1999; Barco and Ortuno, 2012; Chen et al., 2012; Yan and Zhang, 2012), (Aynaou et al., 2005; King and Cox, 2007; Sesion et al., 2007; Parsons and Andrews, 2009; Chen et al., 2010; Gazi and Bernhard, 2014), very little theoretical study on the band structures of nanoscale APNCs has been performed.
In recent years, owing to the wide potential applications in new thermo-elecrical, acousto-optical, nanoscale electro-mechanical devices and computer chips (Du et al., 2000; Hu et al., 2000; Kana et al., 2013), more and more researchers have conducted extensive research on nanoscale structures. As we all know, when the structure size is several namometers, the size effect must be considered. In this case, the constitutive relationships cannot be described accurately by the conventional elastic continuum theory (Ramprasad and Shi, 2005; Hepplestone and Srivastava, 2008). Therefore, many methods have been developed to study the mechanical behaviors of nanoscale materials and structures (Toupin, 1962; Mindlin, 1965; Eringen, 1972; Eringen, 1983; Nowinski, 1991; Gurtin et al., 1998; Aifantis, 1999; Yang et al., 2002; Eringen, 2006; Huang and Sun, 2007), in which the nonlocal elastic (NLE) continuum theory proposed by Eringen (Eringen, 1983; Eringen, 2006) can describe the long-range inter-atomic interactions and can account for the nanoscale size effect inside the structures. By utilizing the NLE continuum theory, Artan et al. (Artan and Altan, 2002) studied the effect of nonlocality on the dynamic behavior of laminated composites by means of dispersion of SV waves propagating in the direction parallel to layering. Heireche et al. (2008) studied the sound wave propagation in single-walled carbon nanotubes using NLE continuum theory, and revealed the significance of the small-scale effect on wave propagation in single-walled carbon nanotubes. Shaat (2017) presented the paradoxes in the existing solutions of the nonlocal field equation by introducing the high-order boundary conditions. Ke et al. (2012) investigated the nonlinear vibration of the piezoelectric nanobeams based on the NLE continuum theory and Timoshenko beam theory. And the influences of the nonlocal parameter, temperature change and external electric voltage on the size-dependent nonlinear vibration characteristics of the piezoelectric nanobeams are conducted. Nowinski (1984) studied the propagation of Love waves in an isotropic homogeneous elastic medium in the frame of the NLE continuum theory, and determined the nonlocal modulus by comparing the dispersion equation of the plane transverse waves with the corresponding equation given by the atomic lattice dynamics. Alibeigloo (2011) analyzed the vibration of a nano-plate based on the NLE continuum theory. In addition, the nonlocality also plays an important role in electronic and magnetic materials (Hashemi and Samaei, 2011; Adhikari et al., 2015; Chen et al., 2017a; Waksmanski and Pan, 2017; El-Nabulsi, 2018a; El-Nabulsi, 2018b). For example, Waksmanski and Pan (2017) presented an exact closed-form solution for the three-dimensional free vibrational response of a simply-supported and multilayered magneto-electro-elastic plate considering the nonlocal effect. Chen et al. (2017a) derived the analytical solutions for propagation of time-harmonic waves in three-dimensional magneto-electro-elastic multilayered plates with nonlocal effect, and investigated the influences of the nonlocal parameter on the dispersion curves. It should be noted that by developing the transfer matrix method based on the NLE continuum theory (Chen and Wang, 2011; Chen et al., 2013; Chen et al., 2016; Yan et al., 2018; Chen et al., 2019; Yan et al., 2020), a series of extensive studies on wave propagation in nanoscale periodic structures have been carried out. The results showed that a cut-off frequency was found, beyond which the waves are prohibited from passing through the structure. Besides, the dense band zones (DBZs) appeared in the band structures when the nanoscale size-effect is taken into account. However, the PCs in the above studies are all perfect periodic. For nearly periodic nanoscale layered PCs, Chen et al. (2017b) studied the size effect on the band structures of randomly disordered, quasi-periodic and defected nanoscale PCs. Therein, only the disorder of the external thickness of the first sub-layer is considered for simplicity. Besides, only Fibonacci sequence is studied. However, the influences of random disorder of the internal characteristic length and the external thickness of each sub-layer, the aperiodic arrangements, the location of different material components, the ratio of the mass density, the ratio of the transverse wave velocity, the ratio of the internal characteristic length or the external thickness of each sub-layer on the band structures, the cut-off frequency, the peak points and the DBZs have not been investigated, which requires a detailed study of these problems.
In this paper, we attempt to address these questions and the band structures of the SH wave in the nanoscale layered structures are studied in detail. The general transfer matrix method based on the NLE continuum theory is used to calculate the localization factor describing the band structures. A detailed parametric study is conducted to investigate the influences of random disorder of the internal characteristic length and the external thickness of each sub-layer, the aperiodic arrangements, the location of different components, the ratio of the mass density, the ratio of the transverse wave velocity, the ratio of the internal characteristic length or the external thickness of each sub-layer on the band structures, the cut-off frequency, the peak points and the DBZs.
The paper is structured as follows: Section 2 introduces the nonlocal elastic continuum theory. And the theoretical models and the general transfer matrix method are given in Section 3. Section 4 is devoted to the illustration and discussion of the results based on the calculations of the localization factor, where different influence factors are taken into account. Finally, some conclusions and future perspectives are presented in Section 5.
2 The Nonlocal Elastic Continuum Theory
In nonlocal elastic theory, owing to the long-range interaction between atoms or molecules in nanoscale materials and structures, the stresses at a point are related not only to the strains at the same point, but also to the strains at other points of the whole body. The nonlocal elastic continuum model proposed by Eringen (Eringen, 1983; Eringen, 2006) well explains that the physical phenomenon represented by one point in the continuum is affected by all other points in the whole domain, and the results are consistent with the experimental observations of lattice atomic dynamics and phonon scattering. For homogeneous, isotropic and elastic solids, the nonlocal and classical stress tensor has the following relationship, which includes an integral involving the whole region, i.e., (Eringen, 1983).
where
with the strain components
where
The kernel function
where
It is well known that the kernel function
In Eringen’s NLE theory, the integral form of Eq. 1 can be approximated in the following differential form (Eringen, 1983):
where
with
3 Theoretical Model and the General Transfer Matrix Method
The SH wave propagating normally in the nanoscale periodic structures are presented in Figure 1A. Figures 1B–D shows the schematic diagrams of the nanoscale layered PCs arranged as Thue-Morse sequence, Rudin-Shapiro sequence and Fibonacci sequence, respectively, and the random disorder, quasi-periodic and aperiodic structures considered in this paper can be obtained by the following theoretical model designs.
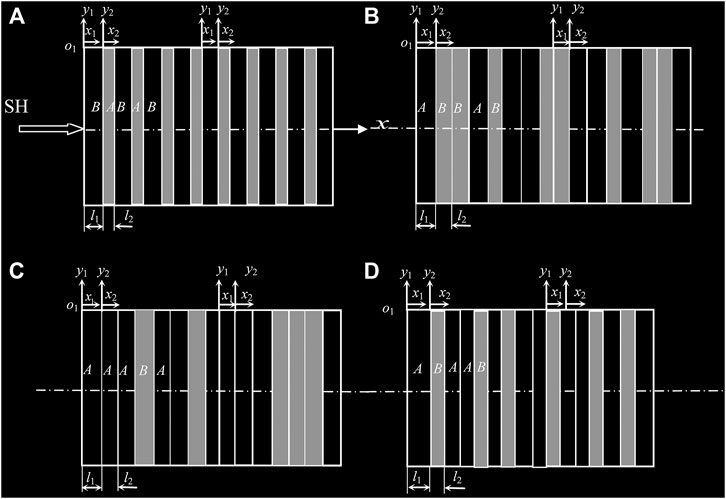
FIGURE 1. The schematic of the SH wave propagating normally in the nanoscale periodic layered structure (A), the layered PCs arranged as Thue-Morse sequence (B), Rudin-Shapiro sequence (C) and Fibonacci sequence (D).
3.1 Theoretical Model
3.1.1 Nanoscale Random Disordered Structure
Here, we consider the elastic SH waves propagating in normally distributed randomly disordered PCs. let
where
3.1.2 Nanoscale Quasi-Periodic Structure
Here, we consider the nanoscale quasi-periodic layered structures arranged in the Fibonacci sequence (Merlin et al., 1985) as shown in Figure 1D. The Fibonacci sequence can be obtained by repeating operations of the concurrent substitution rules:
3.1.3 Nanoscale Aperiodic Structures
Being a bridge of linking periodic models with quasi-periodic systems in a geometrical structure, Thue-Morse system (Bovier and Ghez, 1995) and Rudin-Shapiro systems illustrated in Figures 1B,C are thought to be more random than the quasi-periodic Fibonacci lattices.
The Thue-Morse sequence is based on the two letter alphabet
The Rudin-Shapiro sequence is an infinite sequence and can be generated by a four state automaton as follows:
3.2 General Transfer Matrix Method
In this section, we start from the periodic system, i.e., the normal propagation of the time-harmonic SH elastic waves in a nanoscale periodic multilayered phononic crystal is considered. This structure depicted in Figure 1A is composed of materials
By introducing the dimensionless local coordinate
where
Then, the general harmonic solution for the
where
Then, the state vector
where the matrices
Obviously, the two state vectors in Eq. 15 have the following relation by eliminating the common vector, i.e.,
where
The displacements and nonlocal stresses are continuous at the interface of two adjacent sub-layers in the same unit-cell and between the
From Eqs 17, 18, the following relation can be obtained
which shows the relationship between the state vectors of the
The detailed mathematical derivation is not given here for the sake of brevity. Interested readers may refer to many publications for more details.
In this paper, we use the well-defined localization factor to characterize the band structures and localization phenomenon of 1D nanoscale layered PCs. The localization factor is defined as the minimum positive Lyapunov exponent which describes the average exponential rate of growth or attenuation of the wave amplitude (Gastanier and Pierre, 1997). And it can be calculated by using the Wolf’s method (Wolf et al., 1985) once the transfer matrix is obtained. If the dimension of the transfer matrices is
where the vector in Eq. 21 is given by
in which
4 Numerical Results and Discussions
In this section, the band structures and localization properties of the anti-plane elastic waves propagating normally in nanoscale layered structures are studied by the general transfer matrix method. Different factors affecting the band structures are considered. Numerical results are presented and discussed. During the calculations, we refer to Ref. (Yan et al., 2020) for the material constants and list the values in Table 1. For convenience, the frequency is normalized as

TABLE 1. Material constants.
4.1 Nanoscale Random Disordered Layered PCs
Firstly, In order to check the correctness of the present method, the 1D nanoscale periodic layered structures arranged alternately by HfO2 (
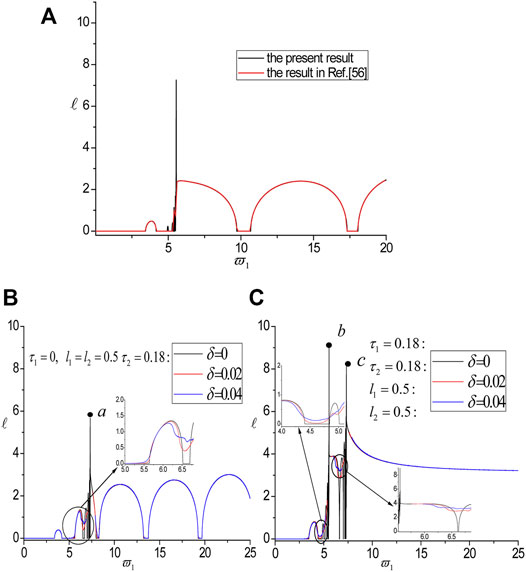
FIGURE 2. The results obtained by the current method are compared with the reference (A). The influences of δ on the localization factors and the disordered parameters are internal characteristic length τ2 of the second sub-layer (B) and the internal characteristic length and the external thickness of sub-layers A and B (C), respectively.
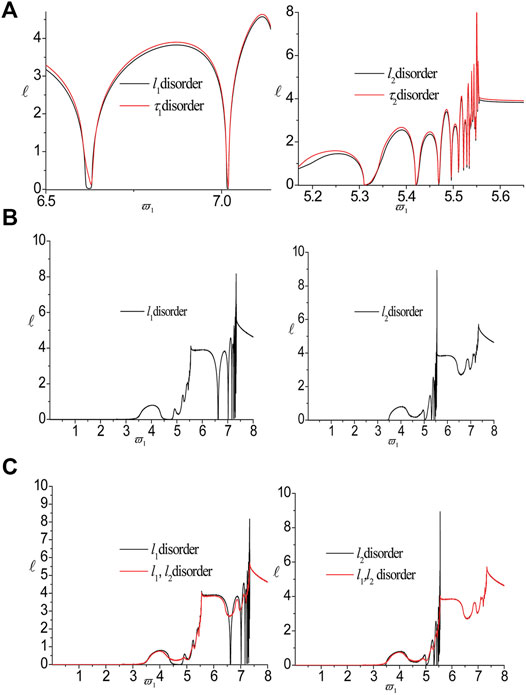
FIGURE 3. The influences of disorder on the localization factors for δ = 0.08. The internal characteristic lengths and the external thickness of the same sub-layer (A), the disorder of different sub-layers (B) and the number of disorder (C), respectively.
4.2 Nanoscale Aperiodic Layered PCs
Due to the lack of periodicity, a finite but sufficiently large number of unit-cell
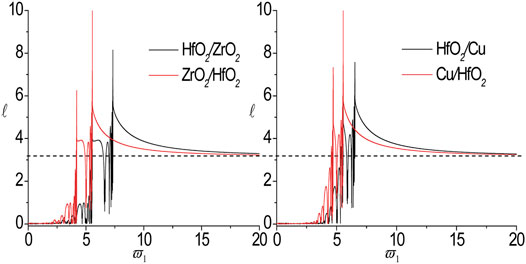
FIGURE 4. The influences of the mateiral component order on the lovalization factors of the Thue-Morse systems aperiodic systems.
In the following, we only change the material of the second sub-layer and the localization factors for the nanoscale aperiodic Thue-Morse sequences with different material combinations are presented in Figure 5. Here, the material combinations is taken as
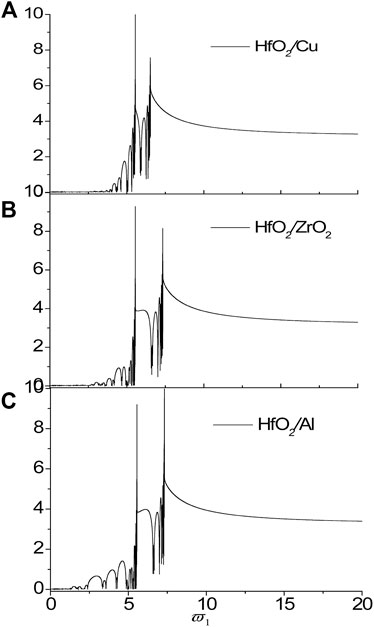
FIGURE 5. The localization factors of the SH wave propagating normally in the nanoscale aperiodic Thue-Morse sequences consisting of HfO2/Cu (A), HfO2/ZrO2 (B) and HfO2/Al (C) for τ1 = τ2 = 0.18.
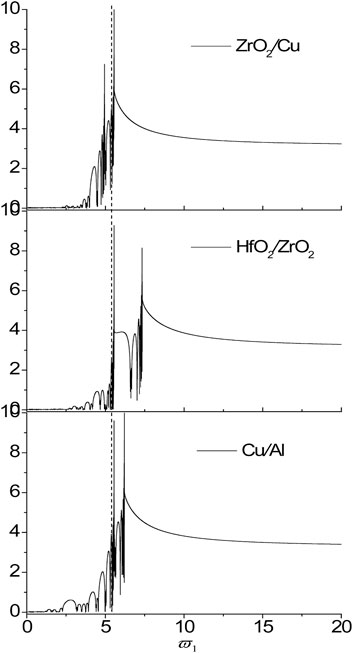
FIGURE 6. The localization factors of the SH wave propagating normally in the nanoscale aperiodic Thue-Morse sequences consisting of ZrO2/Cu, HfO2/ZrO2 and Cu/Al for τ1 = τ2 = 0.18.
Next, the band structures of the systems with different aperiodic arrangements are calculated. As shown in Figures 1B–D, three different aperiodic arrangements are chosen, i.e., the Thue-Morse sequence, the Rudin-Shaprio sequence and the Fibonacci sequence, respectively. Figure 7 shows the influences of aperiodic arrangements on localization factors of the SH wave propagating normally in the nanoscale aperiodic systems consisting of
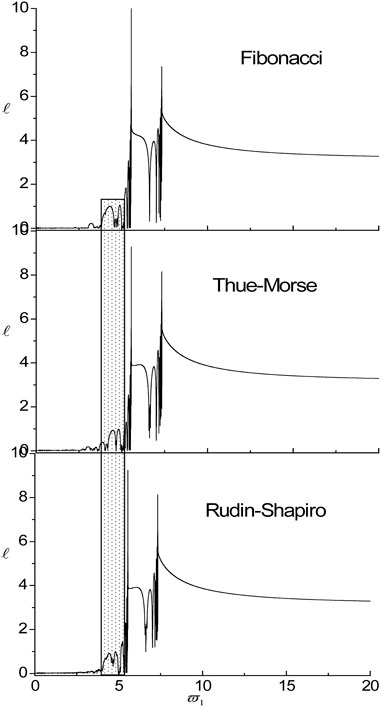
FIGURE 7. The influences of aperiodic arrangements on localization factors of the SH wave propagating normally in the nanoscale aperiodic systems consisting of HfO2/ZrO2 for τ1 = τ2 = 0.18.
Additionally, the influences of the ratio of the mass density

FIGURE 8. The influences of ratio of mass density on lacalization factors in the nanoscale Fibonacci systems consisting of Cu/Al for τ1 = τ2 = 0.18.
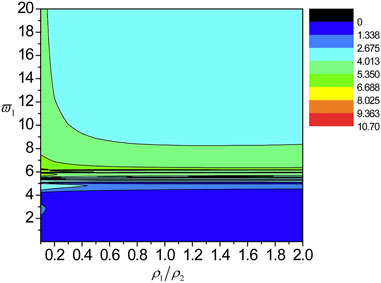
FIGURE 9. The localization factors varying with the normalized frequency and
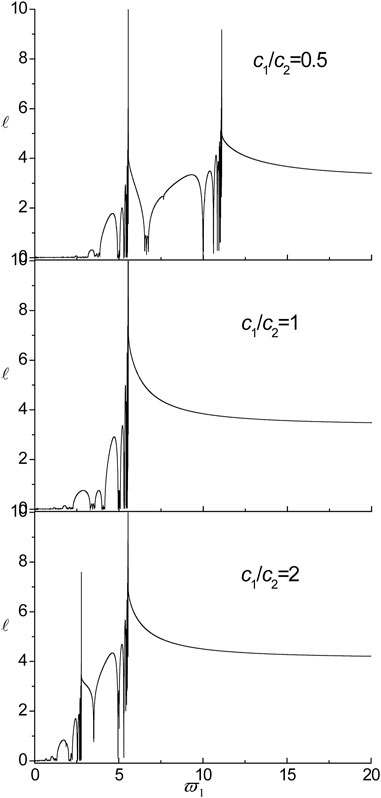
FIGURE 10. The influences of the ratio of transverse wave velocities on localization factors in the nanoscale Fibonacci systems consisting of Cu/Al for τ1 = τ2 = 0.18.
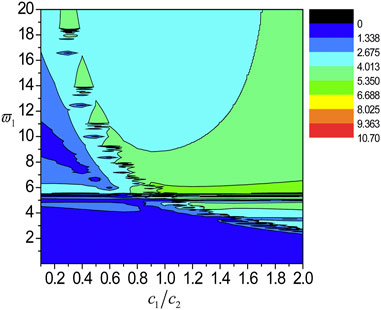
FIGURE 11. The localization factors varying with the normalized frequency and c1/c2 for the SH wave propagating normally in the nanoscale Cu/Al Fibonacci laminate for τ1 = τ2 = 0.18.
Finally, the influences of the structural parameter, i.e., the ratio of external characteristic thickness
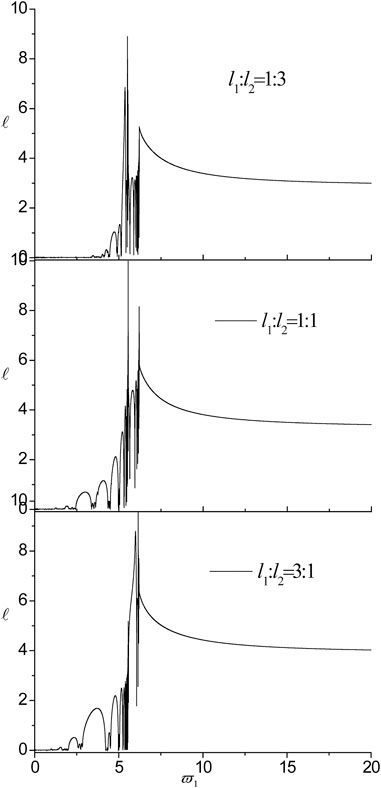
FIGURE 12. The influences of the ratio of external characteristic thickness on localization factors in the nanoscale Fibonacci systems consisting of Cu/Al for τ1 = τ2 = 0.18.
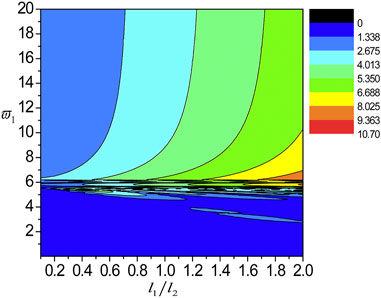
FIGURE 13. The localization factors varying with the normalized frequency and l1/l2 for the SH wave propagating normally in the nanoscale Cu/Al Fibonacci laminate for τ1 = τ2 = 0.18.
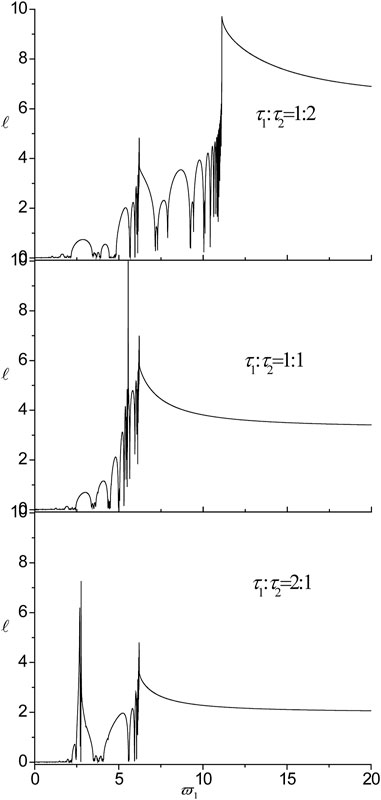
FIGURE 14. The influences of the ratio of the internal characteristic length on localization factors in the nanoscale Fibonacci systems consisting on Cu/Al for l1 = l2 = 0.5.
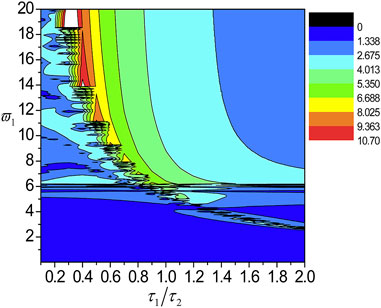
FIGURE 15. The localization factors varying with the normalized frequency and τ1/τ2 for the SH wave propagating normally in the nanoscale Cu/Al Fibonacci laminate for τ1 = τ2 = 0.18.
5 Conclusion
The results presented in this study are obtained by the numerical calculations of the wave localization properties in the nanoscale layered structures by using the general transfer matrix method based on the nonlocal elastic continuum theory. The key conclusions from this analysis can be summarized as follows:
1) No matter what kind of disorders, the disorder degree has little effect on the DBZ, the peak point, the cut-off frequency and the localization factor whose frequencies are larger than the cut-off frequency. However, the influences of the disorder caused by the internal characteristic lengths are a little bigger than those caused by the external thicknesses. The localization factors have a strong dependence on the disorder of different sub-layers and the number of disorder.
2) The first distinct band gap, the peak point, the cut-off frequency, the DBZ and the localization factor have strong dependence on the material combinations. With the exchange of material components, the distance between the two peak points becomes narrower, and the two peak points and the first distinct band gap move to the low frequency zone. The position of the peak point and the DBZ depends on the sub-layer materials under consideration.
3) The aperiodic arrangements have little effect on the peak points, the DBZs and the cut-off frequency. However, the band structures before the first peak point becomes different for the three aperiodic arrangements.
4) The first distinct band gap will emerge for
5) There is only one peak point when the ratio of transverse wave velocity is
6) The pass-bands and band gaps are affected by varying the ratio of external characteristic thickness, while the two peak points, the two DBZs and the cut-off frequency remain in the same position. In addition, the localization degree enhances with the increase of
7) When
Data Availability Statement
The original contributions presented in the study are included in the article/Supplementary Material, further inquiries can be directed to the corresponding author.
Author Contributions
All authors listed have made a substantial, direct, and intellectual contribution to the work and approved it for publication.
Conflict of Interest
The authors declare that the research was conducted in the absence of any commercial or financial relationships that could be construed as a potential conflict of interest.
Publisher’s Note
All claims expressed in this article are solely those of the authors and do not necessarily represent those of their affiliated organizations, or those of the publisher, the editors and the reviewers. Any product that may be evaluated in this article, or claim that may be made by its manufacturer, is not guaranteed or endorsed by the publisher.
Funding
The authors greatly acknowledge the financial support from the National Natural Science Foundation of China (No. 11002026, 11372039), Beijing Natural Science Foundation (No. 3133039), and the Scientific Research Foundation for the Returned Overseas Chinese Scholars (No. 20121832001).
References
Adhikari, S., Gilchrist, D., Murmu, T., and McCarthy, M. A. (2015). Nonlocal normal Modes in Nanoscale Dynamical Systems. Mech. Syst. Signal Process. 60-61, 583–603. doi:10.1016/j.ymssp.2014.12.004
Aifantis, E. C. (1999). Strain Gradient Interpretation of Size Effects. Int. J. Fract 95 (1-4), 299–314. doi:10.1007/978-94-011-4659-3_16
Alibeigloo, A. (2011). Free Vibration Analysis of Nano-Plate Using Three-Dimensional Theory of Elasticity. Acta Mech. 222, 149–159. doi:10.1007/s00707-011-0518-7
Anderson, P. W. (1958). Absence of Diffusion in Certain Random Lattices. Phys. Rev. 109, 1492–1505. doi:10.1103/physrev.109.1492
Artan, R., and Altan, B. S. (2002). Propagation of SV Waves in a Periodically Layered media in Nonlocal Elasticity. Int. J. Sol. Structures 39, 5927–5944. doi:10.1016/s0020-7683(02)00476-6
Aynaou, H., Boudouti, E. H. E., Djafari-Rouhani, B., Akjouj, A., Velasco, V. R., and Velasco, V.R (2005). Propagation and localization of acoustic waves in Fibonacci phononic circuits. J. Phys.: Condens. Matter 17, 4245–4262. doi:10.1088/0953-8984/17/27/002
Barco, O, and Ortuno, M (2012). Localization length of nearly periodic layered metamaterials. Phys Rev A 86 (2), 023846. doi:10.1103/physreva.86.023846
Bovier, A., and Ghez, J.-M. (1995). Remarks on the Spectral Properties of Tight-Binding and Kronig-Penney Models with Substitution Sequences. J. Phys. A: Math. Gen. 28, 2313–2324. doi:10.1088/0305-4470/28/8/022
Chen, A.-L., Tian, L.-Z., and Wang, Y.-S. (2017). Band Structure Properties of Elastic Waves Propagating in the Nanoscaled Nearly Periodic Layered Phononic Crystals. Acta Mechanica Solida Sinica 30, 113–122. doi:10.1016/j.camss.2017.03.005
Chen, A.-L., Wang, Y.-S., Ke, L.-L., Guo, Y.-F., and Wang, Z.-D. (2013). Wave Propagation in Nanoscaled Periodic Layered Structures. Jnl Comp. Theo Nano 10, 2427–2437. doi:10.1166/jctn.2013.3225
Chen, A.-L., and Wang, Y.-S. (2011). Size-effect on Band Structures of Nanoscale Phononic Crystals. Physica E: Low-dimensional Syst. Nanostructures 44, 317–321. doi:10.1016/j.physe.2011.08.032
Chen, A.-L., and Wang, Y.-S. (2007). Study on Band Gaps of Elastic Waves Propagating in One-Dimensional Disordered Phononic Crystals. Physica B: Condensed Matter 392, 369–378. doi:10.1016/j.physb.2006.12.004
Chen, A.-L., Wang, Y.-S., and Zhang, C. (2012). Wave Propagation in One-Dimensional Solid-Fluid Quasi-Periodic and Aperiodic Phononic Crystals. Physica B: Condensed Matter 407, 324–329. doi:10.1016/j.physb.2011.10.041
Chen, A.-L., Yan, D.-J., Wang, Y.-S., and Zhang, C. (2016). Anti-plane Transverse Waves Propagation in Nanoscale Periodic Layered Piezoelectric Structures. Ultrasonics 65, 154–164. doi:10.1016/j.ultras.2015.10.006
Chen, A.-L., Yan, D.-J., Wang, Y.-S., and Zhang, C. (2019). In-plane Elastic Wave Propagation in Nanoscale Periodic Piezoelectric/piezomagnetic Laminates. Int. J. Mech. Sci. 153-154, 416–429. doi:10.1016/j.ijmecsci.2019.02.017
Chen, J.-J., Wang, Q., and Han, X. (2010). Lamb Wave Transmission through One-Dimensional Three-Component Fibonacci Composite Plates. Mod. Phys. Lett. B 24, 161–167. doi:10.1142/s0217984910022305
Chen, J., Guo, J., and Pan, E. (2017). Wave Propagation in Magneto-Electro-Elastic Multilayered Plates with Nonlocal Effect. J. Sound Vibration 400, 550–563. doi:10.1016/j.jsv.2017.04.001
Du, S. G., Shi, D. M., and Deng, H. (2000). Special effects and applications of nanostructured materials. Ziran Zazhi 22 (2), 101–106.
Economou, E. N., and Sigalas, M. (1994). Stop bands for elastic waves in periodic composite materials. The Journal of the Acoustical Society of America 95, 1734–1740. doi:10.1121/1.408692
El-Nabulsi, R. A. (2018). Nonlocal Approach to Energy Bands in Periodic Lattices and Emergence of Electron Mass Enhancement. J. Phys. Chem. Sol. 122, 167–173. doi:10.1016/j.jpcs.2018.06.028
El-Nabulsi, R. A. (2018). On Nonlocal Complex Maxwell Equations and Wave Motion in Electrodynamics and Dielectric media. Opt. Quant Electron. 50, 170. doi:10.1007/s11082-018-1436-x
Eringen, A. C. (2006). Nonlocal Continuum Mechanics Based on Distribution. Int. J. Eng. Sci. 44 (3-4), 141–147. doi:10.1016/j.ijengsci.2005.11.002
Eringen, A. C. (1972). Nonlocal Polar Elastic Continua. Int. J. Eng. Sci. 10 (1), 1–16. doi:10.1016/0020-7225(72)90070-5
Eringen, A. C. (1983). On Differential Equations of Nonlocal Elasticity and Solutions of Screw Dislocation and Surface Waves. J. Appl. Phys. 54 (9), 4703–4710. doi:10.1063/1.332803
Fernández-Alvarez, L., and Velasco, V. R. (1998). Sagittal Elastic Waves in Fibonacci Superlattices. Phys. Rev. B 57, 14141–14147. doi:10.1103/physrevb.57.14141
Gastanier, M. P., and Pierre, C. (1997). Predicting Localization via Lyapunov Exponents Statistics. J. Sound Vib 203, 151–157.
Gazi, N. A., and Bernhard, G. (2014). Quasi-periodic Fibonacci and Periodic One-Dimensional Hypersonic Phononic Crystals of Porous Silicon: Experiment and Simulation. J. Appl. Phys. 116, 094903.
Golub, M. V., Zhang, C., and Wang, Y.-S. (2012). SH-wave Propagation and Scattering in Periodically Layered Composites with a Damaged Layer. J. Sound Vibration 331, 1829–1843. doi:10.1016/j.jsv.2011.12.008
Gurtin, M. E., Weissmüller, J., and Larché, F. (1998). A General Theory of Curved Deformable Interfaces in Solids at Equilibrium. Philosophical Mag. A 78 (5), 1093–1109. doi:10.1080/01418619808239977
Hashemi, S. H., and Samaei, A. T. (2011). Buckling Analysis of Micro/nanoscale Plates via Nonlocal Elasticity Theory. Physica E: Low-dimensional Syst. Nanostructures 43, 1400–1404. doi:10.1016/j.physe.2011.03.012
Heireche, H., Tounsi, A., Benzair, A., Maachou, M., and Adda Bedia, E. A. (2008). Sound Wave Propagation in Single-Walled Carbon Nanotubes Using Nonlocal Elasticity. Physica E: Low-dimensional Syst. Nanostructures 40, 2791–2799. doi:10.1016/j.physe.2007.12.021
Hepplestone, S. P., and Srivastava, G. P. (2008). Hypersonic Modes in Nanophononic Semiconductors. Phys. Rev. Lett. 101 (10), 105502. doi:10.1103/physrevlett.101.105502
Hu an, A., Jiang Shu-sheng, S. S., Peng Ru-Wen, R. W., Zhang Chun-sheng, C. S., and Feng Duan, D. (1992). Extended One-Dimensional Fibonacci Structures. Acta Phys. Sin. 41 (1), 62–68. doi:10.7498/aps.41.62
Hu, H., Li, D.-J., Zhu, J.-L., and Xiong, J.-J. (2000). Size Effects on Excitons in Nano-Rings. J. Phys. Condens. Matter 12, 9145–9151. doi:10.1088/0953-8984/12/43/304
Huang, G. L., and Sun, C. T. (2007). Continuum Modelling of Solids with Micro/nanostructures. Philosophical Mag. 87, 3689–3707. doi:10.1080/14786430701400137
Kana, N., Khamlich, S., Kana Kana, J. B., and Maaza, M. (2013). Peculiar Surface Size-Effects in Nacl Nano-Crystals. Surf. Rev. Lett. 20, 1350001. doi:10.1142/s0218625x13500017
Ke, L.-L., Wang, Y.-S., and Wang, Z.-D. (2012). Nonlinear Vibration of the Piezoelectric Nanobeams Based on the Nonlocal Theory. Compos. Structures 94, 2038–2047. doi:10.1016/j.compstruct.2012.01.023
King, P. D. C., and Cox, T. J. (2007). Acoustic Band Gaps in Periodically and Quasiperiodically Modulated Waveguides. J. Appl. Phys. 102, 014902. doi:10.1063/1.2749483
Kissel, G. J. (1991). Localization Factor for Multichannel Disordered Systems. Phys. Rev. A. 44, 1008–1014. doi:10.1103/physreva.44.1008
Kushwaha, M. S., Halevi, P., Dobrzynski, L., and Djafari-Rouhani, B. (1993). Acoustic Band Structure of Periodic Elastic Composites. Phys. Rev. Lett. 71, 2022–2025. doi:10.1103/physrevlett.71.2022
Luntiaov, M., and Rogerson, G. A. (2010). Long Wave Motion in Layered Elastic media. Int. J. Eng. Sci. 48 (21), 1856–1871.
Merlin, R., Bajema, K., Clarke, R., Juang, F.-Y., and Bhattacharya, P. K. (1985). Quasiperiodic GaAs-AlAs Heterostructures. Phys. Rev. Lett. 55, 1768–1770. doi:10.1103/physrevlett.55.1768
Mindlin, R. D. (1965). Second Gradient of Strain and Surface-Tension in Linear Elasticity. Int. J. Sol. Structures 1 (4), 417–438. doi:10.1016/0020-7683(65)90006-5
Nguyen, T. T., Abdelmoula, R., Li, J., Roussigne, Y., and Stashkevich, A. (2016). Wave Propagating in Multilayers Composed of Piezo Electric and Piezo Magnetic Layers. Composites B: Eng. 93, 289–301. doi:10.1016/j.compositesb.2016.03.019
Nougaoui, A., and Rouhani, B. D. (1987). Elastic Waves in Periodically Layered Infinite and Semi-infinite Anisotropic media. Surf. Sci. 185, 125–153. doi:10.1016/s0039-6028(87)80618-0
Nowinski, J. L. (1984). On the Nonlocal Aspects of the Propagation of Love Waves. Int. J. Eng. Sci. 22, 383–392. doi:10.1016/0020-7225(84)90073-9
Nowinski, J. L. (1991). On Wave Propagation in an Elastic Micropolar Medium with Nonlocal Cohesive Forces. J. Franklin Inst. 328 (4), 459–470. doi:10.1016/0016-0032(91)90020-4
Parsons, L. C., and Andrews, G. T. (2009). Observation of Hypersonic Phononic crystal Effects in Porous Silicon Superlattices. Appl. Phys. Lett. 95, 241909. doi:10.1063/1.3275742
Ramprasad, R., and Shi, N. (2005). Scalability of Phononic crystal Heterostructures. Appl. Phys. Lett. 87 (11), 111101. doi:10.1063/1.2043242
Sesion, P. D., Albuquerque, E. L., Chesman, C., and Freire, V. N. (2007). Acoustic Phonon Transmission Spectra in Piezoelectric AlN/GaN Fibonacci Phononic Crystals. Eur. Phys. J. B 58, 379–387. doi:10.1140/epjb/e2007-00249-5
Shaat, M. (2017). A General Nonlocal Theory and its Approximations for Slowly Varying Acoustic Waves. Int. J. Mech. Sci. 130, 52–63. doi:10.1016/j.ijmecsci.2017.05.038
Sigalas, M. M., and Soukoulis, C. M. (1995). Elastic-wave Propagation through Disordered And/or Absorptive Layered Systems. Phys. Rev. B Condens Matter 51, 2780–2789. doi:10.1103/physrevb.51.2780
Toupin, R. A. (1962). Elastic Materials with Couple-Stresses. Arch. Rational Mech. Anal. 11 (1), 385–414. doi:10.1007/bf00253945
Waksmanski, N., and Pan, E. (2017). An Analytical Three-Dimensional Solution for Free Vibration of a Magneto-Electro-Elastic Plate Considering the Nonlocal Effect. J. Intell. Mater. Syst. Structures 28 (11), 1501–1513. doi:10.1177/1045389x16672734
Wolf, A., Swift, J. B., Swinney, H. L., and Vastano, J. A. (1985). Determining Lyapunov Exponents from a Time Series. Physica D: Nonlinear Phenomena 16, 285–317. doi:10.1016/0167-2789(85)90011-9
Yan, D.-J., Chen, A.-L., Wang, Y.-S., Zhang, C., and Golub, M. (2018). In-plane Elastic Wave Propagation in Nanoscale Periodic Layered Piezoelectric Structures. Int. J. Mech. Sci. 142-143, 276–288. doi:10.1016/j.ijmecsci.2018.04.054
Yan, D.-J., Chen, A.-L., Wang, Y.-S., and Zhang, C. (2020). Size-effect on the Band Structures of the Transverse Elastic Wave Propagating in Nanoscale Periodic Laminates. Int. J. Mech. Sci. 180, 105669. doi:10.1016/j.ijmecsci.2020.105669
Yan, Z.-Z., and Zhang, C. (2012). Band Structures and Localization Properties of Aperiodic Layered Phononic Crystals. Physica B: Condensed Matter 407, 1014–1019. doi:10.1016/j.physb.2012.01.001
Yan, Z.-Z., Zhang, C., and Wang, Y.-S. (2009). Analysis of Wave Propagation and Localization in Periodic/disordered Layered Composite Structures by a Mass-spring Model. Appl. Phys. Lett. 94, 161909–161913. doi:10.1063/1.3119206
Yan, Z.-Z., Zhang, C., and Wang, Y.-S. (2010). Wave Propagation and Localization in Randomly Disordered Layered Composites with Local Resonances. Wave Motion 47, 409–420. doi:10.1016/j.wavemoti.2010.02.002
Yang, F., Chong, A. C. M., Lam, D. C. C., and Tong, P. (2002). Couple Stress Based Strain Gradient Theory for Elasticity. Int. J. Sol. Structures 39 (10), 2731–2743. doi:10.1016/s0020-7683(02)00152-x
Yu, D., Wen, J., Shen, H., Xiao, Y., and Wen, X. (2012). Propagation of Flexural Wave in Periodic Beam on Elastic Foundations. Phys. Lett. A 376, 626–630. doi:10.1016/j.physleta.2011.11.056
Keywords: nanoscale layered structures, disorder, band structures, nonlocal elastic continuum theory, aperiodicity
Citation: Yan Z and Yang X (2022) Band Structure Analysis of SH Wave Propagating in Nanoscale Layered Metamaterial Structures. Front. Mater. 9:842073. doi: 10.3389/fmats.2022.842073
Received: 23 December 2021; Accepted: 20 January 2022;
Published: 01 March 2022.
Edited by:
Yan-Feng Wang, Tianjin University, ChinaCopyright © 2022 Yan and Yang. This is an open-access article distributed under the terms of the Creative Commons Attribution License (CC BY). The use, distribution or reproduction in other forums is permitted, provided the original author(s) and the copyright owner(s) are credited and that the original publication in this journal is cited, in accordance with accepted academic practice. No use, distribution or reproduction is permitted which does not comply with these terms.
*Correspondence: Zhizhong Yan, enp5YW5AYml0LmVkdS5jbg==