 Xiaodan Gao
 Zhihong Zhu
 Yingde Xu
- Northeast Key Laboratory of Conservation and Improvement of Cultivated Land, Ministry of Agriculture, College of Land and Environment, Shenyang Agricultural University, Shenyang, China
Surface potential is a key electrochemical property of colloids in the study of particle interactions. However, the specific ion effects are not involved in the existing measuring methods. In this study, approaches for the estimation of the surface potential of montmorillonite with or without consideration of the specific ion effects were explored through the montmorillonite particle aggregation in the presence of Li+, Na+, and K+ ions. The montmorillonite aggregation process exhibited remarkable specific ion effects, and the critical coagulation concentration (CCC) values show the following: Li+ (271.8 mm) > Na+ (130.8 mm) > K+ (85.04 mm). Based on the mathematic relationship between electrostatic repulsion and the van der Waals attractive interaction at the CCC, the fluctuation coefficient ß was obtained. The value of β could quantify the strength of the specific ion effects of different cations. Then, the fluctuation coefficient β was introduced into the classical method for calculating the surface potential, considering the specific ion effects. The quantificational sequence of the ionic specificity of K+ and Na+ was as follows: βK = 1.433 > βNa = 1.187. Simultaneously, the surface potential considering specific ion effects can be obtained by introducing this coefficient. Our findings provide ideas for getting reliable surface potentials of charged particles in different electrolyte environments.
Introduction
Surface potential is an important parameter for the description of surface properties of charged colloid particles, which has significant effects on chemical, physical, and biological properties and processes, especially in environmental science and technology. Although this is an important property and a basic parameter in evaluating colloidal particle interactions, no reliable method for its determination is available yet (Li et al., 2004). The interaction of clay mineral colloids is a significant process in soil and water environments, significantly affecting the fate and transport of nanoparticles along with ions and contaminants (Gao et al., 2019). The acquisition of accurate and reliable surface potential is of great significance for the accurate assessment of particle-to-particle interactions.
Specific ion effects or Hofmeister effects ubiquitously exist in colloidal and biological systems (López-León et al., 2008; Kunz, 2010; Nostro and Ninham, 2012). These effects present in an interfacial reaction will bring colloidal stability and coagulation (Tian et al., 2014; Badizad et al., 2020; Katana et al., 2020) and different exchange selectivity (Liu et al., 2012) and enzyme activities (Pinna et al., 2005; Bauduin et al., 2006). It was found that under high electrolyte concentrations, ionic hydration and the ionic dispersion forces resulted in the specific ion effects (Boström et al., 2001; Moreira et al., 2006). Therefore, the specific ion effects should disappear at very low electrolyte concentrations, for the hydration and dispersion forces decreased as the ionic concentration decreased. Conversely, Liu (2013) and Kim et al. (2001) found that, with the decrease in the electrolyte concentration, the specific ion effects sharply increased. Thus, some researchers have proposed that a strong electric field exists near the charged particle surface, which is as strong as 108 V/m, and increases at a low ion concentration in the bulk solution (Li et al., 2011). The strong polarization effects, resulting from coupling between the quantum fluctuation of ionic outer shell electrons and the surface electric field, strongly change the electron cloud configuration of adsorbed ions on the charged surface, which is the origin of such specific ion effects (Xu et al., 2015).
Due to the difficulty in obtaining the surface potential, zeta potential, that is, the potential on the shear plane, is often used instead of the surface potential (Somasundaran et al., 1997; Li et al., 2020). However, it turns out that the shear plane is far away from the Stern plane but close to the Gouy plane, and the surface potential may be several times higher than the zeta potential (Missanal and Adell, 2000; Li et al., 2003, 2009; Liu et al., 2015). The surface potential of colloidal particles is dependent not only on the surface properties but also on the composition and concentration of the ambient electrolyte solutions. The classical theoretical calculation of surface potential was due to the ionic valence and ion concentration only (Li et al., 2004); however, various influences from ion species with identical valence are always neglected. Previous studies have showed that monovalent cations such as Li+, Na+, and K+ demonstrate strong specific ion effects on the kinetic stability of proteins (Broering and Bommarius, 2005), in ion exchange (Liu et al., 2013), under the influence of active energy in particle interaction (Li et al., 2015). In addition, a principle of surface potential determination of the charged particles in mixed electrolyte solutions was established considering the dielectric saturation (Zou et al., 2020). According to the aforementioned analysis, we believe that it is necessary to consider the specific ion effects in the calculation of surface potential when the particles are in Li+, Na+, and K+ solutions.
In this study, we use dynamic light scattering experiments to obtain the critical coagulation concentration (CCC) and then determine the Hamaker constant by the potential curve stepwise approaching method in LiNO3. After that, we get the fluctuation coefficient βNa and βK by calculating the surface potential at CCCNa and CCCK. It was found that the Hamaker constant was 10.75 × 10⁻²⁰ J and βK = 1.433 > βNa = 1.187, which were introduced to the classic theory equations so that a more reliable surface potential was estimated. In this article, a new approach for the determination of the surface potential of charged particles through the modified DLVO theory taking Na+ and K+-specific ion effects into account using the DLS measurement was developed.
Theory
The calculation of the Hamaker constant
In the light of DLVO theory (Visser and Israelashvily, 1985), the van der Waals (vdW) force makes particles attract together and the electrical double layer (EDL) repulsive force makes particles repel each other. As the repulsive force is stronger than the attractive force, the particles will disperse in the medium and form a stable suspension. For this case, only external pressure was applied on the particle, and the particle’s distance became closer. We considered the applied external pressure is Pext (atm), which equals to the net repulsive pressure at equilibrium. Therefore, assuming the corresponding average distance between two adjacent particle surfaces is λ (dm) at this applied pressure, we obtain the following:
where PEDL (atm) is the pressure from the electric repulsive force and PvdW (atm) is the pressure from the van der Waals force. Eq. 1 is applicable when the distance between surfaces of two particles is larger than 1.5 nm because the hydration force was observed at a distance shorter than 1.5 nm between surfaces of two particles (Ducker et al., 1992), when the hydration force cannot be neglected.
PEDL (λ) can be calculated using the Langmuir equation (Verwey et al., 1948; Hou et al., 2009) for a 1:1 type electrolyte, and it can be written as follows:
where Z is the valence of the ion producing positive adsorption on the particle surfaces, φ(λ/2) (V) is the potential at the overlapping position of two EDLs for two adjacent particles, c0 (mol/L) is the concentration of the electrolyte in a bulk solution, R (8.314 J/molK) is the gas constant, T(K) is the absolute temperature, and F (96,487 C/mol) is Faraday’s constant.
Hou et al. (2009) obtained an equation to calculate the value of φ(λ/2) from the value of the surface potential φ0; later, a more accurate equation was also obtained for calculating φ(λ/2) for a 1:1 type of electrolyte, and it can be expressed as follows:
The van der Waals attractive force PvdW was expressed as a function of the Hamaker constant, with the following relationship (Li et al., 2009):
where Aeff(J) is the effective Hamaker constant.
Next, to discuss how to get Pext, it is known that particles in the suspension have released mean kinetic energies at given temperatures because of Brownian motion. The mean kinetic energy means that the overwhelming majority of particles in the suspension have this kinetic energy. Therefore, the fast aggregation process can occur when the potential barrier (the activation energy) is lower than the particle’s mean kinetic energy. Therefore, e is simply the repulsive pressure when the potential barrier is equal to the mean kinetic energy.
According to the Einstein equation (Uhlenbeck and Ornstein, 1930), we have the following:
where
Therefore, the real velocity of a particle in the suspension is v2 = kT/m, which means the kinetic energy of the particle is 0.5 kT. This Brownian particle kinetic energy has been experimentally verified by Li et al. (2010), who found that the energy conservation theorem is still correct for a Brownian particle. However, because of viscosity resistance (γ), the actual kinetic energy of particles at the moment of collision would be less that 0.5 kT. Therefore, 0.5 kT and 0 kT are the maximum and minimum kinetic energies of the extreme cases, respectively. Then, the DLVO potential curve stepwise approaching method was used to determine the two corresponding Hamaker constants in both extreme cases. The average value of these two constants was considered the average effective Hamaker constant of the complex system.
Regarding τ = m/γ, the lowest γ value corresponds to the highest τ value, so the most likely way for a montmorillonite plate to get close to another montmorillonite plate in the aggregation process is if the tip of one plate approaches the surface of another plate, which ensures that the γ value is as low as possible.
Suppose the width of the potential barrier is λ nm at c0 = CCC and the area of the montmorillonite plate side face is S nm2 (as shown in the shaded region of the graph in Figure 1), the approximate thickness of the hydrated montmorillonite plate is 10–8 dm; we have the function of Pext as follows:
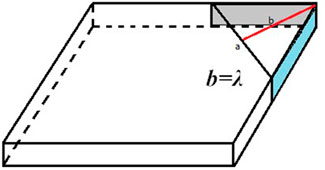
FIGURE 1. Schematic diagram of the montmorillonite crystal.
In summary, PEDL(λ)−PvdW(λ) = 16.114E/λS when c0 = CCC. According to the formula PEDL(λ)−PvdW(λ)−16.114E/λS = 0 at c0 = CCC, we could obtain the Hamaker constant and λ through the stepwise approaching method.
The classical method for calculating the surface potential
Since charges on the montmorillonite surface can be taken as a permanent charge, the surface potential for a symmetric electrolyte system (for the 1:1 type of electrolyte) can be calculated through the following equation (Li et al., 2004):
where Z is the valence of the ion producing positive adsorption on the surface of the solid particles.
Considering a flat double layer, when adsorption equilibrium is reached, the average concentration of the ion in the diffuse double layer can be defined as follows:
where κ(1/dm) is the Debye–Hückel parameter and
where ε is the dielectric constant; here, it equals 8.9 × 10⁻¹⁰ C2/Jdm for water; a0 is the activity of ions in the bulk solution. a0 could be obtained through the following equations:
where I is the ionic strength and
The values of the cation exchange capacity (CEC) = 84.8 cmolc/kg and specific surface area (S) = 716 m2/g have been determined by using the combined determination method proposed by Li et al. (2011). The values were introduced into upper Eqs 8–11; the corresponding surface potential φ0 at certain electrolyte concentrations can be calculated. Obviously, this classical method did not consider the specific ion effects in the calculation process.
Correct calculation method of the surface potential—Fluctuation coefficient ß calculation
According to the theoretical calculations in 2.1, the Hamaker constant of montmorillonite considering specific ion effects and the distance between particles λ could be obtained. We could calculate PvdW and then obtain PEDL through PEDL(λ)−PvdW(λ)−16.114E/λS = 0 at CCCNa and CCCK. Then, the true values of φtrue (λ/2) and φtrue0 at CCC considering the specific ion effects were obtained through Eqs.12, 13.
Since the ion radius of Li+ is only 0.9A with the electron shell structure 1s2, these two negative electrons were attracted by the three positive electrons from the center nucleus, and as a result, Li+ was considered as a no quantum fluctuation ion. Given the presence of specific ion effects of Na+ and K+ for their quantum fluctuation, we introduce the fluctuation coefficient β to the formula of the surface potential in order to obtain accurate results. Furthermore, β is a quantitative characterization of the strength of specific ion effects. Then, we replace Z with βZ in Eqs. 8–11. After being corrected, related equation changes are as follows:
Since
The classical calculation theory of surface potential becomes the following equation after correction:
It will give a function between surface potential φtrue0 and β at CCCs through Eqs 16–18 and then introduce φtrue0 at CCCs into this function to get the fluctuation coefficient β. The coefficients βNa and βK were used to regulate classical formulas, and then, the surface potential at any electrolyte concentrations can be calculated.
Materials and methods
Material preparation
The clay K+-montmorillonite used in this study is a nanoscale material composed of two tetrahedral Si-O layers sandwiching an octahedral Al-O layer (Ray and Okamoto, 2003). They were bought from Wu Hua Tian Bao Mineral Resources Co., Ltd. (Chifeng, China). Isomorphic substitution within the layers generates permanent negative charges on the surface of the montmorillonite colloid. The cation exchange capacity is 84.8 cmolc/kg, and the specific surface area amounts to 716 m2/g (Li et al., 2011). The montmorillonite particles were prepared according to the following procedure. First, 50.0 g montmorillonite and 10 ml of 0.1 mol/L KOH solution were successively added to a 500-ml beaker and then diluted with ultrapure water, making it up to 500 ml. After 15-min intensive sonication (SCIENTZ-IID, Ningbo, China, with 350-W output, equipped with a 10-mm diameter titanium probe), the suspension was further diluted to 5 L by ultrapure water. The montmorillonite particles with the effective hydrodynamic diameter < 200 nm were extracted and collected using the static sedimentation method (Xiong et al., 1985), estimated by the oven drying method to be approximately 1.892 g/L. As measured by the flame photometer, the concentration of K+ in the bulk suspension was less than 0.01 mmol/L and, therefore, can be neglected. Then, this suspension was diluted 10 times, and the pH value was approximately 8.0.
Dynamic light scattering measurements
A BI-200SM multi-angle laser light scattering instrument (Brookhaven Instruments Corporation, New York, United States) with an autocorrelator of BI-9000AT (Brookhaven Instruments Corporation) was used. The power of the laser device equals 200 mW and is vertically polarized with a wavelength of 532 nm. The dynamic light scattering (DLS) measurements were performed for measuring the effective hydrodynamic diameters of particles or aggregates. It can also record the changes of the hydrodynamic diameters with time at different concentrations of the electrolyte. All the measurements were at a 90° scattering angle.
Experimentally, the suspensions containing the montmorillonite particles were subjected to a 2-min period of sonication (KQ-300VDE, Shanghai, China, with 300 W output operating at 28 kHz) and then pipetted into a clean borosilicate vial. The LiNO3, NaNO3, and KNO3 solutions of different concentrations and different amounts of ultrapure water were added to ensure that the total volume was 10 ml. The electrolyte concentrations that have been uniformly mixed with the montmorillonite particles were equal to 10, 30, 50, 70, 100, 150, 200, 300, and 400 mmol/L for LiNO3 and NaNO3 and 10, 20, 30, 40, 50, 70, 100, 150, and 200 mmol/L for KNO3. The particle density of montmorillonite in these electrolyte solutions was determined to be 0.09458 g/L. Data regarding the average effective hydrodynamic diameters and the size distributions of the montmorillonite particles were recorded every 30 s. The DLS experiments were carried out at a normal temperature of 298 ± 0.5 K.
Results and discussions
The CCC values of LiNO3, NaNO3, and KNO3 in montmorillonite aggregation
We used the method developed by Jia et al. (2013) to estimate the CCC from calculations of the total average aggregation (TAA) rates at different electrolyte concentrations by DLS measurements in suspensions of polydisperse non-spherical colloids. First, the TAA rate was calculated; the TAA rate will increase linearly with the increase in the electrolyte concentration until this concentration reaches the CCC value, and the TAA rate will remain constant or slightly increase as the electrolyte concentration increases. Therefore, the electrolyte concentration at the turning point will be the CCC value (Figure 2). The CCC values for LiNO3, NaNO3, and KNO3 were 271.8, 130.8, and 85.04 mmol/L, respectively. The CCC value for Li+ is 2.078 and 3.196 times that for Na+ and K+. The different CCC values of these three ions reflected that the cations Li+, Na+, and K+ had strong specific ion effects (Parsons et al., 2011) on colloid particle interactions. The CCC is an important parameter for characterization of the aggregation process, and the coagulation capability decreased in the order K+ > Na+ > Li+.
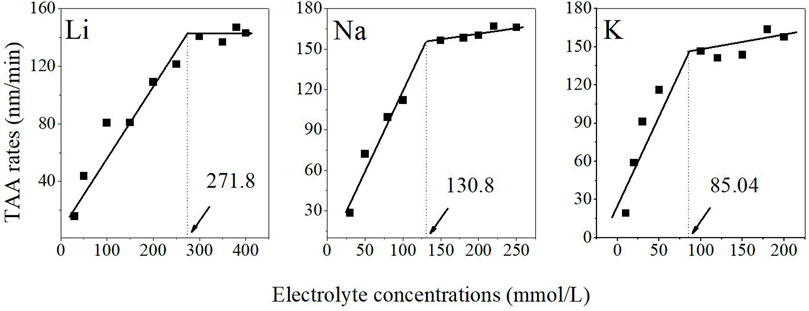
FIGURE 2. TAA rates for the aggregation of the montmorillonite particles as a function of the electrolyte concentration c0 in LiNO3, NaNO3, and KNO3 solutions. The turning points were CCC values in units of mmol/L.
The Hamaker constant of montmorillonite measured in LiNO3
By assuming Li+ ions of quantum fluctuations approaching zero, the results of the electrostatic properties of Li+-system could be correctly described by the classical electric double layer and DLVO theory. Accordingly, the Hamaker constant obtained from the Li+ system rather than the others should be accurate for characterizing the interaction between colloidal particles of montmorillonite under van der Waals forces.
At c0 = c (CCCLi) = 271.8 mmol/L, first, many different Hamaker constants (values between 10–14 × 10–20 in Figure 3) and a series values of λ are assumed, for example, 1, 1.1, 1.2, 1.3, 1.4, 1.5, 1.6, 1.7, 1.8, 1.9, 2, 2.1, 2.2, 2.3, 2.4, 2.5, 2.6, 2.7, 2.8, 2.9, 3, 3.1, 3.2, 3.3, 3.4, 3.5, 3.6, 3.7, 3.8, 3.9, and 4 nm. After that, the value of PEDL(λ) + PvdW(λ) − Pext(λ) became a function of λ. The curves of the sum force (PEDL(λ) + PvdW(λ) − 16.114E/λS at each assumed Hamaker constant and λ were obtained through the aforementioned equations. It is shown in Figure 3 that for Li+, one curve with a peak value exactly zero was selected using the stepwise approaching method. The corresponding value of the Hamaker constant was 13.32 × 10⁻²⁰ J; then, several Pext(λ)∼λ curves were calculated from a series of Hamaker constants, and the average kinetic energy was obtained by integrating the area of the exclusion barrier. The corresponding Hamaker constant was 12.21 × 10⁻²⁰ J at the point of E = 0.5 kT. In other words, the Hamaker constant for montmorillonite is Aeff = (12.21 × 10⁻²⁰ + 13.32×10⁻²⁰)/2 = 12.77 × 10⁻²⁰ J, corresponding to λ = 0.84 nm.
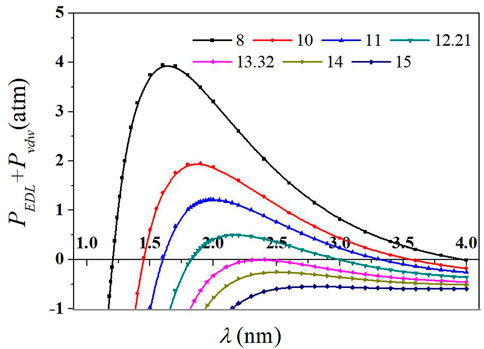
FIGURE 3. Sum force (PEDL + PvdW) with the average distance between two adjacent particle surfaces (λ) for different Hamaker constants in LiNO3 solutions. Curves in different colors represent the calculated net forces at different assuming Hamaker constants. The Hamaker constants Aeff in the units of 10−20 J.
Figure 3 shows that in the area near the particle surface, the total DLVO forces between particles are negative, indicating that the net force was the attractive force; with the increasing distance between two adjacent particles, van der Waals attraction tended to negative infinity in the form of λ−3 (Li et al., 2009), while the electrostatic repulsion tended to a finite positive. There may be a net positive force during this process.
Calculation of the surface potential
The difference of the extranuclear electron structure leads to the various quantum fluctuations of K+ and Na+, which is the origin of such specific ion effects. The calculation of surface potential through Eq. 8 discriminates the difference of the cation valence without considering the specific ion effects from the cations in the same valence, so it is essential to consider these effects in calculating the surface potential.
The CCC values of Li+, Na+, and K+ are obviously different since the specific ion effects. Using the Hamaker constant of montmorillonite and λ given in Figure 3, PvdW(λ) and Pext being in adjacent particles are calculated through Eqs. 4–7. They are PvdW = −5.508 atm and Pext = 0.03962 atm. According to the formula PEDL−PvdW = Pext at c0 = CCC, we could obtain PEDL = 5.546 atm either for Na+ or K+. By introducing PEDL = 5.546 atm into Eq 12, φtrue (λ/2) was found to be −35.62 mV and −42.18 mV for Na+ and K+, respectively. φtrue (λ/2) values were brought into Eq. 13 to get φtrue0 values of −82.91 mV and −81.72 mV for Na+ and K+ at CCCs, respectively. Then, the fluctuation coefficient βNa = 1.187 and βK = 1.433 were obtained in accordance with the theory of correct calculation of surface potential. It implies that the fluctuation ability of K+ was 1.207 and 1.433 times as strong as that for Na+ and Li+. This coefficient could be used as a quantitative characterization of specific ion effects. The larger the coefficient β is, the stronger the fluctuation of the electron cloud does, and this further results in a larger polarization effect, for example, βNa = 1.187 and βK = 1.433. It implies that K+ rather than Na + has a higher probability to appear in the proximity of the particle surface, neutralizing more surface negative charges, which leads to a lower surface potential under the same concentration.
The surface potential of montmorillonite in NaNO3 and KNO3 solutions at their CCC were −102.96 mV and −115.21 mV through the classical theory equations without considering the specific ion effects, while the φtrue0 values considering the specific ion effects were −82.91 mV and −81.72 mV for Na+ and K+. It was found that the surface potential was reduced after considering the specific ion effects. As shown in Figure 4, the difference of surface potential between considering and without considering the specific ion effects was 20.05 mV and 33.49 mV in Na+ and K+ solutions, further evidencing that specific ion effects influence the particle surface potential significantly. The surface potential differences between considering and without considering the specific ion effects in KNO3 were bigger than those in NaNO3, implying the stronger quantum fluctuation of K+ than Na+. The differences between considering and without considering the specific ion effects in NaNO3 were bigger than those in LiNO3, implying the stronger quantum fluctuation of Na + than Li+. In general, regarding the specific ion effects, K+ has the strongest ionic quantum fluctuation capability in the three, resulting in the strongest polarization and strongest electric field screening, followed by Na+ and Li+. Thus, it obviously shows the influence of specific ion effects on surface potential.
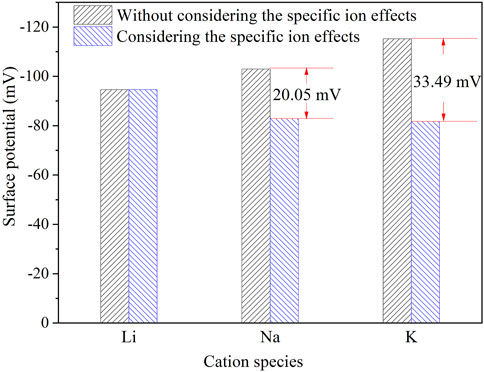
FIGURE 4. Differences of surface potential at the CCC between the classical theoretical calculation (without considering specific ion effects) and the calculation considering specific ion effects in LiNO3, NaNO3, and KNO3 solutions.
Accordingly, the surface potentials of montmorillonite at any NaNO3 and KNO3 concentration could be calculated (shown in Figure 5).
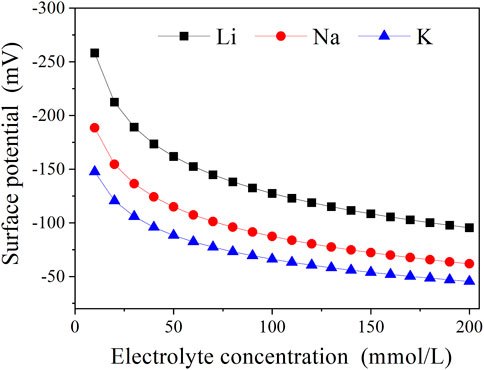
FIGURE 5. Surface potential of montmorillonite at various electrolyte concentrations considering Na+/K+-specific ion effects. The ordinate represents the absolute value of the negative surface potential.
The surface potentials of montmorillonite particles within Li+, Na+, and K+ solutions at the same concentration were all the same value, according to the classical theory calculation. However, Li+, Na+, and K+ have different quantum fluctuation properties, resulting in different effects on surface potential. So it is essential to consider the specific ion effects on the calculation of surface potential in Na/K solutions. As can be seen from figure 5, Li+ has the biggest surface potential, followed by Na+ and the lowest K+ at any given electrolyte concentration. For example, when the electrolyte concentration equals to 50 mmol/L, the surface potential values of montmorillonite particles are calculated to be −161.8 mV, −114.8 mV, and −88.39 mV for Li+, Na+, and K+, respectively. It can be seen that, at this concentration, the surface potential for Li+ is 1.409 and 1.831 times as much as those for Na+ and K+, which indicates the strongest quantum fluctuation and the strongest charge neutralization of K+, followed by Na+, and shows good agreement with the aforementioned result of specific ion effects on the CCC value.
Figure 6 shows that for Li+ and Na+ or Li+ and K+, their surface potential differences for the aggregation of montmorillonite particles increase with the decrease in ion concentrations. In other words, the decrease in ion concentrations leads to an obvious increase in specific ion effects for the cation species. This originates from the strong polarization effects, resulting from coupling between the quantum fluctuation of ionic outer shell electrons and the surface electric field, which is the origin of Na+ and K+ specific ion effects (Liu et al., 2013; Tian et al., 2014).
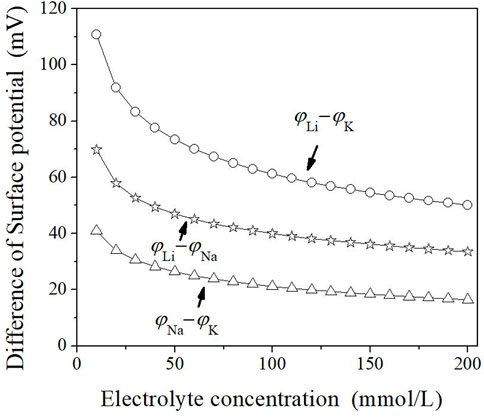
FIGURE 6. Correlations of the surface potential differences (φi−φj) between cations i and j with the electrolyte concentration c0. The ordinate represents the absolute value of the negative surface potential.
Generally, the surface potential is much higher than the Stern potential. The surface potential is about seven times as high as the Stern potential considering specific ion effects. The surface potential and Stern potential increase with decreasing polarization of ions (Liu et al., 2015). Therefore, the classical theory calculation neglecting the specific ion effects or taking Stern potential as the surface potential cannot obtain the correct result comparison with the experimental data, especially at low ion concentrations.
Conclusion
The surface potential of mineral montmorillonite was strongly affected by the specific ion effects. At any given electrolyte concentration, the effects of these three ions on surface potential from strong to weak followed the order K+ > Na+ > Li+.
A fluctuation coefficient βNa = 1.187 and βK = 1.433, which could either quantitatively characterize the strength of specific ion effects or were introduced into the calculation of surface potential in order to obtain more accurate surface potential considering specific ion effects. In addition, the potential curve stepwise approaching method, as a convenient method, can be used to measure the Hamaker constant of polydisperse colloidal particles. The effective Hamaker constant of montmorillonite was Aeff = 10.75 × 10⁻²⁰.
Data availability statement
The original contributions presented in the study are included in the article/Supplementary Material; further inquiries can be directed to the corresponding author.
Author contributions
XG: funding acquisition, sample analysis, data curation, and writing—original draft. ZZ: sample analysis and format modification. JZ: data curation and format modification. JW: supervision and writing—review and editing. YX: funding acquisition, data curation, and writing—review and editing.
Funding
This study was funded by the Scientific Research Funds Project of Education Department of Liaoning Province (LSNQN202001), the National Key Research and Development Program (2021YFD1500202), and the 2020 Open Project of Chongqing Key Laboratory of Soil Multi-scale Interfacial Process.
Acknowledgments
The authors thank Hang Li of Southwest University for the guidance of the calculation process.
Conflict of interest
The authors declare that the research was conducted in the absence of any commercial or financial relationships that could be construed as a potential conflict of interest.
Publisher’s note
All claims expressed in this article are solely those of the authors and do not necessarily represent those of their affiliated organizations, or those of the publisher, the editors, and the reviewers. Any product that may be evaluated in this article, or claim that may be made by its manufacturer, is not guaranteed or endorsed by the publisher.
References
Badizad, M. H., Koleini, M. M., Greenwell, H. C., Ayatollahi, S., Ghazanfari, M. H., and Mohammadi, M. (2020). Ion-specific interactions at calcite–brine interfaces: A nano-scale study of the surface charge development and preferential binding of polar hydrocarbons. Phys. Chem. Chem. Phys. 22, 27999–28011. doi:10.1039/D0CP04828C
Bauduin, P., Nohmie, F., Touraud, D., Neueder, R., Kunz, W., and Ninham, B. (2006). Hofmeister specific-ion effects on enzyme activity and buffer pH: Horseradish peroxidase in citrate buffer. J. Mol. Liq. 123 (1), 14–19. doi:10.1016/j.molliq.2005.03.003
Boström, M., Williams, D. R. M., and Ninham, B. W. (2001). Specific ion effects: Why DLVO theory fails for biology and colloid systems. Phys. Rev. Lett. 87, 168103. doi:10.1103/PhysRevLett.87.168103
Broering, J. M., and Bommarius, A. S. (2005). Evaluation of Hofmeister effects on the kinetic stability of proteins. J. Phys. Chem. B 109 (43), 20612–20619. doi:10.1021/jp053618+
Ducker, W. A., Senden, T. J., and Pashley, R. M. (1992). Measurement of forces in liquids using a force microscope. Langmuir 8 (7), 1831–1836. doi:10.1021/la00043a024
Gao, X., Tian, R., Liu, X., Zhu, H., Tang, Y., Xu, C., et al. (2019). Specific ion effects of Cu2+, Ca2+ and Mg2+ on montmorillonite aggregation. Appl. Clay Sci. 179, 105154. doi:10.1016/j.clay.2019.105154
Hou, J., Li, H., Zhu, H., and Wu, L. (2009). Determination of clay surface potential: A more reliable approach. Soil Sci. Soc. Am. J. 73 (5), 1658–1663. doi:10.2136/sssaj2008.0017
Jia, M., Li, H., Zhu, H., Tian, R., and Gao, X. (2013). An approach for the critical coagulation concentration estimation of polydisperse colloidal suspensions of soil and humus. J. Soils Sediments 13 (2), 325–335. doi:10.1007/s11368-012-0608-8
Katana, B., Takács, D., Bobbink, F. D., Dyson, P. J., Alsharif, N. B., Tomšič, M., et al. (2020). Masking specific effects of ionic liquid constituents at the solid–liquid interface by surface functionalization. Phys. Chem. Chem. Phys. 22, 24764–24770. doi:10.1039/D0CP02805C
Kim, H. K., Tuite, E., Nordén, B., and Ninham, B. W. (2001). Co-ion dependence of DNA nuclease activity suggests hydrophobic cavitation as a potential source of activation energy. Eur. Phys. J. E. 4 (4), 411–417. doi:10.1007/s101890170096
Kunz, W. (2010). Specific ion effects in colloidal and biological systems. Curr. Opin. Colloid Interface Sci. 15, 34–39. doi:10.1016/j.cocis.2009.11.008
Li, H., Hou, J., Liu, X., Li, R., Zhu, H., and Wu, L. (2011). Combined determination of specific surface area and surface charge properties of charged particles from a single experiment. Soil Sci. Soc. Am. J. 75, 2128–2135. doi:10.2136/sssaj2010.0301
Li, H., Peng, X., Wu, L., Jia, M., and Zhu, H. (2009). Surface potential dependence of the Hamaker constant. J. Phys. Chem. C 113 (11), 4419–4425. doi:10.1021/jp808372r
Li, H., Qing, C., Wei, S., and Jiang, X. (2004). An approach to the method for determination of surface potential on solid/liquid interface: Theory. J. Colloid Interface Sci. 275, 172–176. doi:10.1016/j.jcis.2003.12.055
Li, H., Wei, S., Qing, C., and Yang, J. (2003). Discussion on the position of the shear plane. J. Colloid Interface Sci. 258, 40–44. doi:10.1016/S0021-9797(02)00077-2
Li, Q., Tang, Y., He, X., and Li, H. (2015). Approach to theoretical estimation of the activation energy of particle aggregation taking ionic nonclassic polarization into account. AIP Adv. 5, 107218. doi:10.1063/1.4934594
Li, T., Kheifets, S., Medellin, D., and Raizen, M. G. (2010). Measurement of the instantaneous velocity of a Brownian particle. Science 328 (5986), 1673–1675. doi:10.1126/science.1189403
Li, Z., Liu, Y., Wang, D., Wang, P., Xu, R., and Xie, D. (2020). Characterizing surface electrochemical properties of simulated bulk soil in situ by streaming potential measurements. Eur. J. Soil Sci. 70 (5), 1063–1072. doi:10.1111/ejss.12794
Liu, X., Hu, F., Ding, W., Tian, R., Li, R., and Li, H. (2015). A how-to approach for estimation of surface/Stern potentials considering ionic size and polarization. Analyst 140, 7217–7224. doi:10.1039/c5an01053e
Liu, X., Li, H., Du, W., Tian, R., Li, R., and Jiang, X. (2013). Hofmeister effects on cation exchange equilibrium: Quantification of ion exchange selectivity. J. Phys. Chem. C 117 (12), 6245–6251. doi:10.1021/jp312682u
Liu, X., Li, H., Li, R., Tian, R., and Hou, J. (2012). A new model for cation exchange equilibrium considering the electrostatic field of charged particles. J. Soils Sediments 12, 1019–1029. doi:10.1007/s11368-012-0517-x
López-León, T., Santander-Qrtega, M. J., Ortega-Vinuesa, J. L., and Bastos-González, D. (2008). Hofmeister effects in colloidal systems: Influence of the surface nature. J. Phys. Chem. C 112 (41), 16060–16069. doi:10.1021/jp803796a
Missanal, T., and Adell, A. (2000). On the applicability of DLVO theory to the prediction of clay colloids stability. J. Colloid Interface Sci. 230, 150–156. doi:10.1006/jcis.2000.7003
Moreira, L. A., Boström, M., Ninham, B. W., Biscaia, E. C., and Tavares, F. W. (2006). Hofmeister effects: Why protein charge, pH titration and protein precipitation depend on the choice of background salt solution. Colloids Surfaces A Physicochem. Eng. Aspects 282, 457–463. doi:10.1016/j.colsurfa.2005.11.021
Nostro, P. L., and Ninham, B. W. (2012). Hofmeister phenomena: An update on ion specificity in biology. Chem. Rev. 112, 2286–2322. doi:10.1021/cr200271j
Parsons, D. F., Boström, M., Lo Nostro, P., and Ninham, B. W. (2011). Hofmeister effects: Interplay of hydration, nonelectrostatic potentials, and ion size. Phys. Chem. Chem. Phys. 13 (27), 12352–12367. doi:10.1039/c1cp20538b
Pinna, M., Bauduin, P., Touraud, D., Monduzzi, M., Ninham, B. W., and Kunz, W. (2005). Hofmeister effects in biology: Effect of choline addition on the salt-induced super activity of horseradish peroxidase and its implication for salt resistance of plants. J. Phys. Chem. B 109 (34), 16511–16514. doi:10.1021/jp051897v
Ray, S. S., and Okamoto, M. (2003). Polymer/layered silicate nanocomposites: A review from preparation to processing. Prog. Polym. Sci. 28 (11), 1539–1641. doi:10.1016/j.progpolymsci.2003.08.002
P., Somasundaran, B., Markovic, S., Krishnakumar, and Yu, X. (1997). Handbook of surface and colloid chemistry. New York: CRC.
Tian, R., Yang, G., Li, H., Gao, X., Liu, X., Zhu, H., et al. (2014). Activation energies of colloidal particle aggregation: Towards a quantitative characterization of specific ion effects. Phys. Chem. Chem. Phys. 16 (19), 8828–8836. doi:10.1039/c3cp54813a
Uhlenbeck, G. E., and Ornstein, L. S. (1930). On the theory of the Brownian motion. Phys. Rev. 36 (5), 823–841. doi:10.1103/physrev.36.823
Verwey, E. J. W., Overbeek, J. T. G., and Van Nes, K. (1948). Theory of the stability of lyophobic colloids: The interaction of sol particles having an electric double layer. New York: Elsevier.
Xiong, Y., Chen, J., and Zhang, J. (1985). Soil Colloid (2): Methods for soil colloid research (In Chinese). Beijing: Science Press.
Xu, C., Li, H., Hu, F., Li, S., Liu, X., and Li, Y. (2015). Non‐classical polarization of cations increases the stability of clay aggregates: Specific ion effects on the stability of aggregates. Eur. J. Soil Sci. 66 (3), 615–623. doi:10.1111/ejss.12252
Keywords: surface potential, Hamaker constant, specific ion effect, critical coagulation concentration, potential curve
Citation: Gao X, Zhu Z, Zhang J, Wang J and Xu Y (2022) Estimation of the surface potential of clay mineral taking Na+/K+-specific ion effects into account. Front. Mater. 9:943832. doi: 10.3389/fmats.2022.943832
Received: 17 May 2022; Accepted: 03 October 2022;
Published: 20 October 2022.
Edited by:
Zhiyong Gao, Central South University, ChinaReviewed by:
Isah Mohammed, King Fahd University of Petroleum and Minerals, Saudi ArabiaFang Zhou, Wuhan Institute of Technology, China
Copyright © 2022 Gao, Zhu, Zhang, Wang and Xu. This is an open-access article distributed under the terms of the Creative Commons Attribution License (CC BY). The use, distribution or reproduction in other forums is permitted, provided the original author(s) and the copyright owner(s) are credited and that the original publication in this journal is cited, in accordance with accepted academic practice. No use, distribution or reproduction is permitted which does not comply with these terms.
*Correspondence: Yingde Xu, eWluZ2RleHVAc3lhdS5lZHUuY24=