 Tyler C. Salrin
 Logan Johnson
 Caio Bragatto
- Physics Department, Coe College, Cedar Rapids, IA, United States
Haven and Verkerk studied the diffusion of ions in ionic conductive glasses with and without an external electric field to better understand the mechanisms behind ionic conductivity. In their work, they introduced the concept now known as Haven’s ratio (HR), which is defined as the ratio of the tracer diffusion coefficient (Dself) of ions to the diffusion coefficient from steady-state ionic conductivity (Dσ), calculated by the Nernst–Einstein equation. Dσ can be challenging to obtain experimentally because the number of charge carriers has to be implied, a subject still under discussion in the literature. Molecular dynamics (MD) allows for direct measurement of the mean squared displacement (r2) of diffusing cations, which can be used to calculate D, avoiding the definition of a charge carrier. Using MD, the authors have calculated the r2 of three alkali ions (Li, Na, and K) at different temperatures and concentrations in silicate glass, with and without the influence of an electric field. Results found for HR generally fell close to 0.6 at lower concentrations (x = 0.1) and close to 0.3 at higher concentrations (x = 0.2 and 0.3), comparable to the literature, implying that the electric field introduces new mechanisms for the diffusion of ions and that MD can be a powerful tool to study ionic diffusion in glasses under external electric fields.
1 Introduction
In a liquid, particles are free to flow. In contrast, a solid forms because the energy of the particles decreases, allowing them to take on a relatively ordered, three-dimensional, and more rigid structure. Even so, particles can flow within a solid, given the right circumstances. For example, in glasses, monovalent cations have been found to diffuse throughout their matrix relatively quickly. Some glass compositions have already been studied for different applications because of their remarkably high alkali ion diffusion, especially under an external electric field (Daiko et al., 2022). The interest in this particular situation goes beyond scientific curiosity. These materials may be applied in solid-state batteries and sensors, and the phenomenon is closely related to the mixed-alkali effect (MAE) (Calahoo et al., 2020).
In the case of a single charge carrier, the diffusion under the influence of an external electric field at a temperature T can be given by the ionic conductivity (
where
For a given temperature and chemical composition,
One way to look at this problem is by analyzing Haven’s ratio (
According to Haven and Verkerk (1965),
In their work, Haven and Verkek found the values of
where
where
Although experiments on the diffusion of species in glasses are common, the study of the same diffusion with an external electric field is not. In this work, glasses of the composition xA2O⋅(1-x)SiO2, with x = 0.1, 0.2, and 0.3, and A = Li, Na, and K were prepared using MD, and the
2 Methods
All simulations were run using the Large-scale Atomic/Molecular Massively Parallel Simulator (LAMMPS), an open-source molecular dynamics software application (Du and Cormack, 2022). Alkali silicate glasses of the form xA2O∙(1-x)SiO2 were simulated for x = 0.1, 0.2, and 0.3 and A = Na, Li, and K. A visual representation can be seen in Figure 1.
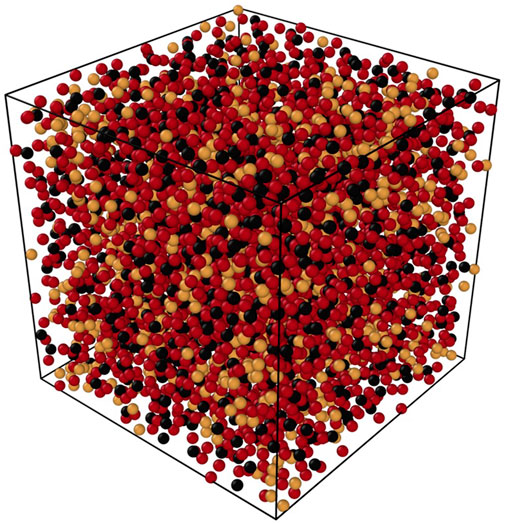
FIGURE 1. Example of the resulting glass made using the methodology described in this work, with 5100 atoms of lithium (yellow), oxygen (red), and silicon (black) at the right proportions to give a composition of 0.30 Li2O 0.70 SiO2.
Pairwise potentials developed by Pedone et al. (2006) were used to describe the interactions between the species according to
where Dij is the bond dissociation energy, aij is a function of the slope of the potential energy well, and r0 is the equilibrium bond distance. The parameters derived by Pedone et al. from binary oxide crystals pertinent to the systems in this work are given in Table 1. These potentials were chosen due to their widely reported accuracy for silicates (Pedone et al., 2008; Pedone, 2009; Jabraoui et al., 2016).
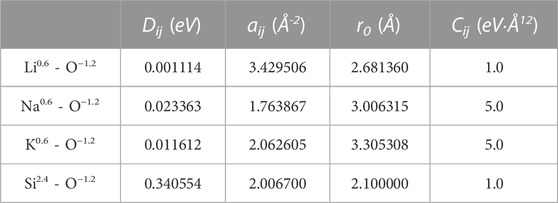
TABLE 1. Interatomic potential parameters used in alkali silicates derived by Pedone et al. (2006).
Simulation volumes were chosen to match experimentally obtained density values for each composition. The density values used to find the volume of the simulation cell for each glass composition from this work can be found in Table 218.
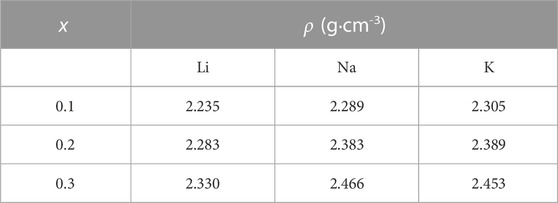
TABLE 2. Densities (ρ in g·cm−3) used to calculate the volume of the simulation cell (Bansal and Doremus, 2013).
A time step of 1 femtosecond (fs) was used for each composition. All simulations were split into two steps. The first step was the creation of the simulated glass, and the second step included testing each composition at various temperatures with and without an applied electric field. A benefit of splitting the simulations into steps was that an almost identical glass structure was present for each simulation. Each composition was simulated independently in phase one, with 5100 atoms correctly proportioned. Atoms were placed randomly inside the simulation cell, with densities, shown in Table 2, determining the volume.
In all simulations, a microcanonical ensemble that constrained the number of particles, volume, and internal energy (NVE) was used to facilitate energy distribution in the simulation cell. After initialization with an NVE ensemble for 100 ps, the simulations were introduced to a temperature of 3000 K in an NVT ensemble (constant number of particles, volume, and temperature) for 100 ps. Next, with energy equilibrium being reached, the pressure was allowed to equilibrate through the NPT ensemble (constant number of particles, pressure, and temperature) for 100 ps. The glasses were then cooled to 500 K at a rate of 1 K/ps. Here, each glass composition was duplicated among the various temperature and electric field tests.
Phase two started with another NVE initialization process for 100 ps. Then, the glass was raised to T at 1 K/ps in an NPT ensemble where T = 800 K, 1000 K, 1500 K, 2000 K, 2500 K, and 3000 K. Finally, an external electric field of 0.05 V/Å was applied across the x dimension of the simulation cell. This field strength was chosen as lower values had no detectable difference between exposed and unexposed samples. A schematic representation of the experiment is shown in Figure 2. In comparison, higher values resulted in unrealistic values for MSD and diffusion of the less mobile atoms, possibly resulting from dielectric breakdown. Similar electric field strengths were observed in other simulation works (Welch et al., 2019).
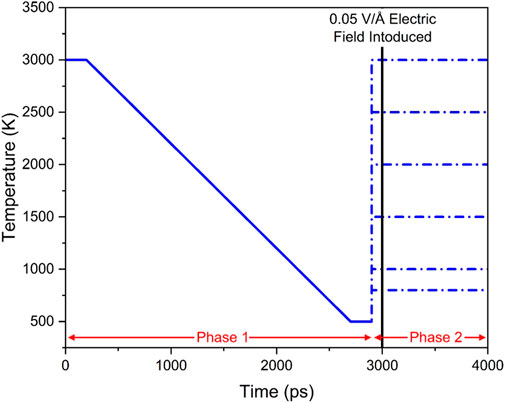
FIGURE 2. Schematic representation of preparation steps for measurement at different temperatures. Different temperatures were used to produce a reliable glass structure starting from a random distribution of the atoms. Beyond the vertical line, an electric field of 0.05 V/Å was applied to the x-axis.
Another valid and more common concern in this kind of work is the time length of the diffusional process (Du and Cormack, 2022). Due to molecular dynamic limitations, the observational time is very short compared to laboratory experiments. Therefore, in our calculations of diffusion coefficient, we discarded the first 100 ps of every run to avoid any non-diffusive behavior by the ions.
3 Results
For each glass composition and each temperature, six different experiments were completed, measuring
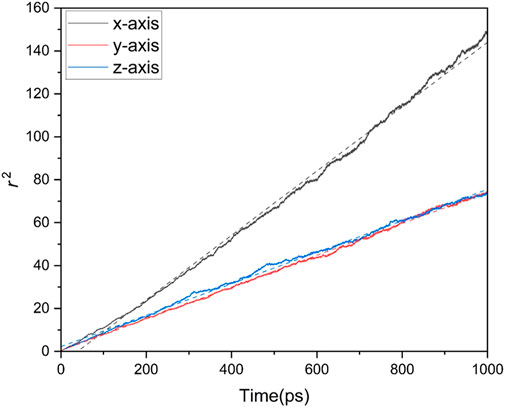
FIGURE 3.
To obtain reliable values for the diffusion coefficient
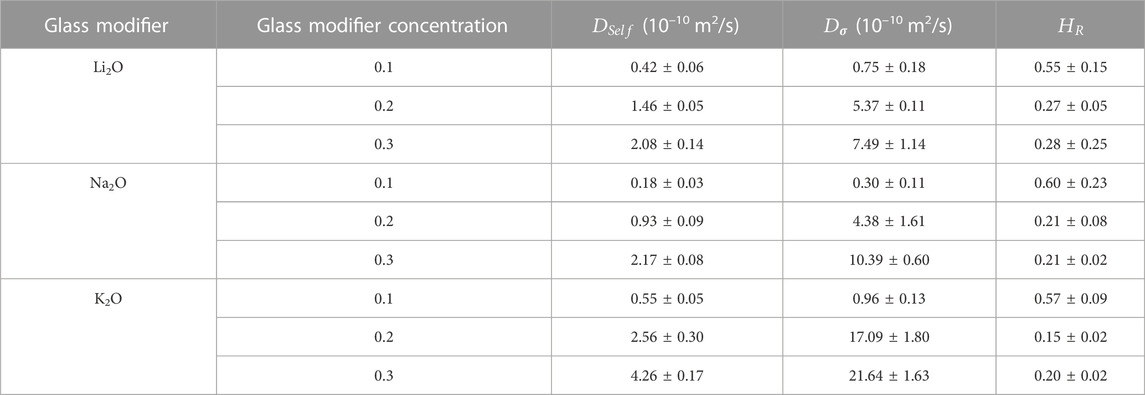
TABLE 3. Values for
Values for diffusion coefficients found in this work were comparable to laboratory diffusion coefficients for sodium in soda-lime silicate glasses (Mehrer et al., 2008), previous simulation results found by Welch et al. (2019), and thermal diffusion values found using MD in the literature (Du and Chen, 2012; Du and Cormack, 2022). This should be taken with caution because an artifact of the molecular dynamics experiment is that the glass’s temperature and the fictive temperature might be underestimated (Du and Cormack, 2022).
Values for activation energy (
where
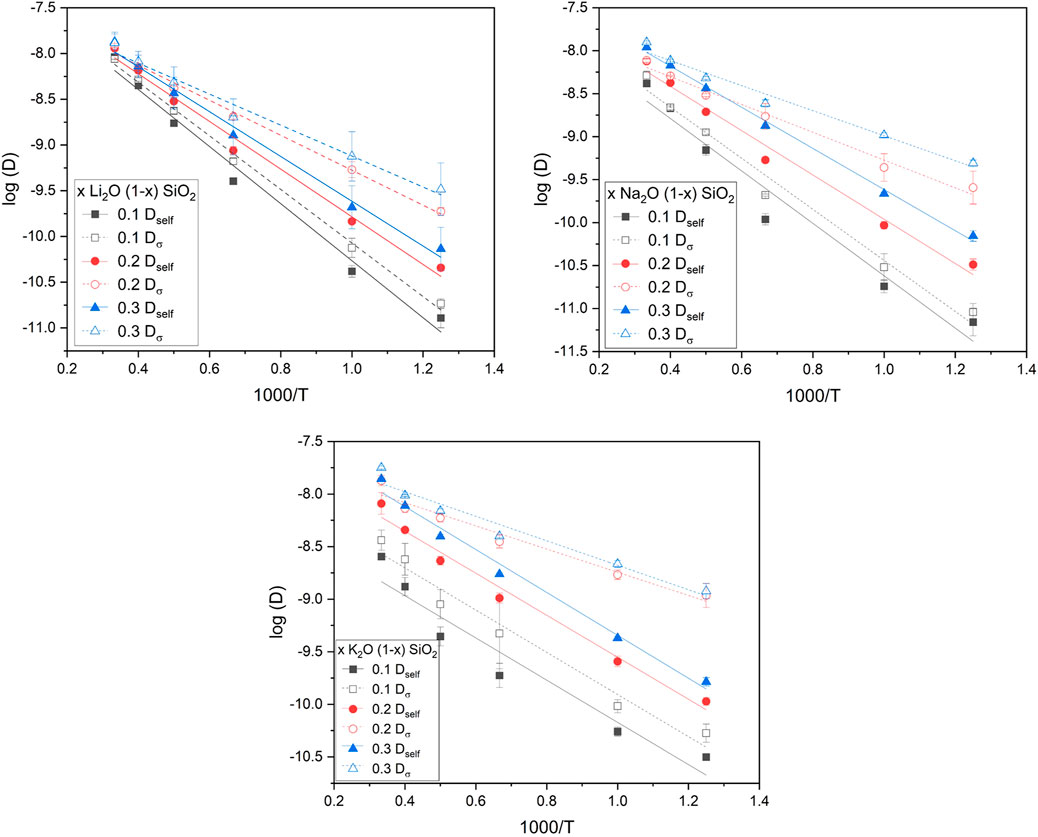
FIGURE 4. Logarithm of the diffusion coefficient as a function of the inverse of temperature for the different glasses studied in this work. The linear fitting (R2 ≥ 0.95) indicated an Arrhenius behavior and was used to obtain the activation energies for the different measurements. The error was calculated from the linear regression (OriginPro 2019).
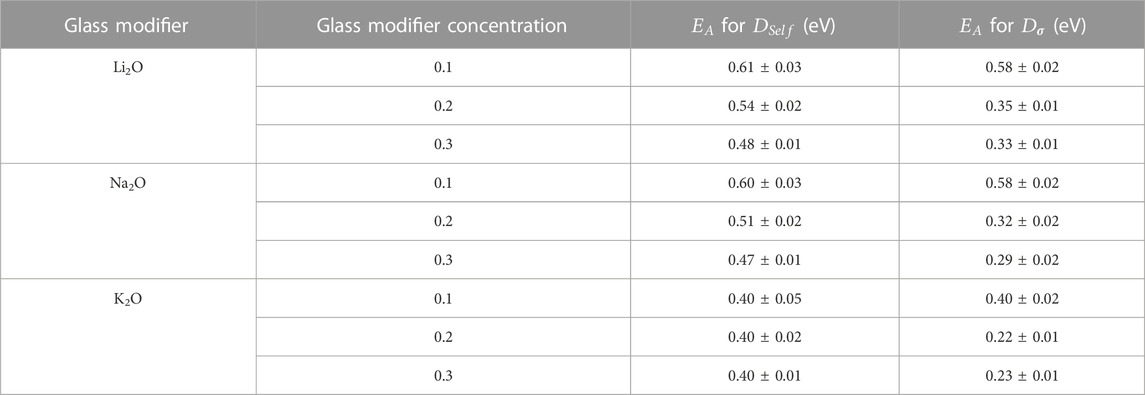
TABLE 4. Activation energies obtained using linear fits from the average values for
Activation energy values for the self-diffusion were comparable to values found in the literature for lithium silicate glasses using MD (Du and Chen, 2012).
4 Discussion
The data obtained to calculate Haven’s ratio for all glass compositions at the temperature interval range described earlier are shown in Figure 4. The results can be divided into two categories: composition dependence and temperature dependence.
4.1 Compositional dependence
The most significant differences between the three alkali-oxide glasses were their ionic radii, electronegativity, and binding energies. As shown in Table 4, K showed a large discrepancy compared to Li and Na. To illustrate this, Figure 5 shows the data for diffusion coefficients at 1000 K. This result might seem contradictory because Li is known for being the best alkali conductor of the three alkalis considered in this research (Otto and Milberg, 1968). However, it presented a diffusion coefficient smaller than K and similar to Na through the compositional range.
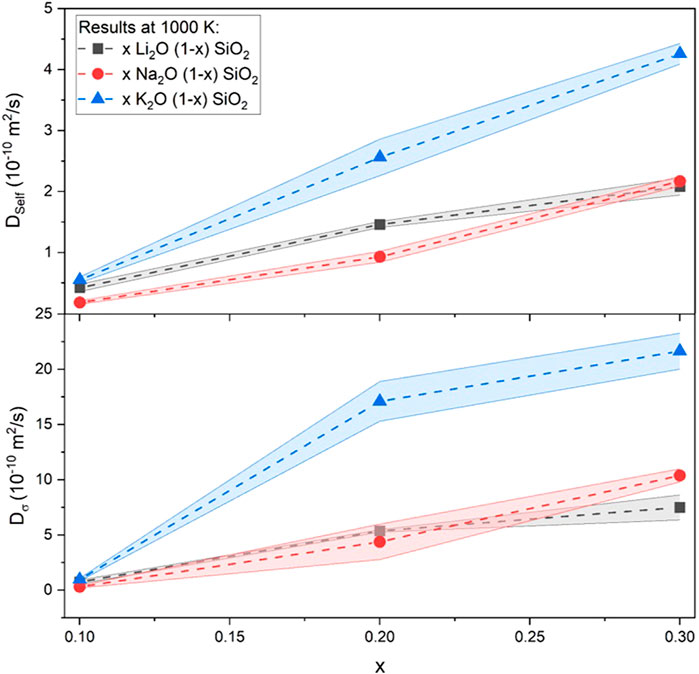
FIGURE 5. Self-diffusion and electric field induced diffusion coefficients for the different glasses included in this research at 1000 K. Results are comparable to values found in the literature (Mehrer et al., 2008; Welch et al., 2019).
Another exciting aspect that can be seen in Figure 5 was the similarity between the results found for Li and Na-containing glasses. This result disagreed with experimental results, in which the difference in conductivity was about one order of magnitude (Otto and Milberg, 1968). Ionic conductivity can be interpreted by Eq. 1 and simplified as the ionic conductivity of a given glass composition is proportional to the product of the density of effective charge carriers (n) and the diffusion coefficient (
Following this logic, the similarity between the molecular dynamic diffusion coefficients and the difference between their laboratory ionic conductivity might be justified as a difference between the number of effective charge carriers. Furthermore, this approach suggests a “weak-electrolyte” behavior by the glass, in which the dissociation equilibrium plays a more significant role in the conductivity. More on the two theories can be found elsewhere (Martin and Angell, 1986).
Independent of the reasons for differences in diffusion coefficients, HR was calculated using the diffusion coefficients obtained, as described in the Methods section. For illustration, the results obtained at 1000 K are presented in Figure 6. As can be seen, the values for low (x = 0.1) alkali concentrations were close to 0.6, and for higher concentrations (x = 0.2 and 0.3), the values were found to be between 0.1 and 0.3. This fast decrease of HR with composition is known in the literature for different oxide glass systems (Kelly et al., 1980; Thomas and Peterson, 1984; Bychkov et al., 2001) and has two possible explanations: either the diffusional mechanisms change from low concentrations to high concentrations, or the mechanisms are the same, but the ion–ion or defect–ion interactions are different (Bychkov et al., 2001).
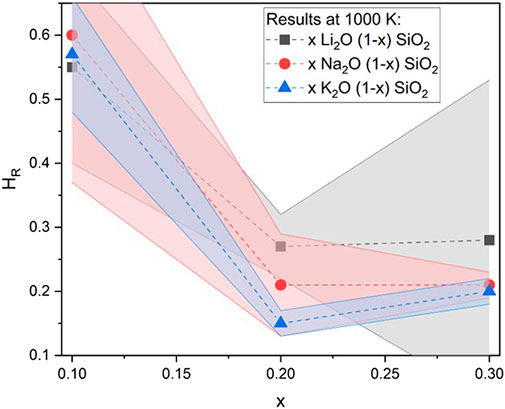
FIGURE 6. Haven’s ratio (HR) for the different glasses used in this research at 1000 K. Values of HR are higher for low concentrations (x = 0.1) and decrease with increasing alkali concentration (x = 0.2 and 0.3). Similar behavior was found for other glass systems (Isard, 1999) and crystals (Murch, 1982) in laboratory experiments.
To the best of the authors’ knowledge, there is no definitive experimental confirmation for either the weak versus strong electrolyte approach or the change of diffusional mechanisms versus the ion–ion or ion–defect interaction approach. At the same time, MD studies could help shed light on these issues and provide new information that would be impossible to obtain otherwise.
4.2 Temperature dependence
The variation of the diffusion coefficients with temperature can be seen in Figure 4. The difference between the values was more significant at lower temperatures and decreased with the increase in temperature, especially at higher alkali concentrations. This behavior was observed for all the glasses studied in this work, where the two diffusion coefficients were equal at higher temperatures for the Li and Na glasses and close to equal for the K glasses. The values were reasonable, considering that the activation energies for Dself are higher than Dσ, but should be equal when the system is in the liquid state and the ionic charge carrier is fully dissociated (Garrido et al., 2018). The difference between Dself and Dσ was more easily expressed by HR, as described in Eq. 2.
Results for HR as a function of temperature for all the glasses studied in this work are found in Figure 7. Overall, the absolute value of HR increased with the temperature, but at a lower rate for the low concentration (x = 0.1) and a faster pace for the higher concentrations (x = 0.2 and 0.3).
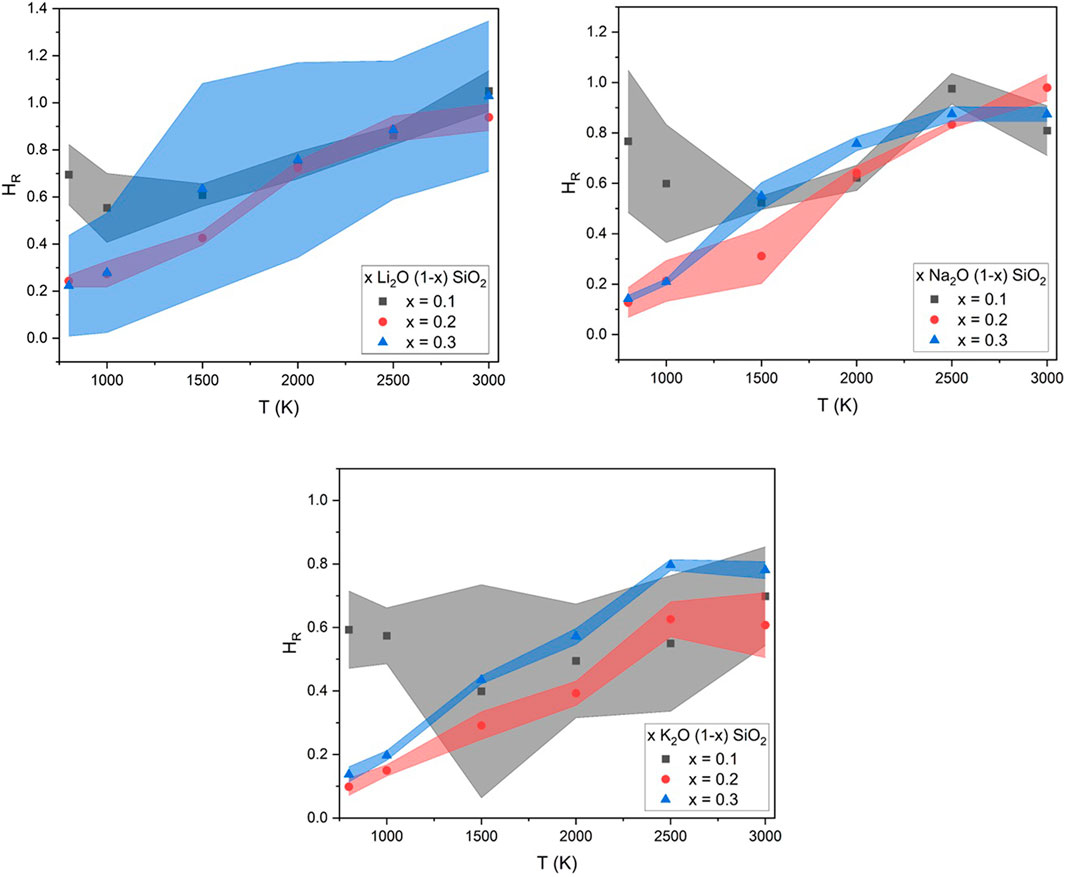
FIGURE 7. Values of Haven’s ratio found in this work using MD for the glasses x A2O (1-x) SIO2, with x = 0.1, 0.2, or 0.3, and A = Li, Na, or K.
The same small positive temperature dependence was observed by Isard and was attributed to a distribution of activation energies among the vacancies that the alkali used to diffuse (Isard, 1999). A similar dependence on temperature was observed in crystalline systems (Murch, 1982). This was not the only interpretation of the dependency of HR with temperature found in the literature, as some authors presented HR to be an indication of preferred pathways (Bychkov et al., 2001), different mechanisms for the diffusion with or without an external electric field (Haven and Verkerk, 1965), or even mechanisms of correlated motion (Kahnt, 1996). Similar to its dependency on composition, the authors believe that MD experiments can be a powerful tool to help researchers better understand HR and its meaning.
From the good agreement of both compositional and temperature dependency of Haven’s ratio on the studied glass system, the present work strongly indicated that molecular dynamics is a powerful tool to better understand this phenomenon. Many of the interpretations in the literature (Murch, 1982; Kahnt, 1996; Isard, 1999) associated the changes in the transport mechanisms with structural variations in the vicinity of the mobile ions and, consequently, a distribution of activation energies. Both structure and activation energies can be obtained using MD and will be presented and discussed by the authors in future works.
5 Conclusion
Haven’s ratio and its origin are not yet fully understood, and obtaining good and reliable results can be challenging as it requires assumptions about the nature of ionic conductivity and expensive measurements for self-diffusion. However, as a relatively new technique, molecular dynamics can be a fast, cheap, and easy addition to research, given the proper considerations. In this work, the authors have examined simple alkali silicate glasses to verify the validity of MD techniques in this context.
Due to its nature, MD simulation experiments have limitations, especially with sample size and observational times, both relevant to the ionic conductivity phenomenon. Therefore, to observe a response from the system, the temperatures and voltage field applied had to be comparably higher than in laboratory experiments. The shift to higher temperatures is well-known in the literature. Still, the higher electric field used in this work was found by trial and error, and it was enough to create a significant diffusion of the alkali studied but not affect the diffusion of the glass-former units.
Values of r2 were obtained using the LAMMPS software, and from them, values for Dself and Dσ were calculated. Their dependency on temperature, alkali concentration, and alkali nature was also studied. Results obtained in this work agree with different points found in the literature, such as the compositional dependency of HR, where the value sharply decreases at concentrations above x = 0.1 of alkali oxide, and temperature dependence, in which HR approaches unity at higher temperatures. These results are encouraging and show the possibility of using MD techniques to further investigate the diffusional properties of oxide glasses, especially when under an external electric field.
Data availability statement
The raw data supporting the conclusion of this article will be made available by the authors, without undue reservation.
Author contributions
CB designed the research. TS, LJ, SW, GK, and EW worked on the MD. TS and SW worked on the literature research, calculations, tables, and figures. All authors contributed to writing the article.
Acknowledgments
The authors would like to acknowledge the National Science Foundation for its continuous support of Coe College (NSF Grant NSF-DMR-2203142) and the support granted to this project. The authors would also like to thank J. Du for his valuable insight.
Conflict of interest
The authors declare that the research was conducted in the absence of any commercial or financial relationships that could be construed as a potential conflict of interest.
Publisher’s note
All claims expressed in this article are solely those of the authors and do not necessarily represent those of their affiliated organizations, or those of the publisher, the editors, and the reviewers. Any product that may be evaluated in this article, or claim that may be made by its manufacturer, is not guaranteed or endorsed by the publisher.
References
Atila, A., Ouaskit, S., and Hasnaoui, A. (2020). Ionic self-diffusion and the glass transition anomaly in aluminosilicates. Phys. Chem. Chem. Phys. 22, 17205–17212. doi:10.1039/d0cp02910f
Bragatto, C. B. (2020). “Electrical properties of glass,” in The world scientific reference of amorphous materials (World Scientific), Vol. 15, 199–222.
Bychkov, E., Price, D. L., and Lapp, A. (2001). Universal trend of the haven ratio in glasses: Origin and structural evidences from neutron diffraction and small-angle neutron scattering. J. Non-Crystalline Solids 293–295, 211–219. doi:10.1016/s0022-3093(01)00673-1
Calahoo, C., Xia, Y., and Zhou, R. (2020). Influence of glass network ionicity on the mixed-alkali effect. Int. J. Appl. Glass Sci. 11, 396–414. doi:10.1111/ijag.15546
Daiko, Y., Sakuda, A., Honma, T., and Hayashi, A. (2022). Ionic conduction of glasses and their potential applications. J. Ceram. Soc. Jpn. 130, 552–557. doi:10.2109/jcersj2.22035
Du, J., and Chen, C.-H. (2012). Structure and lithium ion diffusion in lithium silicate glasses and at their interfaces with lithium lanthanum titanate crystals. J. Non.-Crys. Sol. 358, 3531–3538. doi:10.1016/j.jnoncrysol.2012.05.015
Du, J., and Cormack, A. N. (2022). Atomistic simulations of glasses. John Wiley and Sons. doi:10.1002/9781118939079.fmatter
Dyre, J. C., Maass, P., Roling, B., and Sidebottom, D. L. (2009). Fundamental questions relating to ion conduction in disordered solids. Rep. Prog. Phys. 72, 046501. doi:10.1088/0034-4885/72/4/046501
Garrido, L., Aranaz, I., Gallardo, A., Garcia, C., Garcia, N., Benito, E., et al. (2018). Ionic conductivity, diffusion coefficients, and degree of dissociation in lithium electrolytes, ionic liquids, and hydrogel polyelectrolytes. J. Phys. Chem. B 122, 8301–8308. doi:10.1021/acs.jpcb.8b06424
Irvine, J. T. S., Sinclair, D. C., and West, A. R. (1990). Electroceramics: Characterization by impedance spectroscopy. Adv. Mater. 2, 132–138. doi:10.1002/adma.19900020304
Isard, J. O. (1999). The Haven ratio in glasses. J. Non-Crystalline Solids 246, 16–26. doi:10.1016/s0022-3093(99)00036-8
Jabraoui, H., Vaills, Y., Hasnaoui, A., Badawi, M., and Ouaskit, S. (2016). Effect of sodium oxide modifier on structural and elastic properties of silicate glass. J. Phys. Chem. B 120, 13193–13205. doi:10.1021/acs.jpcb.6b09664
Kahnt, H. (1996). Ionic transport in glasses. J. Non-Crystalline Solids 203, 225–231. doi:10.1016/0022-3093(96)00354-7
Kelly, J. E., Cordaro, J. F., and Tomozawa, M. (1980). Correlation effects on alkali ion diffusion in binary alkali oxide glasses. J. Non-Crystalline Solids 41, 47–55. doi:10.1016/0022-3093(80)90190-8
Martin, S. W., and Angell, C. A. (1986). Dc and ac conductivity in wide composition range Li2O-P2O5 glasses. J. Non-Crystalline Solids 83, 185–207. doi:10.1016/0022-3093(86)90067-0
Mehrer, H., Imre, Á., and Tanguep-Nijokep, E. (2008). Diffusion and ionic conduction in oxide glasses. J. Phys. Conf. Ser. 106, 012001. doi:10.1088/1742-6596/106/1/012001
Murch, G. E. (1982). The haven ratio in fast ionic conductors. Solid State Ionics 7, 177–198. doi:10.1016/0167-2738(82)90050-9
Otto, K., and Milberg, M. E. (1968). Ionic conduction in alkali and thallium silicate glasses. J. Am. Ceram. Soc. 51, 326–329. doi:10.1111/j.1151-2916.1968.tb15947.x
Pedone, A., Malavasi, G., Menziani, M. C., Cormack, A. N., and Segre, U. (2006). A new self-consistent empirical interatomic potential model for oxides, silicates, and silica-based glasses. J. Phys. Chem. B 110, 11780–11795. doi:10.1021/jp0611018
Pedone, A., Malavasi, G., Menziani, M. C., Segre, U., and Cormack, A. N. (2008). Molecular dynamics studies of Stress−Strain behavior of silica glass under a tensile load. Chem. Mat. 20, 4356–4366. doi:10.1021/cm800413v
Pedone, A. (2009). Properties calculations of silica-based glasses by atomistic simulations techniques: A review. J. Phys. Chem. C 113, 20773–20784. doi:10.1021/jp9071263
Thomas, M. P., and Peterson, N. L. (1984). Electrical conductivity and tracer diffusion in sodium germanate glasses. Solid State Ionics 14, 297–307. doi:10.1016/0167-2738(84)90114-0
Welch, R. S., Wilkinson, C. J., Mauro, J. C., and Bragatto, C. B. (2019). Charge carrier mobility of alkali silicate glasses calculated by molecular dynamics. Front. Mat. 6, 121. doi:10.3389/fmats.2019.00121
Keywords: molecular dynamics, diffusion, electrical properties, Haven’s ratio, alkali silicate glasses
Citation: Salrin TC, Johnson L, White S, Kilpatrick G, Weber E and Bragatto C (2023) Using LAMMPS to shed light on Haven’s ratio: Calculation of Haven’s ratio in alkali silicate glasses using molecular dynamics. Front. Mater. 10:1123213. doi: 10.3389/fmats.2023.1123213
Received: 13 December 2022; Accepted: 06 February 2023;
Published: 17 February 2023.
Edited by:
Ashutosh Goel, Rutgers, United StatesReviewed by:
N. M. Anoop Krishnan, Indian Institute of Technology Delhi, IndiaAlfonso Pedone, University of Modena and Reggio Emilia, Italy
Copyright © 2023 Salrin, Johnson, White, Kilpatrick, Weber and Bragatto. This is an open-access article distributed under the terms of the Creative Commons Attribution License (CC BY). The use, distribution or reproduction in other forums is permitted, provided the original author(s) and the copyright owner(s) are credited and that the original publication in this journal is cited, in accordance with accepted academic practice. No use, distribution or reproduction is permitted which does not comply with these terms.
*Correspondence: Caio Bragatto, Y2JyYWdhdHRvQGNvZS5lZHU=